Pay vs Performance Disclosure - USD ($)
Dec. 31, 2024
Dec. 31, 2023
Dec. 31, 2022
| Year | Summary Compensation Table Total for PEO ($) (1) | Compensation Actually Paid to PEO ($) (1) | Average Summary Compensation Table Total for Non-PEO Named Executive Officers ($) (2) | Average Compensation Actually Paid to Non-PEO Named Executive Officers ($) (2) | Total Shareholder Return ($) (3) | Net Income ($) (4) | |||||||||||||||||||
| 2024 | $ | 683,598 | $ | 683,598 | $ | 322,917 | $ | 322,917 | $ | 6 | $ | (12.6 | ) | ||||||||||||
| 2023 | $ | 682,880 | $ | 682,880 | $ | 300,000 | $ | 300,000 | $ | 20 | $ | (24.4 | ) | ||||||||||||
| 2022 | $ | 684,829 | $ | 683,831 | $ | 301,951 | $ | 300,953 | $ | 21 | $ | (4.8 | ) | ||||||||||||
| (1) | Reflects compensation for our Chief Executive Officer, William O’Dowd, IV, who served as our Principal Executive Officer (PEO). |
| (2) | Reflects compensation for our only other Named Executive Officer (NEO), Mirta A. Negrini, in each of these years. |
| (3) | Reflects the value of an initial $100 fixed investment on December 31, 2021. |
| (4) | Reflects GAAP net loss in millions as reported in our Annual Report on Form 10-K for the relevant year. The 2023 figure has been corrected following an administrative error last year. |
To calculate “compensation actually paid” for our PEO and other NEO the following adjustments were made to Summary Compensation Table total pay.
| Adjustments | PEO | Other NEO | ||||||||||||||||||||||
| 2022 | 2023 | 2024 | 2022 | 2023 | 2024 | |||||||||||||||||||
| Summary Compensation Table Total | $ | 684,829 | $ | 682,880 | $ | 683,598 | $ | 301,951 | $ | 300,000 | $ | 322,917 | ||||||||||||
| Deduction for amount reported in “Stock Awards” column of the Summary Compensation Table | $ | 1,951 | $ | 0 | $ | 0 | $ | 1,951 | $ | 0 | $ | 0 | ||||||||||||
| Addition of fair value at vesting date, of equity awards granted during the FY that vested during the FY | $ | 953 | $ | 0 | $ | 0 | $ | 953 | $ | 0 | $ | 0 | ||||||||||||
| Compensation Actually Paid | $ | 683,831 | $ | 682,880 | $ | 683,598 | $ | 300,953 | $ | 300,000 | $ | 322,917 | ||||||||||||
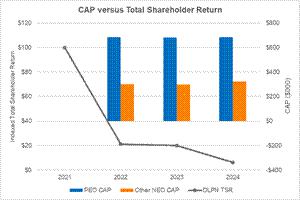
The following charts provide a clear, visual description of the relationships between compensation actually paid (CAP) to our PEO and other NEO, to aspects of our financial performance.