Performance Management |
Sep. 26, 2025 |
||||||||||||||||||||||||
---|---|---|---|---|---|---|---|---|---|---|---|---|---|---|---|---|---|---|---|---|---|---|---|---|---|
The Future Fund Long/Short ETF | |||||||||||||||||||||||||
Prospectus [Line Items] | |||||||||||||||||||||||||
Bar Chart and Performance Table [Heading] | Performance. | ||||||||||||||||||||||||
Performance Narrative [Text Block] | The bar chart and Average Annual Total Returns table illustrate the variability of the Funds returns which is some indication of the risks of investing in the Fund. The bar chart shows the performance of the Fund for each full calendar year since the Funds inception. The Average Annual Total Returns table shows how the Funds average annual returns compare with those of a broad measure of market performance over time. Remember, the Funds past performance, before and after taxes, is not necessarily an indication of how the Fund will perform in the future. Updated performance information will be available at no cost by www.futurefundetf.com or by calling 877-466-7090.
|
||||||||||||||||||||||||
Performance Past Does Not Indicate Future [Text] | Remember, the Funds past performance, before and after taxes, is not necessarily an indication of how the Fund will perform in the future. | ||||||||||||||||||||||||
Performance Information Illustrates Variability of Returns [Text] | The bar chart and Average Annual Total Returns table illustrate the variability of the Funds returns which is some indication of the risks of investing in the Fund. The bar chart shows the performance of the Fund for each full calendar year since the Funds inception. | ||||||||||||||||||||||||
Bar Chart [Heading] | Annual Total Return For Calendar Years Ended December 31 | ||||||||||||||||||||||||
Bar Chart [Table] |
|
||||||||||||||||||||||||
Bar Chart Closing [Text Block] | The calendar year-to-date return for the Funds shares as of June 30, 2025 was 10.01%
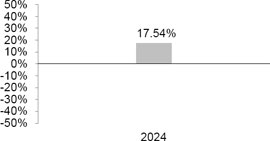
During the period shown in the bar chart, the best performance for a quarter was 11.24% (for the quarter ended March 31, 2024). The worst performance was (1.64)% (for the quarter ended September 30, 2024).
|
||||||||||||||||||||||||
Year to Date Return, Label [Optional Text] | The calendar year-to-date return for the Funds shares | ||||||||||||||||||||||||
Bar Chart, Year to Date Return | 10.01% | ||||||||||||||||||||||||
Bar Chart, Year to Date Return, Date | Jun. 30, 2025 | ||||||||||||||||||||||||
Highest Quarterly Return, Label [Optional Text] | the best performance for a quarter | ||||||||||||||||||||||||
Highest Quarterly Return | 11.24% | ||||||||||||||||||||||||
Highest Quarterly Return, Date | Mar. 31, 2024 | ||||||||||||||||||||||||
Lowest Quarterly Return, Label [Optional Text] | The worst performance | ||||||||||||||||||||||||
Lowest Quarterly Return | (1.64%) | ||||||||||||||||||||||||
Lowest Quarterly Return, Date | Sep. 30, 2024 | ||||||||||||||||||||||||
Performance Table Heading | Average Annual Total Returns for the periods ended December 31, 2024 | ||||||||||||||||||||||||
Performance Table Uses Highest Federal Rate | After-tax returns are based on the highest historical individual federal marginal income tax rates, and do not reflect the impact of state and local taxes | ||||||||||||||||||||||||
Performance Table Not Relevant to Tax Deferred | actual after-tax returns depend on an individual investors tax situation and may differ from those shown. If you own shares of the Fund in a tax-deferred account, such as an individual retirement account or a 401(k) plan, this information is not applicable to your investment. | ||||||||||||||||||||||||
Performance [Table] |
|
||||||||||||||||||||||||
Performance Table One Class of after Tax Shown [Text] | A higher after-tax return results when a capital loss occurs upon redemption and translates into an assumed tax deduction that benefits the shareholder. | ||||||||||||||||||||||||
Index No Deduction for Fees, Expenses, or Taxes [Text] | index returns do not reflect any fees, expenses or sales charges | ||||||||||||||||||||||||
Performance Table Closing [Text Block] | After-tax returns are based on the highest historical individual federal marginal income tax rates, and do not reflect the impact of state and local taxes; actual after-tax returns depend on an individual investors tax situation and may differ from those shown. If you own shares of the Fund in a tax-deferred account, such as an individual retirement account or a 401(k) plan, this information is not applicable to your investment. A higher after-tax return results when a capital loss occurs upon redemption and translates into an assumed tax deduction that benefits the shareholder.
S&P 500 Total Return Index is an unmanaged composite of 500 large capitalization companies. This index is widely used by professional investors as a performance benchmark for large-cap stocks. You cannot invest directly in an index and unmanaged index returns do not reflect any fees, expenses or sales charges. |
||||||||||||||||||||||||
Performance Availability Website Address [Text] | www.futurefundetf.com | ||||||||||||||||||||||||
Performance Availability Phone [Text] | 877-466-7090 | ||||||||||||||||||||||||
One Global ETF | |||||||||||||||||||||||||
Prospectus [Line Items] | |||||||||||||||||||||||||
Bar Chart and Performance Table [Heading] | Performance. | ||||||||||||||||||||||||
Performance Narrative [Text Block] | The bar chart and Average Annual Total Returns table illustrate the variability of the Fund’s returns which is some indication of the risks of investing in the Fund. The bar chart shows the performance of the Fund for each full calendar year since the Fund’s inception. The Average Annual Total Returns table shows how the Fund’s average annual returns compare with those of a broad measure of market performance over time. Remember, the Fund’s past performance, before and after taxes, is not necessarily an indication of how the Fund will perform in the future. Updated performance information will be available at no cost by www.futurefundetf.com or by calling 877-466-7090.
|
||||||||||||||||||||||||
Performance Past Does Not Indicate Future [Text] | Remember, the Fund’s past performance, before and after taxes, is not necessarily an indication of how the Fund will perform in the future. | ||||||||||||||||||||||||
Performance Information Illustrates Variability of Returns [Text] | The bar chart and Average Annual Total Returns table illustrate the variability of the Fund’s returns which is some indication of the risks of investing in the Fund. The bar chart shows the performance of the Fund for each full calendar year since the Fund’s inception. | ||||||||||||||||||||||||
Bar Chart [Heading] | Annual Total Return For Calendar Years Ended December 31 | ||||||||||||||||||||||||
Bar Chart [Table] |
|
||||||||||||||||||||||||
Bar Chart Closing [Text Block] | The calendar year-to-date return for the Fund’s shares as of June 30, 2025 was 9.31%.
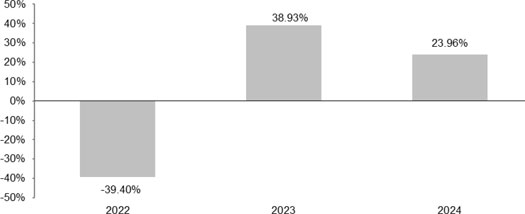
During the period shown in the bar chart, the best performance for a quarter was 16.51% (for the quarter ended March 31, 2023). The worst performance was -26.69% (for the quarter ended June 30, 2022). |
||||||||||||||||||||||||
Year to Date Return, Label [Optional Text] | The calendar year-to-date return for the Fund’s shares | ||||||||||||||||||||||||
Bar Chart, Year to Date Return | 9.31% | ||||||||||||||||||||||||
Bar Chart, Year to Date Return, Date | Jun. 30, 2025 | ||||||||||||||||||||||||
Highest Quarterly Return, Label [Optional Text] | the best performance for a quarter | ||||||||||||||||||||||||
Highest Quarterly Return | 16.51% | ||||||||||||||||||||||||
Highest Quarterly Return, Date | Mar. 31, 2023 | ||||||||||||||||||||||||
Lowest Quarterly Return, Label [Optional Text] | The worst performance | ||||||||||||||||||||||||
Lowest Quarterly Return | (26.69%) | ||||||||||||||||||||||||
Lowest Quarterly Return, Date | Jun. 30, 2022 | ||||||||||||||||||||||||
Performance Table Heading | Average Annual Total Returns for the periods ended December 31, 2024 | ||||||||||||||||||||||||
Performance Table Market Index Changed | Effective March 6, 2025, the Fund’s primary benchmark changed from the S&P 500 Total Return Index to the MSCI All Country World Index (AWCI). | ||||||||||||||||||||||||
Performance Table Uses Highest Federal Rate | After-tax returns are based on the highest historical individual federal marginal income tax rates, and do not reflect the impact of state and local taxes | ||||||||||||||||||||||||
Performance Table Not Relevant to Tax Deferred | actual after-tax returns depend on an individual investor’s tax situation and may differ from those shown. If you own shares of the Fund in a tax-deferred account, such as an individual retirement account or a 401(k) plan, this information is not applicable to your investment. | ||||||||||||||||||||||||
Performance [Table] |
|
||||||||||||||||||||||||
Performance Table One Class of after Tax Shown [Text] | A higher after-tax return results when a capital loss occurs upon redemption and translates into an assumed tax deduction that benefits the shareholder. | ||||||||||||||||||||||||
Index No Deduction for Fees, Expenses, or Taxes [Text] | index returns do not reflect any fees, expenses or sales charges | ||||||||||||||||||||||||
Performance Table Closing [Text Block] | After-tax returns are based on the highest historical individual federal marginal income tax rates, and do not reflect the impact of state and local taxes; actual after-tax returns depend on an individual investor’s tax situation and may differ from those shown. If you own shares of the Fund in a tax-deferred account, such as an individual retirement account or a 401(k) plan, this information is not applicable to your investment. A higher after-tax return results when a capital loss occurs upon redemption and translates into an assumed tax deduction that benefits the shareholder.
Effective March 6, 2025, the Fund’s primary benchmark changed from the S&P 500 Total Return Index to the MSCI All Country World Index (AWCI). The S&P 500 Total Return Index will continue to be shown for a period of one year.
The MSCI AWCI is a global equity index that measures the equity performance in both developed and emerging markets. You cannot invest directly in an index and unmanaged index returns do not reflect any fees, expenses or sales charges.
S&P 500 Total Return Index is an unmanaged composite of 500 large capitalization companies. This index is widely used by professional investors as a performance benchmark for large-cap stocks. You cannot invest directly in an index and unmanaged index returns do not reflect any fees, expenses or sales charges.
The Russell 3000 Growth Index is a market capitalization-weighted index based on the Russell 3000 index. The Russell 3000 Growth Index includes companies that display signs of above-average growth. The index is used to provide a gauge of the performance of growth stocks in the United States. |
||||||||||||||||||||||||
Performance Availability Website Address [Text] | www.futurefundetf.com | ||||||||||||||||||||||||
Performance Availability Phone [Text] | 877-466-7090 |