Performance Management
|
Sep. 26, 2025 |
| Alder Value Fund [Member] | ADLER VALUE FUND |
|
| Prospectus [Line Items] |
|
| Bar Chart and Performance Table [Heading] |
PERFORMANCE
SUMMARY
|
| Performance Narrative [Text Block] |
The
bar chart and table below provide some indication of the risks of investing in the Fund by showing changes in the Fund’s performance
from year to year and by showing how the Fund’s average annual total returns for one year, five year and since inception periods
compare with those of a broad-based securities market index and a secondary index. The bar chart and table show the performance of the
Fund’s Institutional Class. How the Fund has performed in the past (before and after taxes) is not necessarily an indication of
how the Fund will perform in the future. Updated performance information, current through the most recent month end, is available by
calling 1-800-408-4682 or by visiting the Fund’s website at www.adlervaluefund.com.
|
| Performance Past Does Not Indicate Future [Text] |
How the Fund has performed in the past (before and after taxes) is not necessarily an indication of
how the Fund will perform in the future.
|
| Performance Information Illustrates Variability of Returns [Text] |
The
bar chart and table below provide some indication of the risks of investing in the Fund by showing changes in the Fund’s performance
from year to year and by showing how the Fund’s average annual total returns for one year, five year and since inception periods
compare with those of a broad-based securities market index and a secondary index.
|
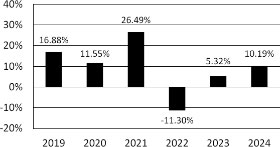
| Bar Chart [Heading] |
Calendar
Year Returns*
|
| Bar Chart [Table] |
| |
2019 |
2020 |
2021 |
2022 |
2023 |
2024 |
| * |
16.88% |
11.55% |
26.49% |
-11.30% |
5.32% |
10.19% |
| * | The
Fund’s year-to-date return through June 30, 2025 was 7.00%. |
|
| Bar Chart Closing [Text Block] |
Quarterly
Returns During This Time Period
| Highest |
25.91% |
June 30, 2020 |
| Lowest |
(30.08%) |
March 31, 2020 |
|
| Year to Date Return, Label [Optional Text] |
The
Fund’s year-to-date return
|
| Bar Chart, Year to Date Return |
7.00%
|
| Bar Chart, Year to Date Return, Date |
Jun. 30, 2025
|
| Highest Quarterly Return, Label [Optional Text] |
Highest
|
| Highest Quarterly Return |
25.91%
|
| Highest Quarterly Return, Date |
Jun. 30, 2020
|
| Lowest Quarterly Return, Label [Optional Text] |
Lowest
|
| Lowest Quarterly Return |
(30.08%)
|
| Lowest Quarterly Return, Date |
Mar. 31, 2020
|
| Performance Table Market Index Changed |
effective June 13, 2024, the S&P 500®
Index has replaced the S&P 500® Value Index as the Fund’s primary index.
|
| Performance Table Uses Highest Federal Rate |
After-tax
returns are calculated using the historical highest individual federal marginal income tax rates and do not reflect the impact of state
and local taxes
|
| Performance Table Not Relevant to Tax Deferred |
Actual after-tax returns depend on an investor’s tax situation and may differ from those shown. After-tax returns
shown are not relevant to investors who hold their shares through tax-deferred arrangements, such as a 401(k) plan or an individual retirement
account (“IRA”).
|
| Performance Table Explanation after Tax Higher |
Returns
after taxes on distributions and sale of Fund shares may be higher than before-tax returns when a net capital loss occurs upon the redemption
of Fund shares.
|
| Performance [Table] |
Average
Annual Total Returns
for Periods Ended December 31, 2024 |
One
Year |
Five
Years |
Since
Inception
August 16, 2018) |
| Return
Before Taxes |
10.19% |
7.75% |
8.14% |
| Return
After Taxes on Distributions |
9.82% |
6.60% |
7.19% |
| Return
After Taxes on Distributions and Sale of Fund Shares |
6.30% |
5.80% |
6.23% |
| S&P
500® Index* |
25.02% |
14.53% |
13.98% |
| S&P
500® Value Index* |
12.29% |
10.49% |
10.96% |
| * | Prior
to June 13, 2024, the S&P 500® Value Index was used as the Fund’s primary benchmark. In accordance with regulatory
changes requiring the Fund’s primary benchmark to represent the overall applicable market, effective June 13, 2024, the S&P 500®
Index has replaced the S&P 500® Value Index as the Fund’s primary index. A Fund’s secondary and/or
tertiary benchmark provides a means to compare the Fund’s average annual returns to a benchmark that the Fund’s investment
adviser believes is representative of the Fund’s investment universe. The S&P 500® Value Index is now the Fund’s
secondary index. |
|
| Performance Table Closing [Text Block] |
After-tax
returns are calculated using the historical highest individual federal marginal income tax rates and do not reflect the impact of state
and local taxes Actual after-tax returns depend on an investor’s tax situation and may differ from those shown. After-tax returns
shown are not relevant to investors who hold their shares through tax-deferred arrangements, such as a 401(k) plan or an individual retirement
account (“IRA”).
Returns
after taxes on distributions and sale of Fund shares may be higher than before-tax returns when a net capital loss occurs upon the redemption
of Fund shares.
|
| Performance Availability Website Address [Text] |
www.adlervaluefund.com
|
| Performance Availability Phone [Text] |
1-800-408-4682
|
| Evolutionary Tree Innovators Fund Class A Shares [Member] | EVOLUTIONARY TREE INNOVATORS FUND |
|
| Prospectus [Line Items] |
|
| Bar Chart and Performance Table [Heading] |
PERFORMANCE
SUMMARY
|
| Performance Narrative [Text Block] |
The
bar chart and table below provide some indication of the risks of investing in the Fund by showing changes in the Fund’s performance
from year to year and by showing how the Fund’s average annual total returns for the one year and since inception periods compare
with those of a broad-based securities market index. The bar chart and table show the performance of the A Class shares. How the
Fund has performed in the past (before and after taxes) is not necessarily an indication of how the Fund will perform in the future.
The bar chart figures do not include sales charges that may have been paid when investors bought and sold A Class Shares of the Fund.
If sales charges were included, the returns would be lower. Updated performance information, current through the most recent month end,
is available by calling 1-833-517-1010 or by visiting the Fund’s website at https://mutualfund.evolutionarytree.com.
|
| Performance Past Does Not Indicate Future [Text] |
How the
Fund has performed in the past (before and after taxes) is not necessarily an indication of how the Fund will perform in the future.
|
| Performance Information Illustrates Variability of Returns [Text] |
The
bar chart and table below provide some indication of the risks of investing in the Fund by showing changes in the Fund’s performance
from year to year and by showing how the Fund’s average annual total returns for the one year and since inception periods compare
with those of a broad-based securities market index.
|
| Bar Chart Does Not Reflect Sales Loads [Text] |
The bar chart figures do not include sales charges that may have been paid when investors bought and sold A Class Shares of the Fund.
If sales charges were included, the returns would be lower.
|
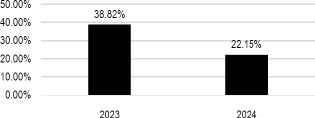
| Bar Chart [Heading] |
Calendar
Year Returns – A Class Shares*
|
| Bar Chart [Table] |
| |
2023 |
2024 |
| * |
38.82% |
22.15% |
| * | The Fund’s
year-to-date return through June 30, 2025 was 9.42%. |
|
| Bar Chart Closing [Text Block] |
| Best
Quarter |
Worst
Quarter |
| 15.98% |
(4.81%) |
| (12/31/2023) |
(9/30/2023) |
|
| Year to Date Return, Label [Optional Text] |
The Fund’s
year-to-date return
|
| Bar Chart, Year to Date Return |
9.42%
|
| Bar Chart, Year to Date Return, Date |
Jun. 30, 2025
|
| Highest Quarterly Return, Label [Optional Text] |
Best
Quarter
|
| Highest Quarterly Return |
15.98%
|
| Highest Quarterly Return, Date |
Dec. 31, 2023
|
| Lowest Quarterly Return, Label [Optional Text] |
Worst
Quarter
|
| Lowest Quarterly Return |
(4.81%)
|
| Lowest Quarterly Return, Date |
Sep. 30, 2023
|
| Performance Table Uses Highest Federal Rate |
After-tax
returns are calculated using the historical highest individual federal marginal income tax rates and do not reflect the impact of state
and local taxes.
|
| Performance Table Not Relevant to Tax Deferred |
Actual after-tax returns depend on an investor’s tax situation and may differ from those shown. After-tax returns
shown are not relevant to investors who hold their shares through tax-deferred arrangements, such as a 401(k) plan or an individual retirement
account (“IRA”).
|
| Performance Table Explanation after Tax Higher |
Returns
after taxes on distributions and sale of Fund shares may be higher than before-tax returns when a net capital loss occurs upon the redemption
of Fund shares.
|
| Performance [Table] |
Average
Annual Total Returns
For Year/Period Ended December 31, 2024 – A Class |
1
Year |
Since
Inception
(February 28, 2022) |
| Fund
Returns Before Taxes |
15.12% |
2.89% |
| Fund
Returns After Taxes on Distributions |
15.12% |
2.89% |
| Fund
Returns After Taxes on Distributions and Sale of Fund Shares |
8.95% |
2.21% |
S&P
500® Index
(reflects no deduction for fees, expenses, or taxes) |
25.02% |
12.74% |
|
| Index No Deduction for Fees, Expenses, or Taxes [Text] |
reflects no deduction for fees, expenses, or taxes
|
| Performance Table Closing [Text Block] |
After-tax
returns are calculated using the historical highest individual federal marginal income tax rates and do not reflect the impact of state
and local taxes. Actual after-tax returns depend on an investor’s tax situation and may differ from those shown. After-tax returns
shown are not relevant to investors who hold their shares through tax-deferred arrangements, such as a 401(k) plan or an individual retirement
account (“IRA”).
Returns
after taxes on distributions and sale of Fund shares may be higher than before-tax returns when a net capital loss occurs upon the redemption
of Fund shares.
|
| Performance Availability Website Address [Text] |
https://mutualfund.evolutionarytree.com
|
| Performance Availability Phone [Text] |
1-833-517-1010
|
| Evolutionary Tree Innovators Fund Class I Shares [Member] | EVOLUTIONARY TREE INNOVATORS FUND |
|
| Prospectus [Line Items] |
|
| Bar Chart and Performance Table [Heading] |
PERFORMANCE
SUMMARY
|
| Performance Narrative [Text Block] |
The
bar chart and table below provide some indication of the risks of investing in the Fund by showing changes in the Fund’s performance
from year to year and by showing how the Fund’s average annual total returns for the one year and since inception periods compare
with those of a broad-based securities market index. The bar chart and table show the performance of the I Class shares. How the Fund
has performed in the past (before and after taxes) is not necessarily an indication of how the Fund will perform in the future. Updated
performance information, current through the most recent month end, is available by calling 1-833-517-1010 or by visiting the Fund’s
website at https://mutualfund.evolutionarytree.com.
|
| Performance Past Does Not Indicate Future [Text] |
How the Fund
has performed in the past (before and after taxes) is not necessarily an indication of how the Fund will perform in the future.
|
| Performance Information Illustrates Variability of Returns [Text] |
The
bar chart and table below provide some indication of the risks of investing in the Fund by showing changes in the Fund’s performance
from year to year and by showing how the Fund’s average annual total returns for the one year and since inception periods compare
with those of a broad-based securities market index.
|
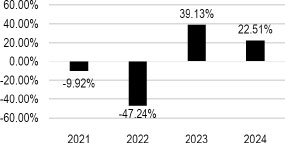
| Bar Chart [Heading] |
Calendar
Year Returns – I Class Shares *
|
| Bar Chart [Table] |
| |
2021 |
2022 |
2023 |
2024 |
| * |
-9.92% |
-47.24% |
39.13% |
22.51% |
| * | The Fund’s
year-to-date return through June 30, 2025 was 9.54%. |
|
| Bar Chart Closing [Text Block] |
| Best
Quarter |
Worst
Quarter |
| 16.05% |
(29.81%) |
| (12/31/2023) |
(6/30/2022) |
|
| Year to Date Return, Label [Optional Text] |
The Fund’s
year-to-date return
|
| Bar Chart, Year to Date Return |
9.54%
|
| Bar Chart, Year to Date Return, Date |
Jun. 30, 2025
|
| Highest Quarterly Return, Label [Optional Text] |
Best
Quarter
|
| Highest Quarterly Return |
16.05%
|
| Highest Quarterly Return, Date |
Dec. 31, 2023
|
| Lowest Quarterly Return, Label [Optional Text] |
Worst
Quarter
|
| Lowest Quarterly Return |
(29.81%)
|
| Lowest Quarterly Return, Date |
Jun. 30, 2022
|
| Performance Table Uses Highest Federal Rate |
After-tax
returns are calculated using the historical highest individual federal marginal income tax rates and do not reflect the impact of state
and local taxes.
|
| Performance Table Not Relevant to Tax Deferred |
Actual after-tax returns depend on an investor’s tax situation and may differ from those shown. After-tax returns
shown are not relevant to investors who hold their shares through tax-deferred arrangements, such as a 401(k) plan or an individual retirement
account (“IRA”).
|
| Performance Table Explanation after Tax Higher |
Returns
after taxes on distributions and sale of Fund shares may be higher than before-tax returns when a net capital loss occurs upon the redemption
of Fund shares.
|
| Performance [Table] |
Average
Annual Total Returns
For Year/Period Ended December 31, 2024 – I Class |
1
Year |
Since
Inception
(September 9, 2020) |
| Fund
Returns Before Taxes |
22.51% |
2.04% |
| Fund
Returns After Taxes on Distributions |
22.51% |
1.75% |
| Fund
Returns After Taxes on Distributions and Sale of Fund Shares |
13.33% |
1.45% |
S&P
500® Index
(reflects no deduction for fees, expenses, or taxes) |
25.02% |
15.32% |
|
| Index No Deduction for Fees, Expenses, or Taxes [Text] |
reflects no deduction for fees, expenses, or taxes
|
| Performance Table Closing [Text Block] |
After-tax
returns are calculated using the historical highest individual federal marginal income tax rates and do not reflect the impact of state
and local taxes. Actual after-tax returns depend on an investor’s tax situation and may differ from those shown. After-tax returns
shown are not relevant to investors who hold their shares through tax-deferred arrangements, such as a 401(k) plan or an individual retirement
account (“IRA”).
Returns
after taxes on distributions and sale of Fund shares may be higher than before-tax returns when a net capital loss occurs upon the redemption
of Fund shares.
|
| Performance Availability Website Address [Text] |
https://mutualfund.evolutionarytree.com
|
| Performance Availability Phone [Text] |
1-833-517-1010
|
| Wavelenght Fund [Member] | WAVELENGTH FUND |
|
| Prospectus [Line Items] |
|
| Bar Chart and Performance Table [Heading] |
PERFORMANCE
SUMMARY
|
| Performance Narrative [Text Block] |
The
bar chart and table that follow provide some indication of the risks of investing in the Fund by showing changes in the Fund’s performance
from year to year and by showing how the Fund’s average annual total returns for the one year, five year and ten year periods compare
with those of a broad-based securities market index and a secondary index. How the Fund has performed in the past (before and after taxes)
is not necessarily an indication of how the Fund will perform in the future. Updated performance information, current through the most
recent month end, is available by calling 1-866-896-9292 or by visiting the Fund’s website at www.wavelengthfunds.com.
|
| Performance Past Does Not Indicate Future [Text] |
How the Fund has performed in the past (before and after taxes)
is not necessarily an indication of how the Fund will perform in the future.
|
| Performance Information Illustrates Variability of Returns [Text] |
The
bar chart and table that follow provide some indication of the risks of investing in the Fund by showing changes in the Fund’s performance
from year to year and by showing how the Fund’s average annual total returns for the one year, five year and ten year periods compare
with those of a broad-based securities market index and a secondary index.
|
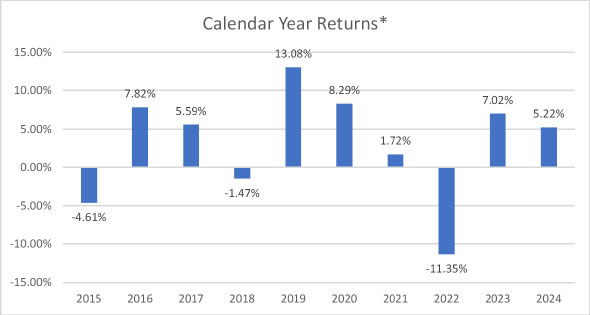
| Bar Chart [Table] |
| |
2015 |
2016 |
2017 |
2018 |
2019 |
2020 |
2021 |
2022 |
2023 |
2024 |
| * |
-4.61% |
7.82% |
5.59% |
-1.47% |
13.08% |
8.29% |
1.72% |
-11.35% |
7.02% |
5.22% |
| * | The Fund’s
year-to-date return through June 30, 2025 is 4.97%. |
|
| Bar Chart Closing [Text Block] |
Quarterly
Returns During This Time Period
| Highest |
7.20% |
(quarter
ended June 30, 2020) |
| Lowest |
(6.82%) |
(quarter
ended June 30, 2022) |
|
| Year to Date Return, Label [Optional Text] |
The Fund’s
year-to-date return
|
| Bar Chart, Year to Date Return |
4.97%
|
| Bar Chart, Year to Date Return, Date |
Jun. 30, 2025
|
| Highest Quarterly Return, Label [Optional Text] |
Highest
|
| Highest Quarterly Return |
7.20%
|
| Highest Quarterly Return, Date |
Jun. 30, 2020
|
| Lowest Quarterly Return, Label [Optional Text] |
Lowest
|
| Lowest Quarterly Return |
(6.82%)
|
| Lowest Quarterly Return, Date |
Jun. 30, 2022
|
| Performance Table Heading |
Average Annual Total Returns (for periods ended December 31, 2024)
|
| Performance Table Market Index Changed |
effective June 13, 2024, the Bloomberg
U.S. Aggregate Bond Index has replaced the S&P U.S. Treasury Bill 0-3 Month Index as the Fund’s primary index.
|
| Performance Table Uses Highest Federal Rate |
After-tax
returns are calculated using the historical highest individual federal marginal income tax rates and do not reflect the impact of state
and local taxes.
|
| Performance Table Not Relevant to Tax Deferred |
Actual after-tax returns depend on an investor’s tax situation and may differ from those shown. After-tax returns
shown are not relevant to investors who hold their shares through tax-deferred arrangements, such as a 401(k) plan or an individual retirement
account (“IRA”).
|
| Performance [Table] |
Average
Annual Total Returns
for Periods Ended December 31, 2024 |
One
Year |
Five
Year |
Ten
Years |
| Return
Before Taxes |
5.22% |
1.92% |
2.90% |
| Return
After Taxes on Distributions |
3.45% |
0.55% |
1.65% |
| Return
After Taxes on Distributions and Sale of Fund Shares |
3.16% |
0.94% |
1.73% |
| Bloomberg
U.S. Aggregate Bond Index* |
1.25% |
(0.33%) |
1.35% |
S&P
U.S. Treasury Bill 0-3 Month Index
(reflects no deduction for fees, expenses or taxes)* |
5.32% |
2.49% |
1.76% |
| * | Prior
to June 13, 2024, the S&P U.S. Treasury Bill 0-3 Month Index was used as the Fund’s primary benchmark. In accordance with regulatory
changes requiring the Fund’s primary benchmark to represent the overall applicable market, effective June 13, 2024, the Bloomberg
U.S. Aggregate Bond Index has replaced the S&P U.S. Treasury Bill 0-3 Month Index as the Fund’s primary index. A Fund’s
secondary and/or tertiary benchmark provides a means to compare the Fund’s average annual returns to a benchmark that the Fund’s
investment adviser believes is representative of the Fund’s investment universe. The S&P U.S. Treasury Bill 0-3 Month Index
is now the Fund’s secondary index. |
|
| Index No Deduction for Fees, Expenses, or Taxes [Text] |
reflects no deduction for fees, expenses or taxes
|
| Performance Table Closing [Text Block] |
After-tax
returns are calculated using the historical highest individual federal marginal income tax rates and do not reflect the impact of state
and local taxes. Actual after-tax returns depend on an investor’s tax situation and may differ from those shown. After-tax returns
shown are not relevant to investors who hold their shares through tax-deferred arrangements, such as a 401(k) plan or an individual retirement
account (“IRA”).
|
| Performance Availability Website Address [Text] |
www.wavelengthfunds.com
|
| Performance Availability Phone [Text] |
1-866-896-9292
|