The Fund seeks to achieve capital growth.
This table describes the fees and expenses that you may pay if you buy, hold, and sell shares of the Fund. You may also pay other fees, such as brokerage commissions and other fees to financial intermediaries, which are not reflected in the table and example below. You may qualify for sales charge discounts on Class A Shares if you and your family invest, or agree to invest in the future, at least $100,000 in the Fund. More information about these and other discounts is available from your financial professional and in "How to Purchase Shares" beginning on page 42 of the statutory prospectus and in Appendix A to the prospectus, titled "Intermediary-Specific Sales Charge Reductions and Waivers."
|
Class R Shares |
Class I Shares |
Class A Shares |
|||||||||||||
|
Maximum Sales Charge (Load) Imposed on Purchases (as a percentage of offering price) |
None |
None |
3.25 |
% |
|||||||||||
|
Maximum Deferred Sales Charge (Load) (as a percentage of original purchase price) |
None |
None |
1.00 |
%(1) |
|||||||||||
|
Class R Shares |
Class I Shares |
Class A Shares |
|||||||||||||
|
Management Fees |
1.10 |
% |
1.10 |
% |
1.10 |
% |
|||||||||
|
Distribution and/or Service (12b-1) Fees |
0.25 |
% |
None |
0.25 |
% |
||||||||||
|
Other Expenses: |
0.52 |
% |
0.51 |
% |
0.52 |
% |
|||||||||
|
Dividends on Short Positions and Interest Expense on Short Positions and/or Borrowings |
0.01 |
% |
0.01 |
% |
0.01 |
% |
|||||||||
|
All Remaining Other Expenses |
0.51 |
% |
0.50 |
% |
0.51 |
% |
|||||||||
|
Acquired Fund Fees and Expenses(2) |
0.01 |
% |
0.01 |
% |
0.01 |
% |
|||||||||
|
Total Annual Fund Operating Expenses |
1.88 |
% |
1.62 |
% |
1.88 |
% |
|||||||||
|
Fee Waiver(3) |
-0.17 |
% |
-0.16 |
% |
-0.17 |
% |
|||||||||
|
Total Annual Fund Operating Expenses After Fee Waiver |
1.71 |
% |
1.46 |
% |
1.71 |
% |
|||||||||
(1) A deferred sales charge of up to 1.00% may be imposed on purchases of $250,000 or more of Class A shares purchased without a front-end sales charge that are redeemed within 18 months of purchase.
(2) Acquired Fund Fees and Expenses are expenses incurred indirectly by the Fund through its ownership of shares in other investment companies.
(3) The Fund has entered into an Amended and Restated Expense Waiver and Reimbursement Agreement with the Fund's Adviser pursuant to which the Adviser has contractually agreed to waive advisory fees and/or reimburse the Funds' other expenses to the extent that total operating expenses (exclusive of taxes, interest, dividends on short positions, brokerage commissions, acquired fund fees and expenses and other costs incurred in connection with the purchase or sale of portfolio securities) so that they do not exceed 1.69% of the Fund's average daily net assets allocable to the Class R shares, 1.44% of the Fund's average daily net assets allocable to the Class I shares, and 1.69% of the Fund's average daily net assets allocable to the Class A shares. The agreement remains in effect until September 30, 2026 unless terminated at an earlier time by the Fund's Board of Trustees. The Adviser may recoup any waived amount from the Fund pursuant to the agreement, if such recoupment does not cause the Fund to exceed expense limitations in effect at the time the amounts were waived, the recoupment does not cause the Fund to exceed the current expense limitation and the recoupment is done within three years after the date of the expense waiver.
This Example is intended to help you compare the cost of investing in the Fund with the cost of investing in other mutual funds. It assumes that you invest $10,000 in the Fund for the time periods indicated and then redeem or hold all of your shares at the end of those periods. The Example also assumes that your investment has a 5% return each year and that the Fund's expenses are equal to the Total Annual Fund Operating Expenses After Fee Waiver for the first year and equal to Total Annual Fund Operating Expenses for the remaining years. Although your actual costs may be higher or lower, based on these assumptions, your costs would be:
|
1 Year |
3 Years |
5 Years |
10 Years |
||||||||||||||||
|
Class R Shares |
$ |
174 |
$ |
574 |
$ |
1,000 |
$ |
2,187 |
|||||||||||
|
Class I Shares |
$ |
149 |
$ |
495 |
$ |
866 |
$ |
1,908 |
|||||||||||
|
Class A Shares |
$ |
493 |
$ |
881 |
$ |
1,293 |
$ |
2,441 |
|||||||||||
The Fund pays transaction costs, such as commissions, when it buys and sells securities (or "turns over" its portfolio). A higher portfolio turnover rate may indicate higher transaction costs and may result in higher taxes when Fund shares are held in a taxable account. These costs, which are not reflected in annual fund operating expenses or in the Example, affect the Fund's performance. During its most recent fiscal year, the Fund's portfolio turnover rate was 195% of the average value of its portfolio.
The Fund invests in equity and debt and debt-like instruments (including high yield bonds commonly known as "junk bonds") of companies whose prices the Fund's investment adviser (the "Adviser") believes are or will be impacted by a corporate event. Specifically, the Fund employs investment strategies designed to capture price movements generated by corporate events such as mergers, acquisitions, asset sales, restructurings, refinancings, recapitalizations, reorganizations, or other special situations (referred to as "event-driven opportunities"). The Fund may invest in both U.S. and foreign securities and may invest in securities of companies of any market capitalization and in debt securities of any maturity. The Fund may also invest in derivatives, such as options and swaps. Furthermore, the Fund may invest in exchange traded funds ("ETFs"). The Adviser expects the Fund's assets to be invested in various industries; however, if, for example, a large percentage (namely, at least 50%) of corporate events taking place within the U.S. are within one industry over a given period of time, a large portion of the Fund's assets could be concentrated in that industry for that period of time.
The Fund may utilize investment strategies such as merger arbitrage, convertible arbitrage, capital structure arbitrage, and special situations in order to profit from event-driven opportunities. These investment strategies are described more fully below.
Merger Arbitrage: Merger arbitrage is a highly specialized investment approach designed to profit from the successful completion of mergers, takeovers, tender offers, leveraged buyouts, spin-offs, liquidations, and other corporate reorganizations. The most common merger arbitrage activity, and the approach the Fund generally uses, involves purchasing the shares of an announced acquisition target company at a discount to their expected value upon completion of the acquisition. The Fund may engage in selling securities short when the terms of a proposed acquisition call for the exchange of common stock and/or other securities. In such a case, the securities of the company to be acquired may be purchased and, at approximately the same time, an amount of the acquiring company's common stock and/or other securities as per the terms of the transaction may be sold short.
Convertible Arbitrage: Convertible arbitrage is a specialized strategy that seeks to profit from pricing inefficiencies between a firm's convertible securities and its underlying equity. The most common convertible arbitrage approach, and the strategy the Fund generally uses, matches a long position in the convertible security with a short position in the underlying common stock. The Fund seeks to purchase convertible securities at discounts to their expected future values and sell short shares of the underlying common stock in order to mitigate equity market movements. As stock prices rise and the convertible security becomes more equity sensitive, the Fund may sell short additional common shares in order to maintain the relationship between the convertible and the underlying common stock. As stock prices fall, the Fund will typically buy back a portion of shares which it had sold short. Positions are typically designed to earn income from coupon or dividend payments and net gains from the purchase and sale of the convertible securities' positions and the underlying common stocks.
Capital Structure Arbitrage: Capital structure arbitrage seeks to profit from relative pricing discrepancies between related debt and/or equity securities. For example, when the Fund believes that unsecured securities are overvalued in relation to senior secured securities, the Fund may purchase a senior secured security of an issuer and sell short an unsecured security of the same issuer. In this example the trade would be profitable if credit quality spreads widened or if the issuer went bankrupt and the recovery rate for the senior debt was higher than anticipated. Another example might involve the Fund purchasing one class of common stock while selling short a different class of common stock of the same issuer. It is expected that, over time, the relative mispricing of the securities may decline, at which point the position will be liquidated.
Special Situations: The special situations strategy seeks to profit by investing in securities of companies whose stock price trades significantly higher or lower from where the Adviser believes they should trade, as the result of an ongoing or anticipated corporate catalyst. Corporate catalysts may include spin-offs, split-offs, asset sales, speculative mergers and acquisitions, transformational mergers and acquisitions, Dutch tenders (whereby an offer is made to purchase securities within a given price range through an auction structure, wherein shareholders are invited to sell shares over a specific time period by specifying the lowest price within the range that they will accept), regulatory changes, recapitalizations, refinancings, corporate levering/de-levering, un-solicited hostile offers, litigation, bankruptcy processes, distressed credit, and other catalysts. The strategy invests primarily in equity securities, but may also invest in debt, warrants, debentures, convertible securities, and preferred securities. The strategy may engage in short sales and derivatives to implement trading strategies and to mitigate volatility and market risk.
The Fund generally engages in active and frequent trading of portfolio securities to achieve its principal investment objective. The Fund may sell or close out a security when the securities of the companies involved in the transaction no longer meet the Fund's expected return criteria when gauged by prevailing market prices and the relative risks of the situation. The Fund may hold a significant portion of its assets in cash, money market or similar cash management funds, or short-term investments for defensive purposes, to preserve the Fund's ability to capitalize quickly on new market opportunities, or for other reasons, such as because the Adviser has determined to obtain investment exposure through derivative instruments instead of direct cash investments. The Fund may also hold a significant amount of cash or short-term investments immediately after a period in which several transactions in which the Fund has invested close in a similar timeframe, yet before capital is redeployed to other opportunities. The Fund may, but is not required to, seek to reduce currency risk by hedging part or all of its exposure to various foreign currencies.
The Fund is non-diversified, which means that it may invest a greater portion of its assets in one or a limited number of issuers and may invest overall in a smaller number of issuers than a diversified fund.
The following information provides some indication of the risks and variability of investing in the Fund by showing how the Fund's performance has varied from year to year and by showing how the Fund's average annual returns for the past one-, five-, ten-year and since inception periods compare with those of the Standard & Poor's 500® Index, ICE BofA U.S. 3-Month Treasury Bill Index and the Bloomberg U.S. Aggregate Bond Index.
The bar chart presents the calendar year total returns of the Fund's Class R Shares before taxes. Returns shown in the bar chart do not reflect sales charges applicable to other share classes, which would reduce performance results. The performance table reflects the performance of the Fund's Class R shares before and after taxes and the Fund's Class I and Class A shares before taxes. How the Fund has performed in the past (before and after taxes) is not necessarily an indication of how the Fund will perform in the future. Performance reflects fee waivers in effect. If fee waivers were not in place, the Fund's performance would be reduced. Updated information on the Fund's performance can be obtained by visiting www.arbitragefunds.com.
|
|
Year-by-Year Annual Total Returns through December 31, 2024 – Class R Shares During the period shown in the bar chart, the highest return for a quarter was 6.38% during the quarter ended June 30, 2020 and the lowest return for a quarter was -5.89% during the quarter ended September 30, 2015. The year-to-date return of the Fund's Class R shares through June 30, 2025 is 4.18%. While the Class I shares and Class A shares would have substantially similar annual returns to the Class R shares because the shares are invested in the same portfolio of securities, the performance of Class I and Class A shares will differ from that shown since the Classes do not have the same expenses or inception dates. |
||||||
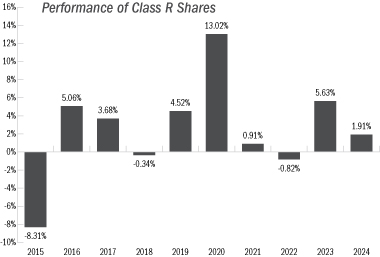
During the period shown in the bar chart, the highest return for a quarter was 6.38% during the quarter ended June 30, 2020 and the lowest return for a quarter was -5.89% during the quarter ended September 30, 2015.
The year-to-date return of the Fund's Class R shares through June 30, 2025 is 4.18%.
While the Class I shares and Class A shares would have substantially similar annual returns to the Class R shares because the shares are invested in the same portfolio of securities, the performance of Class I and Class A shares will differ from that shown since the Classes do not have the same expenses or inception dates.
The table below shows the Fund's average annual total returns for Class R shares, Class I shares, and Class A shares compared with those of the Standard & Poor's 500® Index, ICE BofA U.S. 3-Month Treasury Bill Index and the Bloomberg U.S. Aggregate Bond Index. The returns in the table below reflect the maximum applicable sales charges for the relevant share class. The table also presents the impact of taxes on the returns of the Fund's Class R shares. After-tax returns are shown for Class R shares only, and after-tax returns for Class I and Class A shares will vary. After-tax returns are calculated using the historical highest individual federal marginal income tax rates and do not reflect the impact of state and local taxes. Actual after-tax returns depend on an investor's tax situation and may differ from those shown, and after-tax returns shown are not relevant to investors who hold their Fund shares through tax-deferred arrangements, such as 401(k) plans or individual retirement accounts. Return after taxes on distributions measures the effect of taxable distributions, but assumes the underlying shares are held for the entire period. Return after taxes on distributions and sale of Fund shares shows the effect of both taxable distributions and any taxable gain or loss that would be realized if the underlying shares were purchased at the beginning and sold at the end of the period (for purposes of the calculation, it is assumed that income dividends and capital gain distributions are reinvested at net asset value and that the entire account is redeemed at the end of the period, including reinvested amounts).
|
WATER ISLAND EVENT-DRIVEN FUND |
One Year |
Five Years |
Ten Years |
Since Inception* |
|||||||||||||||
|
Class R Return Before Taxes |
1.91 |
% |
4.02 |
% |
2.39 |
% |
2.40 |
% |
|||||||||||
|
Class R Return After Taxes on Distributions |
1.91 |
% |
3.98 |
% |
2.20 |
% |
1.93 |
% |
|||||||||||
|
Class R Return After Taxes on Distributions and Sale of Fund Shares |
1.13 |
% |
3.10 |
% |
1.77 |
% |
1.67 |
% |
|||||||||||
|
Class I Return Before Taxes |
2.27 |
% |
4.31 |
% |
2.66 |
% |
2.66 |
% |
|||||||||||
|
Class A Return Before Taxes |
-1.35 |
% |
3.37 |
% |
2.07 |
% |
1.98 |
% |
|||||||||||
|
Standard & Poor's 500® Index** |
25.02 |
% |
14.53 |
% |
13.10 |
% |
14.35 |
% |
|||||||||||
|
ICE BofA U.S. 3-Month Treasury Bill Index*** |
5.25 |
% |
2.46 |
% |
1.77 |
% |
1.26 |
% |
|||||||||||
|
Bloomberg U.S. Aggregate Bond Index**** |
1.25 |
% |
-0.33 |
% |
1.35 |
% |
1.95 |
% |
|||||||||||
* The inception date for Class R shares and Class I shares is October 1, 2010 and the inception date for the Class A shares is June 1, 2013. The "Since Inception" returns reflected for the Standard & Poor's 500® Index, the ICE BofA U.S. 3-Month Treasury Bill Index and the Bloomberg U.S. Aggregate Bond Index are based on the inception date for Class R shares.
** Due to new regulatory requirements, effective May 31, 2024, the Standard & Poor's 500® Index became the Fund's broad-based securities market index. The Standard & Poor's 500® Index serves as the Fund's regulatory index and provides a broad measure of market performance. The Standard and Poor's 500® Index, or simply the S&P 500, is a stock market index tracking the performance of 500 large companies listed on stock exchanges in the U.S.
*** The ICE BofA U.S. 3-Month Treasury Bill Index tracks the performance of the U.S. Treasury Bills publicly issued in the U.S. domestic market with a remaining term to final maturity of less than 3 months.
**** The Bloomberg U.S. Aggregate Bond Index is a market value-weighted index of investment grade fixed-rated debt issues, including government, corporate, asset-backed and mortgage-backed securities with a maturity of one year or more.
The indexes are calculated on a total-return basis, are unmanaged and are not available for direct investment. The indexes reflect no deduction for fees, expenses, or taxes. The indexes are not intended to, and do not, parallel the risk or investment style of the Fund's investment strategy.
In calculating the federal income taxes due on redemptions, capital gains taxes resulting from redemptions are subtracted from the redemption proceeds and the tax benefits from capital losses resulting from the redemptions are added to the redemption proceeds. Under certain circumstances, the addition of the tax benefits from capital losses resulting from redemptions may cause the Return After Taxes on Distributions and Sale of Fund Shares to be greater than the Return After Taxes on Distributions or even the Return Before Taxes.