Shareholder Report
Jul. 31, 2025
USD ($)
Holding
FUND EXPENSES
What were the fund costs for the last year?
| (based on a hypothetical $10,000 investment) | ||
| Class Name | Costs of a $10,000 investment | Costs paid as a percentage of a $10,000 investment |
| R6 | $74 | 0.71% |
MANAGEMENT'S DISCUSSION OF FUND PERFORMANCE
-
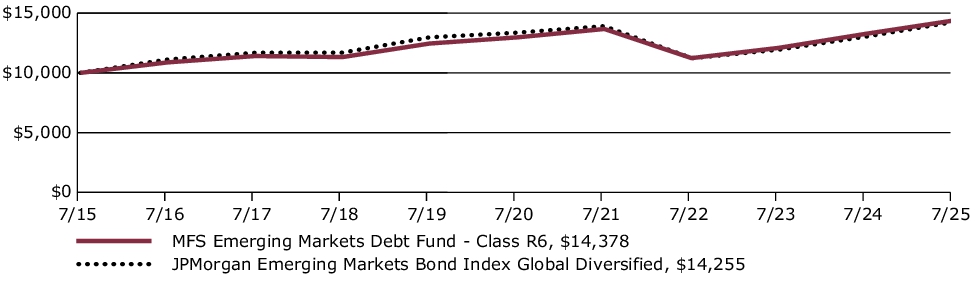
For the twelve months ended July 31, 2025, Class R6 shares of the MFS Emerging Markets Debt Fund (fund) provided a total return of 8.35%, at net asset value. This compares with a return of 9.32% for the fund’s benchmark, the JPMorgan Emerging Markets Bond Index Global Diversified.
-
Global equity markets reached record levels during the period withstanding considerable volatility amid tariffs, geopolitical conflict and high levels of uncertainty. In the US, a pro-growth tax and spending bill was signed into law while in Europe, renewed focus on defense and infrastructure spending brightened the outlook.
-
Market volatility rose toward the end of the period amid a volatile US policymaking environment as the Trump administration spent much of the April-July period finetuning its tariff strategy. Negotiations with China made progress with both sides easing export restrictions on strategic goods that cannot yet be produced domestically.
-
Moderating inflation pressures allowed many global central banks to ease monetary policy during the period. Amid a difficult policymaking environment and slower job growth, the Federal Reserve stayed on the sidelines, awaiting greater clarity on the impact of tariffs.
-
In fixed income markets, global bond yields initially declined but later rose to levels similar to the start of the reporting year. Credit spreads generally narrowed and stayed near historical lows, despite a brief widening in April and May due to tariff concerns. US bond market volatility, measured by the Merrill Lynch Option Volatility Estimate (MOVE) Index, ended near session lows after rising around the US election and trade war.
-
Top contributors to performance relative to the JPMorgan Emerging Markets Bond Index Global Diversified:
-
Yield curve positioning and a longer duration stance contributed to relative performance as interest rates generally declined over the reporting period.
-
The fund's underweight exposure to China, Saudi Arabia and Qatar-issued bonds, and its overweight exposure to Uzbekistan-issued debt, also supported relative performance. The fund's underweight exposure to Romania and no exposure to Bahrain were also additive. Favorable bond selection within Oman and Egypt was another contributor to the fund's relative returns.
-
-
Top detractors from performance relative to the JPMorgan Emerging Markets Bond Index Global Diversified:
-
Having no exposure to defaulted credits, like Lebanon, and an underweight position in lower-rated segments of the asset class (e.g., El Salvador), detracted from relative returns. The fund's overweight country exposure to India also held back relative results. Corporate and sovereign security selection in Brazil and South Africa were additional factors that held back relative performance. The fund's exposure to US bonds, for which the benchmark has no exposure, also detracted from relative returns.
-
FUND PERFORMANCE
The fund’s past performance is not a good predictor of the fund’s future performance. The graph and table below do not reflect the deduction of taxes that a shareholder would pay on fund distributions or the redemption of fund shares. The graph and table below assume reinvestment of dividends and capital gain distributions.
Growth of a Hypothetical $10,000 Investment
This graph shows the performance of a hypothetical $10,000 investment in Class R6 over a ten year period or since inception, if shorter, in comparison to a broad measure of market performance.
Average Annual Total Returns through 7/31/25
This table shows the average annual total returns of the class of shares noted for the periods shown, both with (if any) and without sales charges. It also shows the average annual total returns of a broad measure of market performance over the same periods.
| Share Class | 1-yr | 5-yr | 10-yr |
| R6 without sales charge | 8.35% | 2.09% | 3.70% |
| Comparative Benchmark(s) | |||
| JPMorgan Emerging Markets Bond Index Global Diversified ∆ | 9.32% | 1.31% | 3.61% |
|
∆
|
Source: FactSet Research Systems Inc.
|
Visit mfs.com/perf/r6 for more recent performance information.
FUND STATISTICS AS OF 7/31/25
| Net Assets ($): | 7,388,571,766 | Average Effective Maturity (yrs): | 9.6 | |
| Total Number of Holdings: | 456 | Average Effective Duration (yrs): | 6.2 | |
| Total Management Fee ($)#: | 47,779,638 | |||
| Portfolio Turnover Rate (%): | 69 |
# Includes the effect of any management fee waivers, if applicable.
Where the fund holds derivatives, they are not included in the total number of portfolio holdings.
PORTFOLIO COMPOSITION (BASED ON TOTAL INVESTMENTS AS OF 7/31/25)
Portfolio structure
| Fixed Income | 95.9% |
| Money Market Funds | 4.1% |
Issuer country weightings
| United States | 8.5% |
| Mexico | 5.5% |
| India | 4.6% |
| Chile | 3.8% |
| Romania | 3.7% |
| Turkey | 3.5% |
| Hungary | 3.2% |
| Saudi Arabia | 3.0% |
| United Arab Emirates | 2.8% |
| Other Countries | 61.4% |
Composition including fixed income credit quality
| AA | 2.4% |
| A | 11.0% |
| BBB | 28.3% |
| BB | 30.4% |
| B | 11.5% |
| CCC | 6.8% |
| C | 0.3% |
| D | 0.2% |
| U.S. Government | 4.3% |
| Not Rated | 0.7% |
| Money Market Funds | 4.1% |
Ratings are assigned using Moody’s, Fitch, and Standard & Poor’s and applying a hierarchy: If all 3 agencies rate a security, the middle rating is assigned; if 2 agencies rate a security, the lower rating is assigned. If none of the 3 agencies rate a security, we use DBRS Morningstar. If none of the 4 agencies rate a security, we use Kroll Bond Rating Agency. Ratings are shown in the S&P and Fitch scale (e.g., AAA). All ratings are subject to change.
Ratings are assigned using Moody’s, Fitch, and Standard & Poor’s and applying a hierarchy: If all 3 agencies rate a security, the middle rating is assigned; if 2 agencies rate a security, the lower rating is assigned. If none of the 3 agencies rate a security, we use DBRS Morningstar. If none of the 4 agencies rate a security, we use Kroll Bond Rating Agency. Ratings are shown in the S&P and Fitch scale (e.g., AAA). All ratings are subject to change.
FUND EXPENSES
What were the fund costs for the last year?
| (based on a hypothetical $10,000 investment) | ||
| Class Name | Costs of a $10,000 investment | Costs paid as a percentage of a $10,000 investment |
| R4 | $85 | 0.82% |
MANAGEMENT'S DISCUSSION OF FUND PERFORMANCE
-
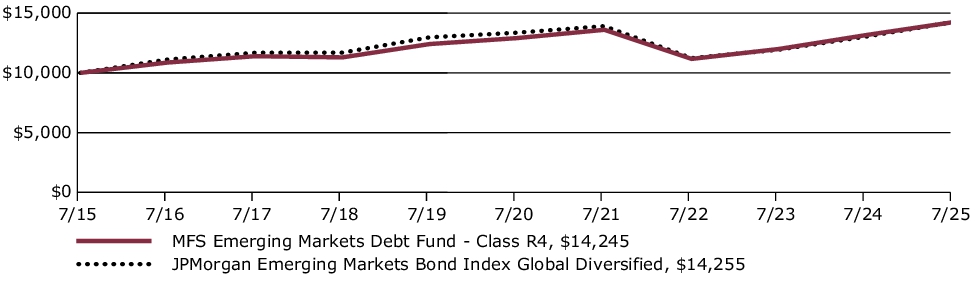
For the twelve months ended July 31, 2025, Class R4 shares of the MFS Emerging Markets Debt Fund (fund) provided a total return of 8.23%, at net asset value. This compares with a return of 9.32% for the fund’s benchmark, the JPMorgan Emerging Markets Bond Index Global Diversified.
-
Global equity markets reached record levels during the period withstanding considerable volatility amid tariffs, geopolitical conflict and high levels of uncertainty. In the US, a pro-growth tax and spending bill was signed into law while in Europe, renewed focus on defense and infrastructure spending brightened the outlook.
-
Market volatility rose toward the end of the period amid a volatile US policymaking environment as the Trump administration spent much of the April-July period finetuning its tariff strategy. Negotiations with China made progress with both sides easing export restrictions on strategic goods that cannot yet be produced domestically.
-
Moderating inflation pressures allowed many global central banks to ease monetary policy during the period. Amid a difficult policymaking environment and slower job growth, the Federal Reserve stayed on the sidelines, awaiting greater clarity on the impact of tariffs.
-
In fixed income markets, global bond yields initially declined but later rose to levels similar to the start of the reporting year. Credit spreads generally narrowed and stayed near historical lows, despite a brief widening in April and May due to tariff concerns. US bond market volatility, measured by the Merrill Lynch Option Volatility Estimate (MOVE) Index, ended near session lows after rising around the US election and trade war.
-
Top contributors to performance relative to the JPMorgan Emerging Markets Bond Index Global Diversified:
-
Yield curve positioning and a longer duration stance contributed to relative performance as interest rates generally declined over the reporting period.
-
The fund's underweight exposure to China, Saudi Arabia and Qatar-issued bonds, and its overweight exposure to Uzbekistan-issued debt, also supported relative performance. The fund's underweight exposure to Romania and no exposure to Bahrain were also additive. Favorable bond selection within Oman and Egypt was another contributor to the fund's relative returns.
-
-
Top detractors from performance relative to the JPMorgan Emerging Markets Bond Index Global Diversified:
-
Having no exposure to defaulted credits, like Lebanon, and an underweight position in lower-rated segments of the asset class (e.g., El Salvador), detracted from relative returns. The fund's overweight country exposure to India also held back relative results. Corporate and sovereign security selection in Brazil and South Africa were additional factors that held back relative performance. The fund's exposure to US bonds, for which the benchmark has no exposure, also detracted from relative returns.
-
FUND PERFORMANCE
The fund’s past performance is not a good predictor of the fund’s future performance. The graph and table below do not reflect the deduction of taxes that a shareholder would pay on fund distributions or the redemption of fund shares. The graph and table below assume reinvestment of dividends and capital gain distributions.
Growth of a Hypothetical $10,000 Investment
This graph shows the performance of a hypothetical $10,000 investment in Class R4 over a ten year period or since inception, if shorter, in comparison to a broad measure of market performance.
Average Annual Total Returns through 7/31/25
This table shows the average annual total returns of the class of shares noted for the periods shown, both with (if any) and without sales charges. It also shows the average annual total returns of a broad measure of market performance over the same periods.
| Share Class | 1-yr | 5-yr | 10-yr |
| R4 without sales charge | 8.23% | 1.99% | 3.60% |
| Comparative Benchmark(s) | |||
| JPMorgan Emerging Markets Bond Index Global Diversified ∆ | 9.32% | 1.31% | 3.61% |
|
∆
|
Source: FactSet Research Systems Inc.
|
Visit mfs.com/perf/r4 for more recent performance information.
FUND STATISTICS AS OF 7/31/25
| Net Assets ($): | 7,388,571,766 | Average Effective Maturity (yrs): | 9.6 | |
| Total Number of Holdings: | 456 | Average Effective Duration (yrs): | 6.2 | |
| Total Management Fee ($)#: | 47,779,638 | |||
| Portfolio Turnover Rate (%): | 69 |
# Includes the effect of any management fee waivers, if applicable.
Where the fund holds derivatives, they are not included in the total number of portfolio holdings.
PORTFOLIO COMPOSITION (BASED ON TOTAL INVESTMENTS AS OF 7/31/25)
Portfolio structure
| Fixed Income | 95.9% |
| Money Market Funds | 4.1% |
Issuer country weightings
| United States | 8.5% |
| Mexico | 5.5% |
| India | 4.6% |
| Chile | 3.8% |
| Romania | 3.7% |
| Turkey | 3.5% |
| Hungary | 3.2% |
| Saudi Arabia | 3.0% |
| United Arab Emirates | 2.8% |
| Other Countries | 61.4% |
Composition including fixed income credit quality
| AA | 2.4% |
| A | 11.0% |
| BBB | 28.3% |
| BB | 30.4% |
| B | 11.5% |
| CCC | 6.8% |
| C | 0.3% |
| D | 0.2% |
| U.S. Government | 4.3% |
| Not Rated | 0.7% |
| Money Market Funds | 4.1% |
Ratings are assigned using Moody’s, Fitch, and Standard & Poor’s and applying a hierarchy: If all 3 agencies rate a security, the middle rating is assigned; if 2 agencies rate a security, the lower rating is assigned. If none of the 3 agencies rate a security, we use DBRS Morningstar. If none of the 4 agencies rate a security, we use Kroll Bond Rating Agency. Ratings are shown in the S&P and Fitch scale (e.g., AAA). All ratings are subject to change.
Ratings are assigned using Moody’s, Fitch, and Standard & Poor’s and applying a hierarchy: If all 3 agencies rate a security, the middle rating is assigned; if 2 agencies rate a security, the lower rating is assigned. If none of the 3 agencies rate a security, we use DBRS Morningstar. If none of the 4 agencies rate a security, we use Kroll Bond Rating Agency. Ratings are shown in the S&P and Fitch scale (e.g., AAA). All ratings are subject to change.
FUND EXPENSES
What were the fund costs for the last year?
| (based on a hypothetical $10,000 investment) | ||
| Class Name | Costs of a $10,000 investment | Costs paid as a percentage of a $10,000 investment |
| R3 | $111 | 1.07% |
MANAGEMENT'S DISCUSSION OF FUND PERFORMANCE
-
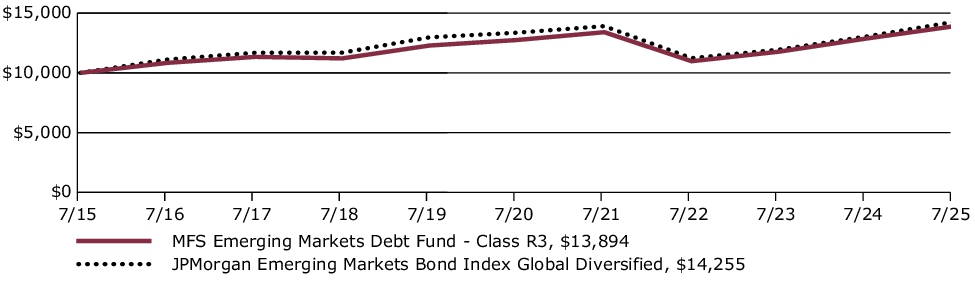
For the twelve months ended July 31, 2025, Class R3 shares of the MFS Emerging Markets Debt Fund (fund) provided a total return of 7.96%, at net asset value. This compares with a return of 9.32% for the fund’s benchmark, the JPMorgan Emerging Markets Bond Index Global Diversified.
-
Global equity markets reached record levels during the period withstanding considerable volatility amid tariffs, geopolitical conflict and high levels of uncertainty. In the US, a pro-growth tax and spending bill was signed into law while in Europe, renewed focus on defense and infrastructure spending brightened the outlook.
-
Market volatility rose toward the end of the period amid a volatile US policymaking environment as the Trump administration spent much of the April-July period finetuning its tariff strategy. Negotiations with China made progress with both sides easing export restrictions on strategic goods that cannot yet be produced domestically.
-
Moderating inflation pressures allowed many global central banks to ease monetary policy during the period. Amid a difficult policymaking environment and slower job growth, the Federal Reserve stayed on the sidelines, awaiting greater clarity on the impact of tariffs.
-
In fixed income markets, global bond yields initially declined but later rose to levels similar to the start of the reporting year. Credit spreads generally narrowed and stayed near historical lows, despite a brief widening in April and May due to tariff concerns. US bond market volatility, measured by the Merrill Lynch Option Volatility Estimate (MOVE) Index, ended near session lows after rising around the US election and trade war.
-
Top contributors to performance relative to the JPMorgan Emerging Markets Bond Index Global Diversified:
-
Yield curve positioning and a longer duration stance contributed to relative performance as interest rates generally declined over the reporting period.
-
The fund's underweight exposure to China, Saudi Arabia and Qatar-issued bonds, and its overweight exposure to Uzbekistan-issued debt, also supported relative performance. The fund's underweight exposure to Romania and no exposure to Bahrain were also additive. Favorable bond selection within Oman and Egypt was another contributor to the fund's relative returns.
-
-
Top detractors from performance relative to the JPMorgan Emerging Markets Bond Index Global Diversified:
-
Having no exposure to defaulted credits, like Lebanon, and an underweight position in lower-rated segments of the asset class (e.g., El Salvador), detracted from relative returns. The fund's overweight country exposure to India also held back relative results. Corporate and sovereign security selection in Brazil and South Africa were additional factors that held back relative performance. The fund's exposure to US bonds, for which the benchmark has no exposure, also detracted from relative returns.
-
FUND PERFORMANCE
The fund’s past performance is not a good predictor of the fund’s future performance. The graph and table below do not reflect the deduction of taxes that a shareholder would pay on fund distributions or the redemption of fund shares. The graph and table below assume reinvestment of dividends and capital gain distributions.
Growth of a Hypothetical $10,000 Investment
This graph shows the performance of a hypothetical $10,000 investment in Class R3 over a ten year period or since inception, if shorter, in comparison to a broad measure of market performance.
Average Annual Total Returns through 7/31/25
This table shows the average annual total returns of the class of shares noted for the periods shown, both with (if any) and without sales charges. It also shows the average annual total returns of a broad measure of market performance over the same periods.
| Share Class | 1-yr | 5-yr | 10-yr |
| R3 without sales charge | 7.96% | 1.73% | 3.34% |
| Comparative Benchmark(s) | |||
| JPMorgan Emerging Markets Bond Index Global Diversified ∆ | 9.32% | 1.31% | 3.61% |
|
∆
|
Source: FactSet Research Systems Inc.
|
Visit mfs.com/perf/r3 for more recent performance information.
FUND STATISTICS AS OF 7/31/25
| Net Assets ($): | 7,388,571,766 | Average Effective Maturity (yrs): | 9.6 | |
| Total Number of Holdings: | 456 | Average Effective Duration (yrs): | 6.2 | |
| Total Management Fee ($)#: | 47,779,638 | |||
| Portfolio Turnover Rate (%): | 69 |
# Includes the effect of any management fee waivers, if applicable.
Where the fund holds derivatives, they are not included in the total number of portfolio holdings.
PORTFOLIO COMPOSITION (BASED ON TOTAL INVESTMENTS AS OF 7/31/25)
Portfolio structure
| Fixed Income | 95.9% |
| Money Market Funds | 4.1% |
Issuer country weightings
| United States | 8.5% |
| Mexico | 5.5% |
| India | 4.6% |
| Chile | 3.8% |
| Romania | 3.7% |
| Turkey | 3.5% |
| Hungary | 3.2% |
| Saudi Arabia | 3.0% |
| United Arab Emirates | 2.8% |
| Other Countries | 61.4% |
Composition including fixed income credit quality
| AA | 2.4% |
| A | 11.0% |
| BBB | 28.3% |
| BB | 30.4% |
| B | 11.5% |
| CCC | 6.8% |
| C | 0.3% |
| D | 0.2% |
| U.S. Government | 4.3% |
| Not Rated | 0.7% |
| Money Market Funds | 4.1% |
Ratings are assigned using Moody’s, Fitch, and Standard & Poor’s and applying a hierarchy: If all 3 agencies rate a security, the middle rating is assigned; if 2 agencies rate a security, the lower rating is assigned. If none of the 3 agencies rate a security, we use DBRS Morningstar. If none of the 4 agencies rate a security, we use Kroll Bond Rating Agency. Ratings are shown in the S&P and Fitch scale (e.g., AAA). All ratings are subject to change.
Ratings are assigned using Moody’s, Fitch, and Standard & Poor’s and applying a hierarchy: If all 3 agencies rate a security, the middle rating is assigned; if 2 agencies rate a security, the lower rating is assigned. If none of the 3 agencies rate a security, we use DBRS Morningstar. If none of the 4 agencies rate a security, we use Kroll Bond Rating Agency. Ratings are shown in the S&P and Fitch scale (e.g., AAA). All ratings are subject to change.
FUND EXPENSES
What were the fund costs for the last year?
| (based on a hypothetical $10,000 investment) | ||
| Class Name | Costs of a $10,000 investment | Costs paid as a percentage of a $10,000 investment |
| R2 | $137 | 1.32% |
MANAGEMENT'S DISCUSSION OF FUND PERFORMANCE
-
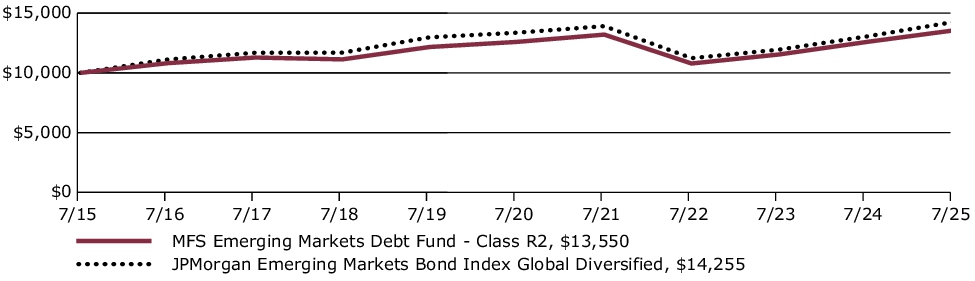
For the twelve months ended July 31, 2025, Class R2 shares of the MFS Emerging Markets Debt Fund (fund) provided a total return of 7.69%, at net asset value. This compares with a return of 9.32% for the fund’s benchmark, the JPMorgan Emerging Markets Bond Index Global Diversified.
-
Global equity markets reached record levels during the period withstanding considerable volatility amid tariffs, geopolitical conflict and high levels of uncertainty. In the US, a pro-growth tax and spending bill was signed into law while in Europe, renewed focus on defense and infrastructure spending brightened the outlook.
-
Market volatility rose toward the end of the period amid a volatile US policymaking environment as the Trump administration spent much of the April-July period finetuning its tariff strategy. Negotiations with China made progress with both sides easing export restrictions on strategic goods that cannot yet be produced domestically.
-
Moderating inflation pressures allowed many global central banks to ease monetary policy during the period. Amid a difficult policymaking environment and slower job growth, the Federal Reserve stayed on the sidelines, awaiting greater clarity on the impact of tariffs.
-
In fixed income markets, global bond yields initially declined but later rose to levels similar to the start of the reporting year. Credit spreads generally narrowed and stayed near historical lows, despite a brief widening in April and May due to tariff concerns. US bond market volatility, measured by the Merrill Lynch Option Volatility Estimate (MOVE) Index, ended near session lows after rising around the US election and trade war.
-
Top contributors to performance relative to the JPMorgan Emerging Markets Bond Index Global Diversified:
-
Yield curve positioning and a longer duration stance contributed to relative performance as interest rates generally declined over the reporting period.
-
The fund's underweight exposure to China, Saudi Arabia and Qatar-issued bonds, and its overweight exposure to Uzbekistan-issued debt, also supported relative performance. The fund's underweight exposure to Romania and no exposure to Bahrain were also additive. Favorable bond selection within Oman and Egypt was another contributor to the fund's relative returns.
-
-
Top detractors from performance relative to the JPMorgan Emerging Markets Bond Index Global Diversified:
-
Having no exposure to defaulted credits, like Lebanon, and an underweight position in lower-rated segments of the asset class (e.g., El Salvador), detracted from relative returns. The fund's overweight country exposure to India also held back relative results. Corporate and sovereign security selection in Brazil and South Africa were additional factors that held back relative performance. The fund's exposure to US bonds, for which the benchmark has no exposure, also detracted from relative returns.
-
FUND PERFORMANCE
The fund’s past performance is not a good predictor of the fund’s future performance. The graph and table below do not reflect the deduction of taxes that a shareholder would pay on fund distributions or the redemption of fund shares. The graph and table below assume reinvestment of dividends and capital gain distributions.
Growth of a Hypothetical $10,000 Investment
This graph shows the performance of a hypothetical $10,000 investment in Class R2 over a ten year period or since inception, if shorter, in comparison to a broad measure of market performance.
Average Annual Total Returns through 7/31/25
This table shows the average annual total returns of the class of shares noted for the periods shown, both with (if any) and without sales charges. It also shows the average annual total returns of a broad measure of market performance over the same periods.
| Share Class | 1-yr | 5-yr | 10-yr |
| R2 without sales charge | 7.69% | 1.48% | 3.08% |
| Comparative Benchmark(s) | |||
| JPMorgan Emerging Markets Bond Index Global Diversified ∆ | 9.32% | 1.31% | 3.61% |
|
∆
|
Source: FactSet Research Systems Inc.
|
Visit mfs.com/perf/r2 for more recent performance information.
FUND STATISTICS AS OF 7/31/25
| Net Assets ($): | 7,388,571,766 | Average Effective Maturity (yrs): | 9.6 | |
| Total Number of Holdings: | 456 | Average Effective Duration (yrs): | 6.2 | |
| Total Management Fee ($)#: | 47,779,638 | |||
| Portfolio Turnover Rate (%): | 69 |
# Includes the effect of any management fee waivers, if applicable.
Where the fund holds derivatives, they are not included in the total number of portfolio holdings.
PORTFOLIO COMPOSITION (BASED ON TOTAL INVESTMENTS AS OF 7/31/25)
Portfolio structure
| Fixed Income | 95.9% |
| Money Market Funds | 4.1% |
Issuer country weightings
| United States | 8.5% |
| Mexico | 5.5% |
| India | 4.6% |
| Chile | 3.8% |
| Romania | 3.7% |
| Turkey | 3.5% |
| Hungary | 3.2% |
| Saudi Arabia | 3.0% |
| United Arab Emirates | 2.8% |
| Other Countries | 61.4% |
Composition including fixed income credit quality
| AA | 2.4% |
| A | 11.0% |
| BBB | 28.3% |
| BB | 30.4% |
| B | 11.5% |
| CCC | 6.8% |
| C | 0.3% |
| D | 0.2% |
| U.S. Government | 4.3% |
| Not Rated | 0.7% |
| Money Market Funds | 4.1% |
Ratings are assigned using Moody’s, Fitch, and Standard & Poor’s and applying a hierarchy: If all 3 agencies rate a security, the middle rating is assigned; if 2 agencies rate a security, the lower rating is assigned. If none of the 3 agencies rate a security, we use DBRS Morningstar. If none of the 4 agencies rate a security, we use Kroll Bond Rating Agency. Ratings are shown in the S&P and Fitch scale (e.g., AAA). All ratings are subject to change.
Ratings are assigned using Moody’s, Fitch, and Standard & Poor’s and applying a hierarchy: If all 3 agencies rate a security, the middle rating is assigned; if 2 agencies rate a security, the lower rating is assigned. If none of the 3 agencies rate a security, we use DBRS Morningstar. If none of the 4 agencies rate a security, we use Kroll Bond Rating Agency. Ratings are shown in the S&P and Fitch scale (e.g., AAA). All ratings are subject to change.
FUND EXPENSES
What were the fund costs for the last year?
| (based on a hypothetical $10,000 investment) | ||
| Class Name | Costs of a $10,000 investment | Costs paid as a percentage of a $10,000 investment |
| R1 | $189 | 1.82% |
MANAGEMENT'S DISCUSSION OF FUND PERFORMANCE
-
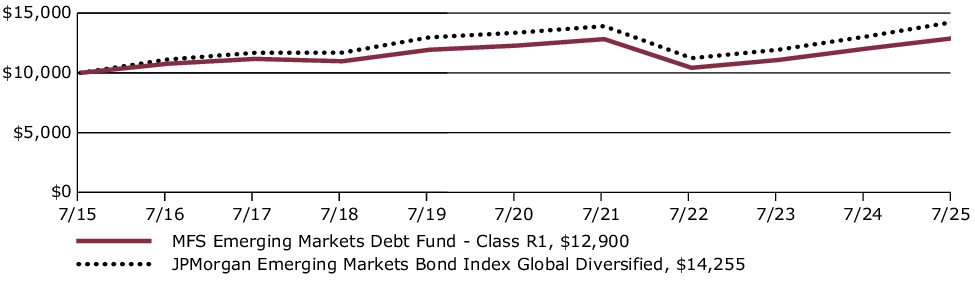
For the twelve months ended July 31, 2025, Class R1 shares of the MFS Emerging Markets Debt Fund (fund) provided a total return of 7.24%, at net asset value. This compares with a return of 9.32% for the fund’s benchmark, the JPMorgan Emerging Markets Bond Index Global Diversified.
-
Global equity markets reached record levels during the period withstanding considerable volatility amid tariffs, geopolitical conflict and high levels of uncertainty. In the US, a pro-growth tax and spending bill was signed into law while in Europe, renewed focus on defense and infrastructure spending brightened the outlook.
-
Market volatility rose toward the end of the period amid a volatile US policymaking environment as the Trump administration spent much of the April-July period finetuning its tariff strategy. Negotiations with China made progress with both sides easing export restrictions on strategic goods that cannot yet be produced domestically.
-
Moderating inflation pressures allowed many global central banks to ease monetary policy during the period. Amid a difficult policymaking environment and slower job growth, the Federal Reserve stayed on the sidelines, awaiting greater clarity on the impact of tariffs.
-
In fixed income markets, global bond yields initially declined but later rose to levels similar to the start of the reporting year. Credit spreads generally narrowed and stayed near historical lows, despite a brief widening in April and May due to tariff concerns. US bond market volatility, measured by the Merrill Lynch Option Volatility Estimate (MOVE) Index, ended near session lows after rising around the US election and trade war.
-
Top contributors to performance relative to the JPMorgan Emerging Markets Bond Index Global Diversified:
-
Yield curve positioning and a longer duration stance contributed to relative performance as interest rates generally declined over the reporting period.
-
The fund's underweight exposure to China, Saudi Arabia and Qatar-issued bonds, and its overweight exposure to Uzbekistan-issued debt, also supported relative performance. The fund's underweight exposure to Romania and no exposure to Bahrain were also additive. Favorable bond selection within Oman and Egypt was another contributor to the fund's relative returns.
-
-
Top detractors from performance relative to the JPMorgan Emerging Markets Bond Index Global Diversified:
-
Having no exposure to defaulted credits, like Lebanon, and an underweight position in lower-rated segments of the asset class (e.g., El Salvador), detracted from relative returns. The fund's overweight country exposure to India also held back relative results. Corporate and sovereign security selection in Brazil and South Africa were additional factors that held back relative performance. The fund's exposure to US bonds, for which the benchmark has no exposure, also detracted from relative returns.
-
FUND PERFORMANCE
The fund’s past performance is not a good predictor of the fund’s future performance. The graph and table below do not reflect the deduction of taxes that a shareholder would pay on fund distributions or the redemption of fund shares. The graph and table below assume reinvestment of dividends and capital gain distributions.
Growth of a Hypothetical $10,000 Investment
This graph shows the performance of a hypothetical $10,000 investment in Class R1 over a ten year period or since inception, if shorter, in comparison to a broad measure of market performance.
Average Annual Total Returns through 7/31/25
This table shows the average annual total returns of the class of shares noted for the periods shown, both with (if any) and without sales charges. It also shows the average annual total returns of a broad measure of market performance over the same periods.
| Share Class | 1-yr | 5-yr | 10-yr |
| R1 without sales charge | 7.24% | 0.99% | 2.58% |
| Comparative Benchmark(s) | |||
| JPMorgan Emerging Markets Bond Index Global Diversified ∆ | 9.32% | 1.31% | 3.61% |
|
∆
|
Source: FactSet Research Systems Inc.
|
Visit mfs.com/perf/r1 for more recent performance information.
FUND STATISTICS AS OF 7/31/25
| Net Assets ($): | 7,388,571,766 | Average Effective Maturity (yrs): | 9.6 | |
| Total Number of Holdings: | 456 | Average Effective Duration (yrs): | 6.2 | |
| Total Management Fee ($)#: | 47,779,638 | |||
| Portfolio Turnover Rate (%): | 69 |
# Includes the effect of any management fee waivers, if applicable.
Where the fund holds derivatives, they are not included in the total number of portfolio holdings.
PORTFOLIO COMPOSITION (BASED ON TOTAL INVESTMENTS AS OF 7/31/25)
Portfolio structure
| Fixed Income | 95.9% |
| Money Market Funds | 4.1% |
Issuer country weightings
| United States | 8.5% |
| Mexico | 5.5% |
| India | 4.6% |
| Chile | 3.8% |
| Romania | 3.7% |
| Turkey | 3.5% |
| Hungary | 3.2% |
| Saudi Arabia | 3.0% |
| United Arab Emirates | 2.8% |
| Other Countries | 61.4% |
Composition including fixed income credit quality
| AA | 2.4% |
| A | 11.0% |
| BBB | 28.3% |
| BB | 30.4% |
| B | 11.5% |
| CCC | 6.8% |
| C | 0.3% |
| D | 0.2% |
| U.S. Government | 4.3% |
| Not Rated | 0.7% |
| Money Market Funds | 4.1% |
Ratings are assigned using Moody’s, Fitch, and Standard & Poor’s and applying a hierarchy: If all 3 agencies rate a security, the middle rating is assigned; if 2 agencies rate a security, the lower rating is assigned. If none of the 3 agencies rate a security, we use DBRS Morningstar. If none of the 4 agencies rate a security, we use Kroll Bond Rating Agency. Ratings are shown in the S&P and Fitch scale (e.g., AAA). All ratings are subject to change.
Ratings are assigned using Moody’s, Fitch, and Standard & Poor’s and applying a hierarchy: If all 3 agencies rate a security, the middle rating is assigned; if 2 agencies rate a security, the lower rating is assigned. If none of the 3 agencies rate a security, we use DBRS Morningstar. If none of the 4 agencies rate a security, we use Kroll Bond Rating Agency. Ratings are shown in the S&P and Fitch scale (e.g., AAA). All ratings are subject to change.
FUND EXPENSES
What were the fund costs for the last year?
| (based on a hypothetical $10,000 investment) | ||
| Class Name | Costs of a $10,000 investment | Costs paid as a percentage of a $10,000 investment |
| I | $85 | 0.82% |
MANAGEMENT'S DISCUSSION OF FUND PERFORMANCE
-
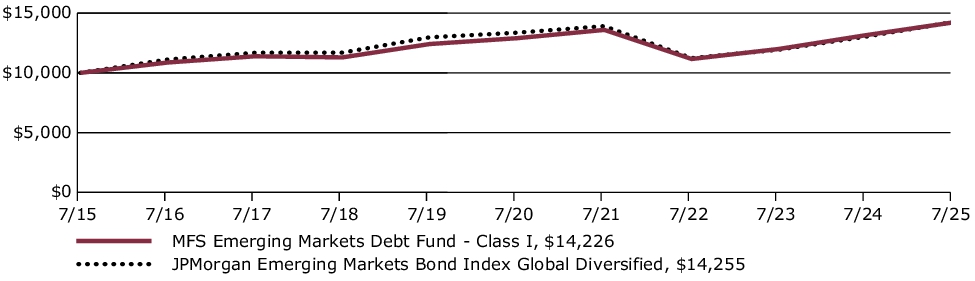
For the twelve months ended July 31, 2025, Class I shares of the MFS Emerging Markets Debt Fund (fund) provided a total return of 8.15%, at net asset value. This compares with a return of 9.32% for the fund’s benchmark, the JPMorgan Emerging Markets Bond Index Global Diversified.
-
Global equity markets reached record levels during the period withstanding considerable volatility amid tariffs, geopolitical conflict and high levels of uncertainty. In the US, a pro-growth tax and spending bill was signed into law while in Europe, renewed focus on defense and infrastructure spending brightened the outlook.
-
Market volatility rose toward the end of the period amid a volatile US policymaking environment as the Trump administration spent much of the April-July period finetuning its tariff strategy. Negotiations with China made progress with both sides easing export restrictions on strategic goods that cannot yet be produced domestically.
-
Moderating inflation pressures allowed many global central banks to ease monetary policy during the period. Amid a difficult policymaking environment and slower job growth, the Federal Reserve stayed on the sidelines, awaiting greater clarity on the impact of tariffs.
-
In fixed income markets, global bond yields initially declined but later rose to levels similar to the start of the reporting year. Credit spreads generally narrowed and stayed near historical lows, despite a brief widening in April and May due to tariff concerns. US bond market volatility, measured by the Merrill Lynch Option Volatility Estimate (MOVE) Index, ended near session lows after rising around the US election and trade war.
-
Top contributors to performance relative to the JPMorgan Emerging Markets Bond Index Global Diversified:
-
Yield curve positioning and a longer duration stance contributed to relative performance as interest rates generally declined over the reporting period.
-
The fund's underweight exposure to China, Saudi Arabia and Qatar-issued bonds, and its overweight exposure to Uzbekistan-issued debt, also supported relative performance. The fund's underweight exposure to Romania and no exposure to Bahrain were also additive. Favorable bond selection within Oman and Egypt was another contributor to the fund's relative returns.
-
-
Top detractors from performance relative to the JPMorgan Emerging Markets Bond Index Global Diversified:
-
Having no exposure to defaulted credits, like Lebanon, and an underweight position in lower-rated segments of the asset class (e.g., El Salvador), detracted from relative returns. The fund's overweight country exposure to India also held back relative results. Corporate and sovereign security selection in Brazil and South Africa were additional factors that held back relative performance. The fund's exposure to US bonds, for which the benchmark has no exposure, also detracted from relative returns.
-
FUND PERFORMANCE
The fund’s past performance is not a good predictor of the fund’s future performance. The graph and table below do not reflect the deduction of taxes that a shareholder would pay on fund distributions or the redemption of fund shares. The graph and table below assume reinvestment of dividends and capital gain distributions.
Growth of a Hypothetical $10,000 Investment
This graph shows the performance of a hypothetical $10,000 investment in Class I over a ten year period or since inception, if shorter, in comparison to a broad measure of market performance.
Average Annual Total Returns through 7/31/25
This table shows the average annual total returns of the class of shares noted for the periods shown, both with (if any) and without sales charges. It also shows the average annual total returns of a broad measure of market performance over the same periods.
| Share Class | 1-yr | 5-yr | 10-yr |
| I without sales charge | 8.15% | 1.98% | 3.59% |
| Comparative Benchmark(s) | |||
| JPMorgan Emerging Markets Bond Index Global Diversified ∆ | 9.32% | 1.31% | 3.61% |
|
∆
|
Source: FactSet Research Systems Inc.
|
Visit mfs.com/perf/i for more recent performance information.
FUND STATISTICS AS OF 7/31/25
| Net Assets ($): | 7,388,571,766 | Average Effective Maturity (yrs): | 9.6 | |
| Total Number of Holdings: | 456 | Average Effective Duration (yrs): | 6.2 | |
| Total Management Fee ($)#: | 47,779,638 | |||
| Portfolio Turnover Rate (%): | 69 |
# Includes the effect of any management fee waivers, if applicable.
Where the fund holds derivatives, they are not included in the total number of portfolio holdings.
PORTFOLIO COMPOSITION (BASED ON TOTAL INVESTMENTS AS OF 7/31/25)
Portfolio structure
| Fixed Income | 95.9% |
| Money Market Funds | 4.1% |
Issuer country weightings
| United States | 8.5% |
| Mexico | 5.5% |
| India | 4.6% |
| Chile | 3.8% |
| Romania | 3.7% |
| Turkey | 3.5% |
| Hungary | 3.2% |
| Saudi Arabia | 3.0% |
| United Arab Emirates | 2.8% |
| Other Countries | 61.4% |
Composition including fixed income credit quality
| AA | 2.4% |
| A | 11.0% |
| BBB | 28.3% |
| BB | 30.4% |
| B | 11.5% |
| CCC | 6.8% |
| C | 0.3% |
| D | 0.2% |
| U.S. Government | 4.3% |
| Not Rated | 0.7% |
| Money Market Funds | 4.1% |
Ratings are assigned using Moody’s, Fitch, and Standard & Poor’s and applying a hierarchy: If all 3 agencies rate a security, the middle rating is assigned; if 2 agencies rate a security, the lower rating is assigned. If none of the 3 agencies rate a security, we use DBRS Morningstar. If none of the 4 agencies rate a security, we use Kroll Bond Rating Agency. Ratings are shown in the S&P and Fitch scale (e.g., AAA). All ratings are subject to change.
Ratings are assigned using Moody’s, Fitch, and Standard & Poor’s and applying a hierarchy: If all 3 agencies rate a security, the middle rating is assigned; if 2 agencies rate a security, the lower rating is assigned. If none of the 3 agencies rate a security, we use DBRS Morningstar. If none of the 4 agencies rate a security, we use Kroll Bond Rating Agency. Ratings are shown in the S&P and Fitch scale (e.g., AAA). All ratings are subject to change.
FUND EXPENSES
What were the fund costs for the last year?
| (based on a hypothetical $10,000 investment) | ||
| Class Name | Costs of a $10,000 investment | Costs paid as a percentage of a $10,000 investment |
| C | $189 | 1.82% |
MANAGEMENT'S DISCUSSION OF FUND PERFORMANCE
-
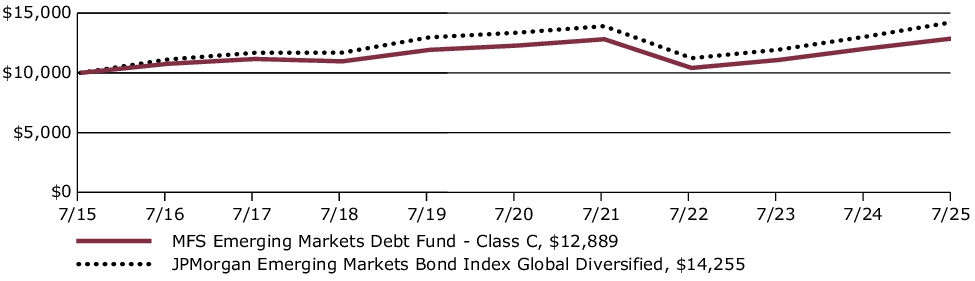
For the twelve months ended July 31, 2025, Class C shares of the MFS Emerging Markets Debt Fund (fund) provided a total return of 7.16%, at net asset value. This compares with a return of 9.32% for the fund’s benchmark, the JPMorgan Emerging Markets Bond Index Global Diversified.
-
Global equity markets reached record levels during the period withstanding considerable volatility amid tariffs, geopolitical conflict and high levels of uncertainty. In the US, a pro-growth tax and spending bill was signed into law while in Europe, renewed focus on defense and infrastructure spending brightened the outlook.
-
Market volatility rose toward the end of the period amid a volatile US policymaking environment as the Trump administration spent much of the April-July period finetuning its tariff strategy. Negotiations with China made progress with both sides easing export restrictions on strategic goods that cannot yet be produced domestically.
-
Moderating inflation pressures allowed many global central banks to ease monetary policy during the period. Amid a difficult policymaking environment and slower job growth, the Federal Reserve stayed on the sidelines, awaiting greater clarity on the impact of tariffs.
-
In fixed income markets, global bond yields initially declined but later rose to levels similar to the start of the reporting year. Credit spreads generally narrowed and stayed near historical lows, despite a brief widening in April and May due to tariff concerns. US bond market volatility, measured by the Merrill Lynch Option Volatility Estimate (MOVE) Index, ended near session lows after rising around the US election and trade war.
-
Top contributors to performance relative to the JPMorgan Emerging Markets Bond Index Global Diversified:
-
Yield curve positioning and a longer duration stance contributed to relative performance as interest rates generally declined over the reporting period.
-
The fund's underweight exposure to China, Saudi Arabia and Qatar-issued bonds, and its overweight exposure to Uzbekistan-issued debt, also supported relative performance. The fund's underweight exposure to Romania and no exposure to Bahrain were also additive. Favorable bond selection within Oman and Egypt was another contributor to the fund's relative returns.
-
-
Top detractors from performance relative to the JPMorgan Emerging Markets Bond Index Global Diversified:
-
Having no exposure to defaulted credits, like Lebanon, and an underweight position in lower-rated segments of the asset class (e.g., El Salvador), detracted from relative returns. The fund's overweight country exposure to India also held back relative results. Corporate and sovereign security selection in Brazil and South Africa were additional factors that held back relative performance. The fund's exposure to US bonds, for which the benchmark has no exposure, also detracted from relative returns.
-
FUND PERFORMANCE
The fund’s past performance is not a good predictor of the fund’s future performance. The graph and table below do not reflect the deduction of taxes that a shareholder would pay on fund distributions or the redemption of fund shares. The graph and table below assume reinvestment of dividends and capital gain distributions.
Growth of a Hypothetical $10,000 Investment
This graph shows the performance of a hypothetical $10,000 investment in Class C over a ten year period or since inception, if shorter, in comparison to a broad measure of market performance.
Average Annual Total Returns through 7/31/25
This table shows the average annual total returns of the class of shares noted for the periods shown, both with (if any) and without sales charges. It also shows the average annual total returns of a broad measure of market performance over the same periods.
| Share Class | 1-yr | 5-yr | 10-yr |
| C without sales charge | 7.16% | 0.97% | 2.57% |
| C with CDSC (1% for 12 months)× | 6.16% | 0.97% | 2.57% |
| Comparative Benchmark(s) | |||
| JPMorgan Emerging Markets Bond Index Global Diversified ∆ | 9.32% | 1.31% | 3.61% |
|
∆
|
Source: FactSet Research Systems Inc.
|
|
×
|
Assuming redemption at the end of the applicable period.
|
Visit mfs.com/perf/c for more recent performance information.
FUND STATISTICS AS OF 7/31/25
| Net Assets ($): | 7,388,571,766 | Average Effective Maturity (yrs): | 9.6 | |
| Total Number of Holdings: | 456 | Average Effective Duration (yrs): | 6.2 | |
| Total Management Fee ($)#: | 47,779,638 | |||
| Portfolio Turnover Rate (%): | 69 |
# Includes the effect of any management fee waivers, if applicable.
Where the fund holds derivatives, they are not included in the total number of portfolio holdings.
PORTFOLIO COMPOSITION (BASED ON TOTAL INVESTMENTS AS OF 7/31/25)
Portfolio structure
| Fixed Income | 95.9% |
| Money Market Funds | 4.1% |
Issuer country weightings
| United States | 8.5% |
| Mexico | 5.5% |
| India | 4.6% |
| Chile | 3.8% |
| Romania | 3.7% |
| Turkey | 3.5% |
| Hungary | 3.2% |
| Saudi Arabia | 3.0% |
| United Arab Emirates | 2.8% |
| Other Countries | 61.4% |
Composition including fixed income credit quality
| AA | 2.4% |
| A | 11.0% |
| BBB | 28.3% |
| BB | 30.4% |
| B | 11.5% |
| CCC | 6.8% |
| C | 0.3% |
| D | 0.2% |
| U.S. Government | 4.3% |
| Not Rated | 0.7% |
| Money Market Funds | 4.1% |
Ratings are assigned using Moody’s, Fitch, and Standard & Poor’s and applying a hierarchy: If all 3 agencies rate a security, the middle rating is assigned; if 2 agencies rate a security, the lower rating is assigned. If none of the 3 agencies rate a security, we use DBRS Morningstar. If none of the 4 agencies rate a security, we use Kroll Bond Rating Agency. Ratings are shown in the S&P and Fitch scale (e.g., AAA). All ratings are subject to change.
Ratings are assigned using Moody’s, Fitch, and Standard & Poor’s and applying a hierarchy: If all 3 agencies rate a security, the middle rating is assigned; if 2 agencies rate a security, the lower rating is assigned. If none of the 3 agencies rate a security, we use DBRS Morningstar. If none of the 4 agencies rate a security, we use Kroll Bond Rating Agency. Ratings are shown in the S&P and Fitch scale (e.g., AAA). All ratings are subject to change.
FUND EXPENSES
What were the fund costs for the last year?
| (based on a hypothetical $10,000 investment) | ||
| Class Name | Costs of a $10,000 investment | Costs paid as a percentage of a $10,000 investment |
| B | $189 | 1.82% |
MANAGEMENT'S DISCUSSION OF FUND PERFORMANCE
-
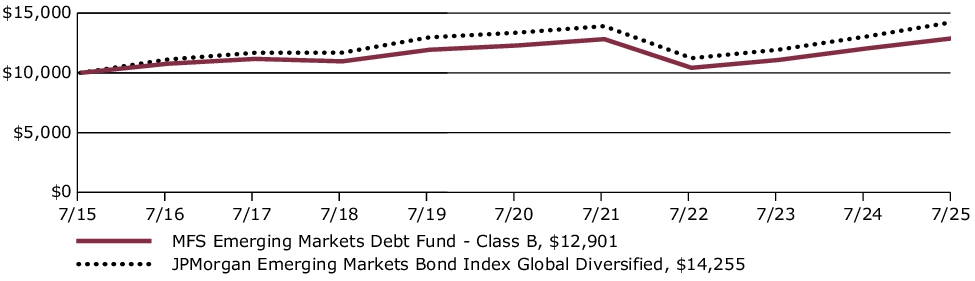
For the twelve months ended July 31, 2025, Class B shares of the MFS Emerging Markets Debt Fund (fund) provided a total return of 7.15%, at net asset value. This compares with a return of 9.32% for the fund’s benchmark, the JPMorgan Emerging Markets Bond Index Global Diversified.
-
Global equity markets reached record levels during the period withstanding considerable volatility amid tariffs, geopolitical conflict and high levels of uncertainty. In the US, a pro-growth tax and spending bill was signed into law while in Europe, renewed focus on defense and infrastructure spending brightened the outlook.
-
Market volatility rose toward the end of the period amid a volatile US policymaking environment as the Trump administration spent much of the April-July period finetuning its tariff strategy. Negotiations with China made progress with both sides easing export restrictions on strategic goods that cannot yet be produced domestically.
-
Moderating inflation pressures allowed many global central banks to ease monetary policy during the period. Amid a difficult policymaking environment and slower job growth, the Federal Reserve stayed on the sidelines, awaiting greater clarity on the impact of tariffs.
-
In fixed income markets, global bond yields initially declined but later rose to levels similar to the start of the reporting year. Credit spreads generally narrowed and stayed near historical lows, despite a brief widening in April and May due to tariff concerns. US bond market volatility, measured by the Merrill Lynch Option Volatility Estimate (MOVE) Index, ended near session lows after rising around the US election and trade war.
-
Top contributors to performance relative to the JPMorgan Emerging Markets Bond Index Global Diversified:
-
Yield curve positioning and a longer duration stance contributed to relative performance as interest rates generally declined over the reporting period.
-
The fund's underweight exposure to China, Saudi Arabia and Qatar-issued bonds, and its overweight exposure to Uzbekistan-issued debt, also supported relative performance. The fund's underweight exposure to Romania and no exposure to Bahrain were also additive. Favorable bond selection within Oman and Egypt was another contributor to the fund's relative returns.
-
-
Top detractors from performance relative to the JPMorgan Emerging Markets Bond Index Global Diversified:
-
Having no exposure to defaulted credits, like Lebanon, and an underweight position in lower-rated segments of the asset class (e.g., El Salvador), detracted from relative returns. The fund's overweight country exposure to India also held back relative results. Corporate and sovereign security selection in Brazil and South Africa were additional factors that held back relative performance. The fund's exposure to US bonds, for which the benchmark has no exposure, also detracted from relative returns.
-
FUND PERFORMANCE
The fund’s past performance is not a good predictor of the fund’s future performance. The graph and table below do not reflect the deduction of taxes that a shareholder would pay on fund distributions or the redemption of fund shares. The graph and table below assume reinvestment of dividends and capital gain distributions.
Growth of a Hypothetical $10,000 Investment
This graph shows the performance of a hypothetical $10,000 investment in Class B over a ten year period or since inception, if shorter, in comparison to a broad measure of market performance.
Average Annual Total Returns through 7/31/25
This table shows the average annual total returns of the class of shares noted for the periods shown, both with (if any) and without sales charges. It also shows the average annual total returns of a broad measure of market performance over the same periods.
| Share Class | 1-yr | 5-yr | 10-yr |
| B without sales charge | 7.15% | 0.97% | 2.58% |
| B with CDSC (declining over six years from 4% to 0%)× | 3.15% | 0.65% | 2.58% |
| Comparative Benchmark(s) | |||
| JPMorgan Emerging Markets Bond Index Global Diversified ∆ | 9.32% | 1.31% | 3.61% |
|
∆
|
Source: FactSet Research Systems Inc.
|
|
×
|
Assuming redemption at the end of the applicable period.
|
Visit mfs.com/perf/b for more recent performance information.
FUND STATISTICS AS OF 7/31/25
| Net Assets ($): | 7,388,571,766 | Average Effective Maturity (yrs): | 9.6 | |
| Total Number of Holdings: | 456 | Average Effective Duration (yrs): | 6.2 | |
| Total Management Fee ($)#: | 47,779,638 | |||
| Portfolio Turnover Rate (%): | 69 |
# Includes the effect of any management fee waivers, if applicable.
Where the fund holds derivatives, they are not included in the total number of portfolio holdings.
PORTFOLIO COMPOSITION (BASED ON TOTAL INVESTMENTS AS OF 7/31/25)
Portfolio structure
| Fixed Income | 95.9% |
| Money Market Funds | 4.1% |
Issuer country weightings
| United States | 8.5% |
| Mexico | 5.5% |
| India | 4.6% |
| Chile | 3.8% |
| Romania | 3.7% |
| Turkey | 3.5% |
| Hungary | 3.2% |
| Saudi Arabia | 3.0% |
| United Arab Emirates | 2.8% |
| Other Countries | 61.4% |
Composition including fixed income credit quality
| AA | 2.4% |
| A | 11.0% |
| BBB | 28.3% |
| BB | 30.4% |
| B | 11.5% |
| CCC | 6.8% |
| C | 0.3% |
| D | 0.2% |
| U.S. Government | 4.3% |
| Not Rated | 0.7% |
| Money Market Funds | 4.1% |
Ratings are assigned using Moody’s, Fitch, and Standard & Poor’s and applying a hierarchy: If all 3 agencies rate a security, the middle rating is assigned; if 2 agencies rate a security, the lower rating is assigned. If none of the 3 agencies rate a security, we use DBRS Morningstar. If none of the 4 agencies rate a security, we use Kroll Bond Rating Agency. Ratings are shown in the S&P and Fitch scale (e.g., AAA). All ratings are subject to change.
Ratings are assigned using Moody’s, Fitch, and Standard & Poor’s and applying a hierarchy: If all 3 agencies rate a security, the middle rating is assigned; if 2 agencies rate a security, the lower rating is assigned. If none of the 3 agencies rate a security, we use DBRS Morningstar. If none of the 4 agencies rate a security, we use Kroll Bond Rating Agency. Ratings are shown in the S&P and Fitch scale (e.g., AAA). All ratings are subject to change.
FUND EXPENSES
What were the fund costs for the last year?
| (based on a hypothetical $10,000 investment) | ||
| Class Name | Costs of a $10,000 investment | Costs paid as a percentage of a $10,000 investment |
| A | $111 | 1.07% |
MANAGEMENT'S DISCUSSION OF FUND PERFORMANCE
-
For the twelve months ended July 31, 2025, Class A shares of the MFS Emerging Markets Debt Fund (fund) provided a total return of 7.96%, at net asset value. This compares with a return of 9.32% for the fund’s benchmark, the JPMorgan Emerging Markets Bond Index Global Diversified.
-
Global equity markets reached record levels during the period withstanding considerable volatility amid tariffs, geopolitical conflict and high levels of uncertainty. In the US, a pro-growth tax and spending bill was signed into law while in Europe, renewed focus on defense and infrastructure spending brightened the outlook.
-
Market volatility rose toward the end of the period amid a volatile US policymaking environment as the Trump administration spent much of the April-July period finetuning its tariff strategy. Negotiations with China made progress with both sides easing export restrictions on strategic goods that cannot yet be produced domestically.
-
Moderating inflation pressures allowed many global central banks to ease monetary policy during the period. Amid a difficult policymaking environment and slower job growth, the Federal Reserve stayed on the sidelines, awaiting greater clarity on the impact of tariffs.
-
In fixed income markets, global bond yields initially declined but later rose to levels similar to the start of the reporting year. Credit spreads generally narrowed and stayed near historical lows, despite a brief widening in April and May due to tariff concerns. US bond market volatility, measured by the Merrill Lynch Option Volatility Estimate (MOVE) Index, ended near session lows after rising around the US election and trade war.
-
Top contributors to performance relative to the JPMorgan Emerging Markets Bond Index Global Diversified:
-
Yield curve positioning and a longer duration stance contributed to relative performance as interest rates generally declined over the reporting period.
-
The fund's underweight exposure to China, Saudi Arabia and Qatar-issued bonds, and its overweight exposure to Uzbekistan-issued debt, also supported relative performance. The fund's underweight exposure to Romania and no exposure to Bahrain were also additive. Favorable bond selection within Oman and Egypt was another contributor to the fund's relative returns.
-
-
Top detractors from performance relative to the JPMorgan Emerging Markets Bond Index Global Diversified:
-
Having no exposure to defaulted credits, like Lebanon, and an underweight position in lower-rated segments of the asset class (e.g., El Salvador), detracted from relative returns. The fund's overweight country exposure to India also held back relative results. Corporate and sovereign security selection in Brazil and South Africa were additional factors that held back relative performance. The fund's exposure to US bonds, for which the benchmark has no exposure, also detracted from relative returns.
-
FUND PERFORMANCE
The fund’s past performance is not a good predictor of the fund’s future performance. The graph and table below do not reflect the deduction of taxes that a shareholder would pay on fund distributions or the redemption of fund shares. The graph and table below assume reinvestment of dividends and capital gain distributions.
Growth of a Hypothetical $10,000 Investment
This graph shows the performance of a hypothetical $10,000 investment in Class A over a ten year period or since inception, if shorter, in comparison to a broad measure of market performance. This graph includes the deduction of the maximum applicable sales charge.
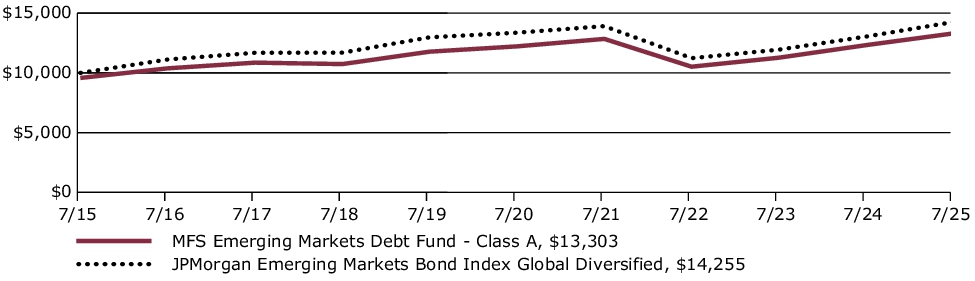
Average Annual Total Returns through 7/31/25
This table shows the average annual total returns of the class of shares noted for the periods shown, both with (if any) and without sales charges. It also shows the average annual total returns of a broad measure of market performance over the same periods.
| Share Class | 1-yr | 5-yr | 10-yr |
| A without sales charge | 7.96% | 1.72% | 3.34% |
| A with initial sales charge (4.25%) | 3.38% | 0.84% | 2.90% |
| Comparative Benchmark(s) | |||
| JPMorgan Emerging Markets Bond Index Global Diversified ∆ | 9.32% | 1.31% | 3.61% |
|
∆
|
Source: FactSet Research Systems Inc.
|
Visit mfs.com/perf/a for more recent performance information.
FUND STATISTICS AS OF 7/31/25
| Net Assets ($): | 7,388,571,766 | Average Effective Maturity (yrs): | 9.6 | |
| Total Number of Holdings: | 456 | Average Effective Duration (yrs): | 6.2 | |
| Total Management Fee ($)#: | 47,779,638 | |||
| Portfolio Turnover Rate (%): | 69 |
# Includes the effect of any management fee waivers, if applicable.
Where the fund holds derivatives, they are not included in the total number of portfolio holdings.
PORTFOLIO COMPOSITION (BASED ON TOTAL INVESTMENTS AS OF 7/31/25)
Portfolio structure
| Fixed Income | 95.9% |
| Money Market Funds | 4.1% |
Issuer country weightings
| United States | 8.5% |
| Mexico | 5.5% |
| India | 4.6% |
| Chile | 3.8% |
| Romania | 3.7% |
| Turkey | 3.5% |
| Hungary | 3.2% |
| Saudi Arabia | 3.0% |
| United Arab Emirates | 2.8% |
| Other Countries | 61.4% |
Composition including fixed income credit quality
| AA | 2.4% |
| A | 11.0% |
| BBB | 28.3% |
| BB | 30.4% |
| B | 11.5% |
| CCC | 6.8% |
| C | 0.3% |
| D | 0.2% |
| U.S. Government | 4.3% |
| Not Rated | 0.7% |
| Money Market Funds | 4.1% |
Ratings are assigned using Moody’s, Fitch, and Standard & Poor’s and applying a hierarchy: If all 3 agencies rate a security, the middle rating is assigned; if 2 agencies rate a security, the lower rating is assigned. If none of the 3 agencies rate a security, we use DBRS Morningstar. If none of the 4 agencies rate a security, we use Kroll Bond Rating Agency. Ratings are shown in the S&P and Fitch scale (e.g., AAA). All ratings are subject to change.
Ratings are assigned using Moody’s, Fitch, and Standard & Poor’s and applying a hierarchy: If all 3 agencies rate a security, the middle rating is assigned; if 2 agencies rate a security, the lower rating is assigned. If none of the 3 agencies rate a security, we use DBRS Morningstar. If none of the 4 agencies rate a security, we use Kroll Bond Rating Agency. Ratings are shown in the S&P and Fitch scale (e.g., AAA). All ratings are subject to change.
| [1] | Includes the effect of any management fee waivers, if applicable. |
| [2] | Includes the effect of any management fee waivers, if applicable. |
| [3] | Includes the effect of any management fee waivers, if applicable. |
| [4] | Includes the effect of any management fee waivers, if applicable. |
| [5] | Includes the effect of any management fee waivers, if applicable. |
| [6] | Includes the effect of any management fee waivers, if applicable. |
| [7] | Includes the effect of any management fee waivers, if applicable. |
| [8] | Includes the effect of any management fee waivers, if applicable. |
| [9] | Includes the effect of any management fee waivers, if applicable. |