Pay vs Performance Disclosure - USD ($)
Jun. 30, 2023
Nov. 19, 2023
Jun. 30, 2024
Jun. 30, 2025
Jun. 30, 2024
Jun. 30, 2023
Jun. 29, 2023
Pay Versus Performance
The following summarizes the relationship between the total compensation paid to our Chief Executive Officer (“CEO”) and our other named executive officers and our financial performance for the fiscal years shown in the table (in this discussion, our CEO is also referred to as our principal executive officer or “PEO”, and our named executive officers other than our CEO are referred to as our “Non-PEO NEOs”):
Fiscal Year | Summary Compensation Table Total for CEO #1 ($)(1)(2) | Compensation Actually Paid to CEO #1 ($)(3) | Summary Compensation Table Total for CEO #2 ($)(1)(2) | Compensation Actually Paid to CEO #2 ($)(3) | Summary Compensation Table Total CEO #3 ($)(1)(3) | Compensation Actually Paid to CEO #3 ($)(3) | Average Summary Compensation Table Total for Non-PEO NEOs ($)(1)(2) | Average Compensation Actually Paid to Non-PEO NEOs ($)(3) | Value of Initial Fixed $100 Investment Based On LTRX TSR ($)(4) | LTRX Net Income ($ Millions)(5) | ||||||||||||||||||||
2025 | N/A | N/A | N/A | N/A | 1,397,041 | 113,669 | 711,414 | 437,200 | 53.35 | (11.373) | ||||||||||||||||||||
2024 | N/A | N/A | 973,215 | 584,664 | 6,086,293 | 4,071,910 | 749,491 | 576,850 | 65.99 | (4.52) | ||||||||||||||||||||
2023 | 1,348,502 | 446,463 | 823,914 | 760,771 | N/A | N/A | 843,633 | 737,446 | 78.25 | (8.980) | ||||||||||||||||||||
(1) | During the periods covered, three executives served as CEO: (i) Paul Pickle (“CEO #1”) served from the beginning of fiscal year 2023 through his resignation on June 29, 2023; (ii) Jeremy Whitaker (“CEO #2”) served as Interim CEO for the remainder of fiscal year 2023 and during fiscal year 2024 through November 19, 2023; and (iii) Saleel Awsare (“CEO #3”) served for the remainder of fiscal year 2024 through the end of fiscal year 2025. For fiscal year 2023, our Non-PEO NEOs were Roger Holliday, former VP of Worldwide Sales, and Eric Bass, former VP of Engineering. For fiscal year 2024, our Non-PEO NEOs were Messrs. Bass and Holiday; Kurt Hoff, who served as VP of Worldwide Sales; and Mathi Gurusamy, who served as Chief Strategy Officer. For fiscal year 2025, our Non-PEO NEOs were Mr. Hoff, our Chief Revenue Officer; and Mr. Gurusamy, our Chief Product & Strategy Officer. |
(2) | For detail on the Summary Compensation Table total compensation for our CEOs for each fiscal year covered in the table, see the Summary Compensation Table as disclosed in the Company’s Proxy Statement filed with the SEC following that fiscal year. The average compensation for the Non-PEO NEOs for fiscal year 2025 was calculated from the Summary Compensation Table above. The average compensation for the Non-PEO NEOs for fiscal years 2023 and 2024 was calculated from the Summary Compensation Table as disclosed in the Company’s Proxy Statement filed with the SEC in calendar year 2023 and 2024, respectively. |
(3) | For purposes of this table, the compensation actually paid (also referred to as “CAP”) to each of our named executive officers (including, for purposes of this table, former named executive officers who are included in the Non-PEO NEO group for the applicable year) means the named executive officer’s total compensation as reflected in the Summary Compensation Table for the applicable fiscal year and adjusted for the following with respect to each named executive officer: |
• | Less the amounts reported in the “Stock Awards” and “Option Awards” columns of the Summary Compensation Table for the applicable fiscal year, |
• | Plus the fiscal year-end value of Lantronix option and stock awards granted in the covered fiscal year which were outstanding and unvested at the end of the covered fiscal year, |
• | Plus/(less) the change in value as of the end of the covered fiscal year as compared to the value at the end of the prior fiscal year for Lantronix option and stock awards which were granted in prior fiscal years and were outstanding and unvested at the end of the covered fiscal year, |
• | Plus the vesting date value of Lantronix option and stock awards which were granted and vested during the same covered fiscal year, |
• | Plus/(less) the change in value as of the vesting date as compared to the value at the end of the prior fiscal year for Lantronix option and stock awards which were granted in prior fiscal years and vested in the covered fiscal year, |
• | Less, as to any Lantronix option and stock awards which were granted in prior fiscal years and were forfeited during the covered fiscal year, the value of such awards as of the end of the prior fiscal year, |
• | Plus the dollar value of any dividends or other earnings paid during the covered fiscal year on Lantronix outstanding and unvested stock awards (no dividends or dividend equivalents are credited with respect to Lantronix options and, for other Lantronix awards, the crediting of dividend equivalents has been taken into account in determining the applicable fiscal year-end or vesting date value of the award), and |
• | Plus, as to a Lantronix option or stock award that was materially modified during the covered fiscal year, the amount by which the value of the award as of the date of the modification exceeds the value of the original award on the modification date (none of the Lantronix option or stock awards held by the named executive officers were materially modified during the fiscal years covered by the table. |
In making each of these adjustments, the “value” of an option or stock award is the fair value of the award on the applicable date determined in accordance with FASB ASC Topic 718 using the valuation assumptions we then used to calculate the fair value of our equity awards. For more information on the valuation of our equity awards, please see the notes to our financial statements that appear in our Annual Report on Form 10-K each fiscal year and the footnotes to the Summary Compensation Table that appears in our annual Proxy Statement.
The table above reflects the CAP (determined as noted above) for each CEO and, for our Non-PEO NEOs, the average of the CAPs determined for the Non-PEO NEOs for each of the fiscal years shown in the table.
The following table provides a reconciliation of the Summary Compensation Table Total to Compensation Actually Paid for our CEO #1.
Reconciliation of Summary Compensation Table Total to Compensation Actually Paid for CEO #1 | Fiscal Year 2025 ($) | Fiscal Year 2024 ($) | Fiscal Year 2023 ($) | ||||||
Summary Compensation Table Total | N/A | N/A | 1,348,502 | ||||||
Grant Date Fair Value of Option and Stock Awards Granted in Fiscal Year | N/A | N/A | (943,552) | ||||||
Fair Value at Fiscal Year-End of Outstanding and Unvested Option and Stock Awards Granted in Fiscal Year | N/A | N/A | 0 | ||||||
Change in Fair Value of Outstanding and Unvested Option and Stock Awards Granted in Prior Fiscal Years | N/A | N/A | 0 | ||||||
Fair Value at Vesting of Option and Stock Awards Granted in Fiscal Year That Vested During Fiscal Year | N/A | N/A | 0 | ||||||
Change in Fair Value as of Vesting Date of Option and Stock Awards Granted in Prior Fiscal Years For Which Applicable Vesting Conditions Were Satisfied During Fiscal Year | N/A | N/A | 464,354 | ||||||
Fair Value as of Prior Fiscal Year-End of Option and Stock Awards Granted in Prior Fiscal Years That Failed to Meet Applicable Vesting Conditions During Fiscal Year | N/A | N/A | (422,841) | ||||||
Compensation Actually Paid | N/A | N/A | 446,463 | ||||||
The following table provides a reconciliation of the Summary Compensation Table Total to Compensation Actually Paid for our CEO #2.
Reconciliation of Summary Compensation Table Total to Compensation Actually Paid for CEO #2 | Fiscal Year 2025 ($) | Fiscal Year 2024 ($) | Fiscal Year 2023 ($) | ||||||
Summary Compensation Table Total | N/A | 973,215 | 823,914 | ||||||
Grant Date Fair Value of Option and Stock Awards Granted in Fiscal Year | N/A | (534,651) | (566,130) | ||||||
Fair Value at Fiscal Year-End of Outstanding and Unvested Option and Stock Awards Granted in Fiscal Year | N/A | 434,921 | 527,422 | ||||||
Change in Fair Value of Outstanding and Unvested Option and Stock Awards Granted in Prior Fiscal Years | N/A | (91,466) | (62,759) | ||||||
Fair Value at Vesting of Option and Stock Awards Granted in Fiscal Year That Vested During Fiscal Year | N/A | 0 | 0 | ||||||
Change in Fair Value as of Vesting Date of Option and Stock Awards Granted in Prior Fiscal Years For Which Applicable Vesting Conditions Were Satisfied During Fiscal Year | N/A | (197,355) | 38,324 | ||||||
Fair Value as of Prior Fiscal Year-End of Option and Stock Awards Granted in Prior Fiscal Years That Failed to Meet Applicable Vesting Conditions During Fiscal Year | N/A | 0 | 0 | ||||||
Compensation Actually Paid | N/A | 584,664 | 760,771 | ||||||
The following table provides a reconciliation of the Summary Compensation Table Total to Compensation Actually Paid for our CEO #3.
Reconciliation of Summary Compensation Table Total to Compensation Actually Paid for CEO #3 | Fiscal Year 2025 ($) | Fiscal Year 2024 ($) | Fiscal Year 2023 ($) | ||||||
Summary Compensation Table Total | $1,397,041 | 6,086,293 | N/A | ||||||
Grant Date Fair Value of Option and Stock Awards Granted in Fiscal Year | (892,546) | (5,488,377) | N/A | ||||||
Fair Value at Fiscal Year-End of Outstanding and Unvested Option and Stock Awards Granted in Fiscal Year | 588,042 | 3,473,993 | N/A | ||||||
Change in Fair Value of Outstanding and Unvested Option and Stock Awards Granted in Prior Fiscal Years | (942,485) | 0 | N/A | ||||||
Fair Value at Vesting of Option and Stock Awards Granted in Fiscal Year That Vested During Fiscal Year | 0 | 0 | N/A | ||||||
Change in Fair Value as of Vesting Date of Option and Stock Awards Granted in Prior Fiscal Years For Which Applicable Vesting Conditions Were Satisfied During Fiscal Year | (36,382) | 0 | N/A | ||||||
Fair Value as of Prior Fiscal Year-End of Option and Stock Awards Granted in Prior Fiscal Years That Failed to Meet Applicable Vesting Conditions During Fiscal Year | 0 | 0 | N/A | ||||||
Compensation Actually Paid | 113,669 | 4,071,910 | N/A | ||||||
The following table provides a reconciliation of the average of the Summary Compensation Table Total for the Non-PEO NEOs for a fiscal year to the average of the Compensation Actually Paid for the Non-PEO NEOs for that fiscal year.
Reconciliation of Average Summary Compensation Table Total to Average Compensation Actually Paid for Non-PEO NEOs | Fiscal Year 2025 ($) | Fiscal Year 2024 ($) | Fiscal Year 2023 ($) | ||||||
Summary Compensation Table Total | 711,414 | 749,491 | 843,633 | ||||||
Grant Date Fair Value of Option and Stock Awards Granted in Fiscal Year | (334,285) | (491,971) | (664,030) | ||||||
Fair Value at Fiscal Year-End of Outstanding and Unvested Option and Stock Awards Granted in Fiscal Year | 230,272 | 425,140 | 627,287 | ||||||
Change in Fair Value of Outstanding and Unvested Option and Stock Awards Granted in Prior Fiscal Years | (134,682) | (48,850) | (38,865) | ||||||
Fair Value at Vesting of Option and Stock Awards Granted in Fiscal Year That Vested During Fiscal Year | 0 | 0 | 0 | ||||||
Change in Fair Value as of Vesting Date of Option and Stock Awards Granted in Prior Fiscal Years For Which Applicable Vesting Conditions Were Satisfied During Fiscal Year | (35,519) | (56,961) | (30,579) | ||||||
Fair Value as of Prior Fiscal Year-End of Option and Stock Awards Granted in Prior Fiscal Years That Failed to Meet Applicable Vesting Conditions During Fiscal Year | 0 | 0 | 0 | ||||||
Compensation Actually Paid | 437,200 | 576,850 | 737,446 | ||||||
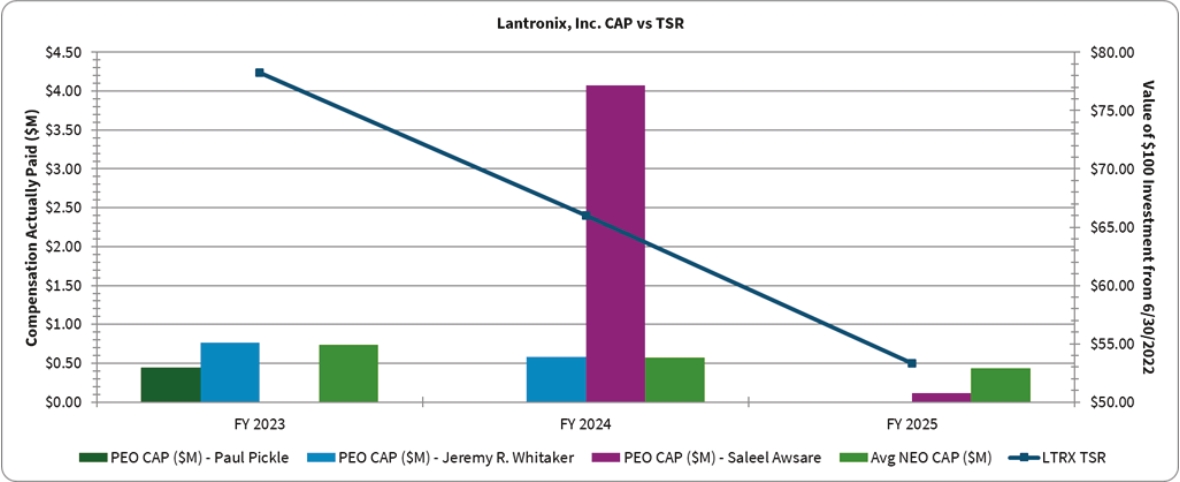
(4) | LTRX TSR represents cumulative total stockholder return on a fixed investment of $100 in the Company’s common stock for the period beginning on the last trading day of fiscal year 2022 through the end of the applicable fiscal year, and is calculated assuming the reinvestment of dividends. The following chart illustrates the CAP for our CEO and the average CAP for our Non-PEO NEOs for each of the last three fiscal years against the Company’s total stockholder return (calculated as described above) over that period of time. |
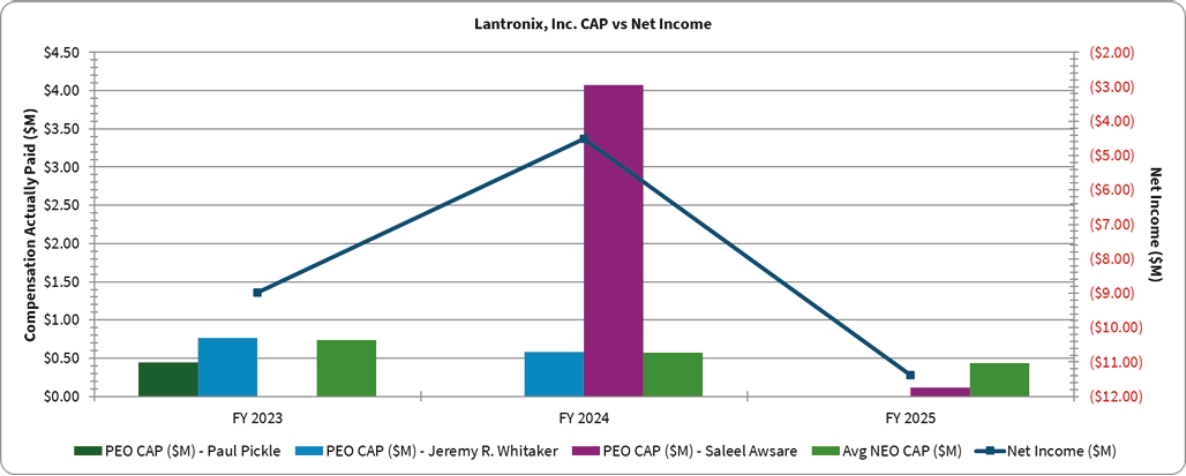
(5) | This column shows the Company’s net income for each fiscal year covered by the table. The following chart illustrates the CAP for our CEO and the average CAP for our Non-PEO NEOs for each of the last three fiscal years against the Company’s net income for each of those years. |
(1) | During the periods covered, three executives served as CEO: (i) Paul Pickle (“CEO #1”) served from the beginning of fiscal year 2023 through his resignation on June 29, 2023; (ii) Jeremy Whitaker (“CEO #2”) served as Interim CEO for the remainder of fiscal year 2023 and during fiscal year 2024 through November 19, 2023; and (iii) Saleel Awsare (“CEO #3”) served for the remainder of fiscal year 2024 through the end of fiscal year 2025. For fiscal year 2023, our Non-PEO NEOs were Roger Holliday, former VP of Worldwide Sales, and Eric Bass, former VP of Engineering. For fiscal year 2024, our Non-PEO NEOs were Messrs. Bass and Holiday; Kurt Hoff, who served as VP of Worldwide Sales; and Mathi Gurusamy, who served as Chief Strategy Officer. For fiscal year 2025, our Non-PEO NEOs were Mr. Hoff, our Chief Revenue Officer; and Mr. Gurusamy, our Chief Product & Strategy Officer. |
(3) | For purposes of this table, the compensation actually paid (also referred to as “CAP”) to each of our named executive officers (including, for purposes of this table, former named executive officers who are included in the Non-PEO NEO group for the applicable year) means the named executive officer’s total compensation as reflected in the Summary Compensation Table for the applicable fiscal year and adjusted for the following with respect to each named executive officer: |
• | Less the amounts reported in the “Stock Awards” and “Option Awards” columns of the Summary Compensation Table for the applicable fiscal year, |
• | Plus the fiscal year-end value of Lantronix option and stock awards granted in the covered fiscal year which were outstanding and unvested at the end of the covered fiscal year, |
• | Plus/(less) the change in value as of the end of the covered fiscal year as compared to the value at the end of the prior fiscal year for Lantronix option and stock awards which were granted in prior fiscal years and were outstanding and unvested at the end of the covered fiscal year, |
• | Plus the vesting date value of Lantronix option and stock awards which were granted and vested during the same covered fiscal year, |
• | Plus/(less) the change in value as of the vesting date as compared to the value at the end of the prior fiscal year for Lantronix option and stock awards which were granted in prior fiscal years and vested in the covered fiscal year, |
• | Less, as to any Lantronix option and stock awards which were granted in prior fiscal years and were forfeited during the covered fiscal year, the value of such awards as of the end of the prior fiscal year, |
• | Plus the dollar value of any dividends or other earnings paid during the covered fiscal year on Lantronix outstanding and unvested stock awards (no dividends or dividend equivalents are credited with respect to Lantronix options and, for other Lantronix awards, the crediting of dividend equivalents has been taken into account in determining the applicable fiscal year-end or vesting date value of the award), and |
• | Plus, as to a Lantronix option or stock award that was materially modified during the covered fiscal year, the amount by which the value of the award as of the date of the modification exceeds the value of the original award on the modification date (none of the Lantronix option or stock awards held by the named executive officers were materially modified during the fiscal years covered by the table. |
In making each of these adjustments, the “value” of an option or stock award is the fair value of the award on the applicable date determined in accordance with FASB ASC Topic 718 using the valuation assumptions we then used to calculate the fair value of our equity awards. For more information on the valuation of our equity awards, please see the notes to our financial statements that appear in our Annual Report on Form 10-K each fiscal year and the footnotes to the Summary Compensation Table that appears in our annual Proxy Statement.
The table above reflects the CAP (determined as noted above) for each CEO and, for our Non-PEO NEOs, the average of the CAPs determined for the Non-PEO NEOs for each of the fiscal years shown in the table.
The following table provides a reconciliation of the Summary Compensation Table Total to Compensation Actually Paid for our CEO #1.
Reconciliation of Summary Compensation Table Total to Compensation Actually Paid for CEO #1 | Fiscal Year 2025 ($) | Fiscal Year 2024 ($) | Fiscal Year 2023 ($) | ||||||
Summary Compensation Table Total | N/A | N/A | 1,348,502 | ||||||
Grant Date Fair Value of Option and Stock Awards Granted in Fiscal Year | N/A | N/A | (943,552) | ||||||
Fair Value at Fiscal Year-End of Outstanding and Unvested Option and Stock Awards Granted in Fiscal Year | N/A | N/A | 0 | ||||||
Change in Fair Value of Outstanding and Unvested Option and Stock Awards Granted in Prior Fiscal Years | N/A | N/A | 0 | ||||||
Fair Value at Vesting of Option and Stock Awards Granted in Fiscal Year That Vested During Fiscal Year | N/A | N/A | 0 | ||||||
Change in Fair Value as of Vesting Date of Option and Stock Awards Granted in Prior Fiscal Years For Which Applicable Vesting Conditions Were Satisfied During Fiscal Year | N/A | N/A | 464,354 | ||||||
Fair Value as of Prior Fiscal Year-End of Option and Stock Awards Granted in Prior Fiscal Years That Failed to Meet Applicable Vesting Conditions During Fiscal Year | N/A | N/A | (422,841) | ||||||
Compensation Actually Paid | N/A | N/A | 446,463 | ||||||
The following table provides a reconciliation of the Summary Compensation Table Total to Compensation Actually Paid for our CEO #2.
Reconciliation of Summary Compensation Table Total to Compensation Actually Paid for CEO #2 | Fiscal Year 2025 ($) | Fiscal Year 2024 ($) | Fiscal Year 2023 ($) | ||||||
Summary Compensation Table Total | N/A | 973,215 | 823,914 | ||||||
Grant Date Fair Value of Option and Stock Awards Granted in Fiscal Year | N/A | (534,651) | (566,130) | ||||||
Fair Value at Fiscal Year-End of Outstanding and Unvested Option and Stock Awards Granted in Fiscal Year | N/A | 434,921 | 527,422 | ||||||
Change in Fair Value of Outstanding and Unvested Option and Stock Awards Granted in Prior Fiscal Years | N/A | (91,466) | (62,759) | ||||||
Fair Value at Vesting of Option and Stock Awards Granted in Fiscal Year That Vested During Fiscal Year | N/A | 0 | 0 | ||||||
Change in Fair Value as of Vesting Date of Option and Stock Awards Granted in Prior Fiscal Years For Which Applicable Vesting Conditions Were Satisfied During Fiscal Year | N/A | (197,355) | 38,324 | ||||||
Fair Value as of Prior Fiscal Year-End of Option and Stock Awards Granted in Prior Fiscal Years That Failed to Meet Applicable Vesting Conditions During Fiscal Year | N/A | 0 | 0 | ||||||
Compensation Actually Paid | N/A | 584,664 | 760,771 | ||||||
The following table provides a reconciliation of the Summary Compensation Table Total to Compensation Actually Paid for our CEO #3.
Reconciliation of Summary Compensation Table Total to Compensation Actually Paid for CEO #3 | Fiscal Year 2025 ($) | Fiscal Year 2024 ($) | Fiscal Year 2023 ($) | ||||||
Summary Compensation Table Total | $1,397,041 | 6,086,293 | N/A | ||||||
Grant Date Fair Value of Option and Stock Awards Granted in Fiscal Year | (892,546) | (5,488,377) | N/A | ||||||
Fair Value at Fiscal Year-End of Outstanding and Unvested Option and Stock Awards Granted in Fiscal Year | 588,042 | 3,473,993 | N/A | ||||||
Change in Fair Value of Outstanding and Unvested Option and Stock Awards Granted in Prior Fiscal Years | (942,485) | 0 | N/A | ||||||
Fair Value at Vesting of Option and Stock Awards Granted in Fiscal Year That Vested During Fiscal Year | 0 | 0 | N/A | ||||||
Change in Fair Value as of Vesting Date of Option and Stock Awards Granted in Prior Fiscal Years For Which Applicable Vesting Conditions Were Satisfied During Fiscal Year | (36,382) | 0 | N/A | ||||||
Fair Value as of Prior Fiscal Year-End of Option and Stock Awards Granted in Prior Fiscal Years That Failed to Meet Applicable Vesting Conditions During Fiscal Year | 0 | 0 | N/A | ||||||
Compensation Actually Paid | 113,669 | 4,071,910 | N/A | ||||||
(3) | For purposes of this table, the compensation actually paid (also referred to as “CAP”) to each of our named executive officers (including, for purposes of this table, former named executive officers who are included in the Non-PEO NEO group for the applicable year) means the named executive officer’s total compensation as reflected in the Summary Compensation Table for the applicable fiscal year and adjusted for the following with respect to each named executive officer: |
• | Less the amounts reported in the “Stock Awards” and “Option Awards” columns of the Summary Compensation Table for the applicable fiscal year, |
• | Plus the fiscal year-end value of Lantronix option and stock awards granted in the covered fiscal year which were outstanding and unvested at the end of the covered fiscal year, |
• | Plus/(less) the change in value as of the end of the covered fiscal year as compared to the value at the end of the prior fiscal year for Lantronix option and stock awards which were granted in prior fiscal years and were outstanding and unvested at the end of the covered fiscal year, |
• | Plus the vesting date value of Lantronix option and stock awards which were granted and vested during the same covered fiscal year, |
• | Plus/(less) the change in value as of the vesting date as compared to the value at the end of the prior fiscal year for Lantronix option and stock awards which were granted in prior fiscal years and vested in the covered fiscal year, |
• | Less, as to any Lantronix option and stock awards which were granted in prior fiscal years and were forfeited during the covered fiscal year, the value of such awards as of the end of the prior fiscal year, |
• | Plus the dollar value of any dividends or other earnings paid during the covered fiscal year on Lantronix outstanding and unvested stock awards (no dividends or dividend equivalents are credited with respect to Lantronix options and, for other Lantronix awards, the crediting of dividend equivalents has been taken into account in determining the applicable fiscal year-end or vesting date value of the award), and |
• | Plus, as to a Lantronix option or stock award that was materially modified during the covered fiscal year, the amount by which the value of the award as of the date of the modification exceeds the value of the original award on the modification date (none of the Lantronix option or stock awards held by the named executive officers were materially modified during the fiscal years covered by the table. |
In making each of these adjustments, the “value” of an option or stock award is the fair value of the award on the applicable date determined in accordance with FASB ASC Topic 718 using the valuation assumptions we then used to calculate the fair value of our equity awards. For more information on the valuation of our equity awards, please see the notes to our financial statements that appear in our Annual Report on Form 10-K each fiscal year and the footnotes to the Summary Compensation Table that appears in our annual Proxy Statement.
The table above reflects the CAP (determined as noted above) for each CEO and, for our Non-PEO NEOs, the average of the CAPs determined for the Non-PEO NEOs for each of the fiscal years shown in the table.
The following table provides a reconciliation of the average of the Summary Compensation Table Total for the Non-PEO NEOs for a fiscal year to the average of the Compensation Actually Paid for the Non-PEO NEOs for that fiscal year.
Reconciliation of Average Summary Compensation Table Total to Average Compensation Actually Paid for Non-PEO NEOs | Fiscal Year 2025 ($) | Fiscal Year 2024 ($) | Fiscal Year 2023 ($) | ||||||
Summary Compensation Table Total | 711,414 | 749,491 | 843,633 | ||||||
Grant Date Fair Value of Option and Stock Awards Granted in Fiscal Year | (334,285) | (491,971) | (664,030) | ||||||
Fair Value at Fiscal Year-End of Outstanding and Unvested Option and Stock Awards Granted in Fiscal Year | 230,272 | 425,140 | 627,287 | ||||||
Change in Fair Value of Outstanding and Unvested Option and Stock Awards Granted in Prior Fiscal Years | (134,682) | (48,850) | (38,865) | ||||||
Fair Value at Vesting of Option and Stock Awards Granted in Fiscal Year That Vested During Fiscal Year | 0 | 0 | 0 | ||||||
Change in Fair Value as of Vesting Date of Option and Stock Awards Granted in Prior Fiscal Years For Which Applicable Vesting Conditions Were Satisfied During Fiscal Year | (35,519) | (56,961) | (30,579) | ||||||
Fair Value as of Prior Fiscal Year-End of Option and Stock Awards Granted in Prior Fiscal Years That Failed to Meet Applicable Vesting Conditions During Fiscal Year | 0 | 0 | 0 | ||||||
Compensation Actually Paid | 437,200 | 576,850 | 737,446 | ||||||
(4) | LTRX TSR represents cumulative total stockholder return on a fixed investment of $100 in the Company’s common stock for the period beginning on the last trading day of fiscal year 2022 through the end of the applicable fiscal year, and is calculated assuming the reinvestment of dividends. The following chart illustrates the CAP for our CEO and the average CAP for our Non-PEO NEOs for each of the last three fiscal years against the Company’s total stockholder return (calculated as described above) over that period of time. |
(5) | This column shows the Company’s net income for each fiscal year covered by the table. The following chart illustrates the CAP for our CEO and the average CAP for our Non-PEO NEOs for each of the last three fiscal years against the Company’s net income for each of those years. |