| Company Overview FIXED INCOME INVESTOR MEETING September 2025 Exhibit 99.1 |

| | 2 Legal Disclaimer Disclaimers COPT Defense Properties (“COPT Defense” or “CDP”) and subsidiaries (collectively, the “Company”) has filed an automatically effective shelf registration statement on Form S-3 with the Securities and Exchange Commission. The offering of these securities will be made only by means of a prospectus supplement and base prospectus forming part of the effective registration statement. You may obtain these documents and other documents incorporated by reference or filed as exhibits to the registration statement for more complete information about this offering. Copies of the prospectus supplement for this offering may also be obtained, when available, by contacting Wells Fargo Securities LLC at 1-800-645-375. This presentation shall not constitute an offer to sell or the solicitation of an offer to buy these securities, nor shall there be any sale of these securities in any state or jurisdiction in which such offer, solicitation, or sale would be unlawful prior to registration or qualification under the securities laws of any such state or jurisdiction. Non-GAAP Financial Measures This presentation contains non-GAAP financial measures as defined in Regulation G adopted by the Securities and Exchange Commission. These non-GAAP measures are not recognized measures under GAAP and do not have standardized meanings prescribed by GAAP and therefore may not be comparable to similar measures presented by other companies. Information on the most directly comparable GAAP measures and composition of the measures are contained in the Appendix at the end of the presentation. Industry and Market Information Information regarding market share, market position and industry data pertaining to the Company’s business contained in this presentation consists of estimates based on data and reports compiled by industry professional organizations and analysts and the Company’s knowledge of its industry. Although the Company believes the industry and market data to be reliable, this information could prove to be inaccurate. Industry and market data could be wrong because of the method by which sources obtained their data and because information cannot always be verified with complete certainty due to the limits on the availability and reliability of raw data, the voluntary nature of the data gathering process and other limitations and uncertainties. You should carefully consider the inherent risks and uncertainties associated with the market and other industry data contained in this presentation. Forward-looking information obtained from these sources is subject to the same qualifications and the additional uncertainties as the other forward-looking statements in this presentation. Cautionary Note Regarding Forward-Looking Statements This presentation contains “forward-looking” statements, as defined in Section 27A of the Securities Act Section 21E of the Securities Exchange Act of 1934, as amended, that are based on the Company’s current expectations, estimates and projections about future events and financial trends affecting the Company. Forward-looking statements can be identified by the use of words such as “may,” “will,” “should,” “could,” “believe,” “anticipate,” “expect,” “estimate,” “plan” or other comparable terminology. Forward-looking statements are inherently subject to risks and uncertainties, many of which the Company cannot predict with accuracy and some of which the Company might not even anticipate. Although the Company believes that the expectations, estimates and projections reflected in such forward-looking statements are based on reasonable assumptions at the time made, the Company can give no assurance that these expectations, estimates and projections will be achieved. Future events and actual results may differ materially from those discussed in the forward-looking statements and the Company undertakes no obligation to update or supplement any forward-looking statements. |
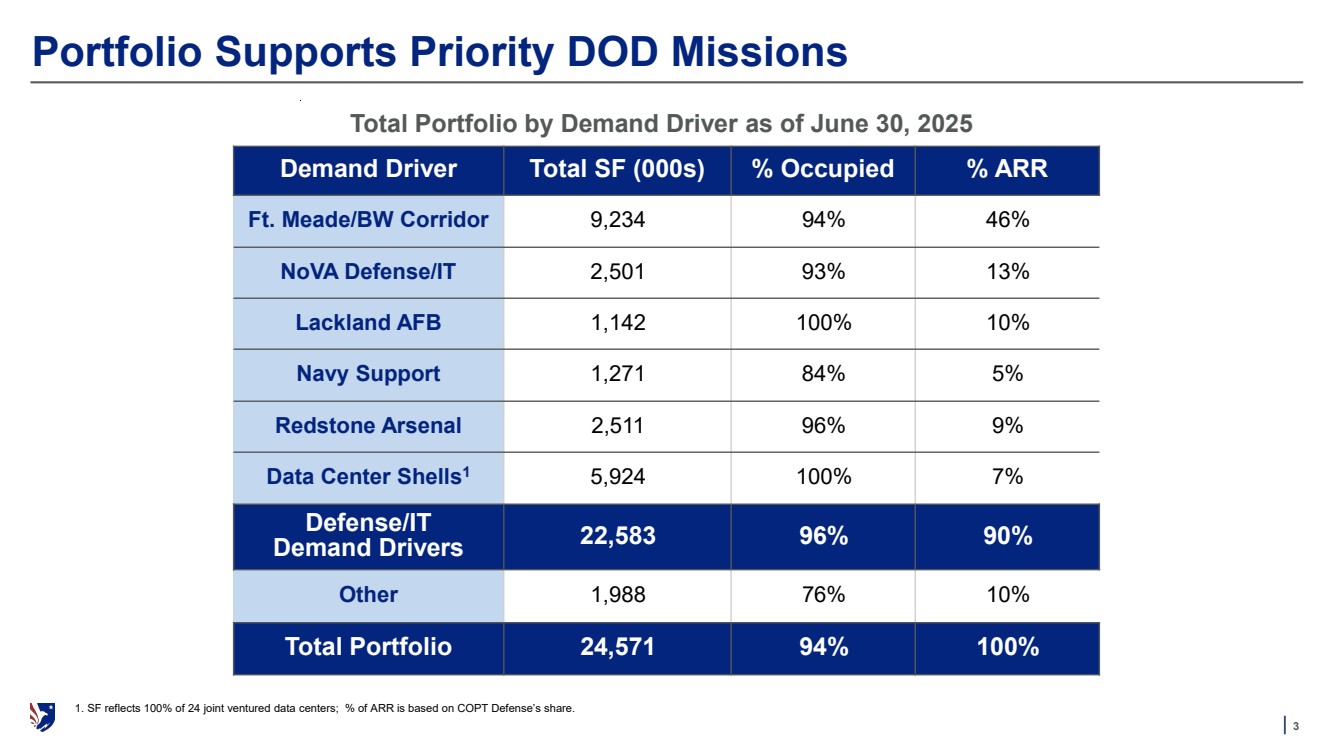
| | 3 Portfolio Supports Priority DOD Missions Demand Driver Total SF (000s) % Occupied % ARR Ft. Meade/BW Corridor 9,234 94% 46% NoVA Defense/IT 2,501 93% 13% Lackland AFB 1,142 100% 10% Navy Support 1,271 84% 5% Redstone Arsenal 2,511 96% 9% Data Center Shells1 5,924 100% 7% Defense/IT Demand Drivers 22,583 96% 90% Other 1,988 76% 10% Total Portfolio 24,571 94% 100% Total Portfolio by Demand Driver as of June 30, 2025 1. SF reflects 100% of 24 joint ventured data centers; % of ARR is based on COPT Defense’s share. |
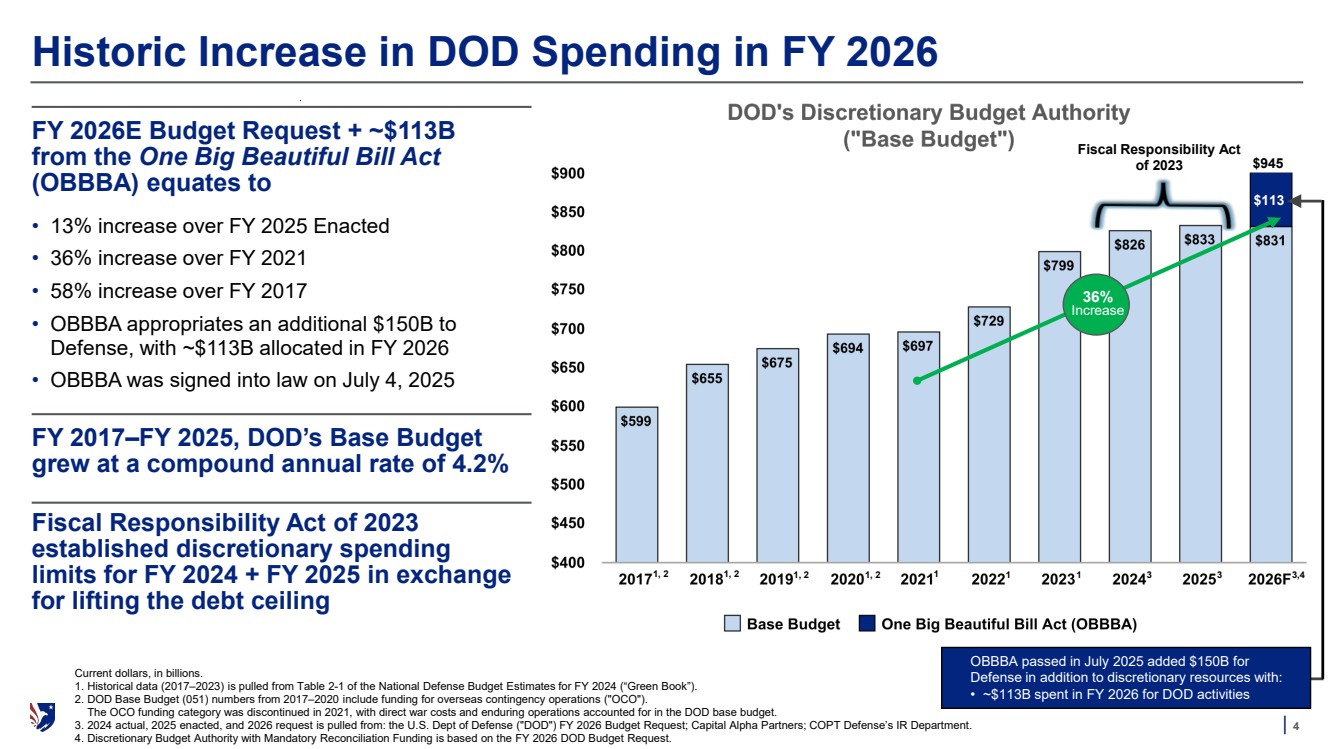
| | 4 Historic Increase in DOD Spending in FY 2026 FY 2026E Budget Request + ~$113B from the One Big Beautiful Bill Act (OBBBA) equates to • 13% increase over FY 2025 Enacted • 36% increase over FY 2021 • 58% increase over FY 2017 • OBBBA appropriates an additional $150B to Defense, with ~$113B allocated in FY 2026 • OBBBA was signed into law on July 4, 2025 FY 2017–FY 2025, DOD’s Base Budget grew at a compound annual rate of 4.2% Fiscal Responsibility Act of 2023 established discretionary spending limits for FY 2024 + FY 2025 in exchange for lifting the debt ceiling Current dollars, in billions. 1. Historical data (2017–2023) is pulled from Table 2-1 of the National Defense Budget Estimates for FY 2024 (“Green Book”). 2. DOD Base Budget (051) numbers from 2017–2020 include funding for overseas contingency operations ("OCO"). The OCO funding category was discontinued in 2021, with direct war costs and enduring operations accounted for in the DOD base budget. 3. 2024 actual, 2025 enacted, and 2026 request is pulled from: the U.S. Dept of Defense ("DOD") FY 2026 Budget Request; Capital Alpha Partners; COPT Defense’s IR Department. 4. Discretionary Budget Authority with Mandatory Reconciliation Funding is based on the FY 2026 DOD Budget Request. Fiscal Responsibility Act of 2023 $945 $113 OBBBA passed in July 2025 added $150B for Defense in addition to discretionary resources with: • ~$113B spent in FY 2026 for DOD activities 36% Increase 1, 2 1, 2 1, 2 1, 2 1 1 1 3 3 3,4 |
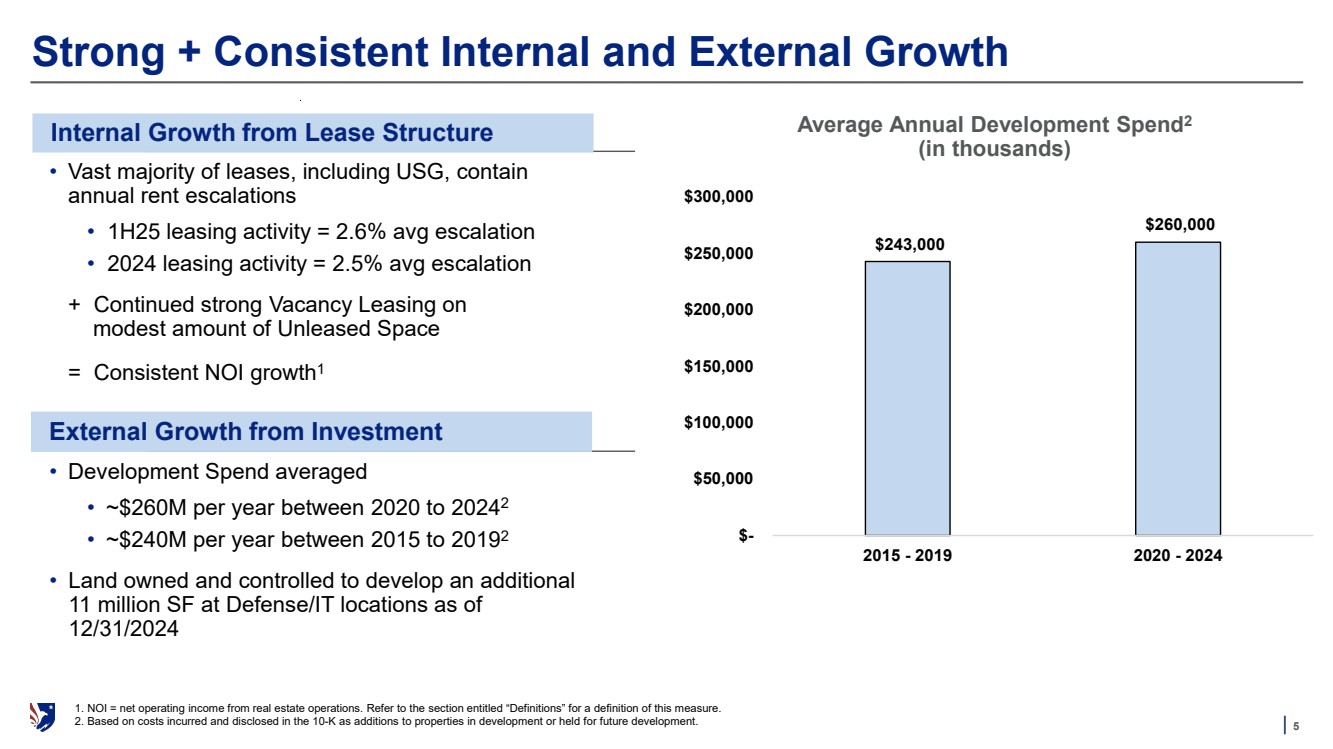
| | 5 Strong + Consistent Internal and External Growth Remaining Achieved Average Annual Development Spend2 (in thousands) $243,000 $260,000 $- $50,000 $100,000 $150,000 $200,000 $250,000 $300,000 2015 - 2019 2020 - 2024 Internal Growth from Lease Structure • Vast majority of leases, including USG, contain annual rent escalations • 1H25 leasing activity = 2.6% avg escalation • 2024 leasing activity = 2.5% avg escalation + Continued strong Vacancy Leasing on modest amount of Unleased Space = Consistent NOI growth1 External Growth from Investment • Development Spend averaged • ~$260M per year between 2020 to 20242 • ~$240M per year between 2015 to 20192 • Land owned and controlled to develop an additional 11 million SF at Defense/IT locations as of 12/31/2024 1. NOI = net operating income from real estate operations. Refer to the section entitled “Definitions” for a definition of this measure. 2. Based on costs incurred and disclosed in the 10-K as additions to properties in development or held for future development. |
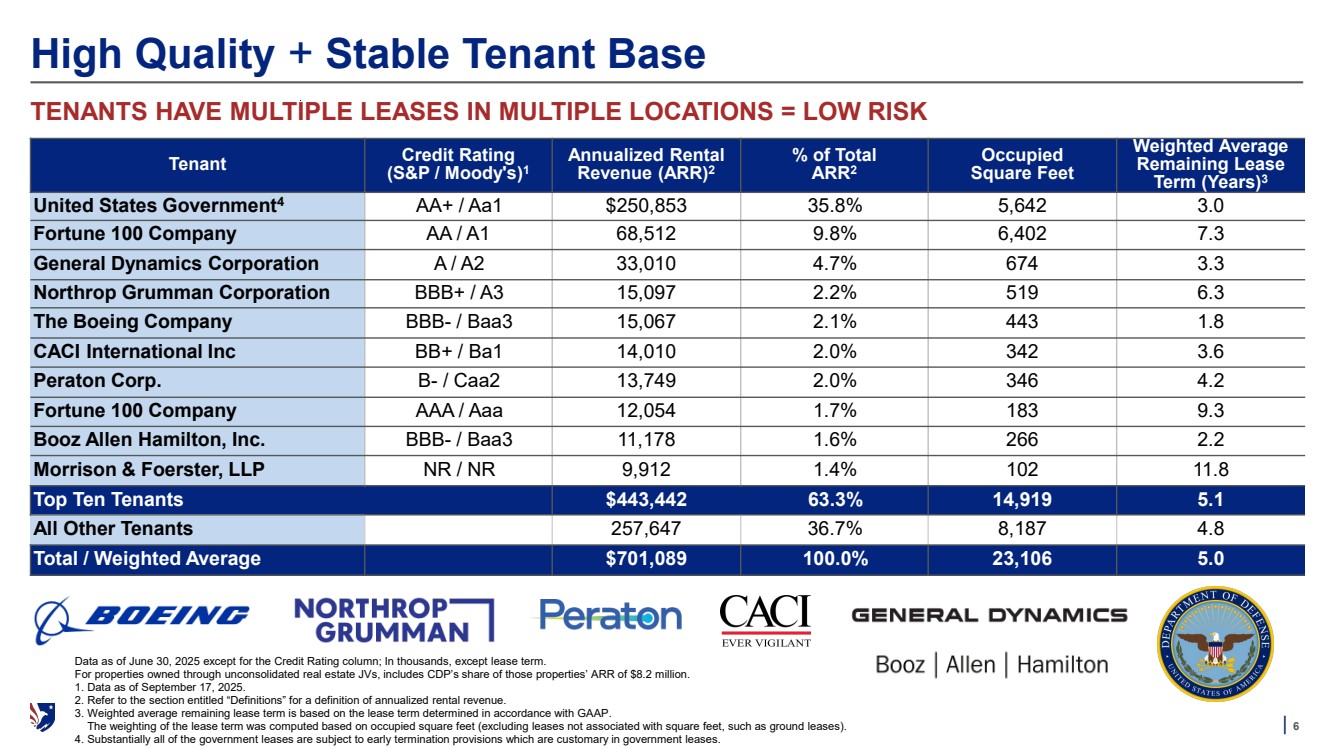
| | 6 High Quality + Stable Tenant Base Tenant Credit Rating (S&P / Moody's)1 Annualized Rental Revenue (ARR)2 % of Total ARR2 Occupied Square Feet Weighted Average Remaining Lease Term (Years)3 United States Government4 AA+ / Aa1 $250,853 35.8% 5,642 3.0 Fortune 100 Company AA / A1 68,512 9.8% 6,402 7.3 General Dynamics Corporation A / A2 33,010 4.7% 674 3.3 Northrop Grumman Corporation BBB+ / A3 15,097 2.2% 519 6.3 The Boeing Company BBB- / Baa3 15,067 2.1% 443 1.8 CACI International Inc BB+ / Ba1 14,010 2.0% 342 3.6 Peraton Corp. B- / Caa2 13,749 2.0% 346 4.2 Fortune 100 Company AAA / Aaa 12,054 1.7% 183 9.3 Booz Allen Hamilton, Inc. BBB- / Baa3 11,178 1.6% 266 2.2 Morrison & Foerster, LLP NR / NR 9,912 1.4% 102 11.8 Top Ten Tenants $443,442 63.3% 14,919 5.1 All Other Tenants 257,647 36.7% 8,187 4.8 Total / Weighted Average $701,089 100.0% 23,106 5.0 TENANTS HAVE MULTIPLE LEASES IN MULTIPLE LOCATIONS = LOW RISK Data as of June 30, 2025 except for the Credit Rating column; In thousands, except lease term. For properties owned through unconsolidated real estate JVs, includes CDP’s share of those properties’ ARR of $8.2 million. 1. Data as of September 17, 2025. 2. Refer to the section entitled “Definitions” for a definition of annualized rental revenue. 3. Weighted average remaining lease term is based on the lease term determined in accordance with GAAP. The weighting of the lease term was computed based on occupied square feet (excluding leases not associated with square feet, such as ground leases). 4. Substantially all of the government leases are subject to early termination provisions which are customary in government leases. |
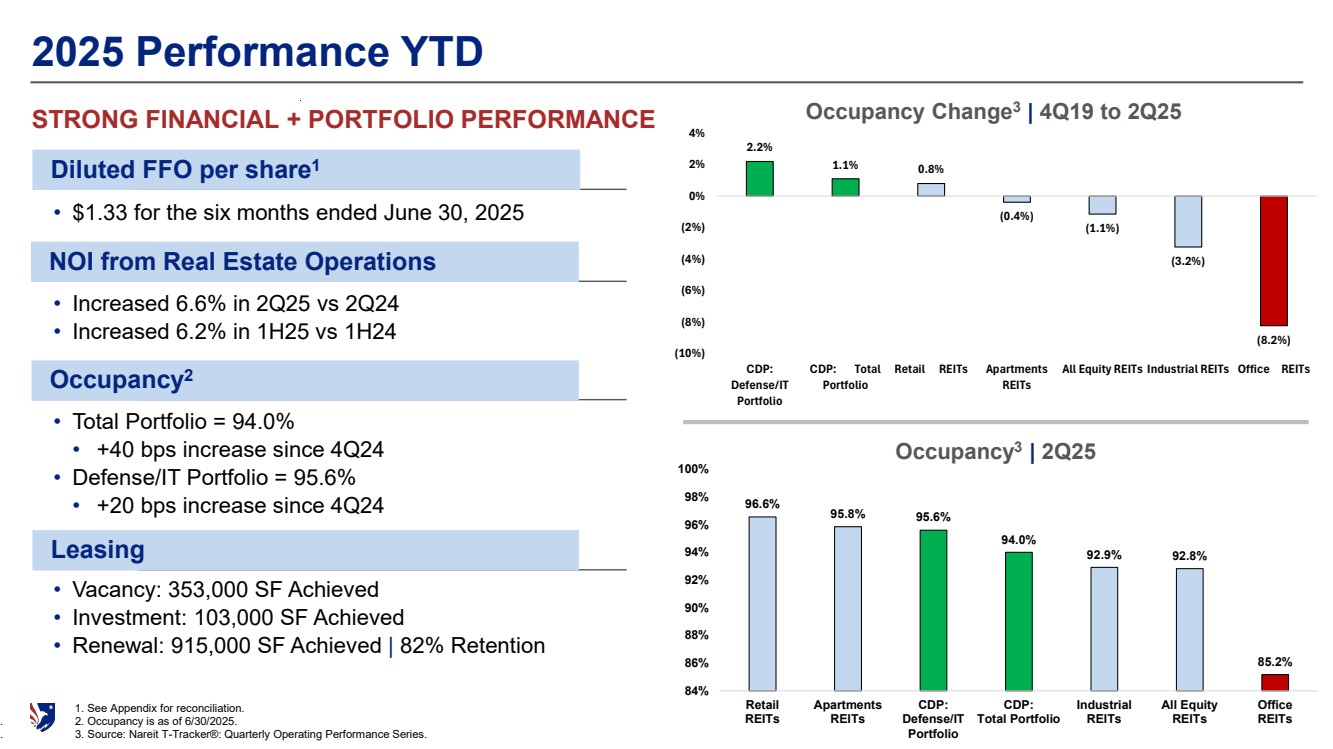
| | 7 2.2% 1.1% 0.8% (0.4%) (1.1%) (3.2%) (8.2%) (10%) (8%) (6%) (4%) (2%) 0% 2% 4% CDP: Defense/IT Portfolio CDP: Total Portfolio Retail REITs Apartments REITs All Equity REITs Industrial REITs Office REITs 96.6% 95.8% 95.6% 94.0% 92.9% 92.8% 85.2% 84% 86% 88% 90% 92% 94% 96% 98% 100% Retail REITs Apartments REITs CDP: Defense/IT Portfolio CDP: Total Portfolio Industrial REITs All Equity REITs Office REITs 2025 Performance YTD STRONG FINANCIAL + PORTFOLIO PERFORMANCE Occupancy Change3 | 4Q19 to 2Q25 Occupancy3 | 2Q25 Diluted FFO per share1 • $1.33 for the six months ended June 30, 2025 NOI from Real Estate Operations • Increased 6.6% in 2Q25 vs 2Q24 • Increased 6.2% in 1H25 vs 1H24 Occupancy2 • Total Portfolio = 94.0% • +40 bps increase since 4Q24 • Defense/IT Portfolio = 95.6% • +20 bps increase since 4Q24 Leasing • Vacancy: 353,000 SF Achieved • Investment: 103,000 SF Achieved • Renewal: 915,000 SF Achieved | 82% Retention 1. See Appendix for reconciliation. . 2. Occupancy is as of 6/30/2025. . 3. Source: Nareit T-Tracker®: Quarterly Operating Performance Series. |
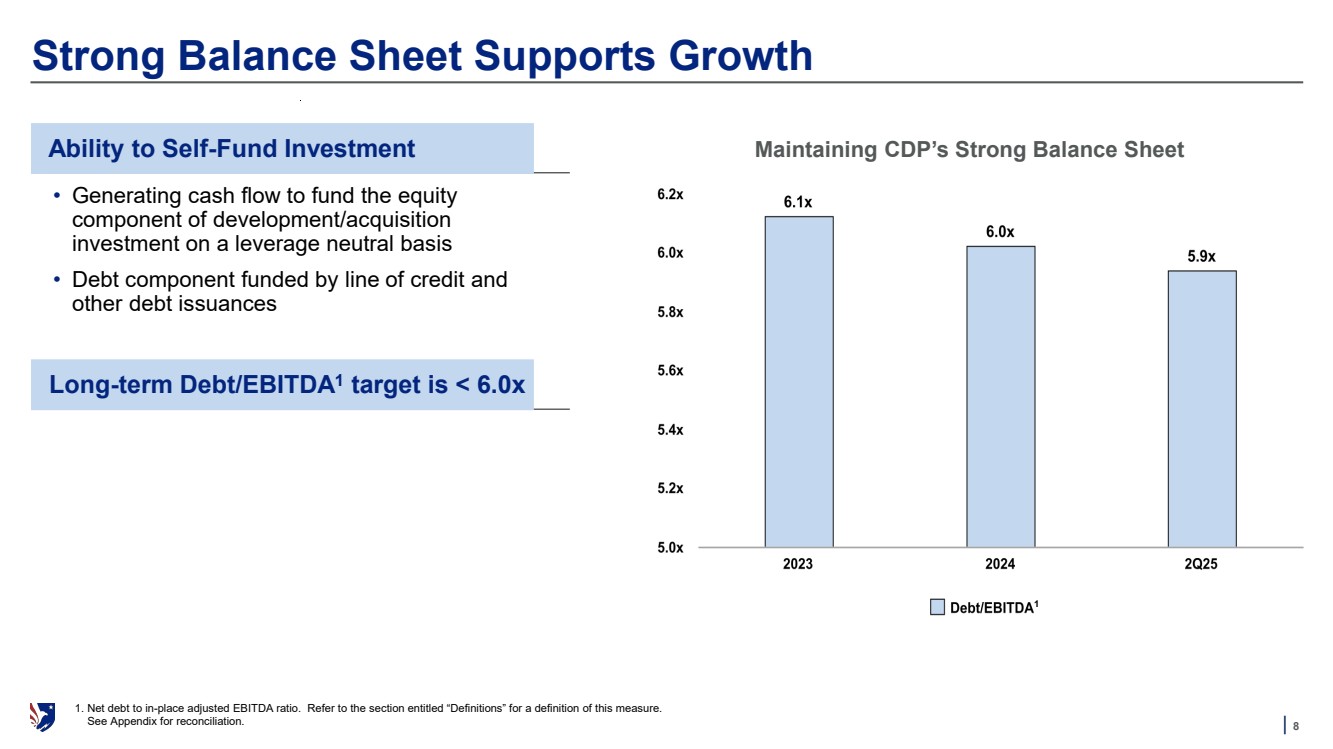
| | 8 Strong Balance Sheet Supports Growth Maintaining CDP’s Strong Balance Sheet • Generating cash flow to fund the equity component of development/acquisition investment on a leverage neutral basis • Debt component funded by line of credit and other debt issuances Long-term Debt/EBITDA1 target is < 6.0x 1 Ability to Self-Fund Investment 1. Net debt to in-place adjusted EBITDA ratio. Refer to the section entitled “Definitions” for a definition of this measure. See Appendix for reconciliation. |
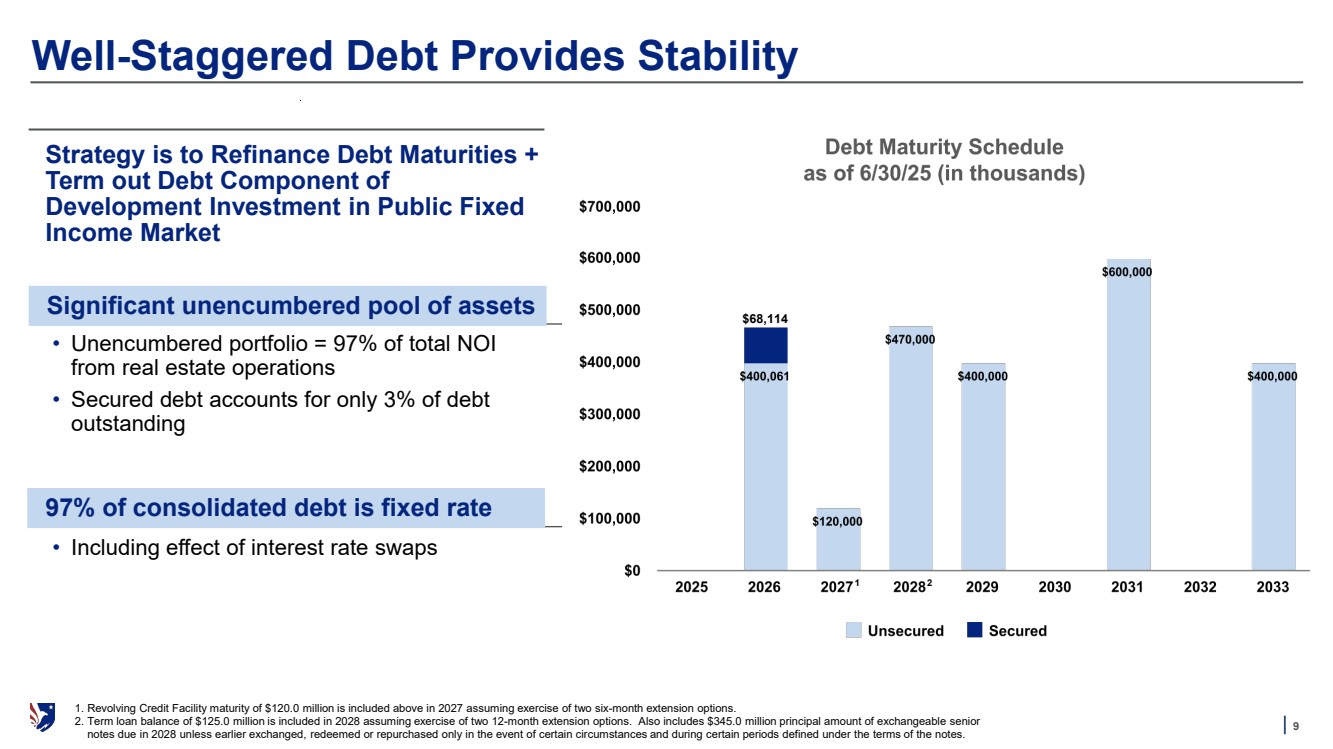
| | 9 Well-Staggered Debt Provides Stability Strategy is to Refinance Debt Maturities + Term out Debt Component of Development Investment in Public Fixed Income Market $68,114 1 2 Significant unencumbered pool of assets • Unencumbered portfolio = 97% of total NOI from real estate operations • Secured debt accounts for only 3% of debt outstanding • Including effect of interest rate swaps 97% of consolidated debt is fixed rate 1. Revolving Credit Facility maturity of $120.0 million is included above in 2027 assuming exercise of two six-month extension options. 2. Term loan balance of $125.0 million is included in 2028 assuming exercise of two 12-month extension options. Also includes $345.0 million principal amount of exchangeable senior notes due in 2028 unless earlier exchanged, redeemed or repurchased only in the event of certain circumstances and during certain periods defined under the terms of the notes. |
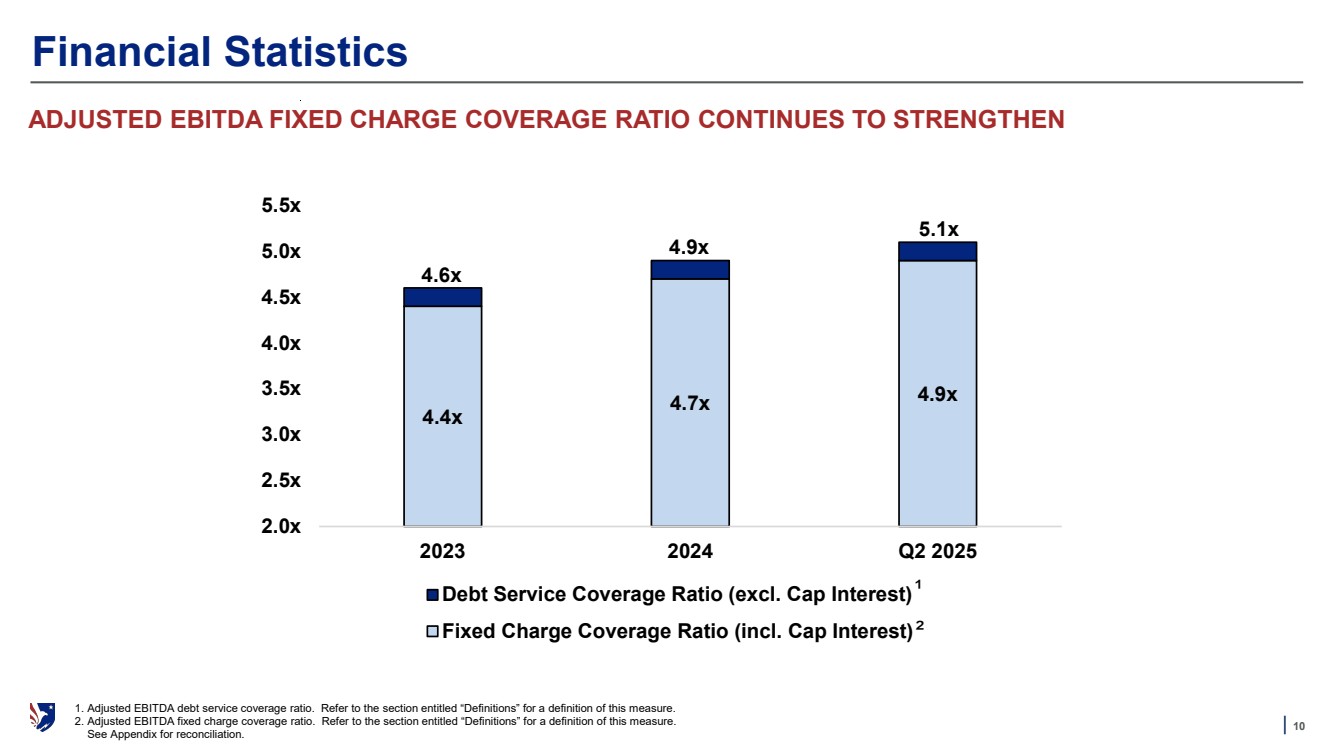
| | 10 4.4x 4.7x 4.9x 4.6x 4.9x 5.1x 2.0x 2.5x 3.0x 3.5x 4.0x 4.5x 5.0x 5.5x 2023 2024 Q2 2025 Includes Cap Interest Excludes Cap Interest Financial Statistics ADJUSTED EBITDA FIXED CHARGE COVERAGE RATIO CONTINUES TO STRENGTHEN 4.4x 4.7x 4.9x 4.6x 4.9x 5.1x 2.0x 2.5x 3.0x 3.5x 4.0x 4.5x 5.0x 5.5x 2023 2024 Q2 2025 Debt Service Coverage Ratio (excl. Cap Interest) Fixed Charge Coverage Ratio (incl. Cap Interest) 1. Adjusted EBITDA debt service coverage ratio. Refer to the section entitled “Definitions” for a definition of this measure. 2. Adjusted EBITDA fixed charge coverage ratio. Refer to the section entitled “Definitions” for a definition of this measure. See Appendix for reconciliation. ² ¹ |
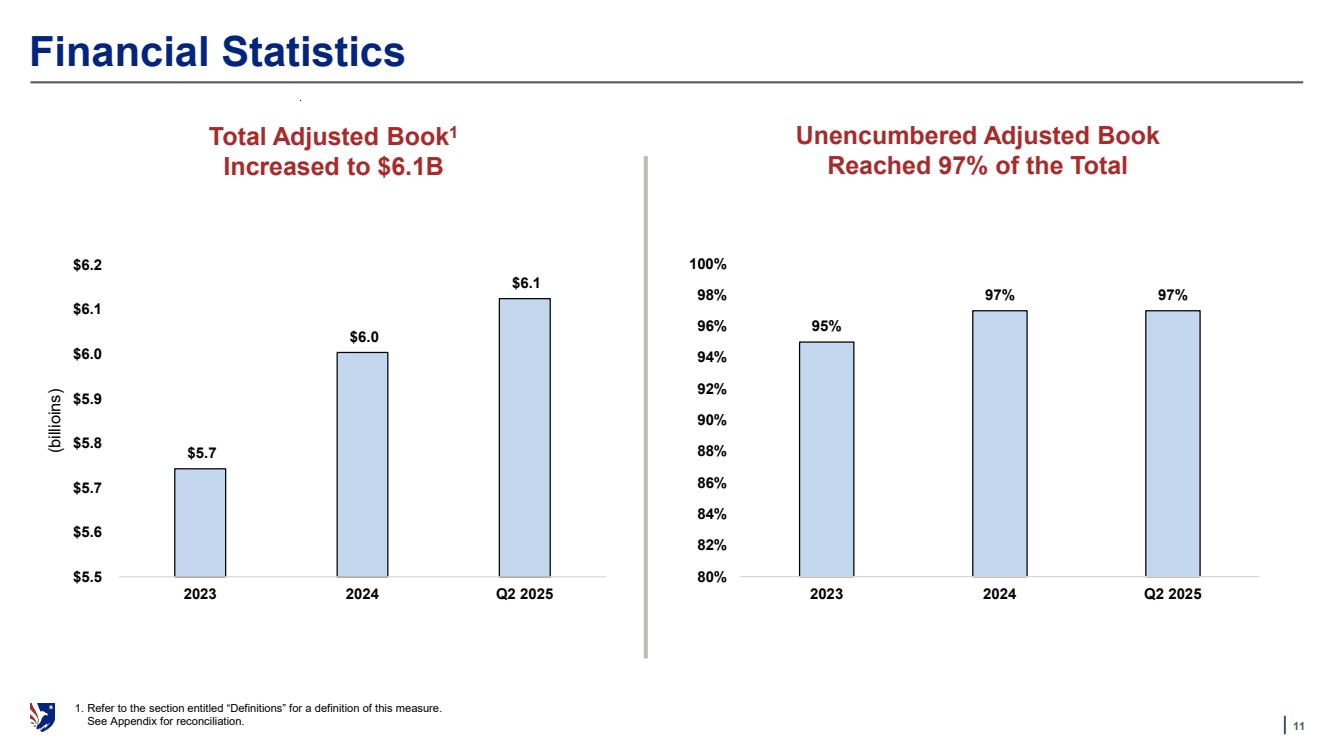
| | 11 Financial Statistics Total Adjusted Book1 Increased to $6.1B Unencumbered Adjusted Book Reached 97% of the Total $5.7 $6.0 $6.1 $5.5 $5.6 $5.7 $5.8 $5.9 $6.0 $6.1 $6.2 2023 2024 Q2 2025 (billioins) 95% 97% 97% 80% 82% 84% 86% 88% 90% 92% 94% 96% 98% 100% 2023 2024 Q2 2025 1. Refer to the section entitled “Definitions” for a definition of this measure. See Appendix for reconciliation. |
| Appendices | 12 |

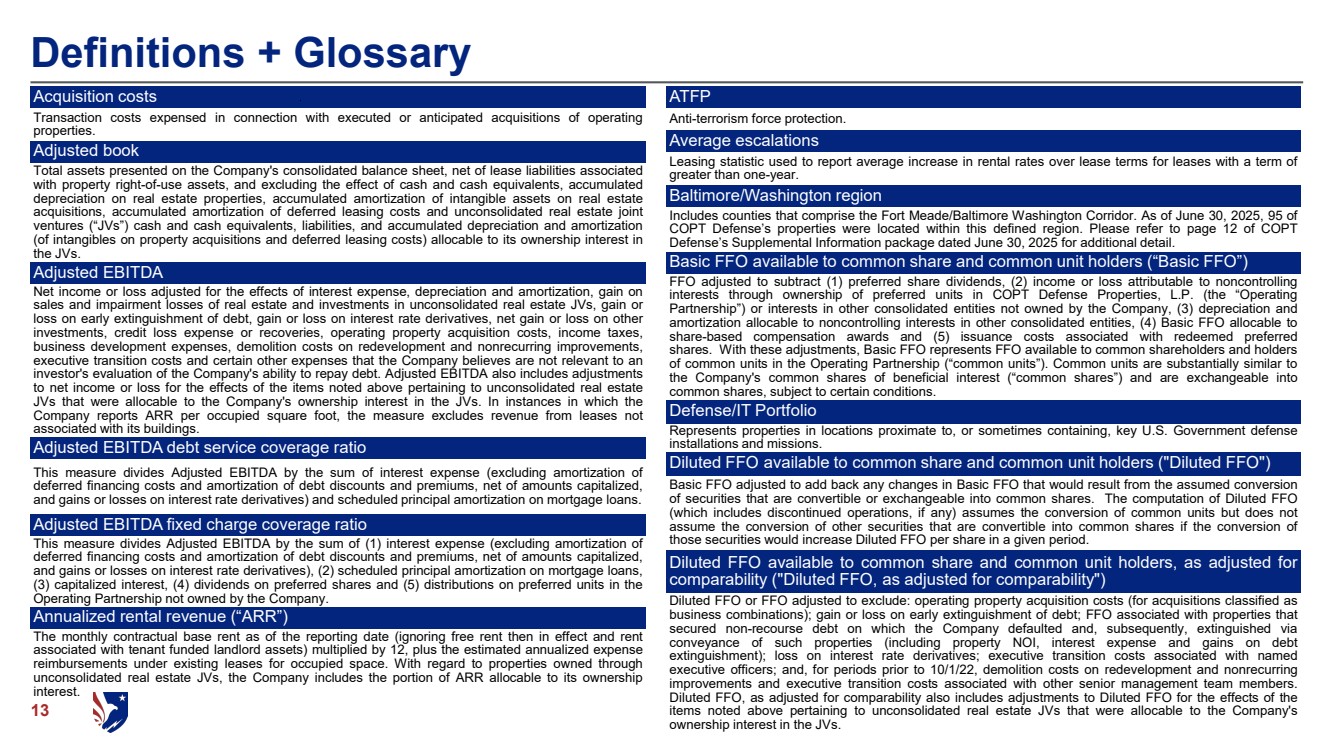
| 13 Definitions + Glossary Acquisition costs Transaction costs expensed in connection with executed or anticipated acquisitions of operating properties. Adjusted book Total assets presented on the Company's consolidated balance sheet, net of lease liabilities associated with property right-of-use assets, and excluding the effect of cash and cash equivalents, accumulated depreciation on real estate properties, accumulated amortization of intangible assets on real estate acquisitions, accumulated amortization of deferred leasing costs and unconsolidated real estate joint ventures (“JVs”) cash and cash equivalents, liabilities, and accumulated depreciation and amortization (of intangibles on property acquisitions and deferred leasing costs) allocable to its ownership interest in the JVs. Adjusted EBITDA Net income or loss adjusted for the effects of interest expense, depreciation and amortization, gain on sales and impairment losses of real estate and investments in unconsolidated real estate JVs, gain or loss on early extinguishment of debt, gain or loss on interest rate derivatives, net gain or loss on other investments, credit loss expense or recoveries, operating property acquisition costs, income taxes, business development expenses, demolition costs on redevelopment and nonrecurring improvements, executive transition costs and certain other expenses that the Company believes are not relevant to an investor's evaluation of the Company's ability to repay debt. Adjusted EBITDA also includes adjustments to net income or loss for the effects of the items noted above pertaining to unconsolidated real estate JVs that were allocable to the Company's ownership interest in the JVs. In instances in which the Company reports ARR per occupied square foot, the measure excludes revenue from leases not associated with its buildings. Adjusted EBITDA debt service coverage ratio This measure divides Adjusted EBITDA by the sum of interest expense (excluding amortization of deferred financing costs and amortization of debt discounts and premiums, net of amounts capitalized, and gains or losses on interest rate derivatives) and scheduled principal amortization on mortgage loans. Adjusted EBITDA fixed charge coverage ratio This measure divides Adjusted EBITDA by the sum of (1) interest expense (excluding amortization of deferred financing costs and amortization of debt discounts and premiums, net of amounts capitalized, and gains or losses on interest rate derivatives), (2) scheduled principal amortization on mortgage loans, (3) capitalized interest, (4) dividends on preferred shares and (5) distributions on preferred units in the Operating Partnership not owned by the Company. Annualized rental revenue (“ARR”) The monthly contractual base rent as of the reporting date (ignoring free rent then in effect and rent associated with tenant funded landlord assets) multiplied by 12, plus the estimated annualized expense reimbursements under existing leases for occupied space. With regard to properties owned through unconsolidated real estate JVs, the Company includes the portion of ARR allocable to its ownership interest. ATFP Anti-terrorism force protection. Average escalations Leasing statistic used to report average increase in rental rates over lease terms for leases with a term of greater than one-year. Baltimore/Washington region Includes counties that comprise the Fort Meade/Baltimore Washington Corridor. As of June 30, 2025, 95 of COPT Defense’s properties were located within this defined region. Please refer to page 12 of COPT Defense’s Supplemental Information package dated June 30, 2025 for additional detail. Basic FFO available to common share and common unit holders (“Basic FFO”) FFO adjusted to subtract (1) preferred share dividends, (2) income or loss attributable to noncontrolling interests through ownership of preferred units in COPT Defense Properties, L.P. (the “Operating Partnership”) or interests in other consolidated entities not owned by the Company, (3) depreciation and amortization allocable to noncontrolling interests in other consolidated entities, (4) Basic FFO allocable to share-based compensation awards and (5) issuance costs associated with redeemed preferred shares. With these adjustments, Basic FFO represents FFO available to common shareholders and holders of common units in the Operating Partnership (“common units”). Common units are substantially similar to the Company's common shares of beneficial interest (“common shares”) and are exchangeable into common shares, subject to certain conditions. Defense/IT Portfolio Represents properties in locations proximate to, or sometimes containing, key U.S. Government defense installations and missions. Diluted FFO available to common share and common unit holders ("Diluted FFO") Basic FFO adjusted to add back any changes in Basic FFO that would result from the assumed conversion of securities that are convertible or exchangeable into common shares. The computation of Diluted FFO (which includes discontinued operations, if any) assumes the conversion of common units but does not assume the conversion of other securities that are convertible into common shares if the conversion of those securities would increase Diluted FFO per share in a given period. Diluted FFO available to common share and common unit holders, as adjusted for comparability ("Diluted FFO, as adjusted for comparability") Diluted FFO or FFO adjusted to exclude: operating property acquisition costs (for acquisitions classified as business combinations); gain or loss on early extinguishment of debt; FFO associated with properties that secured non-recourse debt on which the Company defaulted and, subsequently, extinguished via conveyance of such properties (including property NOI, interest expense and gains on debt extinguishment); loss on interest rate derivatives; executive transition costs associated with named executive officers; and, for periods prior to 10/1/22, demolition costs on redevelopment and nonrecurring improvements and executive transition costs associated with other senior management team members. Diluted FFO, as adjusted for comparability also includes adjustments to Diluted FFO for the effects of the items noted above pertaining to unconsolidated real estate JVs that were allocable to the Company's ownership interest in the JVs. |
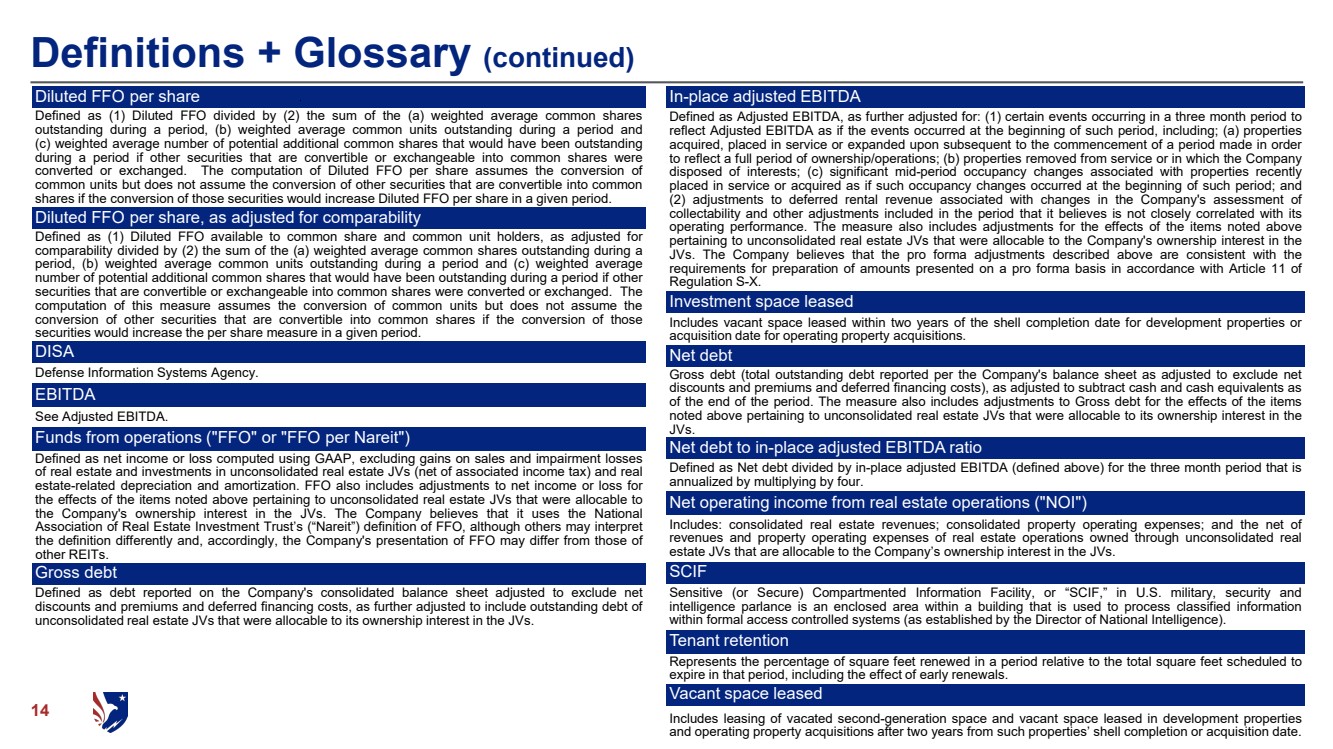
| 14 Definitions + Glossary (continued) Diluted FFO per share Defined as (1) Diluted FFO divided by (2) the sum of the (a) weighted average common shares outstanding during a period, (b) weighted average common units outstanding during a period and (c) weighted average number of potential additional common shares that would have been outstanding during a period if other securities that are convertible or exchangeable into common shares were converted or exchanged. The computation of Diluted FFO per share assumes the conversion of common units but does not assume the conversion of other securities that are convertible into common shares if the conversion of those securities would increase Diluted FFO per share in a given period. Diluted FFO per share, as adjusted for comparability Defined as (1) Diluted FFO available to common share and common unit holders, as adjusted for comparability divided by (2) the sum of the (a) weighted average common shares outstanding during a period, (b) weighted average common units outstanding during a period and (c) weighted average number of potential additional common shares that would have been outstanding during a period if other securities that are convertible or exchangeable into common shares were converted or exchanged. The computation of this measure assumes the conversion of common units but does not assume the conversion of other securities that are convertible into common shares if the conversion of those securities would increase the per share measure in a given period. DISA Defense Information Systems Agency. EBITDA See Adjusted EBITDA. Funds from operations ("FFO" or "FFO per Nareit") Defined as net income or loss computed using GAAP, excluding gains on sales and impairment losses of real estate and investments in unconsolidated real estate JVs (net of associated income tax) and real estate-related depreciation and amortization. FFO also includes adjustments to net income or loss for the effects of the items noted above pertaining to unconsolidated real estate JVs that were allocable to the Company's ownership interest in the JVs. The Company believes that it uses the National Association of Real Estate Investment Trust’s (“Nareit”) definition of FFO, although others may interpret the definition differently and, accordingly, the Company's presentation of FFO may differ from those of other REITs. Gross debt Defined as debt reported on the Company's consolidated balance sheet adjusted to exclude net discounts and premiums and deferred financing costs, as further adjusted to include outstanding debt of unconsolidated real estate JVs that were allocable to its ownership interest in the JVs. In-place adjusted EBITDA Defined as Adjusted EBITDA, as further adjusted for: (1) certain events occurring in a three month period to reflect Adjusted EBITDA as if the events occurred at the beginning of such period, including; (a) properties acquired, placed in service or expanded upon subsequent to the commencement of a period made in order to reflect a full period of ownership/operations; (b) properties removed from service or in which the Company disposed of interests; (c) significant mid-period occupancy changes associated with properties recently placed in service or acquired as if such occupancy changes occurred at the beginning of such period; and (2) adjustments to deferred rental revenue associated with changes in the Company's assessment of collectability and other adjustments included in the period that it believes is not closely correlated with its operating performance. The measure also includes adjustments for the effects of the items noted above pertaining to unconsolidated real estate JVs that were allocable to the Company's ownership interest in the JVs. The Company believes that the pro forma adjustments described above are consistent with the requirements for preparation of amounts presented on a pro forma basis in accordance with Article 11 of Regulation S-X. Investment space leased Includes vacant space leased within two years of the shell completion date for development properties or acquisition date for operating property acquisitions. Net debt Gross debt (total outstanding debt reported per the Company's balance sheet as adjusted to exclude net discounts and premiums and deferred financing costs), as adjusted to subtract cash and cash equivalents as of the end of the period. The measure also includes adjustments to Gross debt for the effects of the items noted above pertaining to unconsolidated real estate JVs that were allocable to its ownership interest in the JVs. Net debt to in-place adjusted EBITDA ratio Defined as Net debt divided by in-place adjusted EBITDA (defined above) for the three month period that is annualized by multiplying by four. Net operating income from real estate operations ("NOI") Includes: consolidated real estate revenues; consolidated property operating expenses; and the net of revenues and property operating expenses of real estate operations owned through unconsolidated real estate JVs that are allocable to the Company’s ownership interest in the JVs. SCIF Sensitive (or Secure) Compartmented Information Facility, or “SCIF,” in U.S. military, security and intelligence parlance is an enclosed area within a building that is used to process classified information within formal access controlled systems (as established by the Director of National Intelligence). Tenant retention Represents the percentage of square feet renewed in a period relative to the total square feet scheduled to expire in that period, including the effect of early renewals. Vacant space leased Includes leasing of vacated second-generation space and vacant space leased in development properties and operating property acquisitions after two years from such properties’ shell completion or acquisition date. |
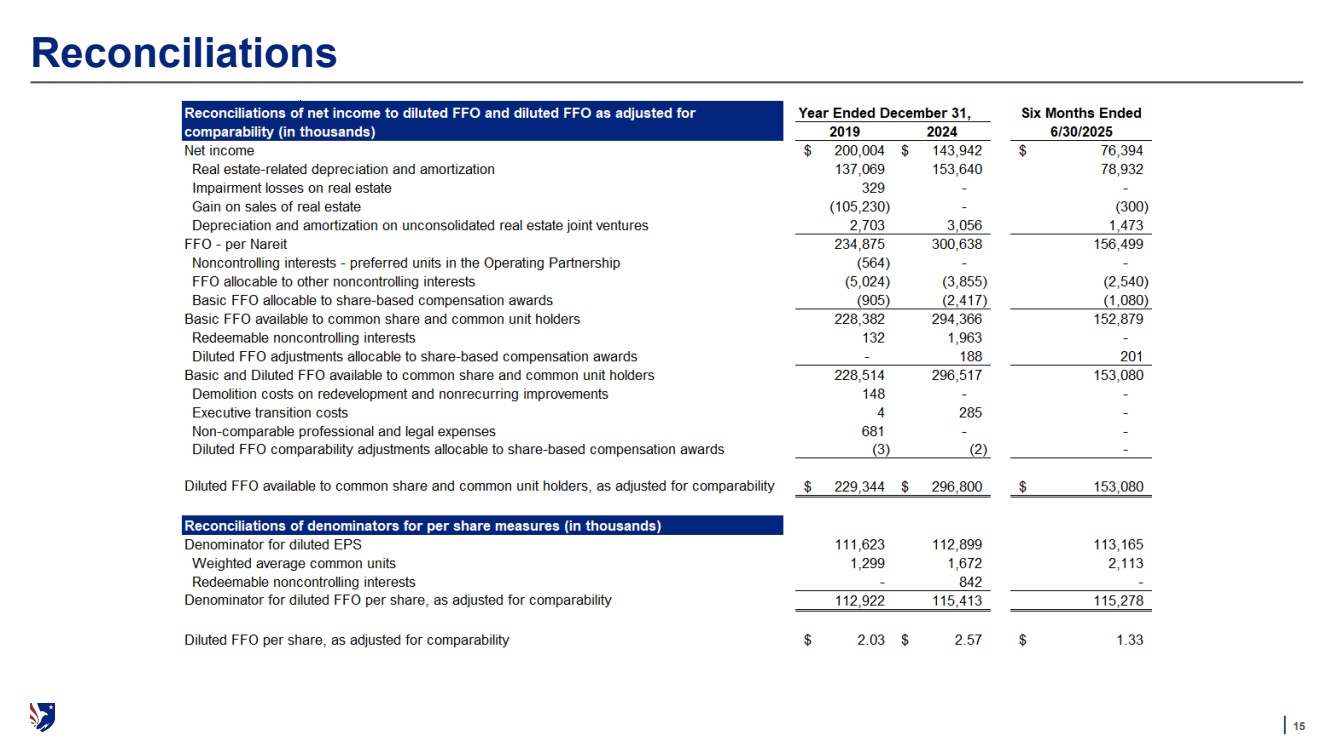
| | 15 Reconciliations |
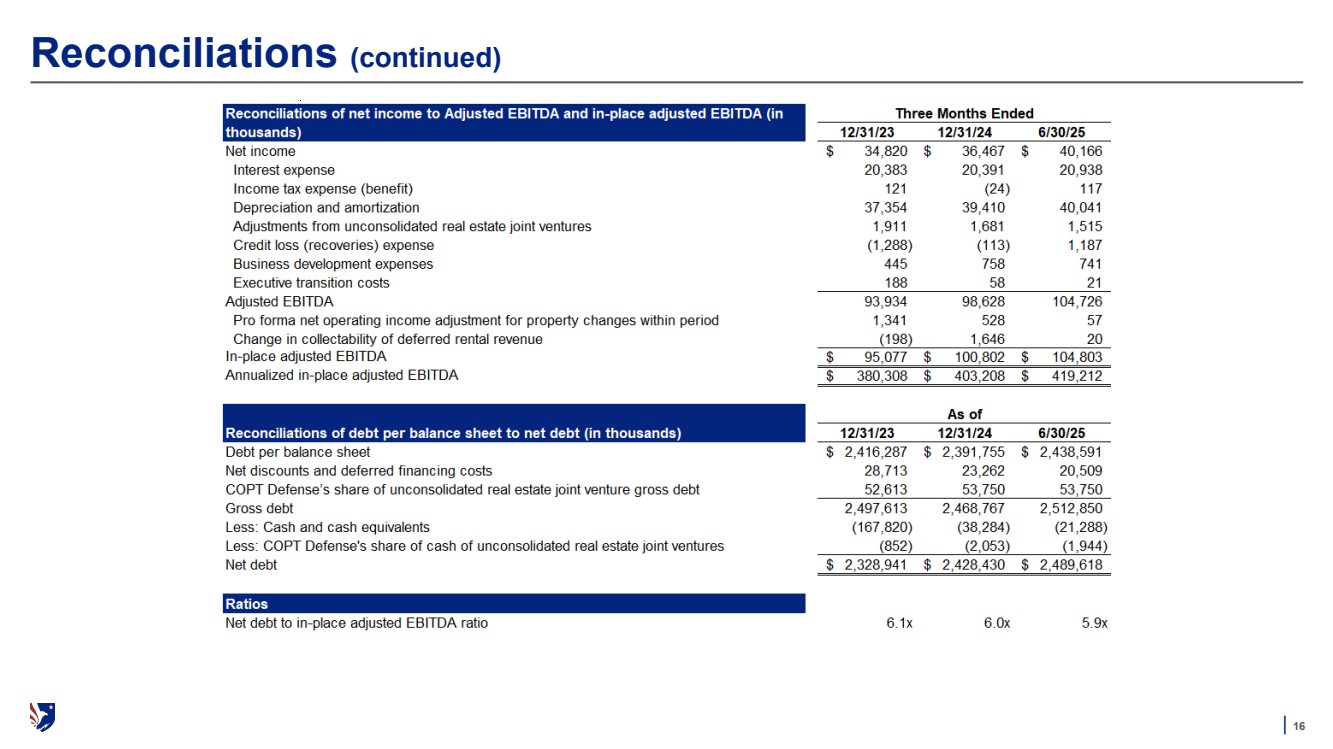
| | 16 Reconciliations (continued) |
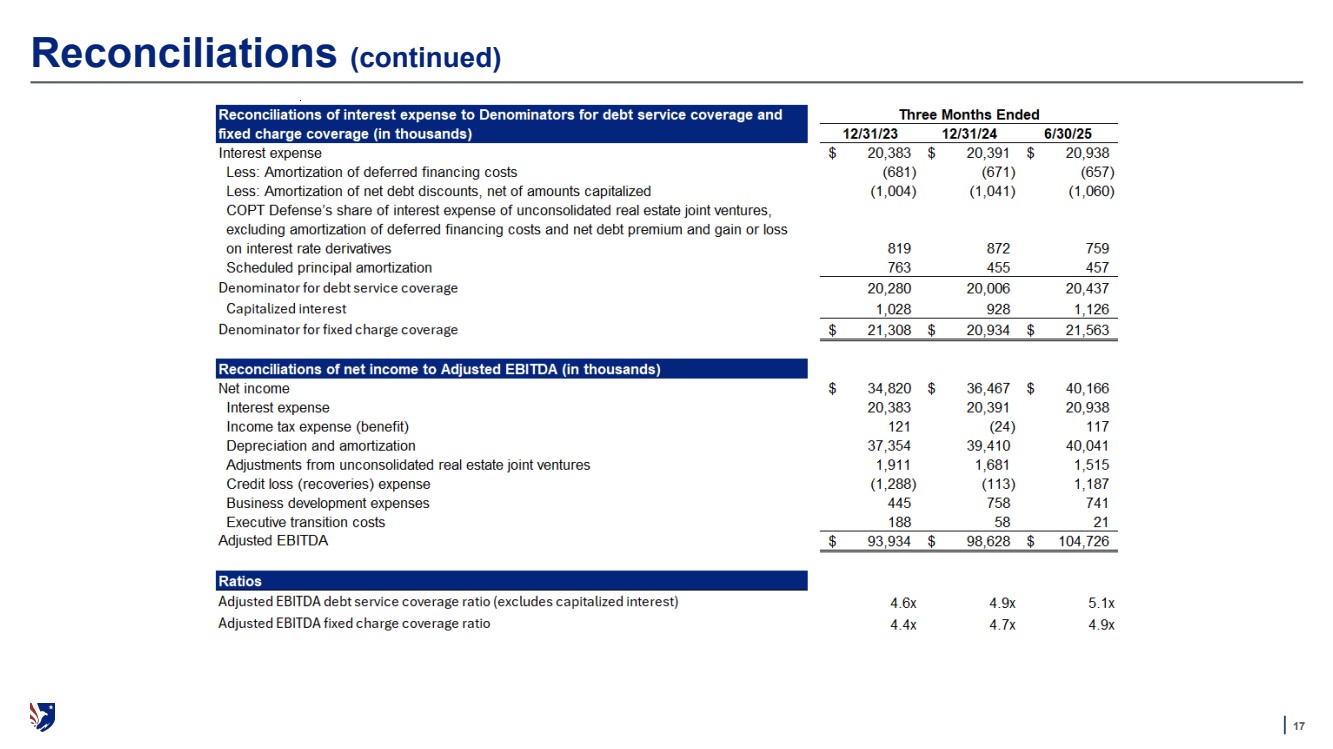
| | 17 Reconciliations (continued) |
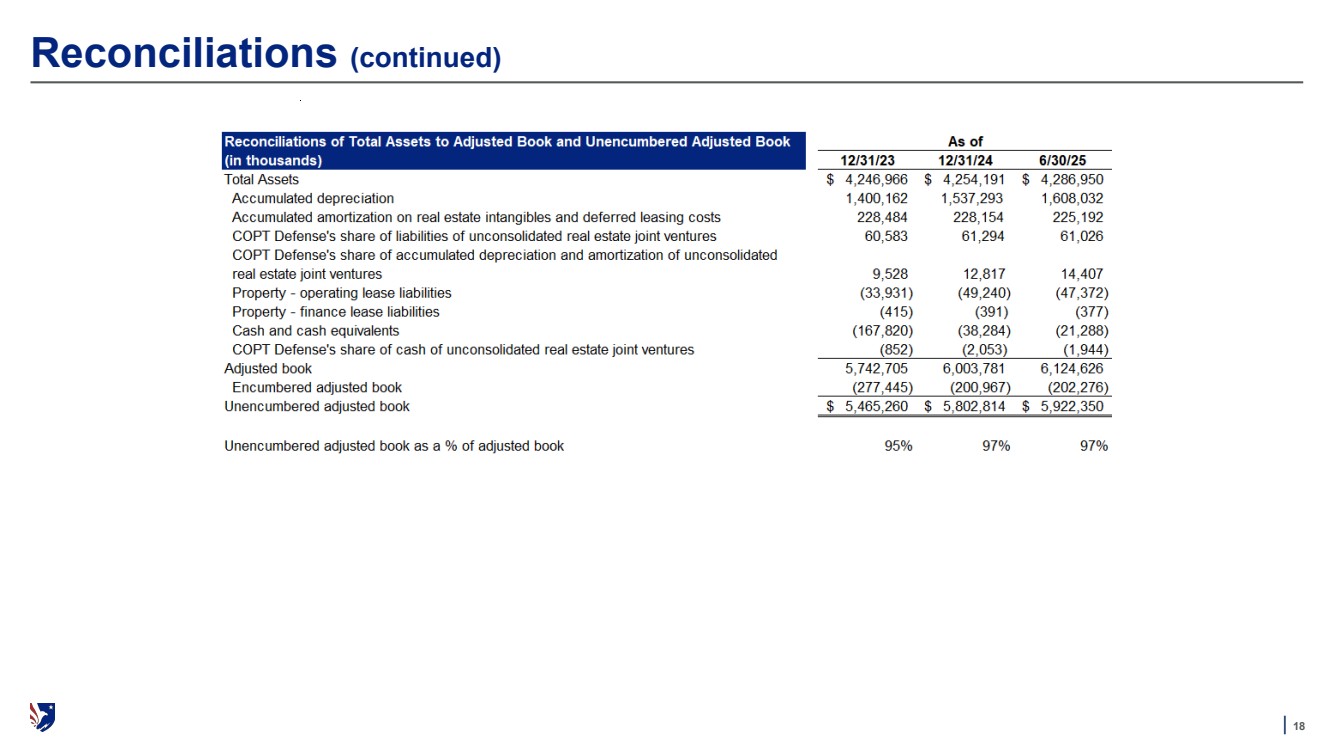
| | 18 Reconciliations (continued) |