

Exhibit 99.3
Feldman Financial Advisors, Inc.
8804 Mirador Place
McLean, VA 22102
(202) 467-6862
Pioneer Federal Deer Lodge, Montana
Conversion Valuation Appraisal Report Valued as of September 2, 2025
Prepared By
Feldman Financial Advisors, Inc. McLean, Virginia |
Feldman Financial Advisors, Inc.
8804 Mirador Place
McLean, VA 22102
(202) 467-6862
September 2, 2025
Board of Directors
Pioneer Federal Savings and Loan Association
202 North Main Street
Deer Lodge, Montana 59722
Members of the Board of Directors:
At your request, we have completed and hereby provide an independent appraisal (the “Appraisal”) of the estimated pro forma market value of Pioneer Federal Savings and Loan Association (“Pioneer Federal” or the “Association”) as of September 2, 2025 in conjunction with Pioneer Federal’s conversion (the “Conversion”) from the mutual form of organization to the stock form of organization by means of a merger with and into a newly formed Montana state-chartered stock bank to be known as Pioneer State Bank (the “Bank”), issuance of all of the Bank’s capital stock to a newly formed stock holding company known as PSB Financial, Inc. (“PSB Financial”) and offering for sale of PSB Financial’s common stock to eligible depositors of the Association, the Association’s employee stock ownership plan, and certain members of the general public in the subscription and community offering (the “Stock Offering”).
The Conversion is being undertaken pursuant to a Plan of Conversion adopted by the Board of Directors of Pioneer Federal. The Appraisal is furnished pursuant to the filing by the Association and the Company of regulatory applications with respect to the Conversion and Stock Offering with the Montana Division of Banking and Financial Institutions (“MDOB”), the Federal Deposit Insurance Corporation (“FDIC”), the Board of Governors of the Federal Reserve System (“Federal Reserve Board”), and the Securities and Exchange Commission (“SEC”).
Feldman Financial Advisors, Inc. (“Feldman Financial”) is a financial consulting and advisory firm that specializes in valuations and analyses of business enterprises and securities in the thrift, banking, and insurance industries. The background of Feldman Financial is presented in Exhibit I. In preparing the Appraisal, we conducted an analysis of Pioneer Federal that included discussions with the Association’s management, the Association’s legal counsel, Godfrey & Kahn S.C., and the Association’s independent registered public accounting firm, Wipfli LLP.
In addition, where appropriate, we considered information based on other available published sources that we believe are reliable; however, we cannot guarantee the accuracy and completeness of such information. We also reviewed, among other factors, the economy in Pioneer Federal’s primary market area and compared the Association’s financial condition and operating performance with that of selected publicly traded thrift institutions. We reviewed conditions in the securities markets in general and in the market for thrift institution common stocks in particular.
Feldman Financial Advisors, Inc.
Board of Directors
Pioneer Federal Savings and Loan Association
September 2, 2025
Page Two
The Appraisal is based on Pioneer Federal’s representation that the information in the Conversion applications and additional evidence furnished to us by Pioneer Federal and its independent auditor are truthful, accurate, and complete. We did not independently verify the financial statements and other information provided by Pioneer Federal and its independent accounting firm, nor did we independently value the assets or liabilities of Pioneer Federal. The Appraisal considers Pioneer Federal only as a going concern and should not be considered as an indication of the liquidation value of Pioneer Federal.
Pursuant to the Plan of Conversion adopted and approved by Pioneer Federal’s Board of Directors, the Association will convert from the mutual to the stock form of organization and merge with and into the Bank. When the Conversion and Stock Offering are completed, all of the outstanding capital stock of the Bank will be owned by PSB Financial, and all of the common stock of PSB Financial will be owned by its stockholders.
The Bank will operate as a wholly-owned subsidiary of PSB Financial. The Bank will succeed to all of the rights, obligations, duties, and liabilities of Pioneer Federal, and all banking operations previously conducted by Pioneer Federal will be conducted through the Bank. The Bank will be subject to examination and regulation by the MDOB, as its chartering authority, and also subject to examination by the FDIC, its primary federal regulator and deposit insurer. PSB Financial will be a bank holding company subject to regulation and supervision by the Federal Reserve Board.
It is our opinion that, as of September 2, 2025, the estimated pro forma market value of Pioneer Federal was within a range (the “Valuation Range”) of $10,200,000 to $13,800,000 with a midpoint of $12,000,000. Pursuant to applicable appraisal guidelines, the Valuation Range was based upon a decrease of approximately 15% from the midpoint value to determine the minimum value and an increase of approximately 15% from the midpoint value to establish the maximum value. Assuming an additional increase of approximately 15% above the maximum value would result in an adjusted maximum of $15,870,000. Based on an initial offering price of $10.00 per share, the number of shares to be sold in the Stock Offering is as follows: 1,020,000 at the minimum, 1,200,000 at the midpoint, 1,380,000 at the maximum, and 1,587,000 at the adjusted maximum of the offering range.
Our Appraisal is not intended, and must not be construed, to be a recommendation of any kind as to the advisability of purchasing shares of common stock in the Stock Offering. Moreover, because the Appraisal is necessarily based upon estimates and projections of a number of matters, all of which are subject to change from time to time, no assurance can be given that persons who purchase shares of stock in the Stock Offering will thereafter be able to sell such shares at prices related to the foregoing estimate of the Association’s pro forma market value. Feldman Financial is not a seller of securities within the meaning of any federal or state securities laws, and any report prepared by Feldman Financial shall not be used as an offer or solicitation with respect to the purchase or sale of any securities.
Feldman Financial Advisors, Inc.
Board of Directors
Pioneer Federal Savings and Loan Association
September 2, 2025
Page Three
The Valuation Range reported herein will be updated as appropriate. These updates will consider, among other factors, any developments or changes in Pioneer Federal’s operating performance, financial condition, or management policies, and current conditions in the securities markets for thrift institution common stocks. Should any such new developments or changes be material, in our opinion, to the valuation of Pioneer Federal, appropriate adjustments to the estimated pro forma market value will be made. The reasons for any such adjustments will be explained in detail at that time.
| Respectfully submitted, | |
| Feldman Financial Advisors, Inc. | |
| |
| Trent R. Feldman | |
| President | |
| | |
| Peter W. L. Williams | |
| Principal | |
Feldman Financial Advisors, Inc.
TABLE OF CONTENTS
| TAB | PAGE |
| INTRODUCTION | 1 |
| I. | Chapter One – Business of Pioneer Federal | ||
| General Overview | 3 | ||
| Financial Condition | 9 | ||
| Income and Expense Trends | 19 | ||
| Interest Rate Risk Management | 26 | ||
| Asset Quality | 30 | ||
| Office Facilities | 33 | ||
| Market Area | 34 | ||
| Summary Outlook | 42 | ||
| II. | Chapter Two – Comparisons with Publicly Traded Companies | ||
| General Overview | 43 | ||
| Selection Criteria | 44 | ||
| Recent Financial Comparisons | 48 | ||
| III. | Chapter Three – Market Value Adjustments | ||
| General Overview | 61 | ||
| Earnings Growth and Viability | 62 | ||
| Financial Condition | 63 | ||
| Market Area | 63 | ||
| Management | 65 | ||
| Dividend Payments | 66 | ||
| Liquidity of the Stock Issue | 66 | ||
| Subscription Interest | 67 | ||
| Recent Acquisition Activity | 69 | ||
| Stock Market Conditions and New Issue Discount | 69 | ||
| Adjustments Conclusion | 77 | ||
| Valuation Approach | 77 | ||
| Valuation Conclusion | 80 | ||
| IV. | Appendix -- Exhibits | |||
| I | Background of Feldman Financial Advisors,Inc. | I-1 | ||
| II-1 | Balance Sheets | II-1 | ||
| II-2 | Income Statements | II-2 | ||
| II-3 | Loan Portfolio Composition | II-3 | ||
| II-4 | Cash and Investments Composition | II-4 | ||
| II-5 | Deposit Accounts Composition | II-5 | ||
| III | Financial and Market Data for All Public Thrifts | III-1 | ||
| IV-1 | Pro Forma Assumptions for the Stock Offering | IV-1 | ||
| IV-2 | Pro Forma Conversion Valuation Range | IV-2 | ||
| IV-3 | Pro Forma Conversion Analysis at the Midpoint Value | IV-3 | ||
| IV-4 | Comparative Valuation Ratio Analysis | IV-4 | ||
i
Feldman Financial Advisors, Inc.
LIST OF TABLES
| TAB | PAGE |
| I. | Chapter One – Business of Pioneer Federal | |||
| Table 1 | Selected Financial Condition Data | 9 | ||
| Table 2 | Relative Balance Sheet Concentrations | 10 | ||
| Table 3 | Income Statement Summary | 20 | ||
| Table 4 | Income Statement Ratios | 21 | ||
| Table 5 | Yield and Cost Summary | 23 | ||
| Table 6 | Economic Value of Equity | 27 | ||
| Table 7 | Net Interest Income Sensitivity | 29 | ||
| Table 8 | Non-performing Asset Summary | 31 | ||
| Table 9 | Allowance for Credit Losses on Loans | 32 | ||
| Table 10 | Selected Demographic Data | 37 | ||
| Table 11 | Branch Office Deposit Data | 39 | ||
| Table 12 | Deposit Market Share in Powell County and Beaverhead County | 40 | ||
| II. | Chapter Two – Comparisons with Publicly Traded Companies | |||
| Table 13 | Comparative Group Operating Summary | 47 | ||
| Table 14 | Key Financial Comparisons | 49 | ||
| Table 15 | General Operating Characteristics | 56 | ||
| Table 16 | Summary Financial Performance Ratios | 57 | ||
| Table 17 | Income and Expense Analysis | 58 | ||
| Table 18 | Balance Sheet Composition | 59 | ||
| Table 19 | Growth Rates, Credit Risk, and Loan Composition | 60 | ||
| III. | Chapter Three – Market Value Adjustments | |||
| Table 20 | Comparative Market Area Data | 64 | ||
| Table 21 | Summary of Montana Bank and Thrift Acquisition Activity | 70 | ||
| Table 22 | Comparative One-Year Stock Market Index Performance | 71 | ||
| Table 23 | Comparative Three-Year Stock Market Index Performance | 72 | ||
| Table 24 | Summary of Standard Conversion Stock Offerings | 75 | ||
| Table 25 | Comparative Pro Forma Market Valuation Analysis | 82 | ||
ii
Feldman Financial Advisors, Inc.
INTRODUCTION
At your request, we have completed and hereby provide an independent appraisal (the “Appraisal”) of the estimated pro forma market value of Pioneer Federal Savings and Loan Association (“Pioneer Federal” or the “Association”) as of September 2, 2025 in conjunction with Pioneer Federal’s conversion (the “Conversion”) from the mutual form of organization to the stock form of organization by means of a merger with and into a newly formed Montana state-chartered stock bank to be known as Pioneer State Bank (the “Bank”), issuance of all of the Bank’s capital stock to a newly formed stock holding company known as PSB Financial, Inc. (“PSB Financial”) and offering for sale of PSB Financial’s common stock to eligible depositors of the Association, the Association’s employee stock ownership plan, and certain members of the general public in the subscription and community offering (the “Stock Offering”).
The Conversion is being undertaken pursuant to a Plan of Conversion adopted by the Board of Directors of Pioneer Federal. The Appraisal is furnished pursuant to the filing by the Association and the Company of regulatory applications with respect to the Conversion and Stock Offering with the Montana Division of Banking and Financial Institutions (“MDOB”), the Federal Deposit Insurance Corporation (“FDIC”), the Board of Governors of the Federal Reserve System (“Federal Reserve Board”), and the Securities and Exchange Commission (“SEC”).
Feldman Financial Advisors, Inc. (“Feldman Financial”) is a financial consulting and advisory firm that specializes in valuations and analyses of business enterprises and securities in the thrift, banking, and insurance industries. The background of Feldman Financial is presented in Exhibit I. In preparing the Appraisal, we conducted an analysis of Pioneer Federal that included discussions with the Association’s management, the Association’s legal counsel, Godfrey & Kahn S.C., and the Association’s independent registered public accounting firm, Elliott Davis, LLC.
1
Feldman Financial Advisors, Inc.
The Appraisal is based on the Association’s representation that the information in the Conversion applications and additional evidence furnished to us by the Association and its independent auditor are truthful, accurate, and complete. We did not independently verify the financial statements and other information provided by the Association and its independent accounting firm, nor did we independently value the assets or liabilities of the Association. The Appraisal considers the Association only as a going concern and should not be considered as an indication of the liquidation value of the Association.
Our Appraisal is not intended, and must not be construed, to be a recommendation of any kind as to the advisability of purchasing shares of common stock in the Stock Offering. Moreover, because the Appraisal is necessarily based upon estimates and projections of a number of matters, all of which are subject to change from time to time, no assurance can be given that persons who purchase shares of stock in the Stock Offering will thereafter be able to sell such shares at prices related to the foregoing estimate of the Association’s pro forma market value. Feldman Financial is not a seller of securities within the meaning of any federal or state securities laws, and any report prepared by Feldman Financial shall not be used as an offer or solicitation with respect to the purchase or sale of any securities.
The Valuation Range reported herein will be updated as appropriate. These updates will consider, among other factors, any developments or changes in the Association’s operating performance, financial condition, or management policies, and current conditions in the securities markets for thrift institution common stocks. Should any such new developments or changes be material, in our opinion, to the valuation of the Association, appropriate adjustments to the estimated pro forma market value will be made. The reasons for any such adjustments will be explained in detail at that time.
2
Feldman Financial Advisors, Inc.
I. Business of Pioneer Federal
General Overview
Pioneer Federal is a state-chartered mutual savings and loan association headquartered in Deer Lodge, Montana. Originally established in 1912, the Association conducts its operations from its main office in Deer Lodge, Montana, and a branch office in Dillon, Montana. The Association’s business consists primarily of accepting deposits from the general public and investing those deposits, together with funds generated from operations, in one- to four-family residential mortgage loans secured by properties located in its primary market area. To a significantly lesser extent, the Association also originates commercial real estate loans, construction and land development loans, commercial business loans, home equity loans and lines of credit, and automobile and other consumer loans. In addition, the Association offers electronic banking services including online banking, bill payment, automated teller machines (“ATMs”), debit cards, and mobile banking.
At June 30, 2025, Pioneer Federal had total assets of $113.3 million, total deposits of $85.8 million, net total loans of $85.1 million, and total equity of $18.4 million (measuring 16.27% of total assets). The Association reported net income of $224,000 for the year ended December 31, 2024 and net income of $126,000 for the six months ended June 30, 2025. The Association’s deposits are insured up to applicable limits by the FDIC. The Association is subject to examination and regulation by the MDOB, as its chartering authority, and also subject to examination by the FDIC, its primary federal regulator and deposit insurer. The Association is a member of the Federal Home Loan Bank (“FHLB”) of Des Moines. At June 30, 2025, the Association had 21 full-time employees.
3
Feldman Financial Advisors, Inc.
Since its inception, the Association has operated as a traditional savings institution focused primarily on serving the banking needs of customers in its primary market area of Powell and Beaverhead Counties in southwestern Montana, as well as contiguous counties and areas. The Association’s primary market area is predominantly rural with centralized town centers. Deer Lodge is the county seat of Powell County and had an estimated 2025 population of 3,097. Dillon is the county seat of Beaverhead County and had an estimated 2025 population of 4,196. Powell County had an estimated 2025 population of 7,229 and Beaverhead County had an estimated 2025 population of 10,136. In January 2024, Pioneer Federal relocated its main office in Deer Lodge from Milwaukee Avenue to a new state-of-the-art building on North Main Street. Both Deer Lodge and Dillon are close to the population hub of Butte, Montana, with Dillon located approximately 60 miles southwest of Butte and Deer Lodge located approximately 35 miles northwest of Butte.
The Association’s long operating history has provided it with a familiarity of its local communities and customer base. The Association believes that it has a strong community reputation as a residential mortgage lender, and its staff and management are easily accessible for customers. The Association continues to stress customer service and is community focused through its staff that is knowledgeable of the local customer base and very active in community endeavors. The Association relies on its experienced and committed staff to meet the needs of customers. The Association’s mission statement is:
Pioneer Federal Savings and Loan Association is dedicated to providing quality services and products to its customers all the while remaining financially strong and adding value to the quality of life in the communities it serves.
Over the past ten years, the Association has focused on conservative lending, controlled growth, and an emphasis on managing liquidity and maintaining solid capital levels. The Association’s total assets increased at a compound annual growth rate (“CAGR”) of 1.8% from $93.7 million at December 31, 2014 to $112.1 million at December 31, 2024. The Association’s total loans increased at a CAGR of 4.1% from $58.5 million at December 31, 2014 to $87.5 million at December 31, 2024. The Association’s ratio of total loans to total deposits expanded from 74.8% at year-end 2014 to 102.9% at year-end 2024. Over this same time period, the Association’s ratio of total equity to total assets increased moderately from 15.79% at year-end 2014 to 16.19% at year-end 2024. The Association was steadily profitable over the past ten years with earnings averaging 0.39% of average total assets.
4
Feldman Financial Advisors, Inc.
The Association’s current operating goal is to position the organization to succeed in an evolving and competitive financial services landscape and enhance its position as one of the leading community banking institutions in its market. The Association believes that it can provide long-term value to its customers, employees, future stockholders, and the communities it serves by executing a prudent business strategy that generates increasing profitability.
Pioneer Federal also believes there is a significant opportunity for a community-focused banking institution to continue to compete effectively in its primary market area and that the increased capital it will have after the completion of the Stock Offering will facilitate this objective. The core elements of the Association’s business strategy are outlined in more detail below:
| ● | Continue to focus on originating one- to four-family residential mortgage loans for retention in the Association’s loan portfolio. The Association is primarily a one- to four-family residential mortgage loan lender for borrowers in its primary market area. As of June 30, 2025, $73.2 million, or 84.5% of its total loan portfolio, consisted of residential first lien mortgage loans. The Association expects that residential mortgage lending will remain its primary lending activity. |
| ● | Modestly increase the relative volume of commercial loans, including real estate and non-real estate secured loans by expanding the Association’s commercial underwriting and administration staff. While Pioneer Federal plans to continue its historical focus on the origination of residential mortgage loans, the Association intends to prudently increase its originations of commercial real estate loans and commercial business loans to diversify its loan portfolio and increase yield, while seeking to manage credit and other risks related to commercial lending. At June 30, 2025, commercial real estate loans amounted to $4.4 million, or 5.1% of total loans, and commercial business loans amounted to $1.1 million, or 1.3% of total loans. |
5
Feldman Financial Advisors, Inc.
| ● | Maintain strong asset quality through conservative loan underwriting practices. The Association intends to maintain strong asset quality through conservative underwriting standards, active credit monitoring, well-defined policies and procedures, and employing experienced credit professionals. As of June 30, 2025, the Association’s non-performing assets measured 0.63% of total assets. |
| ● | Continue to grow low-cost “core” deposits. Core deposits include all deposits other than certificates of deposit. The Association plans to continue its efforts to increase its core deposits to provide additional fee income and a stable source of funds to support loan growth at costs consistent with improving its interest rate spread and net interest margin. Core deposits totaled $56.2 million, or 65.4% of total deposits, at June 30, 2025. Pioneer Federal believes that expansion of its commercial lending activity will enhance its ability to attract core deposits from commercial customers. |
| ● | Remain a community-oriented institution and continue to rely on high quality service to maintain and build a loyal customer base. The Association was established in 1912 and has been operating continuously in southwestern Montana since that time. Through the goodwill it has developed over years of providing timely and efficient banking services, the Association believes that it has been able to attract a loyal base of local customers on which it seeks to continue to build its banking business. |
| ● | Strengthen the Association’s digital-based banking capabilities. Pioneer Federal recognizes that customers can be expected to seek out banking institutions that offer a broad array of digital banking services. The Association plans to continue to implement plans to enhance its technology platform to remain an attractive option for current and potential customers, including converting to a new main data processing vendor as anticipated sometime in 2026. |
| ● | Grow organically and through opportunistic branching. The Association plans to grow its balance sheet organically on a managed basis. Moreover, the capital that the Association is raising through the Stock Offering will enable it to increase its lending and investment capacity. In addition to organic growth, the Association may also consider expansion opportunities in its market area or in contiguous markets. The capital raised from the Stock Offering would help fund any such opportunities that may arise. The Association is considering the addition of a branch office in western Montana in one or two years, but currently has no specific plans or intentions regarding any such expansion activities. |
6
Feldman Financial Advisors, Inc.
While its equity level is solid at 16.27% of total assets as of June 30, 2025, the Association believes it must raise additional capital in order to facilitate its growth objectives and loan generation activity, and provide a greater cushion in response to the risk profile associated with continued expansion and future economic conditions. As a stock organization upon completion of the Conversion, the Company and the Association will be organized in the ownership form used by commercial banks, most major businesses, and a large number of thrift institutions. The ability to raise new equity capital through the issuance and sale of capital stock will allow the Company and the Association the flexibility to increase its equity capital position more rapidly than by accumulating earnings.
The Association also believes that the ability to attract new capital will also help address the needs of the communities it serves and enhance its ability to expand or make acquisitions. After the Conversion, the Association will have an increased ability to merge with or acquire other financial institutions or business enterprises; however, there are no current arrangements, understandings, or agreements regarding any such acquisition opportunities. Finally, the Association expects to benefit from its employees and directors having stock ownership in its business, since that is viewed as an effective performance incentive and a means of attracting, retaining, and compensating employees and directors.
In summary, the Association’s primary reasons for implementing the Conversion and undertaking the Stock Offering are to:
| ● | Increase capital to support future growth and profitability.
|
|
| ● | Retain and attract qualified personnel by establishing stock-based benefit plans for management and employees.
|
|
|
● | Offer customers and employees an opportunity to acquire an equity interest in the Bank by purchasing shares of common stock of PSB Financial. |
7
Feldman Financial Advisors, Inc.
Moving forward, the Association’s strategic priorities have been identified and emphasized as described below:
| ● | Growth – grow lending and core deposits by gaining market share in the Association’s primary market area. |
| ● | Profitability – continue to improve the overall profitability of the Association through margin improvements, expanded services, and cost management. |
| ● | Service – continue efforts to improve the Association’s customer service and overall customer experience, including enhanced technology capabilities. |
| ● | Personnel – continue to augment the expertise, abilities, and productivity of the Association’s staff and the overall organizational management processes |
The remainder of Chapter I examines in more detail the trends addressed in this section, including the impact of changes in the Association’s economic and competitive environment, and recent strategic initiatives. The discussion is supplemented by the exhibits in the Appendix. Exhibit II-1 presents the Association’s balance sheets as of December 31, 2023 and 2024 and June 30, 2025. Exhibit II-2 summarizes the Association’s income statements for the years ended December 31, 2023 and 2024 and the six months ended June 30, 2024 and 2025.
8
Feldman Financial Advisors, Inc.
Financial Condition
Table 1 presents selected data concerning Pioneer Federal’s financial position as of December 31, 2023 and 2024 and June 30, 2025. Table 2 displays relative balance sheet concentrations as of similar period-end dates.
Table 1
Selected Financial Condition Data
As of December 31, 2023 and 2024 and June 30, 2025
(Dollars in Thousands)
| June 30, | December 31, | |||||||||||
| 2025 | 2024 | 2023 | ||||||||||
| Total assets | $ | 113,259 | $ | 112,109 | $ | 112,728 | ||||||
| Cash and cash equivalents | 9,199 | 6,433 | 10,193 | |||||||||
| Available-for-sale securities | 9,412 | 9,538 | 11,304 | |||||||||
| Held-to-maturity securities | 1,850 | 2,005 | 2,836 | |||||||||
| Other investments | 715 | 729 | 713 | |||||||||
| Total loans, net | 85,132 | 86,327 | 81,036 | |||||||||
| Cash value of life insurance | 754 | 744 | 764 | |||||||||
| Premises and equipment, net | 4,977 | 5,118 | 4,715 | |||||||||
| Total deposits | 85,842 | 85,090 | 86,071 | |||||||||
| Federal Home Loan Bank advances | 8,000 | 8,000 | 8,000 | |||||||||
| Total equity | 18,428 | 18,154 | 17,829 | |||||||||
Source: Pioneer Federal Savings and Loan Association, financial statements.
Asset Composition
The Association’s total assets amounted to $113.3 million at June 30, 2025, reflecting a 1.0% or $1.1 million increase from total assets of $112.1 million at December 31, 2024. In the prior year, the Association’s total assets decreased by 0.6% or $619,000 from $112.7 million at December 31, 2023 to $112.1 million at December 31, 2024. The recent increase in total assets was primarily due to an increase of $2.8 million in cash and cash equivalents, partially offset by a decrease of $1.2 million in net loans.
9
Feldman Financial Advisors, Inc.
Table 2
Relative Balance Sheet Concentrations
As of December 31, 2023 and 2024 and June 30, 2025
(Percent of Total Assets)
| June 30, | December 31, | |||||||||||
| 2025 | 2024 | 2023 | ||||||||||
| Cash and cash equivalents | 8.12 | % | 5.74 | % | 9.04 | % | ||||||
| Available-for-sale securities | 8.31 | 8.51 | 10.03 | |||||||||
| Held-to-maturity securities | 1.63 | 1.79 | 2.52 | |||||||||
| Other investments | 0.63 | 0.65 | 0.63 | |||||||||
| Total loans, net | 75.17 | 77.00 | 71.89 | |||||||||
| Cash value of life insurance | 0.67 | 0.66 | 0.68 | |||||||||
| Premises and equipment, net | 4.39 | 4.57 | 4.18 | |||||||||
| Other assets | 1.08 | 1.08 | 1.03 | |||||||||
| Total assets | 100.00 | % | 100.00 | % | 100.00 | % | ||||||
| Total deposits | 75.79 | % | 75.90 | % | 76.36 | % | ||||||
| Federal Home Loan Bank advances | 7.06 | 7.14 | 7.10 | |||||||||
| Other liabilities | 0.87 | 0.77 | 0.73 | |||||||||
| Total liabilities | 83.73 | 83.81 | 84.18 | |||||||||
| Total equity | 16.27 | 16.19 | 15.82 | |||||||||
| Total liabilities and equity | 100.00 | % | 100.00 | % | 100.00 | % | ||||||
Source: Pioneer Federal Savings and Loan Association, financial statements.
Net total loans increased by $5.3 million or 6.5% from $81.0 million at year-end 2023 to $86.3 million at year-end 2024. The loan growth in 2024 was generated mainly from one- to four-family residential mortgage loans and commercial real estate loans. The decrease in net loans during the first half of 2025 reflected sluggish mortgage loan demand due to the appreciating market value of residential properties, which has continued to price out local market borrowers. As a result of the recent decrease in the Association’s loan portfolio, the percentage of net total loans decreased from 77.0% of total assets at December 31, 2024 to 75.2% of total assets at June 30, 2025 after increasing from 71.9% of total assets at December 31, 2023.
10
Feldman Financial Advisors, Inc.
Cash and cash equivalents increased by $2.8 million from $6.4 million at December 31, 2024 to $9.2 million at June 30, 2025. The recent increase in cash and cash equivalents was primarily attributable to an increase of deposits, along with paydowns of loan balances and investment securities. The aggregate amount of cash and investment securities increased by $2.5 million from $18.7 million, or 16.7% of total assets, at December 31, 2024 to $21.2 million, or 18.7% of total assets, at June 30, 2025.
The largest segment of the Association’s loan portfolio comprises residential real estate mortgage loans. As of June 30, 2025, one- to four-family residential mortgage loans accounted for $73.2 million or 84.5% of total loans as illustrated in Exhibit II-3. The Association’s loan portfolio also included commercial real estate loans ($4.4 million or 5.1% of total loans), home equity loans and lines of credit ($3.5 million or 4.1% of total loans), construction and land development loans ($3.0 million or 3.4% of total loans), other consumer loans ($1.3 million or 1.5% of total loans), and commercial business loans ($1.1 million or 1.3% of total loans).
The Association’s loan originations totaled $16.2 million for the year ended December 31, 2024 and $5.2 million for the six months ended June 30, 2025. Residential mortgage loans comprised the bulk of the origination volume during these periods, followed by construction loans and home equity lines of credit. Pioneer Federal periodically utilizes loan participations as a tool for serving the local communities and to diversify its loan portfolio. Loan participations also help the Association limit its lending risk by diversifying both geographical and collateral distribution. The Association maintains internal limits on the amount of a purchased loan participation in any one project and the aggregate exposure to loan participations in its loan portfolio.
Pioneer Federal’s one- to four-family residential mortgage loans are almost entirely fixed-rate loans. The Association’s residential mortgage loans originated in the primary market area are generally underwritten to Fannie Mae secondary market standards. Pioneer Federal generally charges a modest premium on the interest rate compared to market competitors as the Association’s loans are not sold into the secondary market, allowing direct contact with the borrower over the life of the loan. Terms on the Association’s residential mortgage loans vary with maturities of up to 30 years. Loan-to-value (“LTV”) ratios on residential mortgage loans are limited to 80% of the purchase price or appraised value, whichever is lower. Pioneer Federal does not offer or originate higher-risk loans such as subprime loans on one- to four-family residential properties.
11
Feldman Financial Advisors, Inc.
Pioneer Federal originates home equity lines of credit (“HELOCs”) and home equity loans, which are generally secured by first or second mortgages on owner-occupied residences. HELOCs have a 10-year revolving period with a 20-year amortization term, as the customer has the option to extend the 10-year revolving period when each 10-year period is coming due. HELOCs are fixed-rate for the first six months and then are indexed to the Wall Street Journal prime rate plus a 1.0% margin. A 0.125% rate reduction option is available for automatic payment and the same rate reduction is offered if the deposit account is maintained at Pioneer Federal. The LTV ratio for HELOCs and home equity loans is generally up to 80%, taking into account any superior mortgage on the collateral property. HELOCs are generally underwritten in the same manner as Pioneer Federal’s one- to four-family residential mortgage loans.
Commercial real estate loans and commercial business loans have not historically comprised a significant portion of Pioneer Federal’s total loan portfolio. While the Association expects that one- to four-family residential real estate lending will continue to be its primary emphasis of lending operations, Pioneer Federal intends to modestly increase its emphasis on commercial real estate loans and commercial business loans in an effort to increase the overall loan portfolio yield.
12
Feldman Financial Advisors, Inc.
Pioneer Federal’s commercial loan portfolio (including commercial real estate and commercial business loans) consists of approximately 20 loans with an aggregate principal balance of $5.6 million as of June 30, 2025. The Association has not historically originated in-house commercial loans and instead has purchased loan participations of commercial loans (real estate and non-real estate) through purchase relationships with two Montana-based financial institutions. The commercial loans in portfolio are secured by both owner-occupied and non-owner-occupied properties, as well as business-related assets with essentially all loans secured by property within Montana. The commercial real estate and non-real estate loans (participations) are generally fixed-rate for the first five years of the loan with an interest rate generally at the Wall Street Journal prime rate plus 1.0%. The interest rate adjusts every five years thereafter. Commercial real estate loans generally have terms up to 25 years. LTV ratios of commercial real estate loans are generally limited to 75% of the purchase price or appraised value, whichever is lower.
At June 30, 2025, Pioneer Federal’s largest purchased participation interest had an outstanding balance of $1.0 million, representing a 31% participation interest in a $3.95 million commercial real estate loan secured by a Powell County medical center. At June 30, 2025, the Association also had a line of credit participation purchased with a maximum credit of $1.75 million, representing 2.2% participation interest in an $81.5 million loan, secured by government-backed accounts receivable. As of June 30, 2025, the Association was not aware of any participation interests for which the loan is non-performing.
Pioneer Federal had $2.9 million in construction and land development loans as of June 30, 2025. The Association originates one-close construction/permanent loans, primarily to individuals for the construction of their primary residences and occasionally to contractors and builders of single-family homes. These loans combine the construction financing and the permanent mortgage into one closing, and after the construction period the loan converts to a permanent one-to four-family residential mortgage loan. Residential construction loans are underwritten to the same guidelines for permanent residential mortgage loans. Construction loans generally can be made with a maximum LTV ratio of 80% of the estimated appraised market value upon completion of the project. Pioneer Federal also originates a limited amount of land development loans to complement the construction lending activities, as such loans are generally secured by lots that will be used for residential development.
13
Feldman Financial Advisors, Inc.
The Association’s consumer loans totaled $1.3 million as of June 30, 2025. Pioneer Federal’s consumer loan portfolio generally consists of loans secured predominantly by automobiles and trucks (new and used). Consumer loans have fixed interest rates and terms of up to six years, with LTV ratios generally capped at 80% of the invoice price (for new vehicles) or 75% of the lesser of National Automobile Dealers Association trade-in value (for used vehicles) or purchase price.
Exhibit II-4 presents a summary of the Association’s portfolio of cash, short-term liquidity, and investment securities as of December 31, 2023 and 2024 and June 30, 2025. Consistent with its Investment Policy, the Association’s primary investment objectives are to (1) provide and maintain adequate liquidity and to meet any reasonable decline in deposits and any anticipated increase in the loan portfolio; (2) reduce interest rate risk and its impact on both earnings and the market value of the balance sheet; (3) maintain safety through a balance of high-quality, diversified investments with minimum risk characteristics; (4) provide collateral for pledging requirements; and (5) maximize returns consistent with the Association’s liquidity and safety requirements.
The Association’s Board of Directors is responsible for establishing appropriate risk limits and for reviewing and approving the Investment Policy at least annually. The Investment Committee, comprised of the Chief Executive Officer (“CEO”) and at least two appointed members of the Board of Directors, is responsible for developing, implementing, and approving investment strategies and monitoring investment activities. The CEO is responsible for proposing investment strategies and for executing, approved portfolio strategies. The Association’s current Investment Policy authorizes, with certain limitations, investments in U.S. Treasury and federal agency securities, mortgage-backed securities, collateralized mortgage obligations, corporate debt, commercial paper, state and municipal securities, mutual funds, federal funds, and interest-bearing deposits in other financial institutions, among other investments.
14
Feldman Financial Advisors, Inc.
As shown in Exhibit II-4, the Association’s aggregate cash and investments amounted to $21.2 million or 18.7% of total assets as of June 30, 2025. Cash and cash equivalents amounted to $9.2 million or 8.1% of the Association’s total assets as of June 30, 2025. Cash and cash equivalents increased decreased from $6.4 million or 5.7% of total assets as of year-end 2024 as the Association experienced excess liquidity due to sluggish residential mortgage demand and increased deposit flows.
The Association’s available-for-sale securities portfolio, reported at fair value, totaled $9.4 million or 8.3% of total assets at June 30, 2025 and was composed of $5.5 million of mortgage-backed securities, $2.9 million of municipal and state obligations, and $1.0 million of U.S. Government and federal agency securities. The Association’s mortgage-backed securities are issued or guaranteed by U.S. Government-sponsored enterprises. The held-to-maturity securities portfolio, reported at amortized cost, totaled $1.8 million or 1.6% of total assets at June 30, 2025 and was composed of $975,000 of municipal and state obligations, $790,000 of mortgage-backed securities, and $84,000 of U.S. Government and federal agency securities. As of June 30, 2025, the Association had net unrealized losses of $575,000 in its available-for-sale securities portfolio $88,000 in its held-to-maturity securities portfolio. The Association also owned $427,000 of common stock in the FHLB of Des Moines and $287,000 in mutual funds as of June 30, 2025.
15
Feldman Financial Advisors, Inc.
Liability Composition
Deposits are the Association’s primary external source of funds for lending and investment purposes. Exhibit II-5 presents a summary of the Association’s deposit composition as of December 31, 2023 and 2024 and June 30, 2025. Total deposits amounted to $85.8 million or 75.8% of total assets and 90.5% of total liabilities at June 30, 2025. Total deposits increased by 0.9% or $752,000 from $85.1 million at December 31, 2024 to $85.8 million at June 30, 2025. Pioneer Federal offers checking accounts, savings accounts, tiered money market accounts, certificate of deposits accounts, and individual retirement account (“IRA”) certificates.
The Association’s total certificate accounts decreased by $3.0 million or 9.2% from $32.7 million or 38.4% of total deposits at year-end 2024 to $29.7 million or 34.6% of total deposits at June 30, 2025. The decline was partially due to the Association opting not to compete for higher-cost certificate accounts. Core deposits, defined as total deposits excluding certificate of deposit accounts, increased by $3.8 million or 7.2% from $52.4 million at year-end 2024 to $56.2 million at June 30, 2025. The ratio of core deposits to total deposits increased from 61.6% at December 31, 2024 to 65.4% at June 30, 2025, while the concentration of certificate deposits to total deposits decreased from 38.4% to 34.6% over the same time period.
The Association relies on customer service and longstanding relationships with customers in its primary market area to attract and retain deposits. Deposit account terms vary according to the minimum balance required, the time period that funds must remain on deposit, and the interest rate, among other factors. In determining the rates and terms of its deposit accounts, the Association considers the rates offered by competitors, liquidity needs, growth objectives, current operating strategies, and customer preferences and concerns. The Association has placed a concerted emphasis on attracting core deposit accounts, which tend to represent lower cost and more stable funding sources. For the six months ended June 30, 2025, the Association’s weighted average cost of core deposits was 0.37%, the weighted average cost of certificate accounts was 3.30%, and the overall weighted average cost of total deposits was 0.82%.
16
Feldman Financial Advisors, Inc.
As a member of the FHLB of Des Moines, the Association may obtain FHLB borrowings based upon the security of FHLB capital stock owned and certain of the Association’s residential real estate mortgage loans. Historically, the Association has not actively utilized FHLB borrowings as a source of funds. However, in September 2023, the Association obtained a $8.0 million FHLB advance that carries a fixed rate of 4.30% and matures in September 2028. The FHLB borrowing was used to support funding the construction of a new office facility in Deer Lodge and also for funding loan growth. At June 30, 2025, Pioneer Federal had additional borrowing capacity of $37.7 million from the FHLB of Des Moines. The Association also has a federal funds line of credit with its main correspondent institution. Federal funds purchased generally mature within one to four days from the transaction date. The Association had no federal funds purchased as of December 31, 2024 or June 30, 2025.
Equity Capital
The Association has historically maintained solid capital levels and its total equity amounted to $18.4 million or 16.27% of total assets at June 30, 2025. The ratio of total equity to assets increased from 16.19% at December 31, 2024 and 15.82% at December 31, 2023. Profitable operating results contributed to recent increases in the Association’s total equity. As of June 30, 2025, the Association’s total equity was composed of $18.7 million in retained earnings, offset by $305,000 in accumulated other comprehensive loss (“AOCL”). The Association’s AOCL reflects the after-tax effect of unrealized losses on available-for-sale securities. The Association’s AOCL improved by $100,000 for the year ended December 31, 2024 and $149,000 for the six months ended June 30, 2025. The recent decline in market interest rates had the effect of reducing the amount of net unrealized losses in the Association’s available-for-sale securities portfolio.
17
Feldman Financial Advisors, Inc.
Pioneer Federal’s capital level remains strong in comparison to minimum regulatory requirements. The Association has qualified for and elected to use the community bank leverage ratio (“CBLR”) framework for regulatory capital requirement purposes. An institution opting into the CBLR framework and meeting all requirements under the framework will be considered to have met the well-capitalized ratio requirements and is be required to report or calculate risk-based capital ratios. As of June 30, 2025, the required CBLR level was a tier 1 leverage capital ratio greater than or equal to 9.0%. The Association’s tier 1 leverage capital ratio increased from 16.45% at December 31, 2023 to 16.81% at December 31, 2024 and 17.00% at June 30, 2025. Based on the CBLR requirement, the Association was considered well capitalized for regulatory capital purposes as of June 30, 2025.
18
Feldman Financial Advisors, Inc.
Income and Expense Trends
Table 3 displays the main components of the Association’s earnings performance for the years ended December 31, 2023 and 2024 and the six months ended June 30, 2024 and 2025. Table 4 displays the Association’s principal income and expense ratios as a percent of average assets for the corresponding periods. Table 5 displays the Association’s weighted average yields on interest-earning assets and weighted average costs of interest-bearing liabilities.
Six Months Ended June 30, 2024 and 2025
Net income for the six months ended June 30, 2025 was $126,000, a decrease of $79,000 or 38.6%, compared to $205,000 for the six months ended June 30, 2024. The decrease was due to the combination of a non-recurring gain on the sale of the former Deer Lodge office location in 2024 of $311,000 along with an increase of $90,000 in professional fees incurred in 2025 in preparation for the Conversion. Pioneer Federal’s annualized return on average assets (“ROA”) measured 0.22% for the six months ended June 30, 2025, compared to 0.37% for the six months ended June 30, 2024.
The Association’s net interest income increased by $161,000 or 10.1% from $1.6 million for the six months ended June 30, 2024 to $1.7 million for the six months ended June 30, 2025. The net interest spread improved by 27 basis points from 2.63% in the first half of 2024 to 2.90% in the first half of 2025. The yield on interest-earning assets increased by 29 basis points from 4.63% to 4.92% over the comparative periods, while the cost of interest-bearing liabilities increased by only 2 basis points from 2.00% to 2.02%. Increases in the overall loan portfolio yield drove the improvements in the net interest spread. Relative to average assets, annualized net interest income increased from 2.81% to 3.10%.
19
Feldman Financial Advisors, Inc.
Table 3
Income Statement Summary
For the Years Ended December 31, 2023 and 2024
And the Six Months Ended June 30, 2024 and 2025
(Dollars in Thousands)
| Six Months Ended | Year Ended | |||||||||||||||
| June 30, | December 31, | |||||||||||||||
| 2025 | 2024 | 2024 | 2023 | |||||||||||||
| Total interest income | $ | 2,600 | $ | 2,436 | $ | 5,015 | $ | 4,381 | ||||||||
| Total interest expense | 867 | 864 | 1,823 | 1,088 | ||||||||||||
| Net interest income | 1,733 | 1,572 | 3,192 | 3,293 | ||||||||||||
| Provision for (recovery of) credit losses | (104 | ) | - | 28 | 35 | |||||||||||
| Net interest income after provision | 1,837 | 1,572 | 3,164 | 3,258 | ||||||||||||
| Total non-interest income | 128 | 414 | 495 | 268 | ||||||||||||
| Total non-interest expense | 1,831 | 1,722 | 3,362 | 3,136 | ||||||||||||
| Income before income taxes | 135 | 264 | 297 | 390 | ||||||||||||
| Income tax expense | 9 | 59 | 73 | 133 | ||||||||||||
| Net income | $ | 126 | $ | 205 | $ | 224 | $ | 257 | ||||||||
Source: Pioneer Federal Savings and Loan Association, financial statements.
Pioneer Federal recorded a $104,000 recovery on credit losses on loans for the six months ended June 30, 2025, compared to no provision or recovery for the six months ended June 30, 2024 As a result, the Association’s ratio of allowance for credit losses on loans to total loans decreased from 1.37% at December 31, 2024 to 1.27% at June 30, 2025. Non-performing assets decreased from $1.7 million or 1.53% of total assets at December 31, 2024 to $718,000 or 0.63% of total assets at June 30, 2025. Management’s determination of the adequacy of the allowance for credit losses was based, in part, on the low balances of non-accrual loans, delinquent loans, and net charge-offs in the first half of 2025 and prior periods.
20
Feldman Financial Advisors, Inc.
Table 4
Income Statement Ratios
For the Years Ended December 31, 2023 and 2024
And the Six Months Ended June 30, 2024 and 2025
(Percent of Average Assets)
| Six Months Ended | Year Ended | |||||||||||||||
| June 30, | December 31, | |||||||||||||||
| 2025(1) | 2024(1) | 2024 | 2023 | |||||||||||||
| Total interest income | 4.65 | % | 4.36 | 4.47 | % | 3.88 | % | |||||||||
| Total interest expense | 1.55 | 1.55 | 1.62 | 0.96 | ||||||||||||
| Net interest income | 3.10 | 2.81 | 2.84 | 2.92 | ||||||||||||
| Provision for (recovery of) credit losses | (0.19 | ) | 0.00 | 0.02 | 0.03 | |||||||||||
| Net interest income after provision | 3.29 | 2.81 | 2.82 | 2.89 | ||||||||||||
| Total non-interest income | 0.23 | 0.74 | 0.44 | 0.24 | ||||||||||||
| Total non-interest expense | 3.28 | 3.08 | 2.99 | 2.78 | ||||||||||||
| Income before income taxes | 0.24 | 0.47 | 0.26 | 0.35 | ||||||||||||
| Income tax expense | 0.02 | 0.10 | 0.07 | 0.12 | ||||||||||||
| Net income | 0.22 | 0.37 | 0.20 | 0.23 | ||||||||||||
(1) Annualized ratios for the period.
Source: Pioneer Federal Savings and Loan Association, financial data.
Non-interest income totaled $128,000 for the six months ended June 30, 2025, a decrease of $286,000 or 69.0% from $414,000 for the six months ended June 30, 2024. Excluding the gain on the sale of the former office location in the first half of 2024, non-interest income increased by $25,000 or 24.4% from $103,000 (or 0.18% annualized to average assets) to $128,000 (or 0.23% annualized to average assets) over the comparative periods. Interchange fees are the largest contributor of non-interest revenue and increased from $56,000 in the first half of 2024 to $87,000 in the first half of 2025. Service fees declined moderately from $36,000 in the first half of 2024 to $30,000 in the first half of 2025.
21
Feldman Financial Advisors, Inc.
The Association’s non-interest expense increased by $109,000 or 6.3% to $1.8 million for the six months ended June 30, 2025, compared to $1.7 million for the six months ended June 30, 2024. The increase in non-interest expense was due primarily to a $90,000 or 144.3% increase in professional fees and a $26,000 or 10.9% increase in occupancy costs. As previously noted, the increase in professional fees was mainly incurred in preparation for the Conversion. The increase in occupancy costs reflected the increased depreciation expense associated with the Association’s new office building in Deer Lodge. The ratio of annualized non-interest expense to average assets increased from 3.08% in the first half of 2024 to 3.15% in the first half of 2025.
Income tax expense declined from $60,000 for the six months ended June 30, 2024 to $9,000 for the six months ended June 30, 2025. The decrease was chiefly due to the decline in pre-tax income from $264,000 to $135,000 over the observed periods. The effective tax rate declined from 22.6% in the first half of 2024 to 6.6% in the first half of 2025.
Years Ended December 31, 2023 and 2024
Net income declined by $33,000 or 13.0% from $257,000 for the year ended December 31, 2023 to $224,000 for the year ended December 31, 2024. The Association’s ROA decreased from 0.23% for the year ended December 31, 2023 to 0.20% for the year ended December 31, 2024. The primary reasons for the decline in earnings were a $100,000 decrease in net interest income and a $226,000 increase in non-interest expense, offset partially by a $227,000 increase in non-interest income. The decrease in net interest income was largely attributable to a decrease in the Association’s net interest spread from 2.79% in 2023 to 2.65% in 2024. The increase in non-interest expense was attributable to an increase of $260,000 in occupancy costs related to the opening of the new office location in Deer Lodge. The increase in non-interest income primarily reflected the gain on the sale of the former office location in Deer Lodge.
22
Feldman Financial Advisors, Inc.
Table 5
Yield and Cost Summary
For the Years Ended December 31, 2023 and 2024
And the Six Months Ended June 30, 2024 and 2025
| Six Months Ended | Year Ended | |||||||||||||||
| June 30, | December 31, | |||||||||||||||
| 2025(1) | 2024(1) | 2024 | 2023 | |||||||||||||
| Weighted Average Yields | ||||||||||||||||
| Interest-bearing deposits | 2.95 | % | 5.64 | % | 5.32 | % | 2.47 | % | ||||||||
| Investment securities | 2.64 | 2.31 | 2.71 | 2.43 | ||||||||||||
| Loans | 5.37 | 4.95 | 5.01 | 4.55 | ||||||||||||
| Other investments | 9.37 | 8.88 | 9.11 | 1.80 | ||||||||||||
| Total interest-earning assets | 4.92 | 4.63 | 4.77 | 4.05 | ||||||||||||
| Weighted Average Costs | ||||||||||||||||
| Interest-bearing demand deposits | 0.20 | 0.20 | 0.21 | 0.20 | ||||||||||||
| Savings deposits | 2.06 | 1.10 | 1.12 | 0.84 | ||||||||||||
| Certificate of deposit accounts | 3.28 | 3.17 | 3.31 | 2.18 | ||||||||||||
| Total interest-bearing deposits | 1.78 | 1.76 | 1.89 | 1.23 | ||||||||||||
| Federal Home Loan Bank advances | 4.33 | 4.35 | 4.38 | 4.34 | ||||||||||||
| Total interest-bearing liabilities | 2.02 | 2.00 | 2.12 | 1.25 | ||||||||||||
| Net interest rate spread (2) | 2.90 | 2.63 | 2.65 | 2.79 | ||||||||||||
| Net interest margin (3) | 3.28 | 2.99 | 3.03 | 3.04 | ||||||||||||
| (1) | Annualized ratios. |
| (2) | Weighted average yield on interest-earning assets less the weighted average cost of interest-bearing liabilities. |
| (3) | Net interest income divided by average total interest-earning assets. |
Source: Pioneer Federal Savings and Loan Association, financial data.
Net interest income decreased by $100,000 or 3.0% to $3.2 million for the year ended December 31, 2024 compared to $3.3 million for the year ended December 31, 2023. The decrease reflects the decrease of 14 basis points in the net interest rate spread to 2.65% for the year ended December 31, 2024 from 2.79% for the year ended December 31, 2023, while average interest-earning assets decreased by $3.0 million or 2.8% on a year-to-year basis. The Association’s weighted average yield on interest-earning assets increased by 72 basis points from 4.05% in 2023 to 4.77% in 2024. In contrast, the weighted average cost of interest-bearing liabilities increased by 87 basis points from 1.25% in 2023 to 2.12% in 2024. Total interest income increased by $634,000 or 14.5% in 2024, while total interest expense increased by $734,000 or 67.4%. The increase in interest expense was impacted by a full year’s effect of the FHLB borrowing outstanding in 2024 and a broad increase in market interest rates on deposits.
23
Feldman Financial Advisors, Inc.
The aggregate provision for credit losses decreased from $35,000 in 2023 to $28,000 in 2024. The provision for losses on loans increased from $18,000 to $68,000, while the provision for losses on unfunded commitments decreased from $17,000 to a recovery of $40,000. Net loan charge-offs amounted to zero in 2023 and 2024. The allowance for credit losses on loans increased by $68,000 from $1.1 million (1.38% of total loans) at December 31, 2023 to $1.2 million (1.37% of total loans) at December 31, 2024. Non-performing loans increased from $597,000 as of December 31, 2023 to $1.7 million as of December 31, 2024. The increase was largely due to an increase of $582,000 in non-accrual residential mortgage loans.
Non-interest income totaled $495,000 for the year ended December 31, 2024, an increase of $227,000 or 84.6% from $268,000 for the year ended December 31, 2023. The increase was primarily due to a $311,000 gain on the sale of the former office in Deer Lodge following the opening of a new office location. Excluding the property sale gain, non-interest income decreased by $84,000 or 31.3% from $268,000 (or 0.25% of average assets) in 2023 to $184,000 (or 0.16% of average assets) in 2024. Interchange fees decreased by $11,000 or 7.4% from $138,000 in 2023 to $127,000 in 2024. The Association recorded a gain of $56,000 on the increase in the cash value of life insurance in 2023, but reported a decrease of $19,000 in 2024 due to the change in the cash value of life insurance.
24
Feldman Financial Advisors, Inc.
The Association’s non-interest expense increased by $226,000 or 7.2% to $3.4 million for the year ended December 31, 2024, compared to $3.1 million for the year ended December 31, 2023. The increase was due primarily to a $260,000 or 114.5% increase in occupancy costs as a result of the construction of a new office building in Deer Lodge. Salaries and employee benefits decreased by $19,000 or 1.2% and amounted to $1.6 million for the year ended December 31, 2024. The ratio of non-interest expense to average assets increased from 2.96% for the year ended December 31, 2023 to 3.00% for the year ended December 31, 2024.
Income tax expense decreased by $60,000 or 44.7% to $73,000 for the year ended December 31, 2024, compared to $133,000 for the year ended December 31, 2023. The decrease was due primarily to a $93,000 or 23.8% decrease in pre-tax income. The effective tax rates were 34.1% and 24.7% for the years ended December 31, 2023 and 2024.
25
Feldman Financial Advisors, Inc.
Interest Rate Risk Management
The Association seeks to reduce its earnings vulnerability and capital risk to changes in market interest rates by managing the mismatch between asset and liability maturities and interest rates. The Association’s Asset/Liability Committee (“ALCO”) focuses on ensuring a stable and steadily increasing flow of net interest income through managing the asset and liability mix of the balance sheet. The ALCO is expected to integrate the Association’s asset/liability management process into its operational decision making, including portfolio structure, investments, business planning, funding decisions, and pricing.
The Association attempts to manage the exposure of the net interest margin to unexpected changes due to interest rate fluctuations. The Association’s goal is not to eliminate interest rate risk, but to produce results that are consistent with the need for adequate liquidity, adequate capital, projected growth, acceptable risk, and appropriate profitability standards. The Association has interest rate risk guidelines that define the maximum potential reduction in net interest income and equity that the Association is prepared to accept. The Association has implemented various strategies to manage its interest rate risk. By enacting these strategies, the Association believes that it is better positioned to react to changes in market interest rates. These strategies include:
| · | Maintaining capital levels that exceed the thresholds for well-capitalized status under federal regulations. |
| · | Maintaining a high level of liquidity and investments. |
| · | Growing core deposit accounts that provide a stable, low-cost source of funds. |
| · | Managing the investment securities portfolio in a manner to reduce the average maturity and effective life of the portfolio. |
| · | Continuing to diversify the loan portfolio by adding more commercial real estate loans and commercial business loans, which typically have shorter maturities and/or balloon payments. |
26
Feldman Financial Advisors, Inc.
The Association monitors its interest rate sensitivity management through the use of models which generate estimates of the change in its net portfolio value of equity (economic value of equity or “EVE”) over a range of interest rate scenarios. EVE represents the market value of portfolio equity, which is different from book value, and is equal to the market value of assets minus the market value of liabilities (representing the difference between incoming and outgoing discounted cash flows of assets and liabilities) with adjustments made for off-balance sheet items. The EVE ratio, under any interest rate scenario, is defined as the EVE in that scenario divided by the market value of assets in the same scenario. Table 6 sets forth the Association’s EVE as of June 30, 2025 and reflects the changes to EVE as a result of the changes in interest rates as indicated.
Table 6
Economic Value of Equity
As of June 30, 2025
(Dollars in Thousands)
| Basis Point Change in Interest Rates (1) | Estimated EVE (2) ($000s) | Amount Change from Level ($000s) | Percent Change from Level | EVE Ratio (3) | Basis Point Change in EVE Ratio | |||||||||||||||
| + 300 b.p. | $ | 15,235 | $ | (3,116 | ) | (16.98 | )% | 13.47 | % | (276 | ) b.p. | |||||||||
| + 200 b.p. | 16,210 | (2,141 | ) | (11.67 | )% | 14.33 | % | (189 | ) b.p. | |||||||||||
| + 100 b.p. | 17,246 | (1,105 | ) | (6.02 | )% | 15.25 | % | (98 | ) b.p. | |||||||||||
| Level | 18,351 | -- | -- | 16.23 | % | -- | ||||||||||||||
| - 100 b.p. | 19,459 | 1,108 | 6.04 | % | 17.21 | % | 98 | b.p. | ||||||||||||
| - 200 b.p. | 20,649 | 2,298 | 12.52 | % | 18.26 | % | 203 | b.p. | ||||||||||||
| - 300 b.p. | 21,928 | 3,577 | 19.49 | % | 19.39 | % | 316 | b.p. | ||||||||||||
(1) Assumes an immediate uniform change in interest rates at all maturities.
(2) EVE is the discounted present value of expected cash flows from assets, liabilities, and off-balance sheet contracts.
(3) EVE ratio represents EVE divided by the present value of assets, which is calculated as the discounted value of incoming cash flows on interest-earning assets.
Source: Pioneer Federal Savings and Loan Association, financial data.
27
Feldman Financial Advisors, Inc.
Table 6 indicates that at June 30, 2025, in the event of an instantaneous 100 basis point increase in interest rates, the Association would experience a 6.0% decrease in EVE. In the event of an instantaneous 100 basis point decrease in interest rates, the Association would experience a 6.0% increase in EVE. In the event of an instantaneous 200 basis point increase in interest rates, the Association would experience an 11.7% decrease in EVE. In the event of an instantaneous 200 basis point decrease in interest rates, the Association would experience a 12.5% increase in EVE. Because of the Association’s relatively high concentration of fixed-rate loans, dramatic increases in the interest rate scenario produces broad declines in Pioneer Federal’s resulting EVE because assets decline in value significantly more than liabilities lose in value. The EVE simulations give no effect to any steps that the Association might take to counter the impact of such interest rate movement.
In addition to modeling changes in EVE, the Association also analyzes potential changes to net interest income for a 12-month period under rising and falling interest rate scenarios. The Association estimates its net interest income for a 12-month period, and then calculates what net interest income would be for the same period under the assumptions that the U.S. Treasury yield curve increases or decreases instantly by up to 300 basis points or decreases instantly by up to 300 basis points, in 100 point increments, with changes in interest rates representing immediate and permanent, parallel shifts in the yield curve.
Table 7 below sets forth, as of June 30, 2025, the calculation of the estimated changes in the Association’s net interest income resulting from the designated immediate changes in the U.S. Treasury yield curve. As shown in Table 7, an upward change of 100 basis points in market interest rates would decrease net interest income by $44,000 and an upward change of 200 basis points would decrease net interest income by $89,000. A downward upward change of 100 basis points in market interest rates would increase net interest income by $96,000 and an upward change of 200 basis points would increase net interest income by $184,000.
28
Feldman Financial Advisors, Inc.
Table 7
Net Interest Income Sensitivity
As of June 30, 2025
(Dollars in Thousands)
| Basis Point Change in Interest Rates (1) | Estimated Net Interest Income ($000s) | Change in Net Interest Income ($000s) | Percent Change from Level (%) | |||||||||
| + 300 b.p. | $ | 3,465 | $ | (135 | ) | (3.75 | )% | |||||
| + 200 b.p. | 3,511 | (89 | ) | (2.47 | )% | |||||||
| + 100 b.p. | 3,556 | (44 | ) | (1.22 | )% | |||||||
| Level | 3,600 | -- | -- | |||||||||
| - 100 b.p. | 3,696 | 96 | 2.67 | % | ||||||||
| - 200 b.p. | 3,784 | 184 | 5.11 | % | ||||||||
| - 200 b.p. | 3,861 | 261 | 7.25 | % | ||||||||
(1) Assumes an immediate uniform change in interest rates at all maturities.
Source: Pioneer Federal Savings and Loan Association, financial data.
29
Feldman Financial Advisors, Inc.
Asset Quality
Table 8 summarizes the Association’s total non-performing assets as of December 31, 2023 and 2024 and June 30, 2025. Historically, the Association has a solid record of reporting satisfactory asset quality. Pioneer Federal’s emphasis on residential mortgage lending in its primary market area has contributed to the consistently low level of loan delinquencies and charge-offs. Non-accrual loans increased from zero at December 31, 2023 to $585,000 at December 31, 2024, and subsequently declined to $111,000 at June 30, 2025. Relative to total loans, non-accrual loans declined from 0.67% at December 31, 2024 to 0.13% at June 30, 2025. The increase of non-accrual loans was chiefly due to an increase in non-accrual residential mortgage loans to $582,000, which declined to $108,000 as of June 30, 2025. The Association had no foreclosed assets or troubled debt restructurings as of December 31, 2023 and 2024 and June 30, 2025. The Association’s ratio of non-performing assets to total assets increased from 0.53% at December 31, 2023 to 1.53% at December 31, 2024 before declining to 0.63% at June 30, 2025.
Table 9 summarizes Pioneer Federal’s allowance for credit losses on loans (“ACL”) as of and for the years ended December 31, 2023 and 2024 and the six months ended June 30, 2025. Effective January 1, 2023, the Association began to use a current expected credit loss (“CECL”) model to estimate the ACL. The ACL decreased from $1.2 million at December 31, 2024 to $1.1 million at June 30, 2025 following the recording of a $104,000 recovery on the ACL during the first half of 2025. Net charge-offs amounted to $5,000 or 0.01% of average loans in the first half of 2025. As a result, the ratio of the ACL to total loans decreased from 1.37% at December 31, 2024 to 1.27% at June 30, 2025. The ratio of the ACL to total non-performing loans increased from 70.4% at December 31, 2024 to 153.1% at June 30, 2025, mainly due to the decline in non-performing loans from $1.7 million at December 31, 2024 to $718,000 at June 30, 2025.
| 30 |
Feldman Financial Advisors, Inc.
Table 8
Non-performing Assets Summary
As of December 31, 2023 and 2024 and June 30, 2025
(Dollars in Thousands)
| June 30, | December 31, | |||||||||||
| 2025 | 2024 | 2023 | ||||||||||
| Non-accrual Loans | ||||||||||||
| Residential first lien mortgage loans | $ | 108 | $ | 582 | $ | - | ||||||
| Consumer loans | 3 | 3 | - | |||||||||
| Total non-accrual loans | 111 | 585 | - | |||||||||
| Accruing loans past due 30-89 days | 147 | 862 | 597 | |||||||||
| Accruing loans past due 90 days or more | 460 | 270 | - | |||||||||
| Total non-performing loans | $ | 718 | $ | 1,717 | $ | 597 | ||||||
| Real estate owned | - | - | - | |||||||||
| Total non-performing assets | $ | 718 | $ | 1,717 | $ | 597 | ||||||
| Total non-accrual loans to total loans | 0.13 | % | 0.67 | % | 0.00 | % | ||||||
| Total non-performing loans to total loans | 0.83 | % | 1.95 | % | 0.72 | % | ||||||
| Total non-performing assets to total assets | 0.63 | % | 1.53 | % | 0.53 | % | ||||||
Source: Pioneer Federal Savings and Loan Association, financial data.
| 31 |
Feldman Financial Advisors, Inc.
Table 9
Allowance for Credit Losses on Loans
As of or For the Years Ended December 31, 2023 and 2024
And the Six Months Ended June 30, 2025
(Dollars in Thousands)
| At or For the | ||||||||||||
| Six Months | At or For the | |||||||||||
| Ended | Year Ended | |||||||||||
| June 30, | December 31, | |||||||||||
| 2025 | 2024 | 2023 | ||||||||||
| Allowance at beginning of period | $ | 1,208 | $ | 1,141 | $ | 1,180 | ||||||
| Impact of adoption of CECL accounting standard | - | - | (57 | ) | ||||||||
| Provision for (recovery of) credit losses on loans | (104 | ) | 68 | 18 | ||||||||
| Charge-offs: | ||||||||||||
| Residential loans | - | - | - | |||||||||
| Commercial loans | - | - | - | |||||||||
| Consumer loans | (5 | ) | - | (1 | ) | |||||||
| Total charge-offs | (5 | ) | - | (1 | ) | |||||||
| Recoveries: | ||||||||||||
| Residential loans | - | - | - | |||||||||
| Commercial loans | - | - | - | |||||||||
| Consumer loans | - | - | 1 | |||||||||
| Total recoveries | - | - | 1 | |||||||||
| Net charge-offs | (5 | ) | - | - | ||||||||
| Allowance at end of period | $ | 1,099 | $ | 1,208 | $ | 1,141 | ||||||
| Allowance to non-performing loans | 153.06 | % | 70.37 | % | 191.06 | % | ||||||
| Allowance to gross total loans | 1.27 | % | 1.37 | % | 1.38 | % | ||||||
| Net charge-offs to average loans | 0.01 | % | 0.00 | % | 0.00 | % | ||||||
Source: Pioneer Federal Savings and Loan Association, financial data.
| 32 |
Feldman Financial Advisors, Inc.
Office Facilities
Pioneer Federal conducts business from its main office (approximately 6,500 square feet) located at 202 North Main Street in Deer Lodge, Montana, and a branch office (approximately 11,500 square feet) located at 32 North Washington Street in Dillon, Montana. Both of the Association’s offices are full-service facilities and offer a full range of consumer banking products. The Deer Lodge office was opened in January 2024 following the construction of a new state-of-the-art building. The former Milwaukee Avenue office in Deer Lodge was relocated to the new North Main Street office location. The offices in Deer Lodge and Dillon are owned by Pioneer Federal and utilized by the Association as the sole occupant. Both offices feature ATMs and drive-up access.
The net book value of the Association’s premises and equipment totaled $5.0 million (net of accumulated depreciation of $1.7 million) at June 30, 2025. Because of the construction of the new office, the Association’s net premises and equipment increased from $759,000 or 0.7% of total assets at December 31, 2021 to $5.0 million or 4.4% of total assets at June 30, 2025. The Association believes that its current facilities are adequate to meet its present and foreseeable needs, subject to possible future expansion. The Association presently has no specific plans regarding the establishment of new branch offices or loan production offices.
| 33 |
Feldman Financial Advisors, Inc.
Market Area
Overview of Market Area
Pioneer Federal operates its main office in Deer Lodge, Montana, which is located in Powell County, and a branch office in Dillon, Montana, which is located in Beaverhead County. The city of Deer Lodge had an estimated 2025 population of 3,097 and is the county seat of Powell County. Pioneer Federal relocated its main office in Deer Lodge from Milwaukee Avenue to a new office building on North Main Street in January 2024. The city of Dillon had an estimated 2025 population of 4,196 and is the county seat of Beaverhead County. Dillon is located approximately 90 miles south of Deer Lodge. Powell County had an estimated 2025 population of 7,229. Beaverhead County had an estimated 2025 population of 10,136. Pioneer Federal’s office network is presented in the maps on the following page.
The economy in Powell County is geared to agriculture, other natural resources, government, and health care. Many of the large and small ranches in Powell County are owned by fourth and fifth generation residents. Sun Mountain Lumber Company is the area’s largest private employer and provides work for both loggers and mill employees. The Montana State Prison and Montana State Hospital are major employers in the local area. The Grant-Kohrs Ranch National Historic Site is also located in Deer Lodge and offers historic ranch house tours, living history demonstrations, and nearly ten miles of ranch roads and trails to hike on a 1,600 acre working cattle ranch. Beaverhead County is the largest county by area in Montana and one of the largest cattle and hay producing regions in the state. The major employers in Beaverhead County include Barrett Hospital and HealthCare, Beaverhead County, and High Divide Minerals (talc mining and processing company). The University of Montana Western is a public college located in Dillon and has a total undergraduate enrollment of approximately 1,200 students.
| 34 |
Feldman Financial Advisors, Inc.
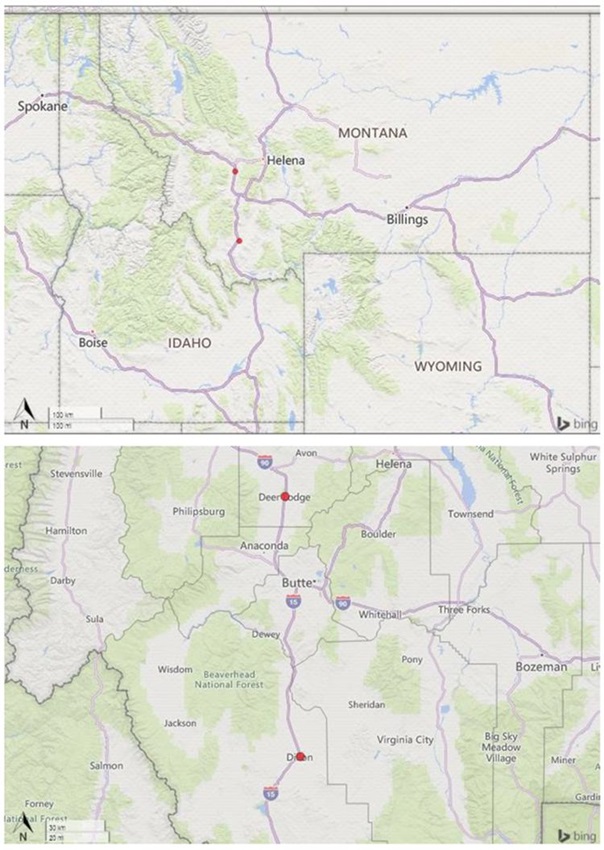
● Pioneer Federal Savings and Loan Association - full-service offices
| 35 |
Feldman Financial Advisors, Inc.
Table 10 provides selected demographic data for the United States, the state of Montana, Powell County, and Beaverhead County. The two-county market area is sparsely populated and predominantly rural with the economic centers located in small towns in both counties. Powell County’s population is projected to increase by 3.6% over the next five years to 7,486 in 2030, while Beaverhead County’s population is projected to increase by 6.3% to 10,777 in 2030. The median ages in Powell County and Beaverhead County were 45.0 years and 43.1 years, respectively, above the state and national median ages of 41.0 years and 39.7, years, respectively. The estimated 2025 median household income of Powell County was $64,818, below the state and national levels of $72,066 and $78,770, respectively. The estimated 2025 median household income for Beaverhead County was $63,124.
The median housing values in Powell County and Beaverhead County ware $333,763 and $385,610, respectively, below the state median of $440,442. The median monthly gross rents ranged from $673 in Powell County to $855 in Beaverhead County, compared to the state and national medians of $1,013 and $1,298. Over the next five years, housing units are projected to increase by 3.4% in Powell County and 2.8% in Beaverhead County, compared to 4.2% for the overall state of Montana.
The major industries for employment in Powell County included government, agriculture, health care, construction, and manufacturing. The leading industries for employment in Beaverhead County included agriculture, education, hospitality, health care, and retail trade. The unemployment rates in Powell County and Beaverhead County have hovered below the national unemployment averages. In June 2025, the unemployment rates in Powell County and Beaverhead County were 3.2% and 2.3%, compared to the national unemployment rate of 4.4%. The unemployment rate for the state of Montana was 2.8% in June 2025.
| 36 |
Feldman Financial Advisors, Inc.
Table 10
Selected Demographic Data
| United | State of | Powell | Beaverhead | |||||||||||||
| States | Montana | County | County | |||||||||||||
| Total Population | ||||||||||||||||
| 2025 - Estimated | 337,643,652 | 1,154,086 | 7,229 | 10,136 | ||||||||||||
| 2030 - Projected | 345,735,705 | 1,209,611 | 7,486 | 10,777 | ||||||||||||
| % Change 2020-25 | 1.87 | % | 6.44 | % | 4.07 | % | 8.16 | % | ||||||||
| % Change 2025-30 | 2.40 | % | 4.81 | % | 3.56 | % | 6.32 | % | ||||||||
| Age Distribution, 2025 | ||||||||||||||||
| 0 - 14 Age Group | 17.34 | % | 16.51 | % | 11.95 | % | 13.21 | % | ||||||||
| 15 - 34 Age Group | 26.52 | % | 25.78 | % | 24.32 | % | 27.53 | % | ||||||||
| 35 - 54 Age Group | 25.24 | % | 24.16 | % | 26.92 | % | 21.30 | % | ||||||||
| 55 - 69 Age Group | 18.13 | % | 18.92 | % | 21.44 | % | 20.64 | % | ||||||||
| 70+ Age Group | 12.76 | % | 14.63 | % | 15.37 | % | 17.32 | % | ||||||||
| Median Age (years) | 39.7 | 41.0 | 45.0 | 43.1 | ||||||||||||
| Median Household Income | ||||||||||||||||
| 2025 - Estimated | $ | 78,770 | $ | 72,066 | $ | 64,818 | $ | 63,124 | ||||||||
| 2030 - Projected | $ | 85,719 | $ | 79,306 | $ | 70,411 | $ | 68,830 | ||||||||
| % Change 2025-30 | 8.82 | % | 10.05 | % | 8.63 | % | 9.04 | % | ||||||||
| Average Household Income | ||||||||||||||||
| 2025 - Estimated | $ | 113,181 | $ | 97,966 | $ | 85,208 | $ | 91,130 | ||||||||
| 2030 - Projected | $ | 122,965 | $ | 108,658 | $ | 92,931 | $ | 100,093 | ||||||||
| % Change 2025-30 | 8.64 | % | 10.91 | % | 9.06 | % | 9.84 | % | ||||||||
| High School Graduate or Higher, | ||||||||||||||||
| % Age 25 Years-plus, 2025 | 89.42 | % | 94.14 | % | 92.31 | % | 93.89 | % | ||||||||
| Bachelor's Degree or Higher, | ||||||||||||||||
| % Age 25 Years-plus, 2025 | 35.11 | % | 34.47 | % | 19.52 | % | 36.14 | % | ||||||||
| In Civilian Labor Force, Total | ||||||||||||||||
| % Age 16 Years-plus, 2025 | 58.89 | % | 59.17 | % | 39.20 | % | 56.26 | % | ||||||||
| Unemployment Rate | ||||||||||||||||
| June 2023 | 3.8 | % | 2.6 | % | 2.8 | % | 2.4 | % | ||||||||
| June 2024 | 4.3 | % | 3.1 | % | 3.3 | % | 2.8 | % | ||||||||
| June 2025 | 4.4 | % | 2.8 | % | 3.2 | % | 2.3 | % | ||||||||
| 37 |
Feldman Financial Advisors, Inc.
Table 10 (continued)
Selected Demographic Data
| United | State of | Powell | Beaverhead | |||||||||||||
| States | Montana | County | County | |||||||||||||
| Total Households | ||||||||||||||||
| 2025 - Estimated | 129,687,464 | 477,200 | 2,487 | 4,454 | ||||||||||||
| % Change 2020-25 | 2.26 | % | 6.56 | % | 4.76 | % | 8.42 | % | ||||||||
| % Change 2025-30 | 2.70 | % | 4.95 | % | 4.06 | % | 3.25 | % | ||||||||
| Total Housing Units | ||||||||||||||||
| 2025 - Estimated | 144,349,531 | 545,436 | 3,014 | 5,267 | ||||||||||||
| % Change 2020-25 | 2.74 | % | 5.95 | % | 3.93 | % | 7.10 | % | ||||||||
| % Change 2025-30 | 2.73 | % | 4.24 | % | 3.42 | % | 2.77 | % | ||||||||
| Housing Unit Type, 2025 | ||||||||||||||||
| Owner-Occupied | 56.93 | % | 59.06 | % | 57.50 | % | 55.02 | % | ||||||||
| Renter-Occupied | 32.92 | % | 28.43 | % | 25.02 | % | 29.54 | % | ||||||||
| Vacant | 10.16 | % | 12.51 | % | 17.49 | % | 15.44 | % | ||||||||
| Owner-Occupied Housing Units Median Value, 2025 | $ | 364,711 | $ | 440,442 | $ | 333,763 | $ | 385,610 | ||||||||
| Median Gross Monthly Rent, 2025 | $ | 1,298 | $ | 1,013 | $ | 673 | $ | 855 | ||||||||
| Owner-Occupied Housing Unit Rate, 2025 (1) | 63.36 | % | 67.50 | % | 69.68 | % | 65.07 | % | ||||||||
(1) As a percentage of total number of households.
Source: S&P Global.
Overview of Office Network
Table 11 provides deposit data for the Association’s full-service banking offices as of June 30, 2020 to June 30, 2024. The Association’s deposits increased by 1.6% over the observed one-year period from June 30, 2023 to 2024 and increased by a CAGR of 2.6% over the four-year period from June 30, 2020 to 2024. The Association’s largest office based on deposits is the office in Deer Lodge, which had total deposits of $45.7 million or 52.9% of the Association’s total deposits at June 30, 2024. The Association’s office in Dillon had total deposits of $40.7 million or 47.1% of the Association’s total deposits at June 30, 2024. Deposit growth at Pioneer Federal’s Deer Lodge office reflected a four-year CAGR of 4.1%, while the Dillon office generated a four-year CAGR of 1.0%. Similar to most financial institutions, deposit growth accelerated in the 2021-2022 period due to pandemic-related governmental relief programs, such as stimulus payments.
| 38 |
Feldman Financial Advisors, Inc.
Table 11
Branch Office Deposit Data
Data as of June 30, 2020 to 2024
(Dollars in Thousands)
| Four-Year | ||||||||||||||||||||||||||||
| June 30, | CAGR | |||||||||||||||||||||||||||
| Address | City | County | 2024 | 2023 | 2022 | 2021 | 2020 | (%) | ||||||||||||||||||||
| 202 N. Main Street (1) | Deer Lodge | Powell | $ | 45,689 | $ | 44,540 | $ | 49,104 | $ | 46,154 | $ | 38,975 | 4.1 | % | ||||||||||||||
| 32 N. Washington Street | Dillon | Beaverhead | 40,672 | 40,491 | 47,504 | 42,845 | 39,054 | 1.0 | % | |||||||||||||||||||
| Total Deposits | $ | 86,361 | $ | 85,031 | $ | 96,608 | $ | 88,999 | $ | 78,029 | 2.6 | % | ||||||||||||||||
(1) Office was opened in January 2024 following the relocation of the former Milwaukee Avenue office in Deer Lodge.
Source: S&P Global.
Deposit Market Share Analysis
Table 12 displays branch deposit data for the financial institutions (commercial banks and thrift institutions) in Powell County and Beaverhead County as of June 30, 2024 (date of the most recently available industry data). Pioneer Federal ranked second in Powell County out of three financial institutions with deposits of $45.7 million in one office as of June 30, 2024 for a market share of 28.6%. The deposit market share leader in Powell County was First Security Bank of Deer Lodge with deposits of $74.2 million and a market share of 46.4%. Peoples Bank of Deer Lodge ranked third in Powell County with deposits of $40.1 million and a market share of 25.0%. The deposit market total in Powell County increased by 2.9% from $155.5 million at June 30, 2023 to $159.9 million at June 30, 2024.
| 39 |
Feldman Financial Advisors, Inc.
Table 12
Deposit Market Share in Powell County and Beaverhead County
Deposit Data as of June 30, 2023 and 2024
(Dollars in Thousands)
| June 30, 2024 | June 30, 2023 | 2023-24 | ||||||||||||||||||||||||||||
| 2024 | Branch | Market | Branch | Market | Deposit | |||||||||||||||||||||||||
| Market | Financial | No. of | Deposits | Share | Deposits | Share | Change | |||||||||||||||||||||||
| Rank | Institution | St. | Type | Offices | ($000s) | (%) | ($000s) | (%) | (%) | |||||||||||||||||||||
| Powell County, Montana | ||||||||||||||||||||||||||||||
| 1 | First Security Bank of Deer Lodge | MT | Bank | 1 | $ | 74,198 | 46.39 | $ | 74,058 | 47.64 | 0.19 | |||||||||||||||||||
| 2 | Pioneer Federal Savings and Loan Assn. | MT | Thrift | 1 | 45,689 | 28.57 | 44,540 | 28.65 | 2.58 | |||||||||||||||||||||
| 3 | Peoples Bank of Deer Lodge | MT | Bank | 1 | 40,056 | 25.04 | 36,865 | 23.71 | 8.66 | |||||||||||||||||||||
| 3 | $ | 159,943 | 100.00 | $ | 155,463 | 100.00 | 2.88 | |||||||||||||||||||||||
| Beaverhead County, Montana | ||||||||||||||||||||||||||||||
| 1 | Stockman Bank of Montana | MT | Bank | 1 | $ | 181,294 | 53.74 | $ | 174,672 | 53.57 | 3.79 | |||||||||||||||||||
| 2 | The Bank of Commerce | ID | Bank | 1 | 115,380 | 34.20 | 110,876 | 34.01 | 4.06 | |||||||||||||||||||||
| 3 | Pioneer Federal Savings and Loan Assn. | MT | Thrift | 1 | 40,672 | 12.06 | 40,491 | 12.42 | 0.45 | |||||||||||||||||||||
| 3 | $ | 337,346 | 100.00 | $ | 326,039 | 100.00 | 3.47 | |||||||||||||||||||||||
| Powell and Beaverhead Counties Combined | ||||||||||||||||||||||||||||||
| 1 | Stockman Bank of Montana | MT | Bank | 1 | $ | 181,294 | 36.46 | $ | 174,672 | 36.28 | 3.79 | |||||||||||||||||||
| 2 | The Bank of Commerce | ID | Bank | 1 | 115,380 | 23.20 | 110,876 | 23.03 | 4.06 | |||||||||||||||||||||
| 3 | Pioneer Federal Savings and Loan Assn. | MT | Thrift | 2 | 86,361 | 17.37 | 85,031 | 17.66 | 1.56 | |||||||||||||||||||||
| 4 | First Security Bank of Deer Lodge | MT | Bank | 1 | 74,198 | 14.92 | 74,058 | 15.38 | 0.19 | |||||||||||||||||||||
| 5 | Peoples Bank of Deer Lodge | MT | Bank | 1 | 40,056 | 8.05 | 36,865 | 7.66 | 8.66 | |||||||||||||||||||||
| 6 | $ | 497,289 | 100.00 | $ | 481,502 | 100.00 | 3.28 | |||||||||||||||||||||||
Source: S&P Global.
Pioneer Federal ranked third in Beaverhead County out of three financial institutions with deposits of $40.7 million in one office as of June 30, 2024 for a market share of 12.1%. The deposit market share leader in Beaverhead County was Stockman Bank of Montana (“Stockman Bank”) with deposits of $181.3 million and a market share of 53.7%. In the combined market of Powell and Beaverhead Counties, Pioneer Federal ranked third with deposits of $74.2 million and a market share of 17.4%. Stockman Bank was the deposit market leader in the combined market with deposits of $181.3 million and a market share of 36.5%. Among the local competitors, Stockman Bank (total assets of $6.9 billion) and The Bank of Commerce (total assets of $2.2 billion) were the largest financial institutions operating in the market by asset size as of June 30, 2025.
| 40 |
Feldman Financial Advisors, Inc.
Pioneer Federal faces significant competition in originating loans and attracting deposits. This competition stems primarily from commercial banks, savings institutions, credit unions, and mortgage banking companies. Several of the financial service providers operating in the Association’s market area are significantly larger and have greater financial resources. The Association faces additional competition for deposits from online banking institutions, short-term money market funds, other corporate and government securities funds, mutual funds, and from other non-depository financial institutions such as brokerage firms and insurance companies.
Competition for residential mortgage lending in the Association’s market area is high. In addition to local and regional participants, many nationwide lenders are present in the Association’s lending market. Stockman Bank (Miles City, Montana) was the leading residential mortgage lender in 2024 in Beaverhead County based on the publicly reported total dollar amount of funded loans, followed by The Bank of Commerce (Ammon, Idaho), U.S. Bank (Minneapolis, Minnesota), Veterans United Home Loans (Columbia, Missouri), and United Wholesale Mortgage (Pontiac, Michigan). Midwest Bank (Detroit Lakes, Michigan) was the leading residential mortgage lender in 2024 in Powell County, followed by Stockman Bank, Glacier Bank (Kalispell, Montana), and Bank of America (Charlotte, North Carolina).
| 41 |
Feldman Financial Advisors, Inc.
Summary Outlook
Pioneer Federal Association has consistently reported moderate levels of profitability in recent years. The Association’s ROA measured 0.23% in 2023, 0.20% in 2024, and 0.22% annualized for the first half of 2025. In addition, the Association’s profitability has been boosted by non-recurring revenue such as the property sale gain in 2024 and a recovery of credit loss provisions in the first half of 2025. The Association’s earnings have been restrained by increased operating expenses, primarily resulting from increased occupancy costs related to its new office building in Deer Lodge. The Association’s non-interest expense exceeded its net interest income in the year ended December 31, 2024 and the six months ended June 30, 2025. The Association’s ratio of non-interest expense to average assets has escalated from 2.72% in 2021 and 2.62% in 2022 to 2.96% in 2023 and 3.00% in 2024.
The Association’s net interest margin has held firm, supported by the large concentration of loans to assets on its balance sheet. Net total loans measured 77.0% and 75.2% as of December 31, 2024 and June 30, 2025, respectively. In recent years, the Association’s provision for credit losses on loans has amounted to relatively small levels or a recovery as asset quality has remained satisfactory. The Association plans to continue its emphasis on residential mortgage lending while expanding its commercial lending. A key element of the Association’s operating strategy is to continue to aggressively manage credit risk, so as to maintain the Association’s favorable measures of credit quality. The Association’s strong capital position helps to support its net interest margin and interest rate risk management, although the loan portfolio continues to reflect a large concentration of fixed-rate residential mortgage loans.
The infusion of additional capital from the Stock Offering will fortify the Association’s already strong capital position and allow for the implementation of prudent growth strategies, which would serve to leverage operating expenses and provide additional flexibility to evaluate adding additional products and services that would enhance the Association’s competitive position and contribute to improved profitability. As a public company following the completion of the Conversion and Stock Offering, the Association will experience an increase in operating expenses related to the compensation costs of stock-benefit plans and the additional costs related to resources, systems, and controls necessary to satisfy the ongoing public company financial reporting requirements. The Association may also incur additional expenses related to staff expansion to support expanded lending objectives. The incremental expenses may present an impediment to generating meaningful earnings growth over the near term until the additional capital is leveraged to support the realized loan expansion.
| 42 |
Feldman Financial Advisors, Inc.
II. COMPARISONS WITH PUBLICLY TRADED THRIFTS
General Overview
The comparative market approach provides a sound basis for determining estimates of going-concern valuations where a regular and active market exists for the stocks of peer institutions. The comparative market approach was utilized in determining the estimated pro forma market value of the Association because: (1) reliable market and financial data are readily available for comparable institutions; (2) the comparative market method is required by the applicable regulatory guidelines; and (3) other alternative valuation methods (such as income capitalization, liquidation analysis, or discounted cash flow) are unlikely to produce a valuation relevant to the future trading patterns of the related equity interest. The generally employed valuation method in initial public offerings, where possible, is the comparative market approach, which also can be relied upon to determine pro forma market value in a thrift stock conversion.
The comparative market approach derives valuation benchmarks from the trading patterns of selected peer institutions which, due to certain factors such as financial performance and operating strategies, enable the appraiser to estimate the potential value of the subject institution in a stock conversion offering. The pricing and trading history of recent initial public offerings of thrifts are also examined to provide evidence of the “new issue discount” that must be considered. In Chapter II, our valuation analysis focuses on the selection and comparison of the Association with a comparable group of publicly traded thrift institutions (the “Comparative Group”). Chapter III will detail any additional discounts or premiums that we believe are appropriate to the Association’s pro forma market value.
| 43 |
Feldman Financial Advisors, Inc.
Selection Criteria
Selected market price and financial performance data for all public thrifts listed on major stock exchanges are shown in Exhibit III. The list excludes companies that are subject to being acquired under a pending transaction and companies that have a majority ownership interest controlled by a mutual holding company. Several criteria, discussed below, were used to select the individual members of the Comparative Group from the overall universe of publicly traded thrifts.
| · | Operating characteristics – An institution’s operating characteristics are the most important factors because they affect investors’ expected rates of return on a company’s stock under various business/economic scenarios, and they influence the market’s general perception of the quality and attractiveness of a given company. Operating characteristics, which may vary in importance during the business cycle, include financial variables such as profitability, balance sheet growth, capitalization, asset quality, and other factors such as lines of business and management strategies. |
| · | Degree of marketability and liquidity – Marketability of a stock reflects the relative ease and promptness with which a security may be sold when desired, at a representative current price, without material concession in price merely because of the necessity of sale. Marketability also connotes the existence of buying interest as well as selling interest and is usually indicated by trading volumes and the spread between the bid and asked price for a security. Liquidity of the stock issue refers to the organized market exchange process whereby the security can be converted into cash. We attempted to limit our selection to companies that have access to a regular trading market or price quotations, and therefore only considered companies listed on major stock exchanges. We eliminated from the Comparative Group companies whose market prices were materially influenced by announced acquisitions or other unusual circumstances. However, the expectation of continued industry consolidation is currently embedded in thrift equity valuations. |
| · | Geographic Location – The region of the country where a company operates is also of importance in selecting the comparative group. The operating environment for thrift institutions varies from region to region with respect to business and economic environments, real estate market conditions, speculative takeover activity, and investment climates. Economic and investor climates can also vary greatly within a region, particularly due to takeover activity. |
| 44 |
Feldman Financial Advisors, Inc.
The operations of the Association fit the general profile of a smaller thrift institution, concentrating primarily on residential real estate lending in its local market and relying on retail deposits as a funding source. Fixed-rate residential mortgage loans remain the core product in the Association’s loan portfolio, drawing upon its roots as a traditional home lender. The Association has made moderate progress in diversifying its loan mix through the expanded origination of commercial real estate, commercial business, and consumer loans.
In determining the Comparative Group composition, we focused on the Association’s asset size, capitalization, asset quality, earnings fundamentals, and geographic location. Attempting to concentrate on the Association’s performance characteristics and to develop a meaningful number of comparables for valuation purposes, we expanded the criteria to include a statistically significant number of companies. In addition, because of the scarcity of candidates meeting the criteria precisely, we expanded the asset size and geographic criteria to generate a significant number of comparables. As with any composition of a group of comparable companies, the selection criteria were broadened sufficiently to assemble a significant number of members. We performed an initial screening for publicly traded thrifts headquartered in the West region of the United States with total assets less than $1 billion. We then expanded the selection criteria nationwide to other geographic regions and applied the following selection criteria:
| · | Publicly traded thrift – stock-form thrift whose shares are traded on the New York Stock Exchange (“NYSE”), NYSE American, or NASDAQ Stock Market. |
| · | Excludes mutual holding companies – company’s corporate structure is not organized in the mutual holding company (“MHC”) form. |
| · | Seasoned trading issue – company has been publicly traded in the fully-converted stock form for at least one year. |
| · | Non-acquisition target – company is not subject to a pending or rumored acquisition. |
| · | Asset size – total assets less than $1 billion. |
| · | Capital level – tangible common equity to tangible assets greater than 7.0%. |
| 45 |
Feldman Financial Advisors, Inc.
As a result of applying the stated criteria, the screening process produced a reliable representation of public thrifts. A general operating summary of the 10 companies included in the Comparative Group is presented in Table 13. All of the selected companies are traded on the NASDAQ Stock Market. The Comparative Group companies ranged in asset size from $273.8 million at Catalyst Bancorp to $987.5 million at Magyar Bancorp. The median asset size of the Comparative Group was $572.3 million and larger than the Association’s total assets of $113.3 million as of June 30, 2025. Because of the initial and continuing listing standards of the major stock exchanges, including public float and round lot holders requirements, as well as the fact that many of the smaller converted thrifts ultimately de-list their shares from NASDAQ and/or are acquired by larger companies, there were not many smaller thrifts eligible for inclusion in the Comparative Group based on the stated criterion of being listed on a major exchange,
The Comparative Group includes four thrifts based in the Southwest region, Catalyst Bancorp (Louisiana), Fifth District Bancorp (Louisiana), Home Federal Bancorp (Louisiana), and Texas Community Bancshares (Texas). The Comparative Group includes two thrifts based in the Midwest region, Central Plains Bancshares (Nebraska) and NSTS Bancorp (Illinois). The remaining members are located in the Mid-Atlantic (two companies) Southeast (two companies), and New England (one company). Of the 10 public thrifts based in the West, eight were excluded because their asset size exceeded $1.0 billion and the other two were excluded since they are not traded on a major stock exchange and are instead listed on the over-the-counter (“OTC”) markets. There are currently no public thrifts headquartered in Montana. While some differences inevitably may exist between the Association and the individual companies in the Comparative Group, we believe that the chosen Comparative Group, on the whole, provides a meaningful basis of financial comparison for valuation purposes.
| 46 |
Feldman Financial Advisors, Inc.
Table 13
Comparative Group Operating Summary
As of June 30, 2025
| Initial Public | Total | Tang. Equity/ | ||||||||||||||||
| No. of | Offering | Assets | Assets | |||||||||||||||
| Company | City | St. | Offices | Date | ($Mil.) | (%) | ||||||||||||
| Pioneer Federal Savings and Loan Association | Deer Lodge | MT | 2 | NA | $ | 113.3 | 16.27 | |||||||||||
| Comparative Group | ||||||||||||||||||
| Affinity Bancshares, Inc. | Covington | GA | 3 | 04/27/17 | 933.8 | 14.34 | ||||||||||||
| BV Financial, Inc. | Baltimore | MD | 13 | 01/12/05 | 908.3 | 33.60 | ||||||||||||
| Catalyst Bancorp, Inc. | Opelousas | LA | 6 | 10/12/21 | 273.8 | 33.60 | ||||||||||||
| Central Plains Bancshares, Inc. | Grand Island | NE | 9 | 10/19/12 | 500.9 | 24.26 | ||||||||||||
| Fifth District Bancorp, Inc. | New Orleans | LA | 7 | 07/31/24 | 539.8 | 9.71 | ||||||||||||
| First Seacoast Bancorp, Inc. | Dover | DE | 5 | 07/16/19 | 604.8 | 9.71 | ||||||||||||
| Home Federal Bancorp, Inc. | Shreveport | LA | 11 | 01/18/05 | 609.5 | 8.44 | ||||||||||||
| Magyar Bancorp, Inc. | New Brunswick | NJ | 7 | 01/23/06 | 987.5 | 12.16 | ||||||||||||
| NSTS Bancorp, Inc. | Waukegan | IL | 3 | 01/18/22 | 276.0 | 29.52 | ||||||||||||
| Texas Community Bancshares, Inc. | Mineola | TX | 7 | 07/14/21 | 444.1 | 14.71 | ||||||||||||
Source: Pioneer Federal Savings and Loan Association; S&P Global.
| 47 |
Feldman Financial Advisors, Inc.
Recent Financial Comparisons
Table 14 summarizes certain key financial comparisons between the Association and the Comparative Group. Tables 15 through 19 contain the detailed financial comparisons of the Association with the individual Comparative Group companies based on measures of profitability, income and expense components, capital levels, balance sheet composition, asset quality, and growth rates. Financial data for the Association, the Comparative Group, and All Public Thrift aggregate were utilized for the latest available period as of or for the last twelve months (“LTM”) ended June 30, 2025.
The Association’s LTM earnings amounted to $145,000 for an LTM ROA of 0.13%, reflecting profitability below the Comparative Group median of 0.70% and the All Public Thrift median of 0.55%. The Association’s lower ROA was attributable mainly to a lower level of non-interest income and a higher level of operating expenses. The Association’s LTM ROE was 0.79% and trailed the Comparative Group median of 5.23%. The Association’s ROA was below the ROA results of all but one of the members of the Comparative Group. The Comparative Group’s ROA results ranged from a low of -0.42% at First Seacoast Bancorp to 1.19% at BV Financial.
Based on core earnings (as adjusted to exclude securities gains or losses, intangibles amortization expense, and other non-recurring items), the Association’s core profitability was also lower than the Comparative Group’s levels. The Association’s LTM core earnings ratio measured 0.19% of average assets and positioned below the corresponding Comparative Group median of 0.67% and the All Public Thrift median of 0.55%. The Association’s core earnings exclude the impact of $90,000 in non-recurring operating expenses in the form of professional fees and reflect a resulting amount of core earnings equal to $216,000 for the LTM ended June 30, 2025.
| 48 |
Feldman Financial Advisors, Inc.
Table 14
Key Financial Comparisons
Pioneer Federal Savings and Loan Association and the Comparative Group
As of or For the Last Twelve Months Ended June 30, 2025
| Pioneer | Comparative | All Public | ||||||||||
| Federal | Group | Thrift | ||||||||||
| S&LA | Median | Median | ||||||||||
| Profitability Ratios | ||||||||||||
| LTM Return on Average Assets (ROA) | 0.13 | % | 0.70 | % | 0.55 | % | ||||||
| LTM Return on Average Equity (ROE) | 0.79 | 5.23 | 4.90 | |||||||||
| Core Return on Avg. Assets (Core ROA) | 0.19 | 0.67 | 0.56 | |||||||||
| Core Return on Avg. Equity (Core ROE) | 1.17 | 5.35 | 4.64 | |||||||||
| Net Interest Margin | 3.27 | 3.23 | 2.86 | |||||||||
| Efficiency Ratio | 94.91 | 75.76 | 76.82 | |||||||||
| Income and Expense (% of avg. assets) | ||||||||||||
| Total Interest Income | 4.62 | 5.10 | 4.98 | |||||||||
| Total Interest Expense | 1.63 | 1.82 | 2.16 | |||||||||
| Net Interest Income | 2.99 | 3.05 | 2.71 | |||||||||
| Provision (Recovery) for Credit Losses | (0.07 | ) | 0.03 | 0.04 | ||||||||
| Other Operating Income | 0.19 | 0.42 | 0.33 | |||||||||
| Net Securities Gains and Non-rec. Income | 0.00 | 0.00 | 0.00 | |||||||||
| General and Administrative Expense | 3.02 | 2.63 | 2.45 | |||||||||
| Intangibles Amortization Expense | 0.00 | 0.00 | 0.01 | |||||||||
| Non-recurring Expense | 0.08 | 0.01 | 0.00 | |||||||||
| Pre-tax Core Earnings | 0.23 | 0.79 | 0.71 | |||||||||
| Equity Capital Ratios | ||||||||||||
| Total Equity / Total Assets | 16.27 | 15.09 | 11.84 | |||||||||
| Tangible Equity / Tangible Assets | 16.27 | 14.40 | 11.34 | |||||||||
| Growth Rates | ||||||||||||
| Total Assets | (0.05 | ) | 2.52 | 1.61 | ||||||||
| Net Total Loans | 1.03 | 5.95 | 2.75 | |||||||||
| Total Deposits | (0.32 | ) | 4.20 | 4.53 | ||||||||
| 49 |
Feldman Financial Advisors, Inc.
Table 14 (continued)
Key Financial Comparisons
Pioneer Federal Savings and Loan Association and the Comparative Group
As of or For the Last Twelve Months Ended June 30, 2025
| Pioneer | Comparative | All Public | ||||||||||
| Federal | Group | Thrift | ||||||||||
| S&LA | Median | Median | ||||||||||
| Balance Sheet Composition (% of total assets) | ||||||||||||
| Cash and Securities | 18.70 | % | 21.27 | % | 17.50 | % | ||||||
| Loans Receivable, net | 75.17 | 73.99 | 77.69 | |||||||||
| Real Estate Owned | 0.00 | 0.02 | 0.01 | |||||||||
| Intangible Assets | 0.00 | 0.02 | 0.04 | |||||||||
| Other Assets | 6.14 | 5.15 | 4.73 | |||||||||
| Total Deposits | 75.79 | 77.23 | 75.49 | |||||||||
| Borrowed Funds | 7.06 | 3.59 | 7.86 | |||||||||
| Other Liabilities | 0.87 | 1.19 | 1.05 | |||||||||
| Total Liabilities | 83.73 | 84.91 | 88.89 | |||||||||
| Total Equity | 16.27 | 15.09 | 11.84 | |||||||||
| Loan Portfolio Composition (% of total loans) | ||||||||||||
| Residential Real Estate Loans (1) | 88.57 | 44.30 | 29.06 | |||||||||
| Other Real Estate Loans | 8.53 | 35.61 | 54.54 | |||||||||
| Non-Real Estate Loans | 2.90 | 14.66 | 16.40 | |||||||||
| Credit Risk Ratios | ||||||||||||
| Non-performing Loans (2) / Total Loans | 0.66 | 0.45 | 0.50 | |||||||||
| Non-performing Assets (2) /Total Assets | 0.50 | 0.40 | 0.40 | |||||||||
| Allowance for Reserves / Non-perf. Loans(2) | 192.46 | 179.82 | 170.23 | |||||||||
| Allowance for Reserves / Total Loans | 1.27 | 1.02 | 0.96 | |||||||||
(1) Includes home equity and second mortgage loans.
(2) Includes accruing troubled debt restructurings and excludes accruing loans past due 30-89 days.
Source: Pioneer Federal Savings and Loan Association; S&P Global.
As shown in Table 17, the Association’s level of net interest income at 2.99% of average assets was only slightly below the Comparative Group median of 3.05%, owing to the Association’s relatively high concentration of assets invested in loans, which generally carry higher yields than investment securities. The Association’s total interest income measured 4.62% of average assets for the LTM period, trailing the Comparative Group median of 5.10%. The Association’s interest expense amounted to 1.63% of average assets and was slightly above the Comparative Group median of 1.82%. As reflected by its higher net interest margin of 3.27% versus the corresponding Comparative Group median of 3.23%, the earning power of the Association’s balance sheet is bolstered by the relatively large concentration of loans to assets and its strong capital position.
| 50 |
Feldman Financial Advisors, Inc.
The Association’s non-interest operating income totaled 0.19% of average assets, lagging behind the Comparative Group median of 0.42%. The Association’s primary sources of non-interest income include service fees and interchange fees. Most of the Comparative Group companies reported higher levels of non-interest income, particularly expanded revenue from mortgage banking operations producing significant loan origination and servicing fees and gains on sale of loans.
The Association’s provision for credit losses on loans amounted to -0.07% of average assets (reflecting a recovery) for the recent LTM period and was positioned below the Comparative Group median of 0.03%. The Association’s non-performing assets (excluding accruing loans past due 30-89 days) measured 0.50% at June 30, 2025, which was slightly higher than the Comparative Group and All Public Thrift medians both at 0.40%. The Association’s non-performing loans were 0.66% of total loans at June 30, 2025, which was higher than the Comparative Group and All Public Thrift medians of 0.45% and 0.50%, respectively. The Association’s 1.27% ratio of allowance for credit losses on loans to total loans was higher than the corresponding Comparative Group median of 1.02% and All Public Thrift median of 0.96%. Furthermore, the Association’s 192.5% ratio of allowance for credit losses on loans to non-performing loans was positioned above the Comparative Group median of 179.8% and All Public Thrift median of 170.2%.
| 51 |
Feldman Financial Advisors, Inc.
The Association’s operating expense ratio at 3.02% of average assets was higher than the Comparative Group median of 2.63% and All Public Thrift median of 2.56%. Pioneer Federal’s operating expenses have increased recently following its relocation of the Deer Lodge office into a new building. The Association’s 94.9% efficiency ratio (defined as non-interest expense less intangibles amortization expense and non-recurring expenses as a percent of the sum of net interest income before provision plus non-interest operating income) compared unfavorably to the Comparative Group median of 75.8%. Only two members of the Comparative Group exhibited efficiency ratios above the Association’s efficiency ratio, which is reflective of the Association’s comparatively higher operating expense ratio and its lower non-interest income ratio. Further improving the efficiency ratio is a strategic goal for the Association as it seeks to leverage the operating infrastructure and staffing resources in place to grow the balance sheet and generate increased levels of market share penetration and lending activity.
As reflected in Table 18, the overall balance sheet composition of the Association reflected a higher concentration of loans to assets versus that of the overall Comparative Group. The Association’s net total loans amounted to 75.2% of total assets as of June 30, 2025, above the median of 74.0% for the Comparative Group. The Association’s ratio of cash and securities to total assets was 18.7% and moderately below the median of 21.3% for the Comparative Group. The Association had no intangible assets or real estate owned on its balance sheet as of June 30, 2025. The Association’s ratio of other assets to total assets measured 6.1% and was slightly higher than the Comparative Group median of 5.2%. The Association’s other assets have increased recently as a result of the construction of a new office building in Deer Lodge. The Association’s other assets primarily comprised premises and equipment (4.4% of total assets) and the cash value of life insurance (0.7% of total assets) as of June 30, 2025.
| 52 |
Feldman Financial Advisors, Inc.
The Association’s ratio of borrowed funds to total assets amounted to 7.1% at June 30, 2025 and was higher than the Comparative Group median of 3.6%. The Association historically had not actively utilized borrowings as a supplemental source of funds. However, the Association obtained an $8.0 million FHLB advance in September 2023 and used the debt proceeds to help the fund construction of the new office building and support ongoing lending activity.
Pioneer Federal’s level of deposits at 75.8% of total assets was below the Comparative Group median of 77.2% of total assets due to the Association’s strong capital level along with the increased utilization of borrowed funds. The Association’s equity level before the Stock Offering was 16.27% relative to total assets as of June 30, 2025, which was above the Comparative Group median equity level of 15.09% of total assets. The Comparative Group includes several companies that completed full conversion or second-step conversion offerings over the past two years and have emerged with very high capital levels that have not been notably leveraged due to the relatively short passage of time.
The Association’s level of residential real estate loans (including home equity and second mortgage loans) measured 88.6% of total loans based on regulatory financial data as of June 30, 2025, outdistancing the Comparative Group median of 44.3% and reflective of the Association’s traditional thrift orientation. Three other members of the Comparative Group exhibited a majority of loans in the residential category: Fifth District Bancorp at 90.5%, NSTS Bancorp at 86.4%, and First Seacoast Bancorp at 62.8% of total loans. Other companies within the Comparative Group exhibited more diverse loan portfolio compositions with higher percentages of non-residential real estate loans and non-real estate loans in portfolio than the levels exhibited by Pioneer Federal.
| 53 |
Feldman Financial Advisors, Inc.
The Association’s concentration of non-residential real estate loans (which category includes commercial real estate and construction and land development loans) represented 8.5% of total loans and was lower than the Comparative Group median of 65.63%. The Association also exhibited a lower level of non-real estate loans (primarily commercial business loans and other consumer loans), which accounted for 2.9% of total loans versus the Comparative Group median of 14.7%.
The Association’s asset growth rate measured -0.1% over the recent LTM period versus the Comparative Group median asset growth rate of 2.5%. The Association exhibited a deposit growth rate of -0.3% versus the Comparative Group median of 4.2%. The Association’s loan growth rate of 1.0% also trailed the Comparative Group median of 6.0%. The lack of meaningful balance sheet growth at Pioneer Federal poses a major challenge to the Association’s capacity to improve earnings by generating incremental net interest income.
In summary, the Association’s recent earnings performance measured below the results exhibited by the Comparative Group, while its capital ratio was higher (even before the effect of the Stock Offering) and its asset quality ratios were relatively comparable to the levels represented by the Comparative Group medians. The Association’s profitability was characterized by a lower level of non-interest income and a higher non-interest expense ratio. Similar to most financial institutions of its size, the Association is faced with the ongoing challenge of improving its efficiency ratio either through bolstering its net interest margin, enhancing non-interest income generation, or improving the efficiency and productivity of its operating infrastructure. The Association’s earnings growth outlook will depend largely on its ability to maintain satisfactory credit quality as it grows the loan portfolio, to improve the net interest margin across movements in the interest rate environment, and to control non-interest expense as it seeks to expand its operations and transition to a public company.
| 54 |
Feldman Financial Advisors, Inc.
Table 15
General Operating Characteristics
As of June 30, 2025
| Tang. | |||||||||||||||||||
| Total | Total | Total | Common | ||||||||||||||||
| No. of | IPO | Assets | Deposits | Equity | Equity | ||||||||||||||
| City/State | Ticker | Exchange | Offices | Date | ($000s) | ($000s) | ($000s) | ($000s) | |||||||||||
| Pioneer Federal S&LA | Deer Lodge, MT | NA | NA | 2 | NA | 113,259 | 85,842 | 18,428 | 18,428 | ||||||||||
| Comparative Group Average | 607,847 | 475,998 | 98,147 | 94,368 | |||||||||||||||
| Comparative Group Median | 572,324 | 436,450 | 82,723 | 82,723 | |||||||||||||||
| Comparative Group | |||||||||||||||||||
| Affinity Bancshares, Inc. | Covington, GA | AFBI | NASDAQ | 3 | 04/27/17 | 933,799 | 749,338 | 124,100 | 106,020 | ||||||||||
| BV Financial, Inc. | Baltimore, MD | BVFL | NASDAQ | 13 | 01/12/05 | 908,327 | 658,891 | 197,991 | 182,830 | ||||||||||
| Catalyst Bancorp, Inc. | Opelousas, LA | CLST | NASDAQ | 6 | 10/12/21 | 273,785 | 182,211 | 80,799 | 80,799 | ||||||||||
| Central Plains Bancshares, Inc. | Grand Island, NE | CPBI | NASDAQ | 9 | 10/19/23 | 500,877 | 400,636 | 84,646 | 84,646 | ||||||||||
| Fifth District Bancorp, Inc. | New Orleans, LA | FDSB | NASDAQ | 7 | 07/31/24 | 539,807 | 398,243 | 130,898 | 130,898 | ||||||||||
| First Seacoast Bancorp, Inc. | Dover, NH | FSEA | NASDAQ | 5 | 07/16/19 | 604,840 | 472,264 | 60,801 | 60,602 | ||||||||||
| Home Federal Bancorp, Inc. | Shreveport, LA | HFBL | NASDAQ | 11 | 01/18/05 | 609,492 | 546,290 | 55,205 | 51,300 | ||||||||||
| Magyar Bancorp, Inc. | New Brunswick, NJ | MGYR | NASDAQ | 7 | 01/23/06 | 987,488 | 819,962 | 116,323 | 115,948 | ||||||||||
| NSTS Bancorp, Inc. | Waukegan, IL | NSTS | NASDAQ | 3 | 01/18/22 | 275,976 | 192,960 | 77,833 | 77,833 | ||||||||||
| Texas Community Bancshares, Inc. | Mineola, TX | TCBS | NASDAQ | 7 | 07/14/21 | 444,082 | 339,180 | 52,869 | 52,803 |
Source: Pioneer Federal Savings and Loan Association; S&P Global.
56
Feldman Financial Advisors, Inc.
Table 16
General Financial Performance Ratios
As of or For the Last Twelve Months Ended June 30, 2025
| Total | Tang. | Net | |||||||||||||||||||
| Total | Total | Equity/ | Equity/ | Interest | Effcy. | LTM | LTM | Core | Core | ||||||||||||
| Assets | Deposits | Assets | Assets | Margin | Ratio | ROA | ROE | ROA | ROE | ||||||||||||
| ($000s) | ($000s) | (%) | (%) | (%) | (%) | (%) | (%) | (%) | (%) | ||||||||||||
| Pioneer Federal S&LA | 113,259 | 85,842 | 16.27 | 16.27 | 3.27 | 94.91 | 0.13 | 0.79 | 0.19 | 1.17 | |||||||||||
| Comparative Group Average | 607,847 | 475,998 | 17.67 | 17.30 | 3.22 | 79.63 | 0.55 | 3.73 | 0.57 | 3.91 | |||||||||||
| Comparative Group Median | 572,324 | 436,450 | 15.09 | 14.40 | 3.23 | 75.76 | 0.70 | 5.23 | 0.67 | 5.35 | |||||||||||
| All Public Thrift Average | 6,306,370 | 4,779,188 | 14.15 | 13.50 | 3.09 | 78.71 | 0.48 | 3.06 | 0.51 | 3.13 | |||||||||||
| All Public Thrift Median | 1,515,829 | 1,138,666 | 11.84 | 11.34 | 2.86 | 76.82 | 0.55 | 4.90 | 0.56 | 4.64 | |||||||||||
| Comparative Group | |||||||||||||||||||||
| Affinity Bancshares, Inc. | 933,799 | 749,338 | 13.29 | 11.58 | 3.54 | 67.90 | 0.79 | 5.54 | 0.87 | 6.09 | |||||||||||
| BV Financial, Inc. | 908,327 | 658,891 | 21.80 | 20.47 | 4.33 | 60.55 | 1.19 | 5.32 | 1.20 | 5.39 | |||||||||||
| Catalyst Bancorp, Inc. | 273,785 | 182,211 | 29.51 | 29.51 | 3.87 | 75.79 | 0.80 | 2.70 | 0.67 | 2.25 | |||||||||||
| Central Plains Bancshares, Inc. | 500,877 | 400,636 | 16.90 | 16.90 | 3.61 | 75.38 | 0.77 | 5.52 | 0.77 | 5.52 | |||||||||||
| Fifth District Bancorp, Inc. | 539,807 | 398,243 | 24.25 | 24.25 | 2.36 | 79.09 | 0.49 | 2.09 | 0.68 | 2.90 | |||||||||||
| First Seacoast Bancorp, Inc. | 604,840 | 472,264 | 10.05 | 10.02 | 2.17 | 117.24 | (0.42 | ) | (3.99 | ) | (0.42 | ) | (3.96 | ) | |||||||
| Home Federal Bancorp, Inc. | 609,492 | 546,290 | 9.06 | 8.47 | 3.23 | 75.73 | 0.63 | 7.30 | 0.67 | 7.73 | |||||||||||
| Magyar Bancorp, Inc. | 987,488 | 819,962 | 11.78 | 11.75 | 3.22 | 57.93 | 0.99 | 8.77 | 1.00 | 8.86 | |||||||||||
| NSTS Bancorp, Inc. | 275,976 | 192,960 | 28.20 | 28.20 | 2.82 | 108.87 | (0.29 | ) | (1.04 | ) | (0.29 | ) | (1.04 | ) | |||||||
| Texas Community Bancshares, Inc. | 444,082 | 339,180 | 11.91 | 11.89 | 3.05 | 77.85 | 0.53 | 5.13 | 0.55 | 5.31 |
Source: Pioneer Federal Savings and Loan Association; S&P Global.
57
Feldman Financial Advisors, Inc.
Table 17
Income and Expense Analysis
For the Last Twelve Months Ended June 30, 2025
| As a Percent of Average Assets | ||||||||||||||||||||||
| Net | Other | Gains & | Loan | Gen. & | Intang. | Pre-tax | ||||||||||||||||
| Interest | Interest | Interest | Oper. | Non-rec. | Loss | Admin. | Amort. | Non-rec. | Core | |||||||||||||
| Income | Expense | Income | Income | Income | Prov. | Expense | Expense | Expense | Earnings | |||||||||||||
| Pioneer Federal S&LA | 4.62 | 1.63 | 2.99 | 0.19 | 0.00 | (0.07 | ) | 3.02 | 0.00 | 0.08 | 0.23 | |||||||||||
| Comparative Group Average | 4.89 | 1.85 | 3.04 | 0.46 | 0.02 | 0.04 | 2.74 | 0.01 | 0.04 | 0.73 | ||||||||||||
| Comparative Group Median | 5.10 | 1.82 | 3.05 | 0.42 | 0.00 | 0.03 | 2.63 | 0.00 | 0.01 | 0.79 | ||||||||||||
| All Public Thrift Average | 5.07 | 2.15 | 2.92 | 0.53 | 0.03 | 0.09 | 2.67 | 0.03 | 0.02 | 0.71 | ||||||||||||
| All Public Thrift Median | 4.98 | 2.16 | 2.71 | 0.33 | 0.00 | 0.04 | 2.45 | 0.01 | 0.00 | 0.71 | ||||||||||||
| Comparative Group | ||||||||||||||||||||||
| Affinity Bancshares, Inc. | 5.53 | 2.18 | 3.35 | 0.24 | (0.04 | ) | 0.04 | 2.44 | 0.02 | 0.04 | 1.11 | |||||||||||
| BV Financial, Inc. | 5.35 | 1.34 | 4.01 | 0.29 | 0.00 | 0.04 | 2.60 | 0.02 | 0.00 | 1.65 | ||||||||||||
| Catalyst Bancorp, Inc. | 5.13 | 1.53 | 3.60 | 0.50 | 0.18 | 0.16 | 3.16 | 0.00 | 0.02 | 0.78 | ||||||||||||
| Central Plains Bancshares, Inc. | 5.19 | 1.71 | 3.48 | 0.54 | 0.00 | 0.04 | 3.03 | 0.00 | 0.00 | 0.95 | ||||||||||||
| Fifth District Bancorp, Inc. | 3.97 | 1.74 | 2.23 | 0.84 | 0.00 | 0.00 | 2.43 | 0.00 | 0.24 | 0.65 | ||||||||||||
| First Seacoast Bancorp, Inc. | 4.44 | 2.31 | 2.13 | 0.26 | 0.00 | 0.02 | 2.80 | 0.01 | 0.00 | (0.43 | ) | |||||||||||
| Home Federal Bancorp, Inc. | 4.92 | 1.90 | 3.02 | 0.37 | (0.00 | ) | (0.02 | ) | 2.61 | 0.05 | 0.00 | 0.80 | ||||||||||
| Magyar Bancorp, Inc. | 5.36 | 2.29 | 3.08 | 0.33 | 0.00 | 0.02 | 1.98 | 0.00 | 0.01 | 1.41 | ||||||||||||
| NSTS Bancorp, Inc. | 3.93 | 1.31 | 2.62 | 0.80 | 0.00 | (0.02 | ) | 3.72 | 0.00 | 0.00 | (0.28 | ) | ||||||||||
| Texas Community Bancshares, Inc. | 5.08 | 2.16 | 2.92 | 0.48 | 0.06 | 0.09 | 2.65 | 0.03 | 0.05 | 0.65 | ||||||||||||
Source: Pioneer Federal Savings and Loan Association; S&P Global.
58
Feldman Financial Advisors, Inc.
Table 18
Balance Sheet Composition
As of June 30, 2025
| As a Percent of Total Assets | |||||||||||||||||||||
| Cash and | Net | Real | Intang. | Other | Total | Borrowed | Other | Total | Total | ||||||||||||
| Securities | Loans | Estate | Assets | Assets | Deposits | Funds | Liabs. | Liabs. | Equity | ||||||||||||
| Pioneer Federal S&LA | 18.70 | 75.17 | 0.00 | 0.00 | 6.14 | 75.79 | 7.06 | 0.87 | 83.73 | 16.27 | |||||||||||
| Comparative Group Average | 22.27 | 71.97 | 0.05 | 0.43 | 5.27 | 77.01 | 4.15 | 1.16 | 82.33 | 17.67 | |||||||||||
| Comparative Group Median | 21.27 | 73.99 | 0.02 | 0.02 | 5.15 | 77.23 | 3.59 | 1.19 | 84.91 | 15.09 | |||||||||||
| All Public Thrift Average | 18.35 | 76.96 | 0.08 | 0.76 | 4.55 | 74.95 | 9.70 | 1.17 | 87.04 | 14.15 | |||||||||||
| All Public Thrift Median | 17.50 | 77.69 | 0.01 | 0.04 | 4.73 | 75.49 | 8.60 | 1.05 | 88.89 | 11.84 | |||||||||||
| Comparative Group | |||||||||||||||||||||
| Affinity Bancshares, Inc. | 17.24 | 77.38 | 0.00 | 1.94 | 3.44 | 80.25 | 5.78 | 0.68 | 86.71 | 13.29 | |||||||||||
| BV Financial, Inc. | 10.85 | 81.73 | 0.02 | 1.67 | 5.73 | 72.54 | 3.94 | 1.72 | 78.20 | 21.80 | |||||||||||
| Catalyst Bancorp, Inc. | 31.09 | 60.32 | 0.03 | 0.00 | 8.56 | 66.55 | 3.52 | 0.41 | 70.49 | 29.51 | |||||||||||
| Central Plains Bancshares, Inc. | 13.94 | 81.41 | 0.01 | 0.00 | 4.63 | 79.99 | 1.69 | 1.42 | 83.10 | 16.90 | |||||||||||
| Fifth District Bancorp, Inc. | 23.90 | 70.32 | 0.01 | 0.00 | 5.77 | 73.78 | 0.00 | 1.98 | 75.75 | 24.25 | |||||||||||
| First Seacoast Bancorp, Inc. | 25.41 | 72.08 | 0.00 | 0.03 | 2.48 | 78.08 | 10.90 | 0.97 | 89.95 | 10.05 | |||||||||||
| Home Federal Bancorp, Inc. | 18.63 | 75.89 | 0.16 | 0.64 | 4.68 | 89.63 | 0.80 | 0.52 | 90.94 | 9.06 | |||||||||||
| Magyar Bancorp, Inc. | 10.23 | 84.65 | 0.22 | 0.04 | 4.86 | 83.04 | 3.65 | 1.53 | 88.22 | 11.78 | |||||||||||
| NSTS Bancorp, Inc. | 43.18 | 49.74 | 0.00 | 0.00 | 7.08 | 69.92 | 0.00 | 1.88 | 71.80 | 28.20 | |||||||||||
| Texas Community Bancshares, Inc. | 28.25 | 66.21 | 0.10 | 0.01 | 5.43 | 76.38 | 11.21 | 0.51 | 88.09 | 11.91 | |||||||||||
Source: Pioneer Federal Savings and Loan Association; S&P Global.
59
Feldman Financial Advisors, Inc.
Table 19
Growth Rates, Credit Risk, and Loan Composition
As of or For the Last Twelve Months Ended June 30, 2025
| Allow. | Allow. | Resid. | Other | Non- | ||||||||||||||||||||
| Asset | Loan | Deposit | NPLs(1)/ | NPAs(1)/ | for Credit | for Credit | Real Est. | Real Est. | Real Est. | |||||||||||||||
| Growth | Growth | Growth | Total | Total | Losses/ | Losses/ | Loans(2)/ | Loans/ | Loans/ | |||||||||||||||
| Rate | Rate | Rate | Loans | Assets | NPLs(1) | Loans | Loans | Loans | Loans | |||||||||||||||
| Pioneer Federal S&LA | (0.05 | ) | 1.03 | (0.32 | ) | 0.66 | 0.50 | 192.46 | 1.27 | 88.57 | 8.53 | 2.90 | ||||||||||||
| Comparative Group Average | 1.56 | 5.16 | 2.86 | 0.70 | 0.54 | 274.21 | 1.03 | 46.75 | 33.42 | 19.83 | ||||||||||||||
| Comparative Group Median | 2.52 | 5.95 | 4.20 | 0.45 | 0.40 | 179.82 | 1.02 | 44.30 | 35.61 | 14.66 | ||||||||||||||
| All Public Thrift Average | 1.60 | 3.61 | 4.78 | 0.84 | 0.64 | 223.67 | 0.96 | 33.22 | 43.29 | 23.50 | ||||||||||||||
| All Public Thrift Median | 1.61 | 2.75 | 4.53 | 0.50 | 0.40 | 170.23 | 0.96 | 29.06 | 54.54 | 16.40 | ||||||||||||||
| Comparative Group | ||||||||||||||||||||||||
| Affinity Bancshares, Inc. | 6.89 | 5.62 | 8.65 | 0.62 | 0.49 | 187.12 | 1.17 | 5.99 | 44.98 | 49.03 | ||||||||||||||
| BV Financial, Inc. | 1.24 | 7.00 | 2.90 | 0.58 | 0.50 | 208.59 | 1.22 | 31.00 | 56.09 | 12.91 | ||||||||||||||
| Catalyst Bancorp, Inc. | (7.30 | ) | 9.33 | 1.19 | 0.87 | 0.56 | 167.08 | 1.45 | 46.33 | 23.52 | 30.15 | |||||||||||||
| Central Plains Bancshares, Inc. | 7.35 | 6.28 | 6.35 | 0.10 | 0.09 | NM | 1.32 | 26.91 | 46.20 | 26.88 | ||||||||||||||
| Fifth District Bancorp, Inc. | 4.61 | 3.18 | (7.08 | ) | 0.33 | 0.24 | 133.99 | 0.45 | 90.45 | 4.42 | 5.13 | |||||||||||||
| First Seacoast Bancorp, Inc. | 0.52 | 0.90 | 4.55 | 0.00 | 0.00 | NM | 0.80 | 62.77 | 20.83 | 16.40 | ||||||||||||||
| Home Federal Bancorp, Inc. | (4.40 | ) | (2.12 | ) | (4.83 | ) | 0.56 | 0.59 | 172.53 | 0.96 | 42.79 | 44.85 | 12.36 | |||||||||||
| Magyar Bancorp, Inc. | 4.57 | 11.21 | 3.90 | 0.11 | 0.31 | 875.98 | 0.95 | 29.06 | 62.08 | 8.86 | ||||||||||||||
| NSTS Bancorp, Inc. | 3.79 | 0.77 | 8.51 | 0.21 | 0.10 | 418.12 | 0.87 | 86.39 | 4.85 | 8.76 | ||||||||||||||
| Texas Community Bancshares, Inc. | (1.66 | ) | 9.43 | 4.50 | 3.58 | 2.52 | 30.31 | 1.09 | 45.82 | 26.36 | 27.82 |
| (1) | Includes accruing troubled debt restructurings and excludes accruing loans past due 30-89 days. | |
| (2) | Includes home equity and second mortgage loans. |
Source: Pioneer Federal Savings and Loan Association; S&P Global.
60
Feldman Financial Advisors, Inc.
III. MARKET VALUE ADJUSTMENTS
General Overview
This concluding chapter of the Appraisal identifies certain additional adjustments to the Association’s estimated pro forma market value relative to the Comparative Group selected in Chapter II. The adjustments discussed in this chapter are made from the viewpoints of potential investors, which would include depositors holding subscription rights and unrelated parties who may purchase stock in a community offering. It is assumed that these potential investors are aware of all relevant and necessary facts as they would pertain to the value of the Association relative to other publicly traded thrift institutions and relative to alternative investments.
Our appraised value is predicated on a continuation of the current operating environment for the Association and thrift institutions in general. Changes in the Association’s operating performance along with changes in the local and national economy, the stock market, interest rates, the regulatory environment, and other external factors may occur from time to time, often with great unpredictability, which could materially impact the pro forma market value of the Association or thrift stocks in general. Therefore, the Valuation Range provided herein is subject to a more current re-evaluation prior to the actual completion of the Conversion and Stock Offering.
In addition to the comparative operating fundamentals discussed in Chapter II, it is important to address additional market value adjustments based on certain financial and other criteria, which include, among other factors:
(1) Earnings Growth and Viability
(2) Financial Condition
(3) Market Area
(4) Management
61
Feldman Financial Advisors, Inc.
(5) Dividend Payments
(6) Liquidity of the Stock Issue
(7) Subscription Interest
(8) Recent Acquisition Activity
(9) Stock Market Conditions and New Issue Discount
Earnings Growth and Viability
Earnings prospects are dependent upon the sensitivity of asset yields and liability costs to changes in market rates, the credit quality of assets, the stability of non-interest components of income and expense, and the ability to leverage the balance sheet. Each of the foregoing is an important factor for investors in assessing earnings growth and viability. The Association’s profitability in recent years has been restrained due to rising operating expenses and a relatively low level of non-interest income. These fundamental disadvantages are offset partially by the Association’s solid net interest margin and low level of credit-related provisions.
The Association’s recent earnings ROA measured 0.13% for the LTM period versus the Comparative Group median of 0.70%. On a core earnings basis, which excludes non-recurring items, the Association’s LTM core ROA of 0.19% also trailed the Comparative Group median core ROA of 0.67%. The Association’s increased capital position after the Stock Offering will help to improve its net interest margin across changing interest rate and business cycles, provide added interest rate risk protection, and support additional leverage capacity to grow the balance sheet. In the near term, the Association’s profitability will continue to be challenged by net interest margin pressure due to its high concentration of fixed-rate mortgage loans and the outstanding FHLB borrowing, increased costs due to potential staff additions and a planned data processing systems conversion, new stock benefit plans, and ongoing public company costs. Based on the Association’s basic earnings fundamentals and continuing challenge to grow the loan portfolio and generate revenue from the increased expenditures, we believe that the uncertain viability of increasing profitability meaningfully warrants a downward adjustment to the Association’s pro forma market value relative to the Comparative Group.
62
Feldman Financial Advisors, Inc.
Financial Condition
As discussed and summarized in Chapter I, the Association’s balance sheet composition reflects a large concentration of fixed-rate residential mortgage loans. The significant level of fixed-rate loans heightens the Association’s interest rate risk exposure. The Association relies mainly on its deposit base as a funding source and recently added FHLB borrowing to supplement deposits. Historically, the Association’s deposit base has been composed mainly of core deposits, which amounted to 65.4% of total deposits at June 30, 2025. Relative to the Comparative Group, the Association exhibited a slightly higher level of equity capital, a higher ratio of loans to assets, and comparable measures of asset quality. Before the infusion of net capital proceeds, the Association’s total equity ratio at 16.27% of assets was positioned moderately above the 15.09% Comparative Group median. The selection criteria ensured a set of Comparative Group companies with solid capital positions, emphasis on real estate lending, and satisfactory asset quality, similar to the Association’s financial profile. Therefore, on the whole, we believe that no adjustment is warranted for the Association’s financial condition relative to the Comparative Group.
Market Area
The members of the Comparative Group are located in various regions of the country. The Comparative Group companies are characterized by a cross-section of market areas that constitute smaller to larger metropolitan areas with relatively stable economies and moderate population growth prospects. Pioneer Federal’s primary market area encompasses Powell and Beaverhead Counties, along with contiguous counties and areas in southwestern Montana. The Association’s market area is sparsely populated, with the primary economic drivers encompassing agriculture, health care, tourism, and energy and resources, including forest and mineral products.
63
Feldman Financial Advisors, Inc.
As shown in Table 20, the median household income was $64,818 in Powell County and $63,124 in Beaverhead County. These areas are projecting population expansion over the next five years of 3.6% in Powell County and 6.3% in Beaverhead County. The unemployment rates for June 2025 were 3.2% and 2.3% in Powell County and Beaverhead County, respectively. Most of the Comparative Group companies exhibited moderately higher household income levels in their respective market areas , but lower rates of population growth and higher unemployment rates as indicated by the Comparative Group average and median data. In recognition of these offsetting demographic factors, we believe that no additional adjustment is warranted for market area.
Table 20
Comparative Market Area Data
Pioneer Federal Savings and Loan Association and the Comparative Group
| Wtd. Avg. | Wtd. Avg. | |||||||||||||
| Median | Estimated | Unemployment | ||||||||||||
| Household | Population | Rate (2) | ||||||||||||
| Income | Growth | June | ||||||||||||
| Headquarters | 2025 (1) | 2025-30 (1) | 2025 | |||||||||||
| Company | Location | ($) | (%) | (%) | ||||||||||
| Pioneer Federal Savings and Loan Assn. | Deer Lodge, MT (1) | 64,020 | 4.86 | 2.8 | ||||||||||
| [Powell County, MT] | 64,818 | 3.56 | 3.2 | |||||||||||
| [Beaverhead County, MT] | 63,124 | 6.32 | 2.3 | |||||||||||
| Comparative Group Average | 74,033 | 1.27 | 4.5 | |||||||||||
| Comparative Group Median | 77,372 | 1.33 | 4.7 | |||||||||||
| Comparative Group | ||||||||||||||
| Affinity Bancshares, Inc. | Covington, GA | 87,947 | 4.39 | 3.6 | ||||||||||
| BV Financial, Inc. | Baltimore, MD | 84,878 | 1.62 | 3.6 | ||||||||||
| Catalyst Bancorp, Inc. | Opelousas, LA | 45,999 | 0.16 | 6.0 | ||||||||||
| Central Plains Bancshares, Inc. | Grand Island, NE | 69,866 | 1.14 | 4.4 | ||||||||||
| Fifth District Bancorp, Inc. | New Orleans, LA | 61,991 | (6.32 | ) | 5.1 | |||||||||
| First Seacoast Bancorp, Inc. | Dover, NH | 88,464 | 3.45 | 2.7 | ||||||||||
| Home Federal Bancorp, Inc. | Shreveport, LA | 54,077 | (1.69 | ) | 5.0 | |||||||||
| Magyar Bancorp, Inc. | New Brunswick, NJ | 106,408 | 1.51 | 5.4 | ||||||||||
| NSTS Bancorp, Inc. | Waukegan, IL | 86,627 | (0.74 | ) | 4.7 | |||||||||
| Texas Community Bancshares, Inc. | Mineola, TX | 54,077 | 9.13 | 4.6 | ||||||||||
| (1) | Weighted average based on pro rata branch deposit totals of each company in its primary MSA (or county) markets. |
| (2) | Based on unemployment rate in company's primary MSA (or county) market as ranked by deposits. |
Source: Claritas; S&P Global; U.S. Bureau of Labor Statistics.
64
Feldman Financial Advisors, Inc.
Management
Management’s principal challenges are to generate profitable results, monitor credit risks, and control operating costs while the Association competes in an increasingly challenging financial services environment. The normal challenges facing the Association in attempting to deliver earnings growth and enhance its competitiveness remain paramount as it attempts to leverage the net capital proceeds from the Stock Offering. Phillip Willett is the current President and CEO of Pioneer Federal, a role he has held since January 2018, and will serve in the same role with PSB Financial and Pioneer State Bank. He previously served as Executive Vice President of the Association from June 2016 to December 2017 and has over 20 years of experience in banking.
The Association’s management team has ongoing challenges ahead in improving earnings results, growing the retail and commercial banking franchises, and controlling operating expenses as the organization transitions to a public company and seeks to leverage the incremental capital. Because of the Association’s relatively small size and lean staffing profile, its executive officers fulfill a broad range of job functions and the Association’s successful operation is significantly dependent on its senior management team. Investors will likely rely upon actual financial results as the means of evaluating the future performance of management as the Association pursues its asset growth and earnings improvement objectives. We have taken these factors into account collectively and believe that no adjustment is warranted relative to the Comparative Group for this factor.
65
Feldman Financial Advisors, Inc.
Dividend Payments
Following the completion of the Conversion and Stock Offering, the Company’s Board of Directors will have the authority to declare cash dividends on the shares of common stock, subject to statutory and regulatory requirements. However, no decision has been made with respect to the amount, if any, and timing of any dividend payments. The payment and amount of any dividends will depend upon many factors, including the following: (1) the financial condition and operating results of the Company and the Association; (2) regulatory capital requirements and limitations on dividends; (3) other uses of funds for the long-term value of stockholders; (4) tax considerations; and (5) general economic conditions. There is no assurance that PSB Financial will actually pay cash dividends or that, if paid, such dividends will not be reduced or eliminated in the future.
Payment of cash dividends has become commonplace among publicly traded thrifts with solid capital levels. Three of the 10 members of the Comparative Group currently pay regular cash dividends, while approximately 58% of the companies in the All Public Thrift aggregate pay dividends. The median dividend yields of the Comparative Group and All Public Thrift aggregate were 0.00% and 0.93% as of September 2, 2025, respectively. Based on the anticipated strong capital levels of Pioneer State Bank and PSB Financial after the Stock Offering, investors are likely to expect that PSB Financial has the capacity to commence paying regular dividends at some opportune time after the Stock Offering is completed as a means of enhancing shareholder returns. Therefore, we have concluded that no adjustment is warranted for purposes of dividend policy.
Liquidity of the Stock Issue
With the increased number of market makers and institutional investors following thrift stocks, the majority of initial public offerings by thrift institutions are able to develop a public market for their new stock issues. Most publicly traded thrift stocks continue to be traded on the NASDAQ Stock Market. All 10 members of the Comparative Group are listed on the NASDAQ Stock Market. PSB Financial expects that its shares of common stock will be quoted on the OTCQB Market operated by the OTC Markets Group upon conclusion of the Conversion and Stock Offering.
66
Feldman Financial Advisors, Inc.
Stock liquidity connotes the relative ease and promptness with which a security may be sold when desired, at a representative current price, without material concession in price merely because of the necessity of sale. Empirical evidence demonstrates that investors are willing to pay a premium for this level of liquidity, or conversely, extract a discount relative to actively traded securities or other investment interests that lack this high degree of liquidity. The development and maintenance of a public market, having the desirable characteristics of depth, liquidity, and orderliness, depend on the existence of willing buyers and sellers.
The median market capitalization of the Comparative Group companies was $62.5 million as of September 2, 2025. The All Public Thrift median market capitalization was much higher at $156.3 million. Of the 10 companies in the Comparative Group, all are traded on NASDAQ Stock Market and indicated an overall average daily trading volume of approximately 10,800 shares over the LTM period. Due to the smaller size of the Stock Offering and its anticipated listing on the OTCQB Market, it is questionable that an active trading market for PSB Financial’s common shares will develop to the extent experienced by the stock issues of the Comparative Group traded on the NASDAQ Stock Market. Therefore, we have concluded that a downward adjustment to the Association’s estimated pro forma market value is warranted to address the comparative difference in liquidity of the issue.
Subscription Interest
The Association has retained the services of Keefe, Bruyette & Woods, Inc. to assist in the marketing and sale of the Stock Offering. The Association’s ESOP intends to purchase shares in the Stock Offering equal to 8.0% of the total amount of common stock to be outstanding. The Association expects its directors and executive officers, together with their associates, to purchase 107,700 shares of common stock in the Stock Offering for an aggregate amount of $1.1 million based on a $10.00 offering price per share. The minimum number of shares of common stock that may be purchased in the Stock Offering is 25 shares ($250 equivalent). Excluding the ESOP purchase, the maximum number of shares of common stock that may be purchased in the Stock Offering by any individual or individuals acting through a single qualifying account held jointly is 25,000 shares ($250,000 equivalent). No person together with an associate or group of persons acting in concert may purchase more than 40,000 shares ($400,000 equivalent).
67
Feldman Financial Advisors, Inc.
Recent subscription interest in thrift stock conversion offerings has been varied. Three standard conversion offerings have been completed thus far in 2025. Only one of these three offerings was oversubscribed in the subscription phase. Magnolia Bancorp (Metairie, Louisiana) completed its offering in January 2025 with gross proceeds raised of $8.3 million, representing the maximum of its offering range. Security Midwest Bancorp (Springfield, Illinois) closed its offering in July 2025 at a level between the minimum and the midpoint of the offering and raised gross proceeds of $8.9 million. Avidia Bancorp (Hudson, Massachusetts) closed its offering in July 2025 at a level representing the adjusted maximum of the offering and raised gross proceeds of $191.8 million following an oversubscription in the first subscription tier by eligible depositors.
Investor interest in recent thrift stock issues has been supported by the overall favorable performance results of the banking industry, stable housing market conditions, appealing after-market pricing trends, and the expectation of continued merger and acquisition activity. We are not currently aware of any additional market evidence or characteristics that may help predict the level of interest in the Association’s subscription offering. Accordingly, absent actual results of the subscription offering, we believe that subscription interest is currently a neutral factor and, at the present time, requires no further adjustment.
68
Feldman Financial Advisors, Inc.
Recent Acquisition Activity
Table 21 summarizes recent acquisition activity involving commercial banks and thrift institutions based in the state of Montana from January 1, 2017 to September 2, 2025. During this period, all of the sellers in the listed acquisition transactions were commercial banks. The largest transaction involved the acquisition in 2018 of Inter-Mountain Bancorporation by Glacier Bancorp. Eagle Bancorp Montana has been among the active acquirers in the state, purchasing four banks in Montana over the past eight years. The acquisition valuation ratios paid in these transactions generally have followed the nationwide acquisition valuation trends. Given that there will be significant charter restrictions on the ability to acquire control of PSB Financial for a period of five years following the Conversion, we do not believe that acquisition premiums are a significant factor to consider in analyzing the Association’s pro forma market value. Moreover, the standard of value applied herein does not require an acquisition value determination.
Stock Market Conditions and New Issue Discount
Table 22 displays the one-year performance of the S&P 500, NASDAQ Bank, and S&P U.S. SmallCap Banks indexes. The NASDAQ Bank Index increased by 8.0% over the one-year period ended September 2, 2025, trailing the broader S&P 500 Index, which was up 16.0% during this period. Over the three-year period, the NASDAQ Bank Index is up 10.6% as compared to the S&P 500 Index advancing significantly by 63.5%, as shown in Table 23. The divergence in bank and thrift stock prices from the overall market commenced in March 2023 following the sudden failure and liquidation of three large, high-profile commercial banks. These events led to a greater focus by financial institutions, investors, and regulators on balance sheet liquidity, funding sources for financial institutions and the composition of their deposits including the amount of uninsured deposits, the level of AOCL deficits, regulatory capital levels, and interest rate risk management.
69
Feldman Financial Advisors, Inc.
Table 21
Summary of Montana Bank and Thrift Acquisition Activity
Transactions Announced After January 1, 2017
| Seller's Prior Financial Data | Offer Value to | |||||||||||||||||||||||||||||||||||||
| Total | Equity/ | LTM | LTM | Offer | Book | Tang. | LTM | Total | ||||||||||||||||||||||||||||||
| Assets | Assets | ROA | ROE | Date | Date | Value | Value | Book | EPS | Assets | ||||||||||||||||||||||||||||
| Buyer | St. | Seller | St. | ($Mil.) | (%) | (%) | (%) | Anncd. | Completed | ($Mil.) | (%) | (%) | (x) | (%) | ||||||||||||||||||||||||
| Median | 92.8 | 10.83 | 1.30 | 13.63 | NA | NA | 18.7 | 135.8 | 140.0 | 16.05 | 16.84 | |||||||||||||||||||||||||||
| Average | 168.7 | 10.83 | 0.78 | 5.49 | NA | NA | 52.4 | 140.4 | 149.2 | 16.51 | 15.57 | |||||||||||||||||||||||||||
| Frontier Credit Union | ID | First Citizens Bank of Butte | MT | 75.3 | 11.45 | 1.10 | 10.18 | 05/01/25 | Pending | NA | NA | NA | NA | NA | ||||||||||||||||||||||||
| Forstrom Bancorp. Inc. | MN | Stockmens Bank | MT | 42.0 | 10.39 | 0.52 | 5.32 | 09/20/24 | 01/10/25 | NA | NA | NA | NA | NA | ||||||||||||||||||||||||
| Forstrom Bancorp. Inc. | MN | Granite Mountain Bank Inc. | MT | 129.2 | 7.50 | 1.40 | 20.32 | 01/15/23 | 06/02/23 | NA | NA | NA | NA | NA | ||||||||||||||||||||||||
| Bitterroot Holding Co. | MT | Antler Land Co. | MT | 134.7 | 9.73 | 1.59 | 17.14 | 11/19/21 | 04/18/22 | NA | NA | NA | NA | NA | ||||||||||||||||||||||||
| Eagle Bancorp Montana, Inc. | MT | First Community Bancorp Inc. | MT | 376.8 | 11.13 | 1.60 | 14.18 | 10/01/21 | 04/30/22 | 41.3 | 135.8 | 140.0 | 7.23 | 11.30 | ||||||||||||||||||||||||
| Yellowstone Holding Co. | MT | 1st Bank | MT | 58.8 | 8.73 | 1.30 | 14.77 | 04/24/21 | 09/18/21 | NA | NA | NA | NA | NA | ||||||||||||||||||||||||
| Kimberly Leasing Corp. | WI | First Citizens Bank of Polson | MT | 16.9 | 5.16 | (6.42 | ) | (87.18 | ) | 03/04/20 | 05/15/20 | NA | NA | NA | NA | NA | ||||||||||||||||||||||
| American Bancor Ltd. | ND | Beartooth Financial Corp. | MT | 46.7 | 17.06 | 1.11 | 6.71 | 09/23/19 | 01/31/20 | NA | NA | NA | NA | NA | ||||||||||||||||||||||||
| Eagle Bancorp Montana Inc. | MT | Western Hldg. Co. of Wolf Pt. | MT | 100.2 | 10.95 | 1.28 | 12.36 | 08/09/19 | 01/01/20 | 13.5 | 119.1 | 119.1 | 16.05 | 13.44 | ||||||||||||||||||||||||
| Bridger Co. | MT | Valley Bank/First Security Bank | MT | 75.6 | 11.14 | NA | NA | 07/03/19 | 10/05/19 | NA | NA | NA | NA | NA | ||||||||||||||||||||||||
| American Bancor Ltd. | ND | Prairie Mountain Bank | MT | 93.7 | 10.67 | 1.18 | 11.31 | 06/03/19 | 10/18/19 | NA | NA | NA | NA | NA | ||||||||||||||||||||||||
| Eagle Bancorp Montana, Inc. | MT | Big Muddy Bancorp Inc. | MT | 110.9 | 11.86 | 1.47 | 13.63 | 08/21/18 | 01/01/19 | 18.7 | 137.0 | 140.9 | 24.67 | 16.84 | ||||||||||||||||||||||||
| Glacier Bancorp Inc. | MT | Inter-Mountain Bancorp. Inc. | MT | 1,009.6 | 10.70 | 1.85 | 17.97 | 10/26/17 | 02/28/18 | 170.9 | 186.1 | 222.0 | 20.23 | 16.92 | ||||||||||||||||||||||||
| Eagle Bancorp Montana, Inc. | MT | TwinCo Inc. | MT | 91.8 | 15.10 | 2.12 | 14.61 | 09/06/17 | 01/31/18 | 17.8 | 123.8 | 123.8 | 14.37 | 19.34 | ||||||||||||||||||||||||
Source: S&P Global.
70
Feldman Financial Advisors, Inc.
Table 22
Comparative One-Year Stock Market Index Performance
For the One-Year Period Ended September 2, 2025
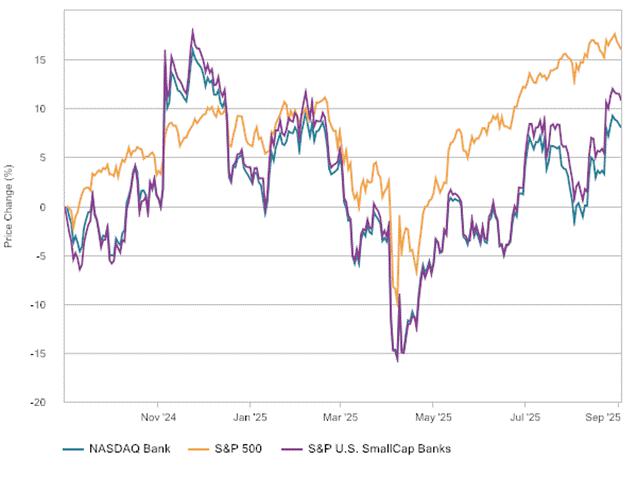
| S&P 500 Index | + | 16.0% |
| NASDAQ Bank Index | + | 8.0% |
| U.S. SmallCap Banks Index | + | 10.8% |
71
Feldman Financial Advisors, Inc.
Table 23
Comparative Three-Year Stock Market Index Performance
For the Three-Year Period Ended September 2, 2025
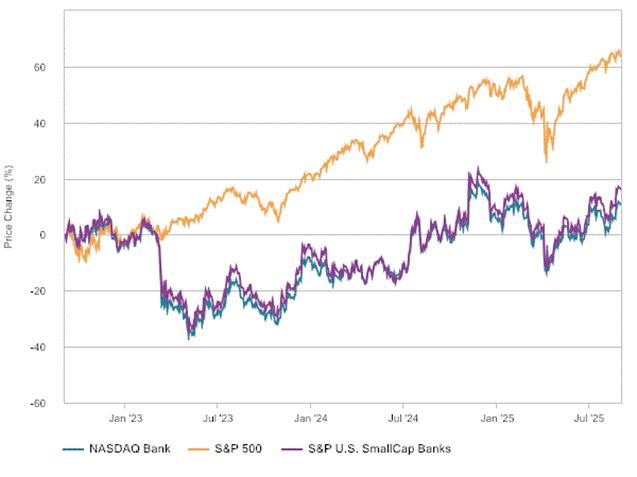
| S&P 500 Index | + | 63.5% |
| NASDAQ Bank Index | + | 10.6% |
| U.S. SmallCap Banks Index | + | 16.0% |
72
Feldman Financial Advisors, Inc.
While the financial sector lagged the S&P 500 Index through much of 2023, it started to outperform in mid-2024 and then spiked further upward after the U.S. elections in November 2024. The strong performance by financials was bolstered by the steeper yield curve, falling rates, and the strong U.S. economy. The Federal Reserve lowered the target federal funds rate by 50 basis points in September 2024, which was followed by consecutive 25-basis point reductions in November and December 2024. Additionally, the prospect rose that, under a new presidential administration, there could be a loosening of banking regulations, which could lead to an improvement in banking industry profits and expanded consolidation activity.
However, market turbulence emerged in February 2025 that pushed stock prices lower and created tremendous volatility. The S&P 500 Index reached an all-time high in February 2025, but investor sentiment shifted sharply thereafter due to concerns about (1) the lofty prices of big tech stocks, (2) the possibility of slower economic growth, and (3) repercussions related to trade policy and tariffs. The financial sector turned weaker as recession fears and other economic headwinds caused investors to question the outlook for consumer loan demand and credit quality stability.
More recently, beginning in May 2025 through August 2025, major U.S. stock indexes rose steadily, buoyed by signs of a cooling labor market that fueled optimism for interest rate cuts from the Federal Reserve. While market momentum was strong, renewed inflation concerns have injected more volatility into overall stock prices. On a year-to-date basis through September 2, 2025, the S&P 500 Index was up 9.1% despite the current presidential administration imposing severe tariffs. Nevertheless, many stock research analysts have lowered their earnings forecasts for future quarters. The combination of a rising stock market and declining earnings estimates has left the S&P 500 Index at 22.4 times forward earnings, an expensive valuation level that has historically led to market declines in the next year.
73
Feldman Financial Advisors, Inc.
A “new issue” discount that reflects investor concerns and investment risks inherent in all initial public offerings is a factor to be considered for purposes of valuing converting thrifts. Table 24 presents a summary of the 15 standard thrift conversion offerings completed since January 1, 2022. There were three and four such conversion offerings that closed in 2024 and year-to-date 2025, respectively. The final pricing of these conversion offerings confirms the presence of the new issue discount in the pro forma market valuations of converting thrifts versus the trading valuations of existing publicly traded thrifts.
The distinction of the new issue discount is most apparent with the price-to-book value ratio because the pro forma equity calculation involves combining the net new capital proceeds with the historical equity of the converting company. The median pro forma price-to-book value ratio for standard thrift conversion offerings was 45.3% for the 2024 to 2025 period, and the median pro forma price-to-tangible book ratio was 45.3%.
Historically, newly converted thrifts have gradually traded upward in the after-market to a range near existing thrift stock valuation levels, but found resistance approaching book value until a discernible trend in earnings improvement was evident. Pricing a new offering at a relatively high ratio in relation to pro forma book value, because of the mathematics of the calculation, would require substantial increases in valuations resulting in unsustainable price-to-earnings ratios and marginal returns on equity.
Accordingly, thrift conversions continue to be priced at discounts to comparable publicly traded companies. This is due to the relatively high pro forma equity ratios, expected low returns on equity, and the uncertainty regarding the prospects of an institution to leverage the balance sheet prudently and effectively in the current economic environment and against the backdrop of an increasingly competitive banking sector and volatile equities market.
74
Feldman Financial Advisors, Inc.
Table 24
Summary of Standard Conversion Offerings
Transactions Completed Since January 1, 2022
| Pro Forma Ratios | After-Market | Price | |||||||||||||||||||||||||||||||||
| Gross | Price/ | Price/ | Price/ | Tang. | Closing | Price Change | Change | ||||||||||||||||||||||||||||
| Stock | Total | Offering | Book | Tang. | LTM | Eqty./ | IPO | Price | One | One | One | Through | |||||||||||||||||||||||
| Stock | Offering | Assets | Proceeds | Value | Book | EPS | Assets | Price | 9/2/25 | Day | Week | Month | 9/2/25 | ||||||||||||||||||||||
| Company | State | Exchange | Date | ($Mil.) | ($Mil.) | (%) | (%) | (x) | (%) | ($) | ($) | (%) | (%) | (%) | (%) | ||||||||||||||||||||
| Average | 782.3 | 80.3 | 51.5 | 52.3 | 23.7 | 18.96 | NA | NA | 16.6 | 19.6 | 21.6 | 33.6 | |||||||||||||||||||||||
| Median | 267.5 | 41.3 | 50.2 | 50.9 | 17.5 | 16.21 | NA | NA | 14.0 | 18.2 | 24.6 | 24.6 | |||||||||||||||||||||||
| Average (2024-25) | 711.6 | 67.8 | 48.5 | 48.9 | 32.7 | 18.89 | NA | NA | 15.9 | 20.0 | 22.3 | 19.1 | |||||||||||||||||||||||
| Median (2024-25) | 267.5 | 8.9 | 45.3 | 45.3 | 40.0 | 12.24 | NA | NA | 13.5 | 15.0 | 19.5 | 18.8 | |||||||||||||||||||||||
| Standard Conversion Offerings | |||||||||||||||||||||||||||||||||||
| Avidia Bancorp, Inc. | MA | NYSE | 07/31/25 | 2,656.5 | 191.8 | 56.2 | 58.2 | 14.3 | 12.24 | 10.00 | 15.50 | 46.4 | 45.8 | 55.0 | 55.0 | ||||||||||||||||||||
| Security Midwest Bancorp, Inc. | IL | OTCQB | 07/31/25 | 217.6 | 8.9 | 45.3 | 45.3 | 9.6 | 8.90 | 10.00 | 12.46 | 14.0 | 11.2 | 24.6 | 24.6 | ||||||||||||||||||||
| Magnolia Bancorp, Inc. | LA | OTCQB | 01/14/25 | 35.1 | 8.3 | 41.8 | 41.8 | NM | 48.12 | 10.00 | 11.00 | 11.2 | 10.1 | 12.5 | 10.0 | ||||||||||||||||||||
| Monroe Federal Bancorp, Inc. | OH | OTCQB | 10/23/24 | 147.5 | 5.3 | 44.2 | 44.2 | 55.6 | 7.74 | 10.00 | 13.25 | 13.5 | 37.5 | 29.1 | 32.5 | ||||||||||||||||||||
| FB Bancorp, Inc. | LA | NASDAQ | 10/22/24 | 1,171.5 | 198.4 | 60.5 | 61.6 | 40.0 | 25.95 | 10.00 | 11.88 | 18.6 | 18.2 | 19.5 | 18.8 | ||||||||||||||||||||
| EWSB Bancorp, Inc. | WI | OTCQB | 09/18/24 | 267.5 | 7.5 | 46.3 | 46.3 | NM | 5.84 | 10.00 | 8.75 | 5.0 | 15.0 | 10.1 | (12.5 | ) | |||||||||||||||||||
| Fifth District Bancorp, Inc. | LA | NASDAQ | 07/31/24 | 485.7 | 54.6 | 45.0 | 45.0 | 44.1 | 23.45 | 10.00 | 10.51 | 2.5 | 2.4 | 5.0 | 5.1 | ||||||||||||||||||||
| NB Bancorp, Inc. | MA | NASDAQ | 12/27/23 | 4,231.8 | 410.0 | 60.1 | 60.2 | 11.9 | 16.21 | 10.00 | 18.91 | 37.7 | 36.1 | 46.7 | 89.1 | ||||||||||||||||||||
| Central Plains Bancshares, Inc. | NE | NASDAQ | 10/19/23 | 450.4 | 41.3 | 56.5 | 56.5 | 19.2 | 15.47 | 10.00 | 15.74 | (9.0 | ) | (9.3 | ) | (0.7 | ) | 57.4 | |||||||||||||||||
| PFS Bancorp, Inc. | IL | OTCQB | 10/17/23 | 184.7 | 17.3 | 50.9 | 50.9 | 17.5 | 17.08 | 10.00 | 11.96 | (10.0 | ) | (11.0 | ) | (11.0 | ) | 19.6 | |||||||||||||||||
| SR Bancorp, Inc. (1) | NJ | NASDAQ | 09/19/23 | 651.5 | 90.6 | 49.0 | 57.3 | 15.7 | 14.76 | 10.00 | 15.00 | (7.2 | ) | (14.0 | ) | (18.5 | ) | 50.0 | |||||||||||||||||
| Mercer Bancorp, Inc. | OH | OTCQB | 07/26/23 | 149.0 | 9.7 | 47.5 | 47.5 | 6.9 | 11.32 | 10.00 | 15.17 | 30.0 | 42.4 | 37.5 | 51.7 | ||||||||||||||||||||
| ECB Bancorp, Inc. | MA | NASDAQ | 07/27/22 | 688.6 | 89.2 | 59.8 | 59.8 | 25.9 | 20.64 | 10.00 | 17.05 | 40.9 | 41.3 | 40.5 | 70.5 | ||||||||||||||||||||
| VWF Bancorp, Inc. | OH | OTCQX | 07/13/22 | 137.0 | 19.2 | 50.2 | 50.2 | NA | 24.84 | 10.00 | 11.30 | 29.0 | 45.0 | 49.1 | 13.0 | ||||||||||||||||||||
| NSTS Bancorp, Inc. | IL | NASDAQ | 01/18/22 | 259.9 | 52.9 | 59.7 | 59.7 | NA | 31.81 | 10.00 | 11.90 | 25.9 | 23.0 | 24.9 | 19.0 | ||||||||||||||||||||
| (1) | Conversion transaction involved simultaneous cash acquisition of Regal Bancorp, Inc. |
Source: S&P Global.
75
Feldman Financial Advisors, Inc.
The 4,421 FDIC-insured commercial banks and savings institutions reported quarterly net income of $69.9 billion in the second quarter of 2025, down $677.3 million or 1.0% from the first quarter of 2025. The banking industry reported an aggregate ROA of 1.13% in the second quarter of 2025, down from 1.16% in the first quarter of 2025 and 1.20% in the year-ago quarter. Increases in net interest income and non-interest income were offset by moderately higher credit provisions.
The ROA for the 3,982 community banks (including commercial banks and savings institutions) improved to 1.11% for the second quarter of 2025, compared to 0.99% for the first quarter of 2025. Higher net interest income (up 5.7%) and higher non-interest income (up 10.1%) more than offset higher non-interest expense (up 3.5%) and higher provision expense (up 29.2%). The community bank net interest margin increased 16 basis points from the prior quarter and 32 basis points year-over-year to 3.62%. The efficiency ratio for community banks declined to 63.0% in the second quarter of 2025 from 64.7% in the first quarter of 2025. The ratio of non-performing assets to total assets for community banks continued to increase moderately, rising from 0.46% at June 30, 2024 to 0.55% at March 31, 2025 and 0.58% at June 30, 2025. The tier 1 leverage capital ratio for community banks increased from 10.83% at June 30, 2024 to 10.91% at March 31, 2025 and 11.01% at June 30, 2025.
Bank and thrift industry earnings results have continued to be solid in comparison to historical levels, but earnings growth has been challenged recently by increasing credit-related charges. Industry operating expenses generally continue to rise in the face of sluggish growth in non-interest operating income. While bank and thrift industry capital levels remain strong and overall asset quality has stabilized, there continue to be volatile swings in the market for bank and thrift stocks in response to the economic outlook and the anxiety in the overall market that is contributing to the current fluctuations. Therefore, we believe that with the heightened uncertainty attendant to prevailing stock market conditions, the new issue discount continues to be highly relevant because of the risks and uncertainties associated with a new stock offering in the current market and warrants a downward adjustment.
76
Feldman Financial Advisors, Inc.
Adjustments Conclusion
It is our opinion that the Association’s pro forma market value should be discounted relative to the Comparative Group. Our conclusion is based on downward adjustments for earnings growth and viability, liquidity of the issue, and the new issue discount underlying current stock market conditions. Converting thrifts are often valued at meaningful discounts to peer trading companies relative to price-to-book value and price-to-tangible book value ratios. Due to initially restrained levels of post-offering earnings growth without the benefit of sustained leveraging of balance sheets, resulting price-to-earnings ratios may reflect premiums to established trading companies. It is the judgment of the appraiser to balance the relative dynamics of price-to-book and price-to-earnings discounts or premiums.
Valuation Approach
In determining the estimated pro forma market value of the Association, we have employed the comparative company approach and considered the following pricing ratios: price-to-book value per share (“P/B”), price-to-tangible book value per share (“P/TB”), price-to-earnings per share (“P/E”), and price-to-assets (“P/A”). Table 25 presents the trading market valuation ratios of the Comparative Group and All Public Thrift averages and medians as of September 2, 2025. As shown in Table 25, the median P/B ratio for the Comparative Group was 83.7%. Nine of the 10 members of the Comparative Group were valued at levels under book value (P/B ratio less than 100.0%). The median P/TB ratio for the Comparative Group was 84.8%. Higher equity levels have a restraining impact on P/B and P/TB ratios because of the accompanying challenge to generate competitive ROE results on such excess capital. Among the Comparative Group members, Catalyst Bancorp reported the highest equity capital ratio at 29.51% of total assets along with a P/B ratio of 66.4%. NSTS Bancorp reported an equity capital ratio of 28.20% and a P/B ratio of 80.1%. The median P/E ratio based on LTM earnings for the Comparative Group was 17.4x. On a core earnings basis, the median core P/E ratio of the Comparative Group was 16.4x. Some companies within the Comparative Group and All Public Thrift aggregate generated P/E ratios that were negative and their corresponding P/E ratios are expressed as “NM” or not meaningful.
77
Feldman Financial Advisors, Inc.
Investors continue to make decisions to purchase thrift conversion stocks and more seasoned thrift issues based upon consideration of core earnings profitability and P/B comparisons. The P/E ratio remains an important valuation ratio in the current thrift stock market. However, as noted above, the P/E ratio is not useful for companies reporting negative or low earnings. The Company’s earnings for the LTM ended June 30, 2025 amounted to $145,000 (LTM ROA of 0.13%) and its LTM core earnings amounted to $216,000 (core ROA of 0.19%). On a pro forma basis, after making adjustments for re-investment of net offering proceeds and expensing charges related to the implementation of various stock benefit plans, including the ESOP, restricted stock plan (“RSP”), and stock option plan, the Association’s pro forma earnings results are moderately higher than the historical earnings levels. The pro forma earnings results do not take into account the capacity of the Association to leverage the additional capital because of the attendant risks of executing and implementing operating strategies and business expansion initiatives.
78
Feldman Financial Advisors, Inc.
Based on our comparative financial and valuation analyses, we concluded that the Association should be discounted relative to the trading valuation ratios of the overall Comparative Group. In consideration of the foregoing factors along with the additional adjustments discussed in this chapter, we have determined pro forma P/B and P/TB ratios of approximately 44.5% at the midpoint for the Association, which reflects an aggregate pro forma midpoint of $12.0 million for the Valuation Range based on the assumptions summarized in Exhibit IV. Employing a range of 15% above and below the midpoint, the resulting minimum value of $10.2 million reflects a 40.1% P/B ratio and the resulting maximum value of $13.8 million reflects a 48.3% P/B ratio. The adjusted maximum value, computed as an additional 15% above the maximum, is positioned at $15.87 million and a P/B ratio of 52.2%. The Association’s pro forma P/B and P/TB ratios are equivalent since the Association had no intangible assets as of June 30, 2025.
The Association’s pro forma midpoint P/B and P/TB ratios of 44.5% reflect discounts of 46.9% and 47.6% to the Comparative Group median P/B and P/TB ratios of 83.7% and 84.8%, respectively. The Association’s pro forma maximum P/B and P/TB ratios of 48.3% reflect discounts of 42.3% and 43.1% to the Comparative Group median P/B and P/TB ratios of 83.7% and 84.8%, respectively. At the adjusted maximum, the Association’s pro forma P/B and P/TB ratios of 52.2% are positioned at discounts of 37.6% and 38.5% to the Comparative Group median P/B and P/TB ratios of 83.7% and 84.8% respectively.
Based on the Valuation Range as indicated above, the Association’s pro forma LTM P/E ratios measured 58.8x, 62.5x, 66.7x, and 71.4x at the minimum, midpoint, maximum, and adjusted maximum, respectively, of the Valuation Range and represent significant premiums to the Comparative Group median P/E ratio of 17.9x. The Association’s pro forma core P/E ratios were 40.0x, 45.5x, 50.0x, and 55.6x at the minimum, midpoint, maximum, and adjusted maximum, respectively, of the Valuation Range. The Association’s pro forma P/E ratios are inflated by the low level of historical profitability reported and render the P/E approach less relevant for valuation purposes and result in more reliance on the P/B approach.
79
Feldman Financial Advisors, Inc.
Based on the price-to-assets valuation metric, the Association’s pro forma midpoint of the Valuation Range at $12.0 million reflects a corresponding P/A ratio of 9.85%, ranging from 8.48% at the minimum valuation to 11.18% and 12.67% at the maximum and adjusted maximum, respectively. The Association’s pro forma P/A ratios represent discounts of 36.2%, 26.0%, 16.0%, and 4.8% at the minimum, midpoint, maximum, and adjusted maximum, respectively, of the Valuation Range as compared to the Comparative Group median P/A ratio of 13.31%. On a pro forma consolidated basis, the Company’s total equity-to-assets ratio ranges from 21.13% at the minimum valuation and 22.15% at the midpoint valuation to 23.15% at the maximum valuation and 24.27% at the adjusted maximum valuation. Thus, upon completion of the Conversion and Stock Offering, the Company’s pro forma equity capital ratios would exceed the Comparative Group average of 17.67% and median of 15.09%. Among the Comparative Group companies, only three of the members would have higher or comparable ratios of total equity-to-assets: Catalyst Bancorp at 29.51%, NSTS Bancorp at 28.20%, and Fifth District Bancorp at 24.25%. As noted earlier, the solid post-Conversion equity capital levels of the Company will provide greater expansion opportunity and flexibility, but also present challenges in generating competitive returns on equity.
Valuation Conclusion
It is our opinion that, as of September 2, 2025, the estimated pro forma market value of the Association was within a Valuation Range of $10,200,000 to $13,800,000 with a midpoint of $12,000,000. Pursuant to applicable appraisal guidelines, the Valuation Range was based upon a decrease of 15% from the midpoint value to determine the minimum value and an increase of 15% from the midpoint value to establish the maximum value. Assuming an additional increase of 15% above the maximum value would result in an adjusted maximum of $15,870,000. Based on an initial offering price of $10.00 per share, the number of shares to be sold in the Stock Offering is as follows: 1,070,000 at the minimum, 1,200,000 at the midpoint, 1,380,000 at the maximum, and 1,587,000 at the adjusted maximum. Table 25 compares the Association’s pro forma valuation ratios to the market valuation ratios of the Comparative Group.
80
Feldman Financial Advisors, Inc.
Exhibit IV-1 displays the assumptions utilized in calculating the pro forma financial consequences of the Stock Offering. Exhibit IV-2 displays the pro forma financial data at the minimum, midpoint, maximum, and adjusted maximum levels of the Valuation Range. Exhibit IV-3 provides more detailed data and calculations at the pro forma midpoint level of the Valuation Range. Exhibit IV-4 compares the pro forma valuation ratios with the averages and medians reported by the Comparative Group.
81
Feldman Financial Advisors, Inc.
Table 25
Comparative Pro Forma Market Valuation Analysis
Computed from Market Price Data as of September 2, 2025
| Current | Total | Price/ | Price/ | Price/ | Price/ | Price/ | Total | Tang. | Current | |||||||||||||||||||||
| Stock | Market | LTM | Core | Book | Tang. | Total | Equity/ | Equity/ | Dividend | |||||||||||||||||||||
| Price | Value | EPS | EPS | Value | Book | Assets | Assets | Assets | Yield | |||||||||||||||||||||
| Company | ($) | ($Mil.) | (x) | (x) | (%) | (%) | (%) | (%) | (%) | (%) | ||||||||||||||||||||
| Pioneer Federal S&LA(1) | ||||||||||||||||||||||||||||||
| Pro Forma Minimum | 10.00 | 10.2 | 58.82 | 40.00 | 40.14 | 40.14 | 8.48 | 21.13 | 21.13 | 0.00 | ||||||||||||||||||||
| Pro Forma Midpoint | 10.00 | 12.0 | 62.50 | 45.45 | 44.46 | 44.46 | 9.85 | 22.15 | 22.15 | 0.00 | ||||||||||||||||||||
| Pro Forma Maximum | 10.00 | 13.8 | 66.67 | 50.00 | 48.31 | 48.31 | 11.18 | 23.15 | 23.15 | 0.00 | ||||||||||||||||||||
| Pro Forma Adj. Maximum | 10.00 | 15.9 | 71.43 | 52.63 | 52.22 | 52.22 | 12.67 | 24.27 | 24.27 | 0.00 | ||||||||||||||||||||
| Comparative Group Average | NA | 78.9 | 17.88 | 17.10 | 82.30 | 85.37 | 14.01 | 17.67 | 17.30 | 0.69 | ||||||||||||||||||||
| Comparative Group Median | NA | 62.5 | 17.37 | 16.44 | 83.67 | 84.84 | 13.31 | 15.09 | 14.40 | 0.00 | ||||||||||||||||||||
| All Public Thrift Average(2) | NA | 615.7 | 16.75 | 16.50 | 91.92 | 100.75 | 11.72 | 14.15 | 13.50 | 1.71 | ||||||||||||||||||||
| All Public Thrift Median(2) | NA | 156.3 | 16.05 | 15.91 | 84.37 | 85.86 | 11.10 | 11.84 | 11.34 | 0.93 | ||||||||||||||||||||
| Comparative Group | ||||||||||||||||||||||||||||||
| Affinity Bancshares, Inc. | 19.79 | 124.8 | 18.50 | 16.84 | 100.39 | 117.51 | 13.34 | 13.29 | 11.58 | 0.00 | ||||||||||||||||||||
| BV Financial, Inc. | 16.74 | 162.0 | 16.25 | 16.04 | 87.24 | 94.48 | 19.02 | 21.80 | 20.47 | 0.00 | ||||||||||||||||||||
| Catalyst Bancorp, Inc. | 12.94 | 53.4 | 22.70 | 27.13 | 66.35 | 66.35 | 19.58 | 29.51 | 29.51 | 0.00 | ||||||||||||||||||||
| Central Plains Bancshares, Inc. | 15.74 | 66.9 | 15.90 | 15.90 | 78.53 | 78.53 | 13.27 | 16.90 | 16.90 | 0.00 | ||||||||||||||||||||
| Fifth District Bancorp, Inc. | 13.94 | 77.3 | 27.33 | 19.92 | 59.21 | 59.21 | 14.36 | 24.25 | 24.25 | 0.00 | ||||||||||||||||||||
| First Seacoast Bancorp, Inc. | 11.52 | 50.1 | NM | NM | 89.18 | 89.47 | 8.96 | 10.05 | 10.02 | 0.00 | ||||||||||||||||||||
| Home Federal Bancorp, Inc. | 13.34 | 40.1 | 10.59 | 10.00 | 74.54 | 80.22 | 6.75 | 9.06 | 8.47 | 4.05 | ||||||||||||||||||||
| Magyar Bancorp, Inc. | 17.11 | 110.9 | 10.83 | 10.72 | 94.89 | 95.19 | 11.18 | 11.78 | 11.75 | 1.86 | ||||||||||||||||||||
| NSTS Bancorp, Inc. | 11.90 | 58.1 | NM | NM | 80.10 | 80.10 | 22.59 | 28.20 | 28.20 | 0.00 | ||||||||||||||||||||
| Texas Community Bancshares, Inc. | 16.31 | 45.1 | 20.91 | 20.25 | 92.54 | 92.66 | 11.02 | 11.91 | 11.89 | 0.98 |
| (1) | Pro forma ratios assume an estimated pro forma market value of $10.2 million at the minimum, $12.0 million at the midpoint, $13.8 million at the maximum, and $15.87 million at the adjusted maximum. |
| (2) | All public thrifts traded on a major exchange, excluding mutual holding companies and companies being acquired in announced merger transactions. |
Source: Pioneer Federal Savings and Loan Association; S&P Global.
82
Feldman Financial Advisors, Inc.
Exhibit I
Background of Feldman Financial Advisors, Inc.
Overview of Firm
Feldman Financial Advisors provides consulting and advisory services to financial institutions and mortgage companies in the areas of corporate valuations, mergers and acquisitions, strategic planning, branch sales and purchases, developing and implementing regulatory business and capital plans, and expert witness testimony and analysis. Our senior staff members have been involved in the stock conversion process since 1982 and have valued more than 350 converting institutions.
Feldman Financial Advisors was incorporated in February 1996 by a group of consultants who were previously associated with Credit Suisse First Boston and Kaplan Associates. Each of the principals at Feldman Financial Advisors has more than 35 years of experience in consulting, and all were officers of their prior firm. Our senior staff collectively has worked with more than 1,000 commercial banks, savings institutions, credit unions, insurance companies, and mortgage companies nationwide. The firm’s office is located outside of Washington, D.C. in McLean, Virginia.
Background of Senior Professional Staff
Trent Feldman - President. Trent is a nationally recognized expert in providing strategic advice to and valuing financial service companies and advising on mergers and acquisitions. Trent was with Kaplan Associates for 14 years and was one of three founding principals at that firm. Trent also has worked at the Federal Home Loan Bank Board and with the California legislature. Trent holds Bachelor’s and Master’s Degrees from the University of California, Los Angeles.
Peter Williams - Principal. Peter specializes in merger and acquisition analysis, mutual-to-stock conversion valuations, corporate valuations, strategic business plans, and fair value accounting analysis. Peter previously was with Kaplan Associates for 13 years. Peter also worked as a Corporate Planning Analyst with the Wilmington Trust Company in Delaware. Peter holds a BA in Economics from Yale University and an MBA in Finance and Investments from The George Washington University.
I-1
Feldman Financial Advisors, Inc.
Exhibit II-1
Balance Sheets
Pioneer Federal Savings and Loan Association
As of December 31, 2023 and 2024 and June 30, 2025
(Dollars in Thousands)
| June 30, | December 31, | |||||||||||
| 2025 | 2024 | 2023 | ||||||||||
| Assets | ||||||||||||
| Cash and due from banks | $ | 883,041 | $ | 1,029,393 | $ | 1,010,448 | ||||||
| Interest-bearing deposits | 8,315,891 | 5,404,094 | 9,182,472 | |||||||||
| Cash and cash equivalents | 9,198,932 | 6,433,487 | 10,192,920 | |||||||||
| Investment securities available for sale | 9,411,834 | 9,538,032 | 11,303,990 | |||||||||
| Investment securities held to maturity | 1,849,761 | 2,005,207 | 2,835,565 | |||||||||
| Other investments | 714,761 | 729,335 | 713,120 | |||||||||
| Loans receivable | 86,230,661 | 87,535,364 | 82,176,780 | |||||||||
| Allowance for credit losses | (1,098,861 | ) | (1,208,149 | ) | (1,140,550 | ) | ||||||
| Total loans, net | 85,131,800 | 86,327,215 | 81,036,230 | |||||||||
| Premises and equipment, net | 4,976,905 | 5,118,229 | 4,715,208 | |||||||||
| Accrued interest receivable | 384,856 | 361,572 | 323,417 | |||||||||
| Cash value of life insurance | 754,002 | 744,112 | 763,732 | |||||||||
| Deferred tax asset | 484,710 | 563,577 | 665,449 | |||||||||
| Other assets | 350,973 | 288,212 | 172,897 | |||||||||
| Total Assets | $ | 113,258,534 | $ | 112,108,978 | $ | 112,722,528 | ||||||
| Liabilities and Equity | ||||||||||||
| Total deposits | $ | 85,842,459 | $ | 85,089,582 | $ | 86,071,413 | ||||||
| Advances from borrowers for taxes and insurance | 135,302 | 54,200 | 36,929 | |||||||||
| Federal Home Loan Bank advances | 8,000,000 | 8,000,000 | 8,000,000 | |||||||||
| Accrued interest payable | 94,463 | 105,112 | 33,065 | |||||||||
| Deferred compensation | 336,816 | 364,886 | 397,078 | |||||||||
| Accrued income taxes payable | 54,898 | 75,539 | 80,867 | |||||||||
| Reserve for unfunded loan commitments | 35,041 | 35,041 | 74,409 | |||||||||
| Other liabilities | 331,132 | 231,087 | 199,315 | |||||||||
| Total Liabilities | 94,830,111 | 93,955,447 | 94,893,076 | |||||||||
| Retained earnings | 18,733,227 | 18,607,441 | 18,383,704 | |||||||||
| Accumulated other comprehensive loss | (304,804 | ) | (453,910 | ) | (554,252 | ) | ||||||
| Total Equity | 18,428,423 | 18,153,531 | 17,829,452 | |||||||||
| Total Liabilities and Equity | $ | 113,258,534 | $ | 112,108,978 | $ | 112,722,528 | ||||||
Source: Pioneer Federal Savings and Loan Association, financial statements.
II-1
Feldman Financial Advisors, Inc.
Exhibit II-2
Income Statements
Pioneer Federal Savings and Loan Association
For the Years Ended December 31, 2023 and 2024
And the Six Months Ended June 30, 2024 and 2025
(Dollars in Thousands)
| Six Months Ended | Year Ended | |||||||||||||||
| June 30, | December 31, | |||||||||||||||
| 2025 | 2024 | 2024 | 2023 | |||||||||||||
| Total interest income | $ | 2,600,363 | $ | 2,435,947 | $ | 5,014,732 | $ | 4,380,954 | ||||||||
| Total interest expense | 867,082 | 863,778 | 1,822,436 | 1,088,528 | ||||||||||||
| Net interest income | 1,733,281 | 1,572,169 | 3,192,296 | 3,292,426 | ||||||||||||
| Provision for (recovery of) credit losses on loans | (104,378 | ) | - | 67,599 | 18,094 | |||||||||||
| Provision for credit losses on unfunded commitments | - | - | (39,368 | ) | 16,875 | |||||||||||
| Net interest income after provision | 1,837,659 | 1,572,169 | 3,164,065 | 3,257,457 | ||||||||||||
| Service fees | 30,001 | 35,658 | 67,892 | 65,214 | ||||||||||||
| Interchange fees | 87,100 | 56,323 | 127,435 | 137,558 | ||||||||||||
| Loan servicing income | 1,351 | 1,263 | 2,827 | 2,672 | ||||||||||||
| Increase in cash value of life insurance | 9,890 | 9,964 | (19,620 | ) | 56,496 | |||||||||||
| Net gain on sale of premises and equipment | - | 311,069 | 311,069 | - | ||||||||||||
| Other non-interest income | - | - | 5,887 | 6,492 | ||||||||||||
| Total non-interest income | 128,342 | 414,277 | 495,490 | 268,432 | ||||||||||||
| Salaries and employee benefits | 828,569 | 838,513 | 1,614,041 | 1,633,476 | ||||||||||||
| Occupancy | 268,826 | 242,432 | 486,663 | 226,908 | ||||||||||||
| Data processing | 220,421 | 209,892 | 413,892 | 434,231 | ||||||||||||
| Advertising | 56,894 | 57,050 | 104,027 | 114,487 | ||||||||||||
| Professional fees | 152,649 | 62,496 | 129,164 | 118,319 | ||||||||||||
| Directors fees | 56,700 | 54,045 | 110,745 | 129,105 | ||||||||||||
| Insurance | 23,184 | 40,291 | 77,139 | 74,978 | ||||||||||||
| Loan costs | 29,692 | 34,616 | 69,990 | 62,802 | ||||||||||||
| ATM fee expense | 30,300 | 46,718 | 96,542 | 94,873 | ||||||||||||
| Other non-interest expense | 164,044 | 136,079 | 260,121 | 246,486 | ||||||||||||
| Total non-interest expense | 1,831,279 | 1,722,132 | 3,362,324 | 3,135,665 | ||||||||||||
| Income before income taxes | 134,722 | 264,314 | 297,231 | 390,224 | ||||||||||||
| Income tax expense | 8,936 | 59,606 | 73,494 | 132,980 | ||||||||||||
| Net income | $ | 125,786 | $ | 204,708 | $ | 223,737 | $ | 257,244 | ||||||||
Source: Pioneer Federal Savings and Loan Association, financial statements.
II-2
Feldman Financial Advisors, Inc.
Exhibit II-3
Loan Portfolio Composition
Pioneer Federal Savings and Loan Association
As of December 31, 2023 and 2024 and June 30, 2025
(Dollars in Thousands)
| June 30, | December 31, | |||||||||||||||||||||||
| 2025 | 2024 | 2023 | ||||||||||||||||||||||
| Loan | Amount | Percent | Amount | Percent | Amount | Percent | ||||||||||||||||||
| Category | (000s) | (%) | (000s) | (%) | (000s) | (%) | ||||||||||||||||||
| Residential real estate loans: | ||||||||||||||||||||||||
| First liens | $ | 73,212 | 84.52 | $ | 74,275 | 84.46 | $ | 71,561 | 86.68 | |||||||||||||||
| Junior liens | 1,007 | 1.16 | 707 | 0.80 | 368 | 0.45 | ||||||||||||||||||
| Revolving, open-end | 2,508 | 2.89 | 1,763 | 2.00 | 1,516 | 1.84 | ||||||||||||||||||
| Residential construction | 1,225 | 1.41 | 2,322 | 2.64 | 1,532 | 1.86 | ||||||||||||||||||
| 77,951 | 89.99 | 79,067 | 89.91 | 74,978 | 90.82 | |||||||||||||||||||
| Commercial loans: | ||||||||||||||||||||||||
| Commercial real estate | 4,421 | 5.10 | 4,173 | 4.75 | 2,916 | 3.53 | ||||||||||||||||||
| Construction and land/land dev. | 1,742 | 2.01 | 1,909 | 2.17 | 832 | 1.01 | ||||||||||||||||||
| Farmland | - | - | - | - | 110 | 0.13 | ||||||||||||||||||
| Agricultural production | 10 | 0.01 | 15 | 0.02 | 26 | 0.03 | ||||||||||||||||||
| Commercial and industrial | 1,112 | 1.28 | 1,516 | 1.72 | 2,608 | 3.16 | ||||||||||||||||||
| Municipal | 49 | 0.06 | 51 | 0.06 | 56 | 0.07 | ||||||||||||||||||
| 7,334 | 8.47 | 7,665 | 8.72 | 6,548 | 7.93 | |||||||||||||||||||
| Consumer loans | 1,338 | 1.54 | 1,207 | 1.37 | 1,034 | 1.25 | ||||||||||||||||||
| Total loans | 86,623 | 100.00 | 87,939 | 100.00 | 82,559 | 100.00 | ||||||||||||||||||
| Allowance for credit losses | (1,099 | ) | (1,208 | ) | (1,141 | ) | ||||||||||||||||||
| Deferred loan fees, net | (393 | ) | (403 | ) | (382 | ) | ||||||||||||||||||
| Net total loans | $ | 85,132 | $ | 86,327 | $ | 81,036 | ||||||||||||||||||
Source: Pioneer Federal Savings and Loan Association, financial statements.
II-3
Feldman Financial Advisors, Inc.
Exhibit II-4
Cash and Investments Composition
Pioneer Federal Savings and Loan Association
As of December 31, 2023 and 2024 and June 30, 2025
(Dollars in Thousands)
| June 30, | December 31, | |||||||||||||||||||||||
| 2025 | 2024 | 2023 | ||||||||||||||||||||||
| Cash and Investments | Amount | Percent | Amount | Percent | Amount | Percent | ||||||||||||||||||
| Category | (000s) | (%) | (000s) | (%) | (000s) | (%) | ||||||||||||||||||
| Cash and cash equivalents (1) | $ | 9,199 | 43.44 | $ | 6,433 | 34.39 | $ | 10,193 | 39.66 | |||||||||||||||
| Available-for-sale securities, at fair value:: | ||||||||||||||||||||||||
| U.S. Government and agency securities | 1,030 | 4.86 | 1,009 | 5.40 | 1,511 | 5.88 | ||||||||||||||||||
| Municipal and state obligations | 2,891 | 13.65 | 2,889 | 15.44 | 3,116 | 12.12 | ||||||||||||||||||
| Mortgage-backed securities | 5,492 | 25.93 | 5,640 | 30.15 | 6,677 | 25.98 | ||||||||||||||||||
| Total available-for-sale securities | 9,412 | 44.45 | 9,538 | 50.99 | 11,304 | 43.98 | ||||||||||||||||||
| Held-to-maturity securities, at amortized cost: | ||||||||||||||||||||||||
| U.S. Government and agency securities | 84 | 0.40 | 128 | 0.68 | 169 | 0.66 | ||||||||||||||||||
| Municipal and state obligations | 975 | 4.61 | 975 | 5.21 | 1,106 | 4.30 | ||||||||||||||||||
| Mortgage-backed securities | 790 | 3.73 | 902 | 4.82 | 1,561 | 6.07 | ||||||||||||||||||
| Total held-to-maturity securities | 1,850 | 8.74 | 2,005 | 10.72 | 2,836 | 11.03 | ||||||||||||||||||
| Other investments: | ||||||||||||||||||||||||
| Federal Home Loan Bank stock | 427 | 2.02 | 428 | 2.29 | 1,106 | 4.30 | ||||||||||||||||||
| Mutual funds | 287 | 1.36 | 302 | 1.61 | 262 | 1.02 | ||||||||||||||||||
| Total other investments | 715 | 3.38 | 729 | 3.90 | 1,368 | 5.32 | ||||||||||||||||||
| Total cash and investments | $ | 21,175 | 100.00 | $ | 18,706 | 100.00 | $ | 25,700 | 100.00 | |||||||||||||||
| Percent of total assets (%) | ||||||||||||||||||||||||
| Cash and cash equivalents | 8.12 | 5.74 | 9.04 | |||||||||||||||||||||
| Available-for-sale securities | 8.31 | 8.51 | 10.03 | |||||||||||||||||||||
| Held-to-maturity securities | 1.63 | 1.79 | 2.52 | |||||||||||||||||||||
| Other investments | 0.63 | 0.65 | 1.21 | |||||||||||||||||||||
| Total cash and investments | 18.70 | 16.69 | 22.80 | |||||||||||||||||||||
(1) Includes cash and due from banks and interest-bearing deposits.
Source: Pioneer Federal Savings and Loan Association, financial statements.
II-4
Feldman Financial Advisors, Inc.
Exhibit II-5
Deposit Accounts Composition
Pioneer Federal Savings and Loan Association
As of December 31, 2023 and 2024 and June 30, 2025
(Dollars in Thousands)
| June 30, | December 31, | |||||||||||||||||||||||
| 2025 | 2024 | 2023 | ||||||||||||||||||||||
| Deposit Account | Amount | Percent | Amount | Percent | Amount | Percent | ||||||||||||||||||
| Category | (000s) | (%) | (000s) | (%) | (000s) | (%) | ||||||||||||||||||
| Non-interest demand accounts | $ | 7,140 | 8.32 | $ | 6,363 | 7.48 | $ | 7,233 | 8.40 | |||||||||||||||
| NOW checking accounts | 13,125 | 15.29 | 12,829 | 15.08 | 15,196 | 17.66 | ||||||||||||||||||
| Regular savings accounts | 26,427 | 30.79 | 24,596 | 28.91 | 24,269 | 28.20 | ||||||||||||||||||
| Money market accounts | 9,482 | 11.05 | 8,623 | 10.13 | 9,010 | 10.47 | ||||||||||||||||||
| Total non-certificate accounts | 56,174 | 65.44 | 52,411 | 61.60 | 55,708 | 64.72 | ||||||||||||||||||
| Certificate of deposit accounts | 23,174 | 27.00 | 25,610 | 30.10 | 22,033 | 25.60 | ||||||||||||||||||
| IRA certificate of deposit accounts | 6,494 | 7.57 | 7,068 | 8.31 | 8,331 | 9.68 | ||||||||||||||||||
| Total certificate accounts | 29,668 | 34.56 | 32,678 | 38.40 | 30,364 | 35.28 | ||||||||||||||||||
| Total deposits | $ | 85,842 | 100.00 | $ | 85,090 | 100.00 | $ | 86,071 | 100.00 | |||||||||||||||
Source: Pioneer Federal Savings and Loan Association, financial statements.
II-5
Feldman Financial Advisors, Inc.
Exhibit III
Financial and Market Data for All Public Thrifts
| Total | Tang. | Closing | Total | Price/ | Price/ | Price/ | Price/ | Price/ | |||||||||||||||||||||||||
| Total | Equity/ | Equity/ | LTM | LTM | Price | Market | LTM | Core | Book | Tang. | Total | Div. | |||||||||||||||||||||
| Assets | Assets | Assets | ROA | ROE | 9/2/25 | Value | EPS | EPS | Value | Book | Assets | Yield | |||||||||||||||||||||
| Company | State | Ticker | ($Mil.) | (%) | (%) | (%) | (%) | ($) | ($Mil.) | (x) | (x) | (%) | (%) | (%) | (%) | ||||||||||||||||||
| All Public Thrifts (1) | |||||||||||||||||||||||||||||||||
| Affinity Bancshares, Inc. | GA | AFBI | 934 | 13.29 | 11.58 | 0.79 | 5.54 | 19.79 | 124.8 | 18.5 | 16.8 | 100.4 | 117.5 | 13.34 | 0.00 | ||||||||||||||||||
| Axos Financial, Inc. | NV | AX | 24,783 | 10.82 | 10.33 | 1.82 | 17.30 | 90.02 | 5,084.9 | 12.1 | 11.8 | 189.7 | 199.7 | 20.52 | 0.00 | ||||||||||||||||||
| Blue Foundry Bancorp | NJ | BLFY | 2,128 | 15.10 | 15.10 | (0.55 | ) | (3.40 | ) | 9.30 | 181.9 | NM | NM | 62.5 | 62.5 | 9.44 | 0.00 | ||||||||||||||||
| Broadway Financial Corporation | CA | BYFC | 1,227 | 23.28 | 21.52 | 0.05 | 0.21 | 8.01 | 45.4 | NM | NM | 54.3 | 68.1 | 6.84 | 0.00 | ||||||||||||||||||
| BV Financial, Inc. | MD | BVFL | 908 | 21.80 | 20.47 | 1.19 | 5.32 | 16.74 | 162.0 | 16.3 | 16.0 | 87.2 | 94.5 | 19.02 | 0.00 | ||||||||||||||||||
| Capitol Federal Financial, Inc. | KS | CFFN | 9,693 | 10.79 | 10.70 | 0.64 | 5.92 | 6.42 | 842.4 | 13.7 | 13.6 | 81.5 | 82.3 | 8.80 | 5.25 | ||||||||||||||||||
| Carver Bancorp, Inc. | NY | CARV | 714 | 4.00 | 4.00 | (1.73 | ) | (36.28 | ) | 2.33 | 8.8 | NM | NM | 179.8 | 179.8 | 1.77 | 0.00 | ||||||||||||||||
| Catalyst Bancorp, Inc. | LA | CLST | 274 | 29.51 | 29.51 | 0.80 | 2.70 | 12.94 | 53.4 | 22.7 | 27.1 | 66.3 | 66.3 | 19.58 | 0.00 | ||||||||||||||||||
| Central Plains Bancshares, Inc. | NE | CPBI | 501 | 16.90 | 16.90 | 0.77 | 5.52 | 15.74 | 66.9 | 15.9 | 15.9 | 78.5 | 78.5 | 13.27 | 0.00 | ||||||||||||||||||
| ECB Bancorp, Inc. | MA | ECBK | 1,515 | 11.11 | 11.11 | 0.38 | 3.16 | 17.05 | 150.6 | 26.6 | 26.6 | 90.7 | 90.7 | 10.07 | 0.00 | ||||||||||||||||||
| FB Bancorp, Inc. | LA | FBLA | 1,247 | 26.64 | 26.64 | (0.38 | ) | (1.68 | ) | 11.88 | 219.8 | NA | NA | 71.0 | 71.0 | 18.90 | 0.00 | ||||||||||||||||
| Fifth District Bancorp, Inc. | LA | FDSB | 540 | 24.25 | 24.25 | 0.49 | 2.09 | 13.94 | 77.3 | 27.3 | 19.9 | 59.2 | 59.2 | 14.36 | 0.00 | ||||||||||||||||||
| First Northwest Bancorp | WA | FNWB | 2,195 | 6.82 | 6.77 | (0.46 | ) | (6.50 | ) | 7.50 | 65.2 | NM | NM | 47.3 | 47.7 | 3.23 | 3.76 | ||||||||||||||||
| First Seacoast Bancorp, Inc. | NH | FSEA | 605 | 10.05 | 10.02 | (0.42 | ) | (3.99 | ) | 11.52 | 50.1 | NM | NM | 89.2 | 89.5 | 8.96 | 0.00 | ||||||||||||||||
| Flagstar Financial, Inc. | NY | FLG | 92,237 | 8.78 | 8.35 | (0.60 | ) | (7.60 | ) | 12.83 | 5,331.6 | NM | NM | 70.2 | 74.4 | 5.81 | 0.31 | ||||||||||||||||
| FS Bancorp, Inc. | WA | FSBW | 3,176 | 9.36 | 8.91 | 1.10 | 11.38 | 42.18 | 320.0 | 10.0 | 9.3 | 108.1 | 114.1 | 10.12 | 2.62 | ||||||||||||||||||
| Hingham Institution for Savings | MA | HIFS | 4,539 | 9.82 | 9.82 | 0.77 | 7.76 | 279.00 | 619.8 | 18.2 | 28.8 | 136.5 | 136.5 | 13.41 | 0.89 | ||||||||||||||||||
| Home Federal Bancorp, Inc. | LA | HFBL | 609 | 9.06 | 8.47 | 0.63 | 7.30 | 13.34 | 40.1 | 10.6 | 10.0 | 74.5 | 80.2 | 6.75 | 4.05 | ||||||||||||||||||
| IF Bancorp, Inc. | IL | IROQ | 888 | 9.22 | 9.22 | 0.49 | 5.52 | 25.05 | 81.7 | 18.3 | NA | 102.6 | 102.6 | 9.46 | 1.58 | ||||||||||||||||||
| Kearny Financial Corp. | NJ | KRNY | 7,740 | 9.64 | 8.27 | 0.34 | 3.49 | 6.74 | 423.8 | 16.0 | 15.9 | 58.3 | 69.0 | 5.62 | 6.52 | ||||||||||||||||||
| Magyar Bancorp, Inc. | NJ | MGYR | 987 | 11.78 | 11.75 | 0.99 | 8.77 | 17.11 | 110.9 | 10.8 | 10.7 | 94.9 | 95.2 | 11.18 | 1.86 | ||||||||||||||||||
| Northeast Community Bancorp, Inc. | NY | NECB | 1,974 | 17.06 | 17.06 | 2.26 | 13.90 | 22.01 | 263.9 | 6.7 | 6.7 | 91.7 | 91.7 | 15.64 | 3.55 | ||||||||||||||||||
| Northfield Bancorp, Inc. | NJ | NFBK | 5,679 | 12.51 | 11.87 | 0.62 | 5.01 | 11.86 | 495.5 | 13.8 | 14.9 | 69.8 | 74.1 | 8.73 | 4.39 | ||||||||||||||||||
| NSTS Bancorp, Inc. | IL | NSTS | 276 | 28.20 | 28.20 | (0.29 | ) | (1.04 | ) | 11.90 | 58.1 | NM | NM | 80.1 | 80.1 | 22.59 | 0.00 | ||||||||||||||||
| Ponce Financial Group, Inc. | NY | PDLB | 3,154 | 16.52 | 16.52 | 0.57 | 3.42 | 14.87 | 337.8 | 20.7 | 21.2 | 120.5 | 120.5 | 12.18 | 0.00 | ||||||||||||||||||
| Provident Financial Holdings, Inc. | CA | PROV | 1,246 | 10.32 | 10.32 | 0.50 | 4.79 | 15.51 | 102.7 | 16.7 | 16.6 | 79.4 | 79.4 | 8.19 | 3.61 | ||||||||||||||||||
| Provident Financial Services, Inc. | NJ | PFS | 24,547 | 11.03 | 8.04 | 0.96 | 8.71 | 19.83 | 2,590.3 | 11.2 | 8.9 | 95.7 | 135.7 | 10.55 | 4.84 | ||||||||||||||||||
| Riverview Bancorp, Inc. | WA | RVSB | 1,517 | 10.68 | 9.05 | 0.34 | 3.22 | 4.93 | 106.0 | 20.5 | 21.7 | 63.8 | 76.7 | 6.82 | 1.58 | ||||||||||||||||||
| SR Bancorp, Inc. | NJ | SRBK | 1,083 | 17.76 | 15.69 | 0.35 | 1.95 | 15.00 | 133.7 | 34.1 | 26.2 | 69.2 | 80.4 | 12.29 | 1.33 | ||||||||||||||||||
| Texas Community Bancshares, Inc. | TX | TCBS | 444 | 11.91 | 11.89 | 0.53 | 5.13 | 16.31 | 45.1 | 20.9 | 20.2 | 92.5 | 92.7 | 11.02 | 0.98 |
III-1
Feldman Financial Advisors, Inc.
Exhibit III (continued)
Financial and Market Data for All Public Thrifts
| Total | Tang. | Closing | Total | Price/ | Price/ | Price/ | Price/ | Price/ | |||||||||||||||||||||||
| Total | Equity/ | Equity/ | LTM | LTM | Price | Market | LTM | Core | Book | Tang. | Total | Div. | |||||||||||||||||||
| Assets | Assets | Assets | ROA | ROE | 9/2/25 | Value | EPS | EPS | Value | Book | Assets | Yield | |||||||||||||||||||
| Company | State | Ticker | ($Mil.) | (%) | (%) | (%) | (%) | ($) | ($Mil.) | (x) | (x) | (%) | (%) | (%) | (%) | ||||||||||||||||
| Timberland Bancorp, Inc. | WA | TSBK | 1,957 | 13.11 | 12.42 | 1.40 | 10.91 | 33.45 | 264.2 | 9.8 | 9.8 | 102.6 | 109.2 | 13.46 | 3.11 | ||||||||||||||||
| Triumph Financial, Inc. | TX | TFIN | 6,495 | 14.05 | 8.27 | 0.23 | 1.51 | 60.85 | 1,444.2 | NM | NM | 166.5 | 315.1 | 22.39 | 0.00 | ||||||||||||||||
| TrustCo Bank Corp NY | NY | TRST | 6,348 | 10.91 | 10.91 | 0.86 | 7.91 | 40.11 | 750.1 | 14.3 | 14.3 | 109.1 | 109.2 | 11.91 | 3.82 | ||||||||||||||||
| Waterstone Financial, Inc. | WI | WSBF | 2,257 | 15.13 | 15.11 | 0.93 | 6.06 | 14.81 | 281.4 | 13.0 | 13.1 | 81.4 | 81.6 | 12.32 | 4.00 | ||||||||||||||||
| Average | 6,306 | 14.15 | 13.50 | 0.48 | 3.06 | NA | 615.7 | 16.7 | 16.5 | 91.9 | 100.8 | 11.72 | 1.71 | ||||||||||||||||||
| Median | 1,516 | 11.84 | 11.34 | 0.55 | 4.90 | NA | 156.3 | 16.0 | 15.9 | 84.4 | 85.9 | 11.10 | 0.93 | ||||||||||||||||||
(1) Public thrifts traded on NYSE, NYSE American, and NASDAQ stock markets; excludes companies subject to pending acquisitions or mutual holding company ownership.
Source: S&P Global.
III-2
Feldman Financial Advisors, Inc.
Exhibit IV-1
Pro Forma Assumptions for the Stock Offering
| 1. | The total amount of the net offering proceeds was fully invested at the beginning of the applicable period. |
| 2. | The net offering proceeds are invested to yield a return of 3.79%, which represented the yield on five-year U.S. Treasury securities at June 30, 2025. The effective combined federal and state income tax rate was assumed to be 27.75%, resulting in a net after-tax yield of 2.74%. |
| 3. | It is assumed that 8.0% of the total shares of common stock to be issued in the Conversion will be acquired by the Association’s employee stock ownership plan (“ESOP”). Pro forma adjustments have been made to earnings and equity to reflect the impact of the ESOP. The annual expense is estimated based on a 25-year loan to the ESOP from the Association. No re-investment is assumed on proceeds used to fund the ESOP. |
| 4. | It is assumed that the Association’s restricted stock plan (“RSP”) will purchase in the open market a number of shares equal to 4.0% of the total shares issued in the Conversion. Also, it is assumed that these shares are acquired at the initial public offering price of $10.00 per share. Pro forma adjustments have been made to earnings and equity to reflect the impact of the RSP. The annual expense is estimated based on a five-year vesting period. No re-investment is assumed on proceeds used to fund the RSP. |
| 5. | It is assumed that an additional 10.0% of the total shares sold in the Stock Offering will be reserved for issuance by the Association’s stock option plan. The pro forma net income has been adjusted to reflect the expense associated with the granting of options at an assumed options value of $4.90 per option. It is further assumed that options for all shares reserved under the plan were granted to plan participants at the beginning of the period and 25.0% were non-qualified options for income tax purposes, the options would vest at a rate of 20.0% per year, and compensation expense will be recognized on a straight-line basis over the five-year vesting period |
| 6. | The fair value of stock options has been estimated at $4.90 per option using the Black-Scholes option pricing model with the following assumptions: a grant-date share price and option exercise price of $10.00; dividend yield of 0.00%; an expected option life of 10 years; a risk-free interest rate of 4.24%; and a volatility rate of 28.65% based a selected bank stock index. |
| 7. | Total offering expenses are estimated at $2.0 million. |
| 8. | No effect has been given to withdrawals from deposit accounts for the purpose of purchasing common stock in the Stock Offering. |
| 9. | No effect has been given in the pro forma equity calculation for the assumed earnings on the net proceeds. |
IV-1
Feldman Financial Advisors, Inc.
Exhibit IV-2
Pioneer Federal Savings and Loan Association
Pro Forma Conversion Valuation Range
Historical Financial Data as of June 30, 2025
(Dollars in Thousands, Except Per Share Data)
| MINIMUM | MIDPOINT | MAXIMUM | ADJ. MAX. | |||||||||||||
| Shares sold in the offering | 1,020,000 | 1,200,000 | 1,380,000 | 1,587,000 | ||||||||||||
| Offering price | $ | 10.00 | $ | 10.00 | $ | 10.00 | $ | 10.00 | ||||||||
| Gross offering proceeds | $ | 10,200 | $ | 12,000 | $ | 13,800 | $ | 15,870 | ||||||||
| Less: estimated offering expenses | (2,000 | ) | (2,000 | ) | (2,000 | ) | (2,000 | ) | ||||||||
| Net offering proceeds | 8,200 | 10,000 | 11,800 | 13,870 | ||||||||||||
| Less: ESOP purchase | (816 | ) | (960 | ) | (1,104 | ) | (1,270 | ) | ||||||||
| Less: RSP purchase | (408 | ) | (480 | ) | (552 | ) | (635 | ) | ||||||||
| Net investable proceeds | $ | 6,976 | $ | 8,560 | $ | 10,144 | $ | 11,965 | ||||||||
| Net income - LTM ended 6/30/25 | $ | 145 | $ | 145 | $ | 145 | $ | 145 | ||||||||
| Pro forma income on net proceeds | 191 | 234 | 278 | 328 | ||||||||||||
| Pro forma ESOP adjustment | (24 | ) | (28 | ) | (32 | ) | (37 | ) | ||||||||
| Pro forma RSP adjustment | (59 | ) | (69 | ) | (80 | ) | (92 | ) | ||||||||
| Pro forma option adjustment | (93 | ) | (109 | ) | (126 | ) | (145 | ) | ||||||||
| Pro forma net income | $ | 160 | $ | 173 | $ | 185 | $ | 199 | ||||||||
| Pro forma earnings per share | $ | 0.17 | $ | 0.16 | $ | 0.15 | $ | 0.14 | ||||||||
| Core earnings - LTM ended 6/30/25 | $ | 216 | $ | 216 | $ | 216 | $ | 216 | ||||||||
| Pro forma income on net proceeds | 191 | 234 | 278 | 328 | ||||||||||||
| Pro forma ESOP adjustment | (24 | ) | (28 | ) | (32 | ) | (37 | ) | ||||||||
| Pro forma RSP adjustment | (59 | ) | (69 | ) | (80 | ) | (92 | ) | ||||||||
| Pro forma option adjustment | (93 | ) | (109 | ) | (126 | ) | (145 | ) | ||||||||
| Pro forma core earnings | $ | 231 | $ | 244 | $ | 256 | $ | 270 | ||||||||
| Pro forma core earnings per share | $ | 0.25 | $ | 0.22 | $ | 0.20 | $ | 0.18 | ||||||||
| Total equity - 6/30/25 | $ | 18,428 | $ | 18,428 | $ | 18,428 | $ | 18,428 | ||||||||
| Net offering proceeds | 8,200 | 10,000 | 11,800 | 13,870 | ||||||||||||
| Less: ESOP purchase | (816 | ) | (960 | ) | (1,104 | ) | (1,270 | ) | ||||||||
| Less: RSP purchase | (408 | ) | (480 | ) | (552 | ) | (635 | ) | ||||||||
| Pro forma total equity | $ | 25,404 | $ | 26,988 | $ | 28,572 | $ | 30,393 | ||||||||
| Pro forma book value | $ | 24.91 | $ | 22.49 | $ | 20.70 | $ | 19.15 | ||||||||
| Total assets - 6/30/25 | $ | 113,259 | $ | 113,259 | $ | 113,259 | $ | 113,259 | ||||||||
| Net offering proceeds | 8,200 | 10,000 | 11,800 | 13,870 | ||||||||||||
| Less: ESOP purchase | (816 | ) | (960 | ) | (1,104 | ) | (1,270 | ) | ||||||||
| Less: RSP purchase | (408 | ) | (480 | ) | (552 | ) | (635 | ) | ||||||||
| Pro forma total assets | $ | 120,235 | $ | 121,819 | $ | 123,403 | $ | 125,224 | ||||||||
| Pro Forma Ratios: | ||||||||||||||||
| Price / LTM EPS | 58.82 | x | 62.50 | x | 66.67 | x | 71.43 | x | ||||||||
| Price / Core EPS | 40.00 | x | 45.45 | x | 50.00 | x | 55.56 | x | ||||||||
| Price / Book Value | 40.14 | % | 44.46 | % | 48.31 | % | 52.22 | % | ||||||||
| Price / Tangible Book Value | 40.14 | % | 44.46 | % | 48.31 | % | 52.22 | % | ||||||||
| Price / Total Assets | 8.48 | % | 9.85 | % | 11.18 | % | 12.67 | % | ||||||||
| Total Equity / Assets | 21.13 | % | 22.15 | % | 23.15 | % | 24.27 | % | ||||||||
| Tangible Equity / Assets | 21.13 | % | 22.15 | % | 23.15 | % | 24.27 | % | ||||||||
IV-2
Feldman Financial Advisors, Inc.
Exhibit IV-3
Pro Forma Conversion Analysis at the Midpoint Value
Pioneer Federal Savings and Loan Association
Historical Financial Data as of June 30, 2025
| Valuation Parameters | Symbol | Data | ||||
| Net income -- LTM | Y | $ | 145,000 | |||
| Core earnings -- LTM | Y | 216,000 | ||||
| Net worth | B | 18,428,000 | ||||
| Tangible net worth | B | 18,428,000 | ||||
| Total assets | A | 113,259,000 | ||||
| Expenses in conversion | X | 2,000,000 | ||||
| Other proceeds not reinvested | O | 1,440,000 | ||||
| ESOP purchase | E | 960,000 | ||||
| ESOP expense (pre-tax) | F | 38,754 | ||||
| RSP purchase | M | 480,000 | ||||
| RSP expense (pre-tax) | N | 95,502 | ||||
| Stock option expense (pre-tax) | Q | 117,600 | ||||
| Option expense tax-deductible | D | 25.00 | % | |||
| Re-investment rate (after-tax) | R | 2.74 | % | |||
| Tax rate | T | 27.75 | % | |||
| Shares for EPS | S | 92.32 | % | |||
| Pro Forma Valuation Ratios at Midpoint Value | ||||||
| Price / LTM EPS | P/E | 62.50 | x | |||
| Price / Core EPS | P/E | 45.45 | x | |||
| Price / Book Value | P/B | 44.46 | % | |||
| Price / Tangible Book | P/TB | 44.46 | % | |||
| Price / Assets | P/A | 9.85 | % | |||
| Pro Forma Calculation at Midpoint Value | Based on | ||||||
| V | = | (P/E / S)*((Y-R*(O+X)-(F+N)*(1-T)-(Q-Q*D*T))) | = | $12,000,000 | [LTM earnings] | ||
| 1 - (P/E / S) * R | |||||||
| V | = | (P/E / S)*((Y-R*(O+X)-(F+N)*(1-T)-(Q-Q*D*T)) | = | $12,000,000 | [Core earnings] | ||
| 1 - (P/E / S) * R | |||||||
| V | = | P/B * (B - X - E - M) | = | $12,000,000 | [Book value] | ||
| 1 - P/B | |||||||
| V | = | P/TB * ( B - X - E - M ) | = | $12,000,000 | [Tangible book] | ||
| 1 - P/TB | |||||||
| V | = | P/A * ( A - X - E - M ) | = | $12,000,000 | [Total assets] | ||
| 1 - P/A | |||||||
| Valuation Range | |||||||||
| Minimum | = | $12,000,000 | x | 0.8500 | = | $10,200,000 | |||
| Midpoint | = | $12,000,000 | x | 1.0000 | = | $12,000,000 | |||
| Maximum | = | $12,000,000 | x | 1.1500 | = | $13,800,000 | |||
| Adj. Max. | = | $13,800,000 | x | 1.1500 | = | $15,870,000 | |||
IV-3
Feldman Financial Advisors, Inc.
Exhibit IV-4
Comparative Valuation Ratio Analysis
Pro Forma Conversion Valuation
Computed from Market Price Data as of September 2, 2025
| Pioneer | Comparative | All Public | ||||||||||||||||||||
| Valuation | Federal | Group | Thrifts (1) | |||||||||||||||||||
| Ratio | Symbol | S&LA | Average | Median | Average | Median | ||||||||||||||||
| Price / LTM EPS | P/E | 17.88 | 17.37 | 16.75 | 16.05 | |||||||||||||||||
| Minimum | (x) | 58.82 | 229.1 | % | 238.6 | % | 251.2 | % | 266.6 | % | ||||||||||||
| Midpoint | 62.50 | 249.6 | % | 259.7 | % | 273.2 | % | 289.5 | % | |||||||||||||
| Maximum | 66.67 | 272.9 | % | 283.7 | % | 298.1 | % | 315.4 | % | |||||||||||||
| Adjusted Maximum | 71.43 | 299.6 | % | 311.1 | % | 326.5 | % | 345.1 | % | |||||||||||||
| Price / Core EPS | P/E | 17.10 | 16.44 | 16.50 | 15.91 | |||||||||||||||||
| Minimum | (x) | 40.00 | 133.9 | % | 143.4 | % | 142.4 | % | 151.5 | % | ||||||||||||
| Midpoint | 45.45 | 165.8 | % | 176.5 | % | 175.4 | % | 185.7 | % | |||||||||||||
| Maximum | 50.00 | 192.4 | % | 204.2 | % | 203.0 | % | 214.3 | % | |||||||||||||
| Adjusted Maximum | 55.56 | 224.9 | % | 238.0 | % | 236.7 | % | 249.3 | % | |||||||||||||
| Price / Book Value | P/B | 82.30 | 83.67 | 91.92 | 84.37 | |||||||||||||||||
| Minimum | (%) | 40.14 | -51.2 | % | -52.0 | % | -56.3 | % | -52.4 | % | ||||||||||||
| Midpoint | 44.46 | -46.0 | % | -46.9 | % | -51.6 | % | -47.3 | % | |||||||||||||
| Maximum | 48.31 | -41.3 | % | -42.3 | % | -47.4 | % | -42.7 | % | |||||||||||||
| Adjusted Maximum | 52.22 | -36.5 | % | -37.6 | % | -43.2 | % | -38.1 | % | |||||||||||||
| Price / Tangible Book | P/TB | 85.37 | 84.84 | 100.75 | 85.86 | |||||||||||||||||
| Minimum | (%) | 40.14 | -53.0 | % | -52.7 | % | -60.2 | % | -53.2 | % | ||||||||||||
| Midpoint | 44.46 | -47.9 | % | -47.6 | % | -55.9 | % | -48.2 | % | |||||||||||||
| Maximum | 48.31 | -43.4 | % | -43.1 | % | -52.1 | % | -43.7 | % | |||||||||||||
| Adjusted Maximum | 52.22 | -38.8 | % | -38.5 | % | -48.2 | % | -39.2 | % | |||||||||||||
| Price / Total Assets | P/A | 14.01 | 13.31 | 11.72 | 11.10 | |||||||||||||||||
| Minimum | (%) | 8.48 | -39.4 | % | -36.2 | % | -27.6 | % | -23.6 | % | ||||||||||||
| Midpoint | 9.85 | -29.7 | % | -26.0 | % | -16.0 | % | -11.2 | % | |||||||||||||
| Maximum | 11.18 | -20.2 | % | -16.0 | % | -4.6 | % | 0.8 | % | |||||||||||||
| Adjusted Maximum | 12.67 | -9.5 | % | -4.8 | % | 8.1 | % | 14.2 | % | |||||||||||||
(1) Excludes companies subject to mutual holding company ownership or pending acquisition.
IV-4