Pay vs Performance Disclosure - USD ($)
Jun. 30, 2024
Jan. 31, 2024
Jun. 30, 2025
Jun. 30, 2024
Jun. 30, 2023
Jun. 30, 2022
Jun. 30, 2021
Pay vs. Performance
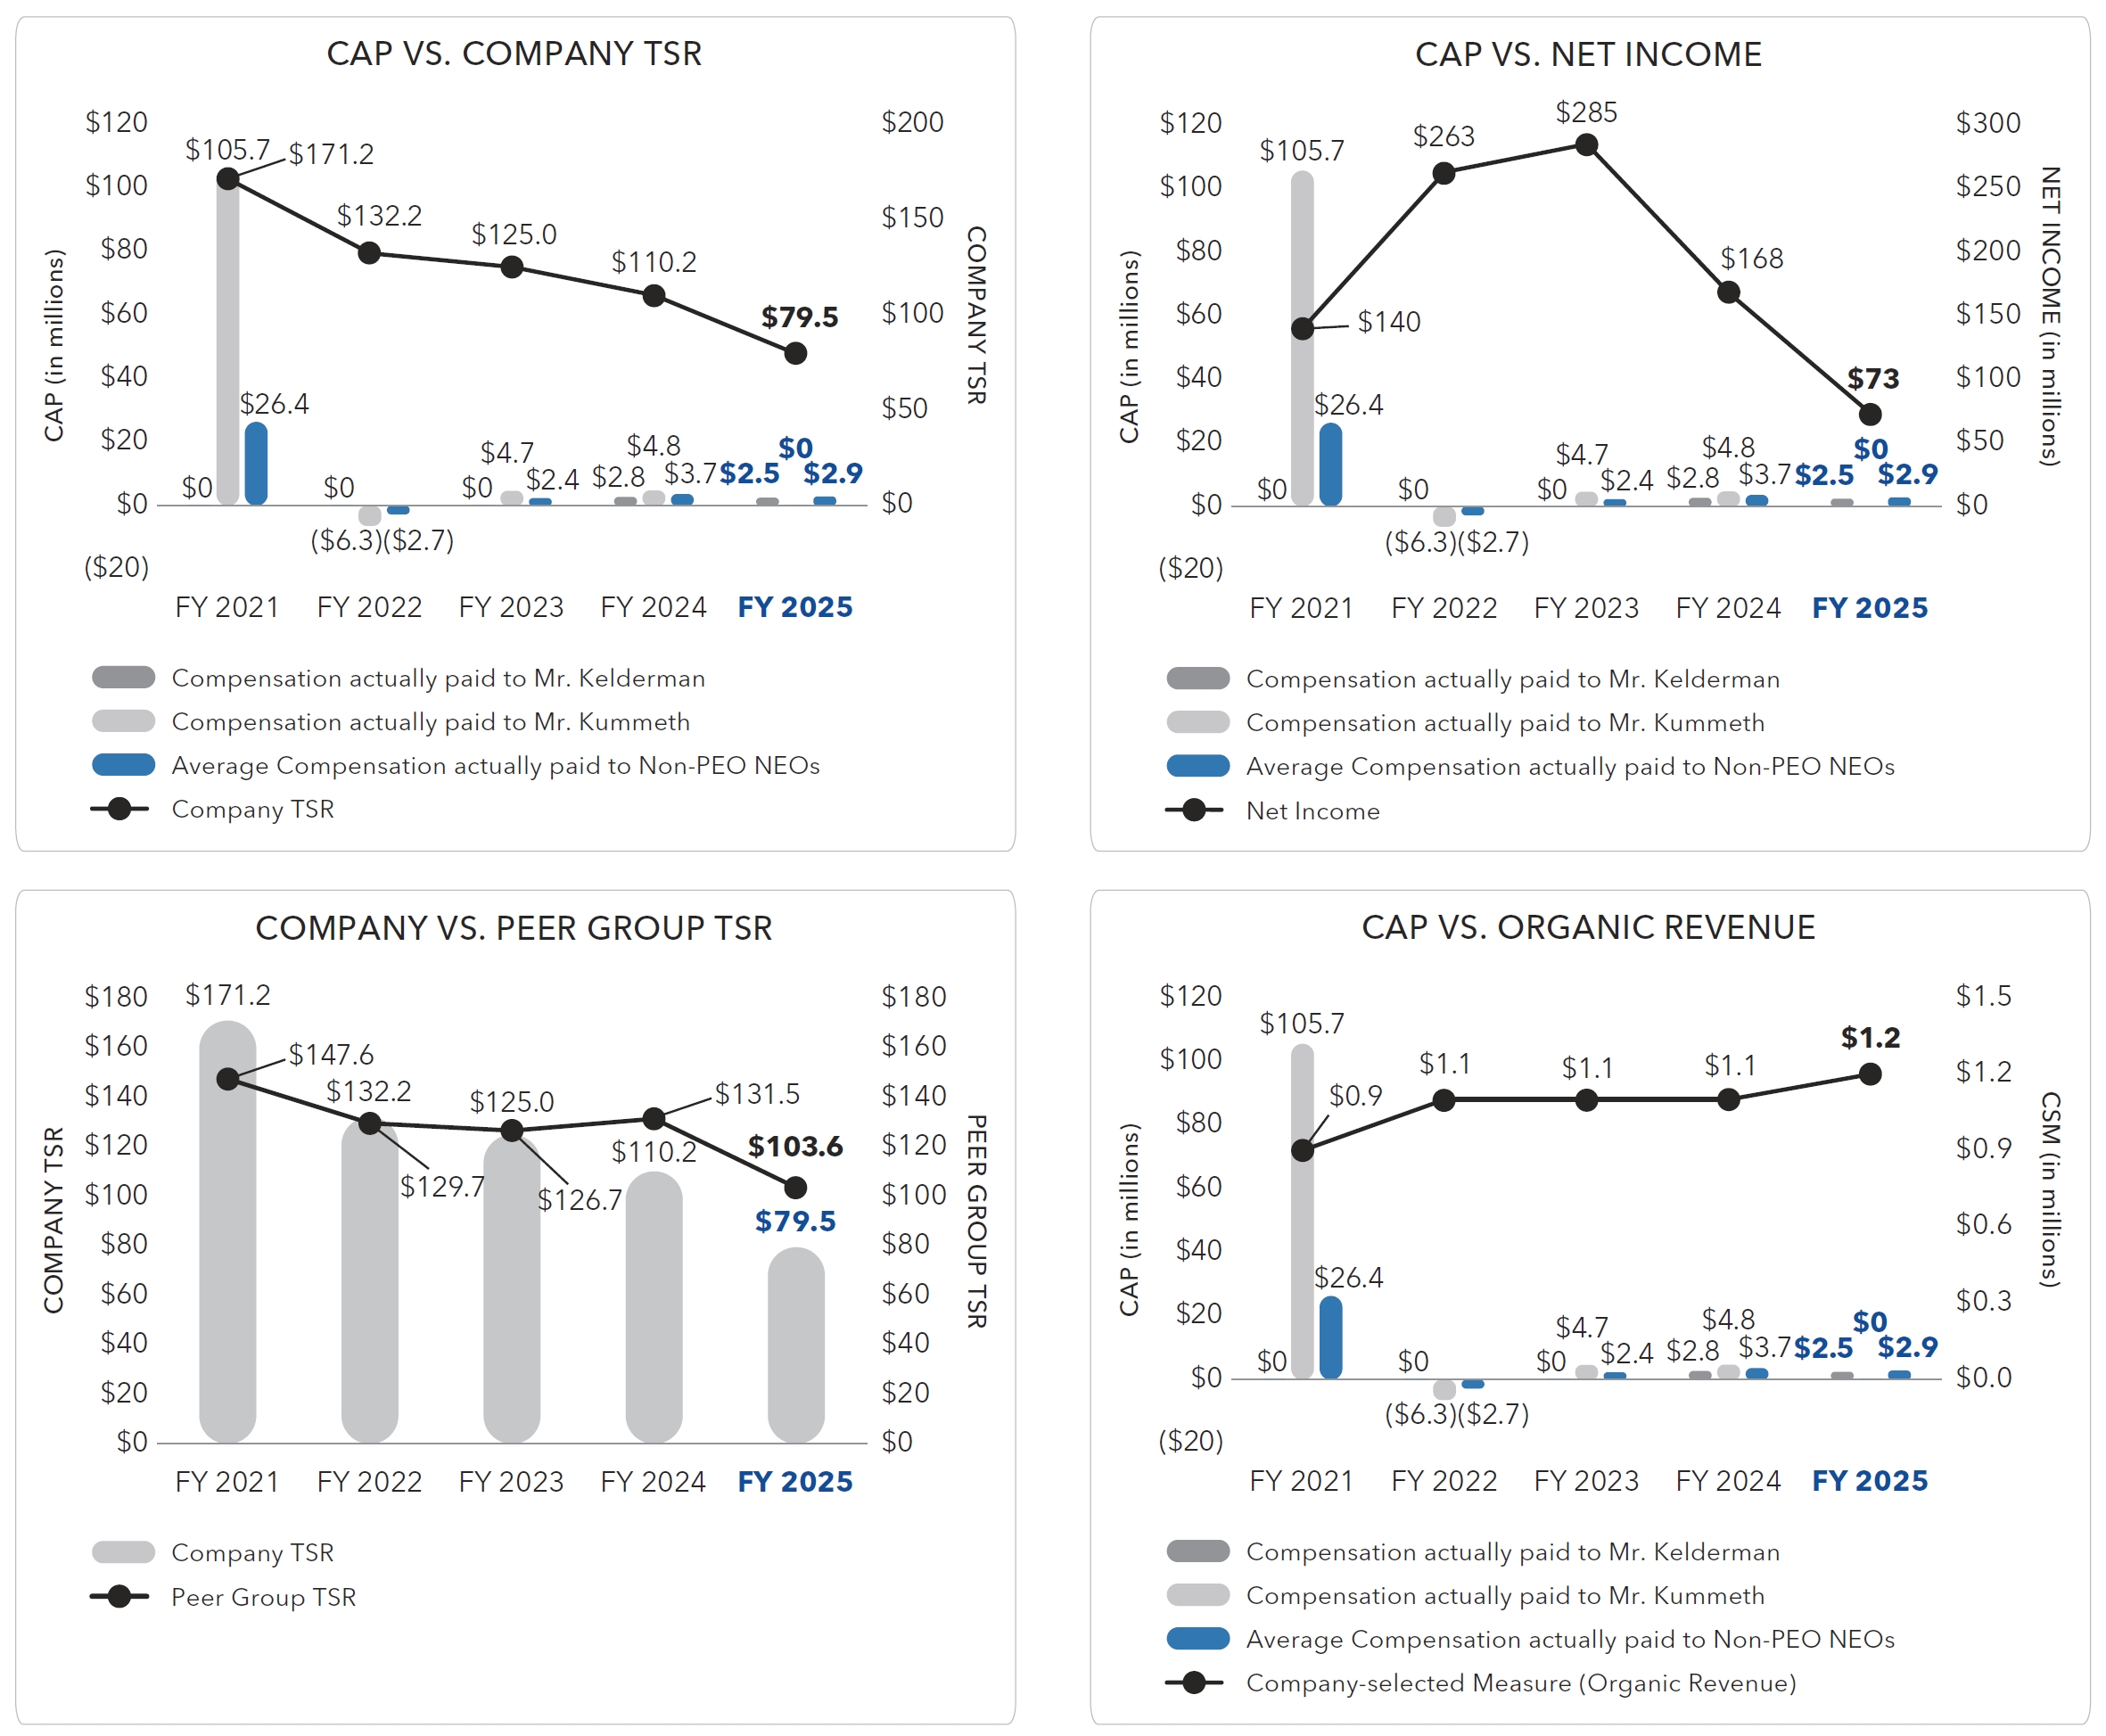
As required by SEC rules, we are providing the following information about the relationship between executive compensation actually paid (as defined by SEC rules) and certain financial performance measures. For information about how our Compensation Committee seeks to align executive compensation with the Company’s performance, see “Compensation discussion and analysis.” The amounts in the table below are calculated in accordance with SEC rules and do not represent amounts actually earned or realized by our NEOs.
| Fiscal Year | Summary Compensation Table Total for CEO(1)(2) Mr. Kelderman | Compensation actually paid to CEO(1)(2) Mr. Kelderman | Summary Compensation Table Total for CEO(1) Mr. Kummeth | Compensation actually paid to CEO(1) Mr. Kummeth | Average Summary Compensation Table Total for Non-PEO NEOs(2) | Average Compensation actually Paid to Non-PEO NEOs(2) | Value
of Initial Fixed $100 Investment based on: | Company- selected Measure (Organic Revenue)(5) | |||||||||||||||||||||||||||||||
| Company TSR | Peer
Group TSR(3) | Net Income(4) | |||||||||||||||||||||||||||||||||||||
| 2025 | $ | 8,151,181 | $ | 2,471,713 | $ | — | $ | — | $ | 3,748,508 | $ | 2,883,223 | $ | 79.49 | $ | 103.58 | $ | 73,400,000 | $ | 1,210,000 | |||||||||||||||||||
| 2024 | 2,636,900 | (11) | 2,828,450 | (11) | 6,792,945 | 4,821,823 | 3,303,421 | (12) | 3,651,652 | (12) | 110.17 | 131.47 | 168,105,000 | 1,147,100 | |||||||||||||||||||||||||
| 2023 | — | — | 30,584,644 | 4,684,176 | 2,258,387 | 2,424,680 | 124.96 | 126.72 | 285,442,000 | 1,134,700 | |||||||||||||||||||||||||||||
| 2022 | — | — | 15,370,549 | (6,349,624 | ) | 3,223,063 | (2,680,481 | ) | 132.17 | 129.72 | 263,099,000 | 1,113,600 | |||||||||||||||||||||||||||
| 2021 | — | — | 15,889,896 | 105,676,083 | 4,950,600 | 26,444,391 | 171.17 | 147.61 | 139,585,000 | 915,900 | |||||||||||||||||||||||||||||
| (1) | The Company had two CEOs during fiscal year 2024. Effective November 1, 2023, Mr. Kelderman was appointed the role of Chief Executive Officer and assumed the role on February 1, 2024. Mr. Kummeth left his position as Chief Executive Officer effective February 1, 2024 and remained with the company as a Senior Advisor through July 1, 2024. Mr. Kelderman was our CEO for the fully fiscal year 2025. Mr. Kummeth was our CEO for the full fiscal years 2021 through 2023. |
| (2) | For fiscal year 2024, Mr. Kelderman held his position as President, Diagnostics and Genomics prior to assuming the position of CEO on February 1, 2024. Therefore, any compensation granted or vested prior to assuming the position of CEO is included in the average non-PEO NEO compensation for fiscal year 2024. |
| FY25 | FY24 | FY23 | FY22 | ||||||||||||||||||||||||||||||||||
| CEO | Non-PEO NEOs | CEO Mr. Kelderman | CEO Mr. Kummeth | Non-PEO NEOs | CEO | Non-PEO NEOs | CEO | Non-PEO NEOs | |||||||||||||||||||||||||||||
| Total from Summary Compensation Table (i) | 8,151,181 | 3,748,508 | 2,636,900 | (6) | 6,792,945 | 3,303,421 | (7) | 30,584,644 | 2,258,387 | 15,370,549 | 3,223,063 | ||||||||||||||||||||||||||
| Subtract: Grant date fair value of option and stock awards granted in the fiscal year (ii) | (5,862,791 | ) | (1,264,411 | ) | (2,152,815 | )(6) | (5,000,028 | ) | (1,349,102 | )(7) | (29,325,210 | ) | (850,075 | ) | (10,299,362 | ) | (949,840 | ) | |||||||||||||||||||
| Add: Fair value at fiscal year end of outstanding and unvested option and stock awards granted in the fiscal year (iii) | 3,511,656 | 1,569,604 | 2,344,977 | 4,234,157 | 2,565,518 | 4,318,227 | (8) | 1,382,025 | 6,472,546 | 1,106,688 | |||||||||||||||||||||||||||
| Add/Subtract: Year-over-Year change in fair value of outstanding and unvested option and stock awards granted in prior fiscal years (iv) | (3,442,309 | ) | (1,234,677 | ) | — | (1,241,718 | ) | (847,318 | ) | (6,132,401 | ) | (877,492 | ) | (22,021,635 | ) | (5,636,997 | ) | ||||||||||||||||||||
| Add: Vesting date fair value of option and stock awards granted and vesting during the fiscal year (v) | — | — | — | — | — | — | — | — | — | ||||||||||||||||||||||||||||
| Add/Subtract: Change as of the vesting date (from the end of the prior fiscal year) in fair value of option and stock awards granted in any prior fiscal year for which vesting conditions were satisfied during the fiscal year, less the fair value (as of end of prior fiscal year) of prior year awards that failed to vest (vi) | 113,976 | 64,200 | — | 36,468 | (20,867 | ) | 5,238,918 | 633,346 | 4,128,278 | 469,566 | |||||||||||||||||||||||||||
| Subtract: Awards granted in prior years that did not meet the applicable vesting conditions during the fiscal year (vii) | — | — | — | — | — | — | (121,511 | ) | — | (892,961 | ) | ||||||||||||||||||||||||||
| Compensation Actually Paid | 2,471,713 | 2,883,223 | 2,828,450 | (6) | 4,821,823 | 3,651,652 | (7) | 4,684,176 | 2,424,680 | (6,349,624 | ) | (2,680,481 | ) | ||||||||||||||||||||||||
| FY21 | |||||||||
| CEO | Non-PEO NEOs | ||||||||
| Total from Summary Compensation Table (i) | 15,889,896 | 4,950,600 | |||||||
| Subtract: Grant date fair value of option and stock awards granted in the fiscal year (ii) | (11,199,803 | ) | (1,722,395 | ) | |||||
| Add: Fair value at fiscal year end of outstanding and unvested option and stock awards granted in the fiscal year (iii) | 30,362,017 | 10,602,750 | |||||||
| Add/Subtract: Year-over-Year change in fair value of outstanding and unvested option and stock awards granted in prior fiscal years (iv) | 64,935,446 | 11,789,651 | |||||||
| Add: Vesting date fair value of option and stock awards granted and vesting during the fiscal year (v) | — | — | |||||||
| Add/Subtract: Change as of the vesting date (from the end of the prior fiscal year) in fair value of option and stock awards granted in any prior fiscal year for which vesting conditions were satisfied during the fiscal year, less the fair value (as of end of prior fiscal year) of prior year awards that failed to vest (vi) | 5,688,527 | 823,785 | |||||||
| Subtract: Awards granted in prior years that did not meet the applicable vesting conditions during the fiscal year (vii) | — | — | |||||||
| Compensation Actually Paid | 105,676,083 | 26,444,391 | |||||||
| (5) | Sales shown reflect organic revenue as calculated for purposes of our executive compensation program for the applicable reporting year. Refer to Appendix A for a reconciliation between GAAP and non-GAAP measures. |