Pay vs Performance Disclosure
|
12 Months Ended |
|
Jun. 30, 2025
USD ($)
$ / shares
|
Jun. 30, 2024
USD ($)
$ / shares
|
Jun. 30, 2023
USD ($)
$ / shares
|
Jun. 30, 2022
USD ($)
$ / shares
|
Jun. 30, 2021
USD ($)
$ / shares
|
| Pay vs Performance Disclosure |
|
|
|
|
|
| Pay vs Performance Disclosure, Table |
| | | | | | | | | | | | | | | | | | | | | | | | | | | | | | | | | | | | | Summary Compensation Table Total for PEO(1) | | Compensation Actually Paid to PEO(2) | Average Summary Compensation Table Total for Non-PEO NEOs ($)(1) | Average Compensation Actually Paid to Non-PEO NEOs ($)(2) | Value of Initial Fixed $100
Investment Based On: | Net Income ($ millions) | Company Selected Measure: Non-GAAP Diluted EPS ($)(4) | | Year | Hollar ($) | Kaufmann ($) | | Hollar ($) | Kaufmann ($) | Total Shareholder Return ($)(3) | Peer Group Total Shareholder Return ($)(3) | | 2025 | 18,976,195 | | N/A | | 72,784,925 | | N/A | 5,347,072 | | 19,819,300 | | 371 | | 134 | | 1,569 | | 8.24 | | | 2024 | 25,651,209 | | N/A | | 28,304,507 | | N/A | 5,981,832 | | 7,969,614 | | 213 | | 145 | | 853 | | 7.53 | | | 2023 | 18,786,467 | | 3,528,968 | | | 40,796,971 | | 12,948,517 | | 4,154,565 | | 9,212,666 | | 202 | | 132 | | 331 | | 5.85 | | | 2022 | N/A | 13,463,557 | | | N/A | 3,175,014 | | 4,110,560 | | 2,918,363 | | 109 | | 127 | | (937) | | 5.07 | | | 2021 | N/A | 12,482,378 | | | N/A | 9,686,761 | | 3,715,505 | | 4,121,383 | | 115 | | 125 | | 612 | | 5.57 | |
|
|
|
|
|
| Company Selected Measure Name |
non-GAAP diluted EPS
|
|
|
|
|
| Named Executive Officers, Footnote |
The PEO for fiscal 2025 and 2024 was Mr. Hollar. The PEOs for fiscal 2023 were Mr. Hollar and Michael C. Kaufmann. The PEO for fiscal 2022 and 2021 was Mr. Kaufmann. The Non-PEO NEOs for fiscal 2025 and 2024 were Mses. Mayer and Weitzman and Messrs. Alt and Mason. The Non-PEO NEOs for fiscal 2023 were Mses. Patricia M. English, Mayer, and Weitzman and Messrs. Alt, Victor L. Crawford, and Mason. The Non-PEO NEOs for fiscal 2022 and 2021 were Ms. Mayer and Messrs. Crawford, Hollar, and Mason. Amounts set forth in the table for the PEO do not include Mr. Hollar’s compensation for years in which he did not serve as PEO. Where applicable, such amounts are included in the Non-PEO NEO amounts.
|
|
|
|
|
| Peer Group Issuers, Footnote |
Pursuant to the SEC rules, TSR measures the cumulative value of an initial investment of $100 on June 30, 2020, including the reinvestment of dividends, through and including the end of the applicable fiscal year for which TSR is calculated, or June 30, 2021, June 30, 2022, June 30, 2023, June 30, 2024, and June 30, 2025, respectively. As permitted by the SEC rules, the peer group referenced for purpose of the TSR comparison is the S&P 500 Health Care Index, which is the industry peer group used by the company for purposes of Item 201(e) of Regulation S-K. The separate peer group used by the Compensation Committee for purposes of determining compensation paid to our executive officers is described in the CD&A beginning on page 42.
|
|
|
|
|
| Adjustment To PEO Compensation, Footnote |
The following tables show the adjustments, each of which is prescribed by the SEC rules, made to calculate the CAP amounts from the Summary Compensation Table (“SCT”) amounts. The SCT amounts and the CAP amounts do not reflect the actual amount of compensation earned by or paid to our executives during the applicable years, but rather are amounts determined in accordance with Item 402 of Regulation S-K. Pursuant to the applicable rules, the amounts reported in the “Stock Awards” column from the SCT are subtracted from the SCT amounts and the values reflected in the table below are added or subtracted as applicable: PEO Summary Compensation Table Total Compensation to Compensation Actually Paid Reconciliation | | | | | | | | | | | | | | | | | | | | | | | | | | | | | | | | | | 2025 | | 2024 | | 2023 | | 2022 | | 2021 | | PEO | Hollar ($) | | Hollar ($) | | Hollar ($) | Kaufmann ($) | | Kaufmann ($) | | Kaufmann ($) | | SCT total compensation | 18,976,195 | | | 25,651,209 | | | 18,786,467 | | 3,528,968 | | | 13,463,557 | | | 12,482,378 | | | Adjustments for stock awards | | | | | | | | | | | | Stock award values reported in SCT for the covered fiscal year | (13,431,441) | | | (20,640,912) | | | (14,828,888) | | 0 | | | (11,051,066) | | | (10,197,832) | | Fair value of stock awards granted in
the covered fiscal year — value at fiscal-year-end | 25,060,892 | | | 20,398,094 | | | 29,849,423 | | 0 | | | 10,213,707 | | | 10,748,666 | | | Change in fair value from end of prior fiscal year to vesting date for stock awards granted in prior fiscal years that vested during the covered fiscal year | 1,748,061 | | | (329,335) | | | 460,516 | | 2,703,218 | | | (4,290,114) | | | (4,389,981) | | | Change in fair value from end of prior fiscal year to end of the covered fiscal year for stock awards granted in prior fiscal years that were unvested at the end of the covered fiscal year | 39,015,871 | | | 2,379,497 | | | 5,649,120 | | 5,791,292 | | | (6,590,127) | | | (482,158) | | | Change in dividends accrued | 1,415,347 | | | 845,955 | | | 880,332 | | 925,040 | | | 1,429,057 | | | 1,525,687 | | | Compensation actually paid (as calculated) | 72,784,925 | | | 28,304,507 | | | 40,796,971 | | 12,948,517 | | | 3,175,014 | | | 9,686,761 | |
|
|
|
|
|
| Non-PEO NEO Average Total Compensation Amount |
$ 5,347,072
|
$ 5,981,832
|
$ 4,154,565
|
$ 4,110,560
|
$ 3,715,505
|
| Non-PEO NEO Average Compensation Actually Paid Amount |
$ 19,819,300
|
7,969,614
|
9,212,666
|
2,918,363
|
4,121,383
|
| Adjustment to Non-PEO NEO Compensation Footnote |
The following tables show the adjustments, each of which is prescribed by the SEC rules, made to calculate the CAP amounts from the Summary Compensation Table (“SCT”) amounts. The SCT amounts and the CAP amounts do not reflect the actual amount of compensation earned by or paid to our executives during the applicable years, but rather are amounts determined in accordance with Item 402 of Regulation S-K. Pursuant to the applicable rules, the amounts reported in the “Stock Awards” column from the SCT are subtracted from the SCT amounts and the values reflected in the table below are added or subtracted as applicable:Average Non-PEO NEO Summary Compensation Table Total Compensation to Average Compensation Actually Paid Reconciliation | | | | | | | | | | | | | | | | | | | | | | | | | | | | | | | | | | | | | | | | | 2025 ($)* | | 2024 ($)* | | 2023 ($)* | | 2022 ($)* | | 2021 ($)* | | SCT total compensation | 5,347,072 | | | 5,981,832 | | | 4,154,565 | | | 4,110,560 | | | 3,715,505 | | | Adjustments for stock awards | | | | | | | | | | | Stock award values reported in SCT for the covered fiscal year | (3,577,473) | | | (4,370,314) | | | (2,764,459) | | | (3,137,498) | | | (2,447,474) | | | Fair value of stock awards granted in the covered fiscal year — value at fiscal-year-end | 7,243,294 | | | 5,630,751 | | | 4,439,800 | | | 2,948,596 | | | 2,579,674 | | | Change in fair value from end of prior fiscal year to vesting date for stock awards granted in prior fiscal years that vested during the covered fiscal year | 899,559 | | | (105,237) | | | 464,885 | | | (138,220) | | | 25,940 | | | Change in fair value from end of prior fiscal year to end of the covered fiscal year for stock awards granted in prior fiscal years that were unvested at the end of the covered fiscal year | 9,539,342 | | | 567,703 | | | 2,636,182 | | | (1,185,583) | | | (30,365) | | | Change in dividends accrued | 367,506 | | | 264,879 | | | 281,692 | | | 320,508 | | | 278,103 | | | Compensation actually paid (as calculated) | 19,819,300 | | | 7,969,614 | | | 9,212,666 | | | 2,918,363 | | | 4,121,383 | |
* Amounts presented are averages for the entire group of Non-PEO NEOs in each respective year.
|
|
|
|
|
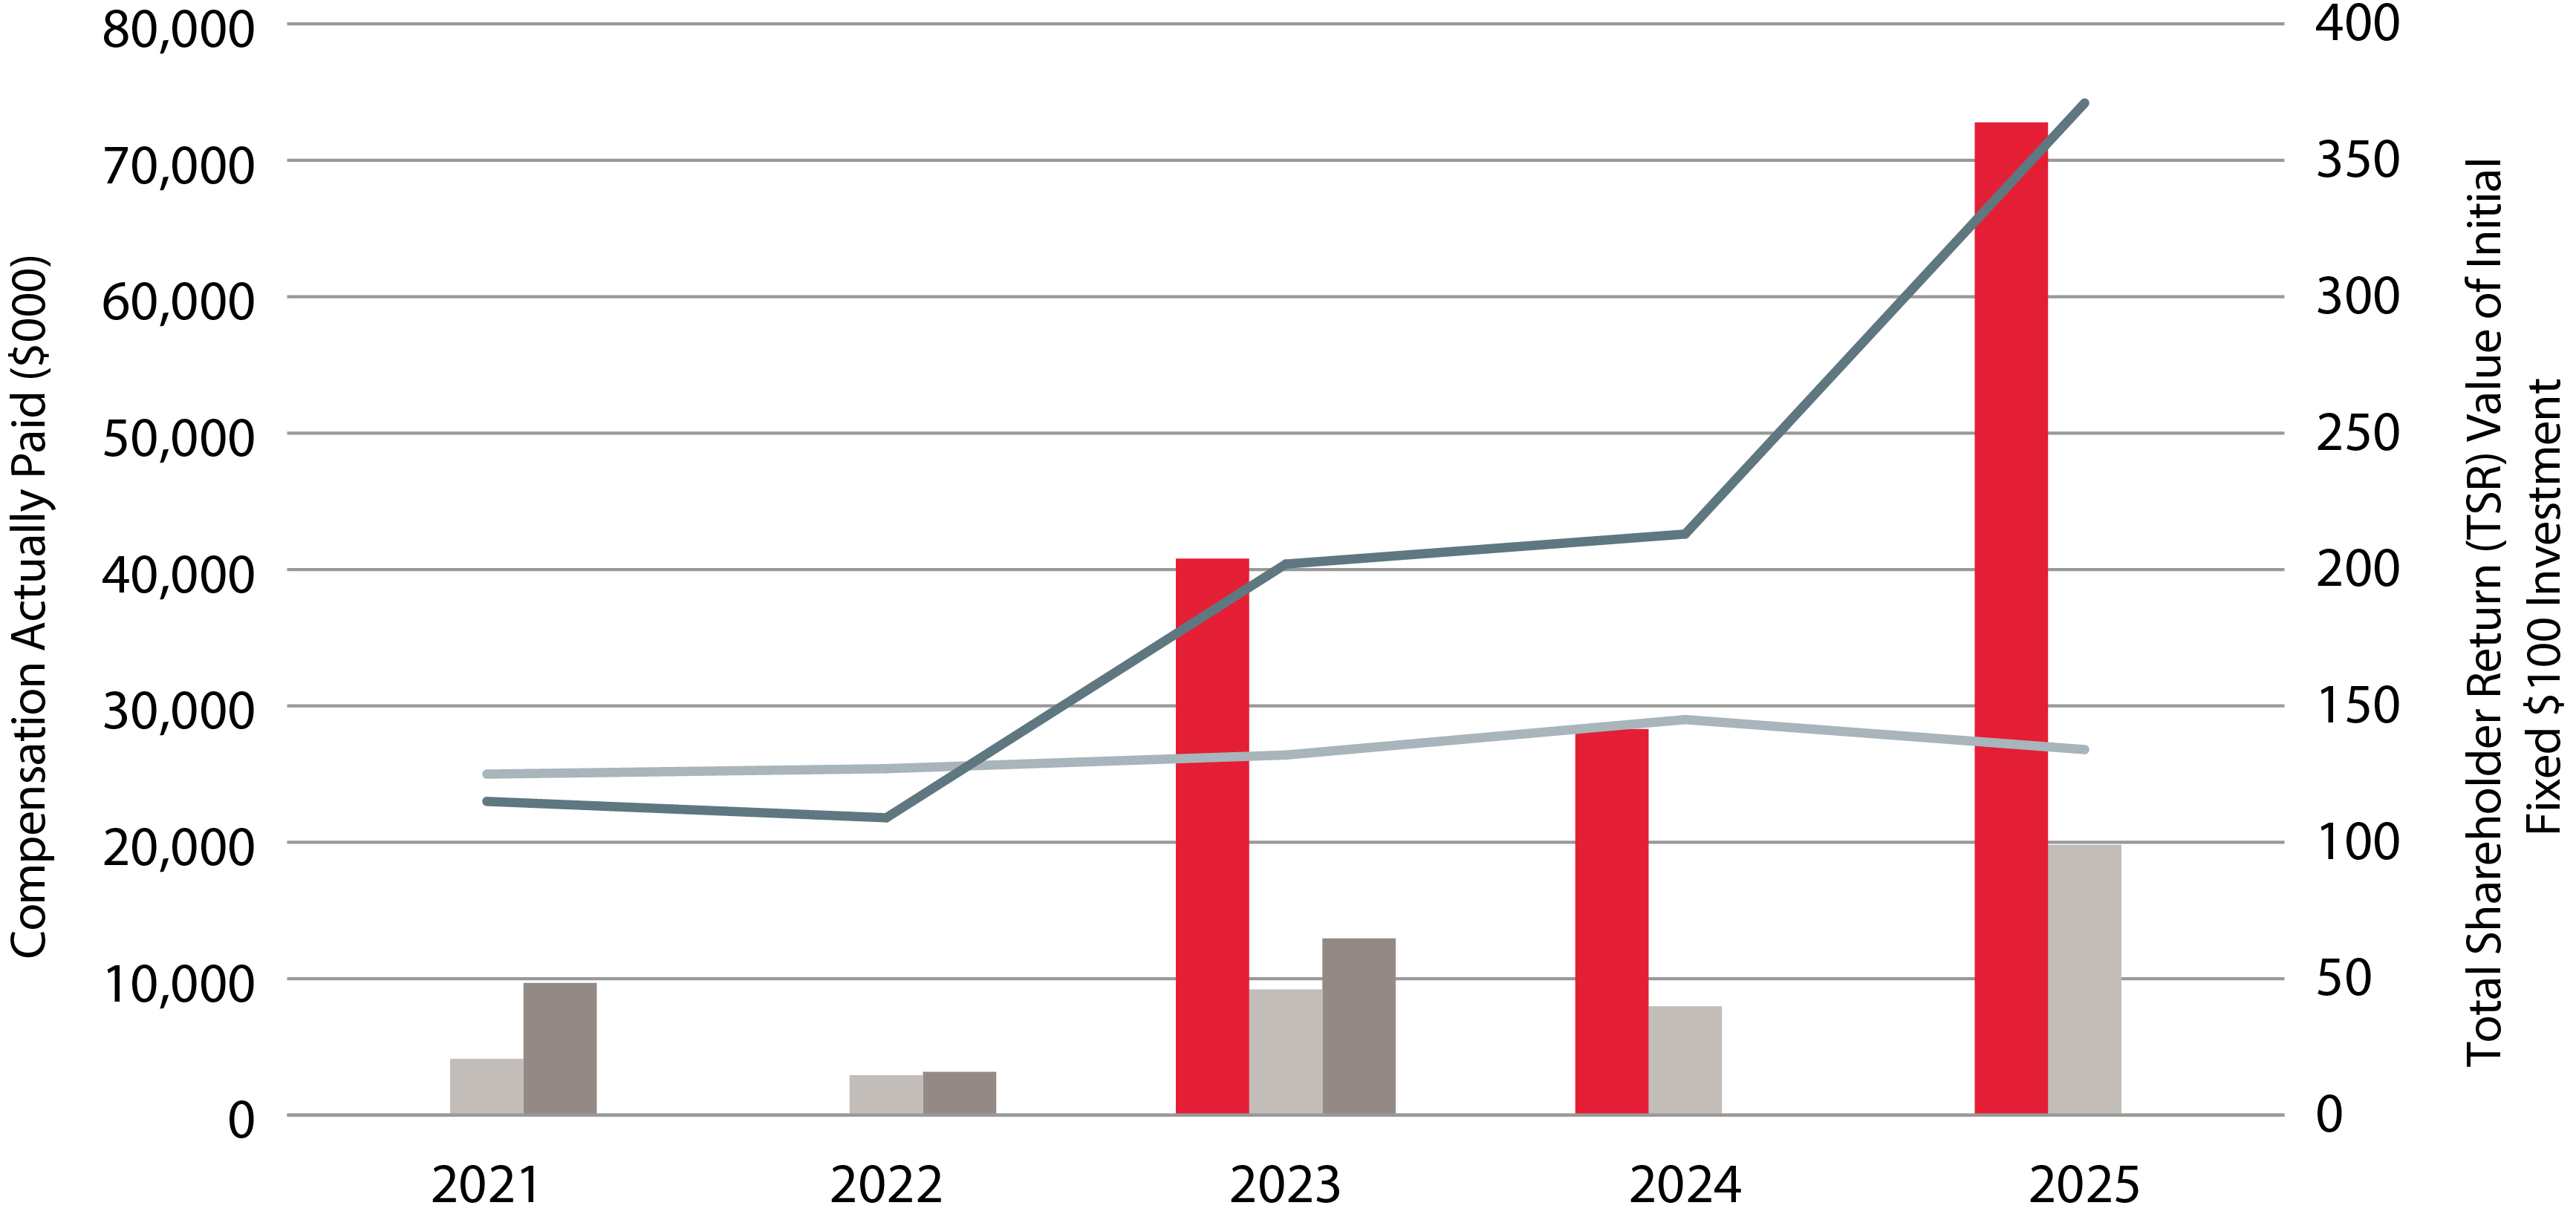
| Compensation Actually Paid vs. Total Shareholder Return |
Compensation Actually Paid vs. Company and Total Shareholder Return | | | | | | | | | | | | | Compensation Actually Paid to Hollar | | Average Compensation Actually Paid to Non-PEO NEOs | | Compensation Actually Paid to Kaufmann | | Cardinal Health TSR | | S&P500 Health Care Index TSR | | |
|
|
|
|
|
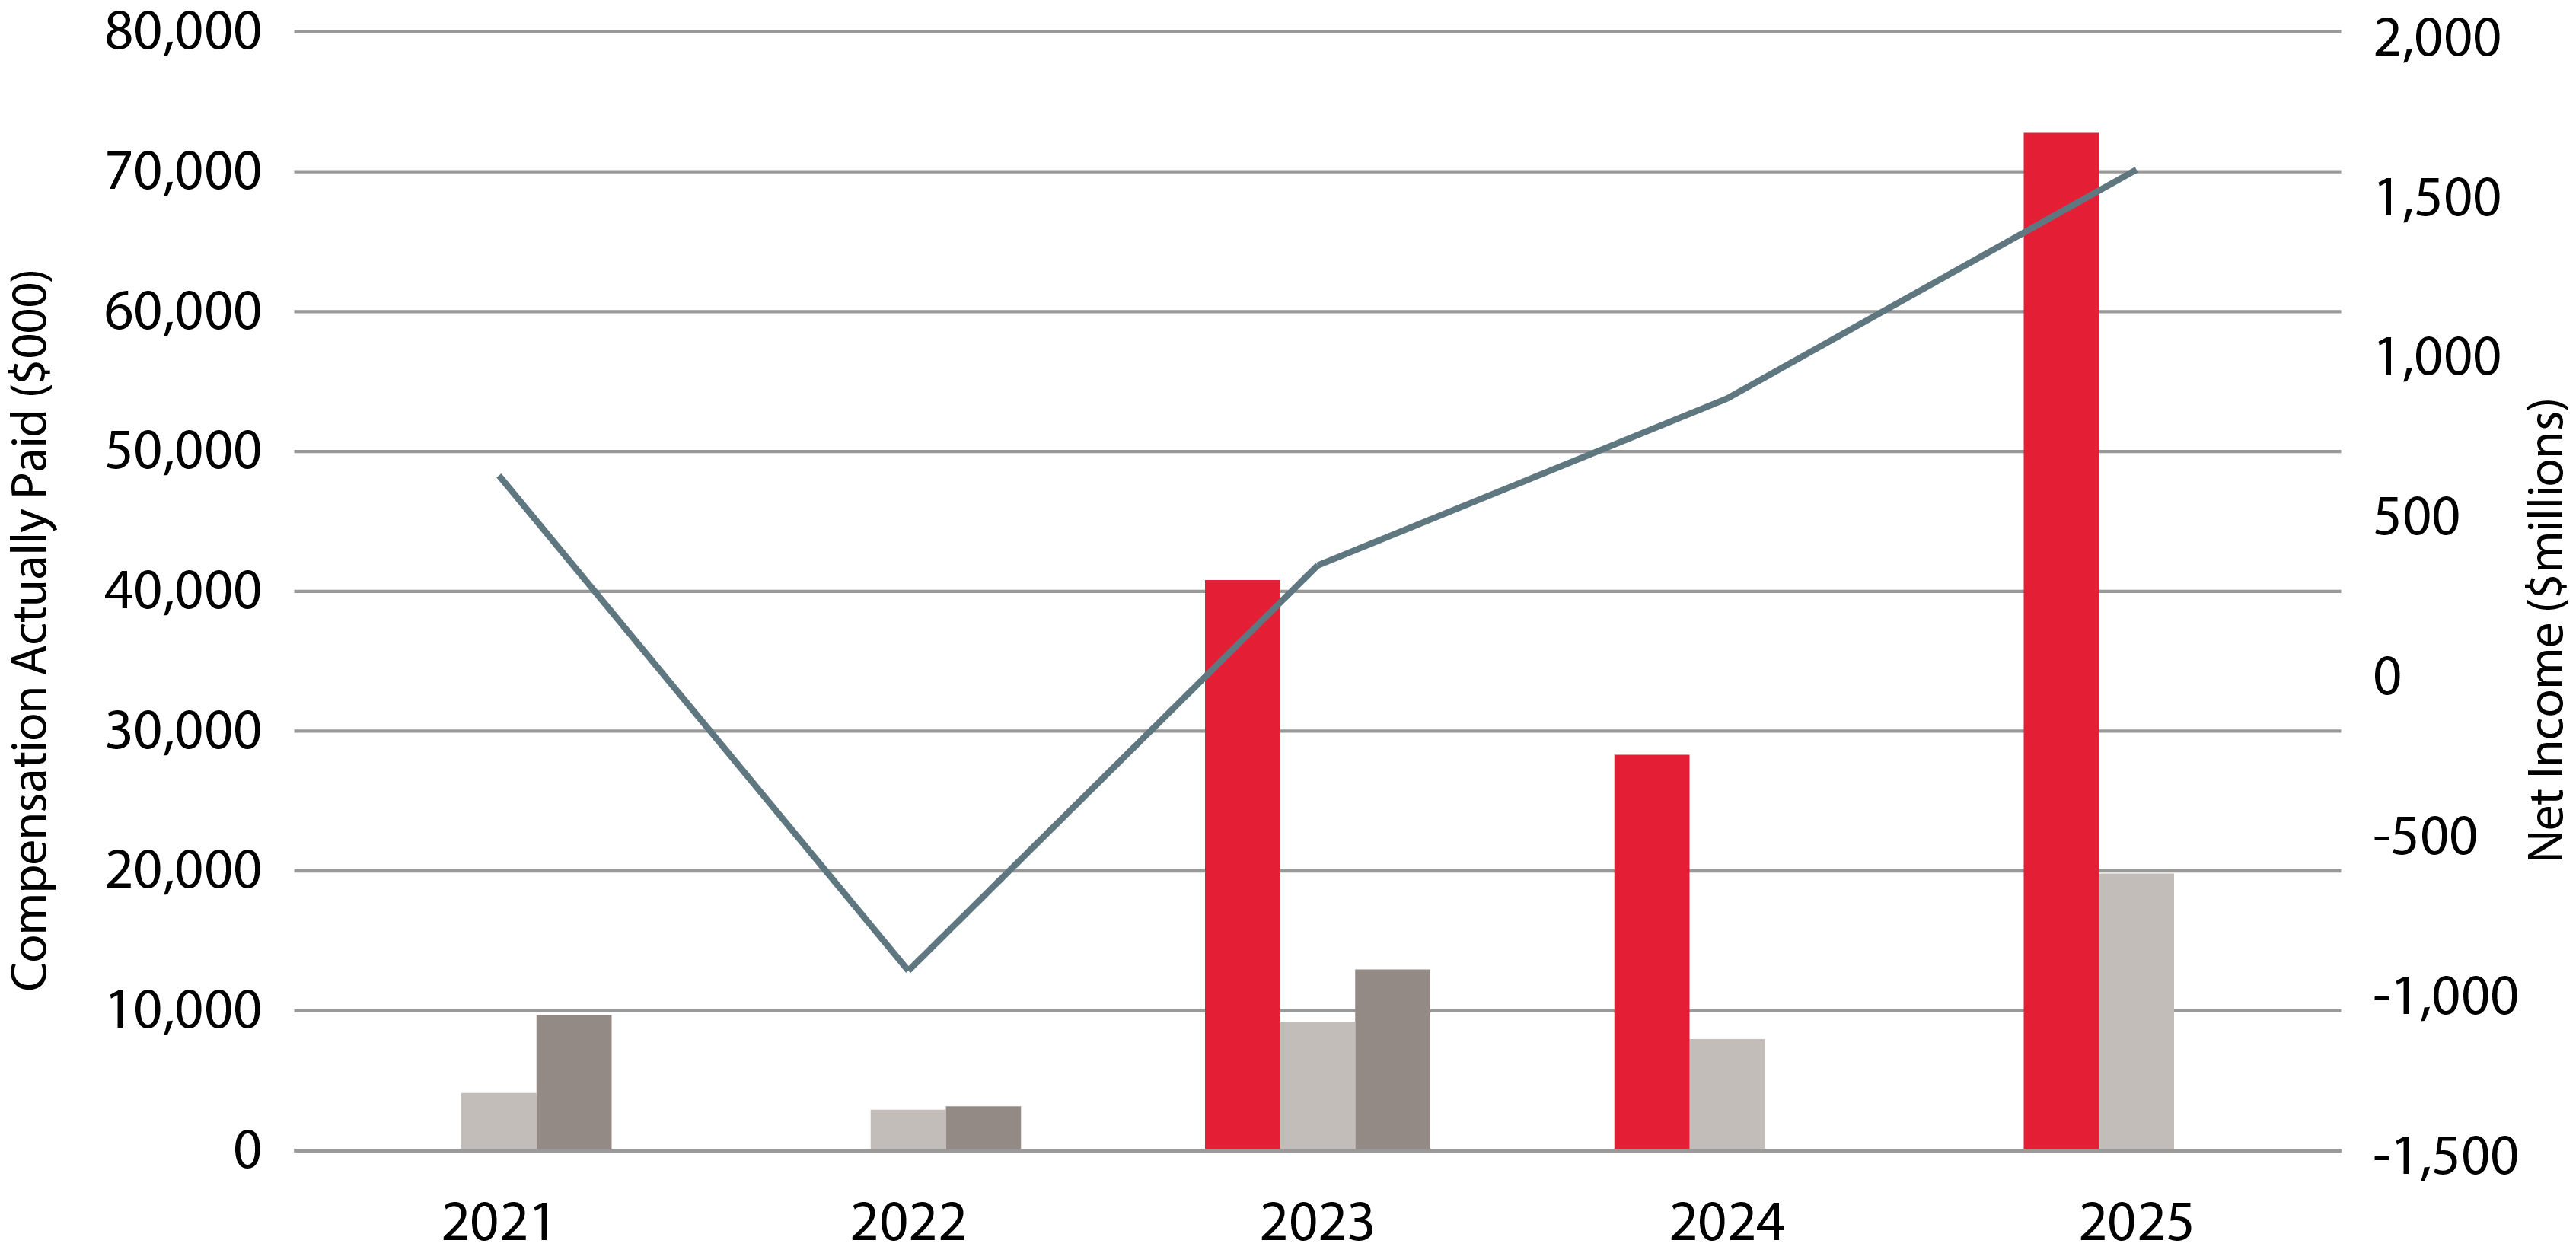
| Compensation Actually Paid vs. Net Income |
Compensation Actually Paid vs. Net Income | | | | | | | | | | | | | Compensation Actually Paid to Hollar | | Average Compensation Actually Paid to Non-PEO NEOs | | Compensation Actually Paid to Kaufmann | | GAAP Net Income/(Loss) |
|
|
|
|
|
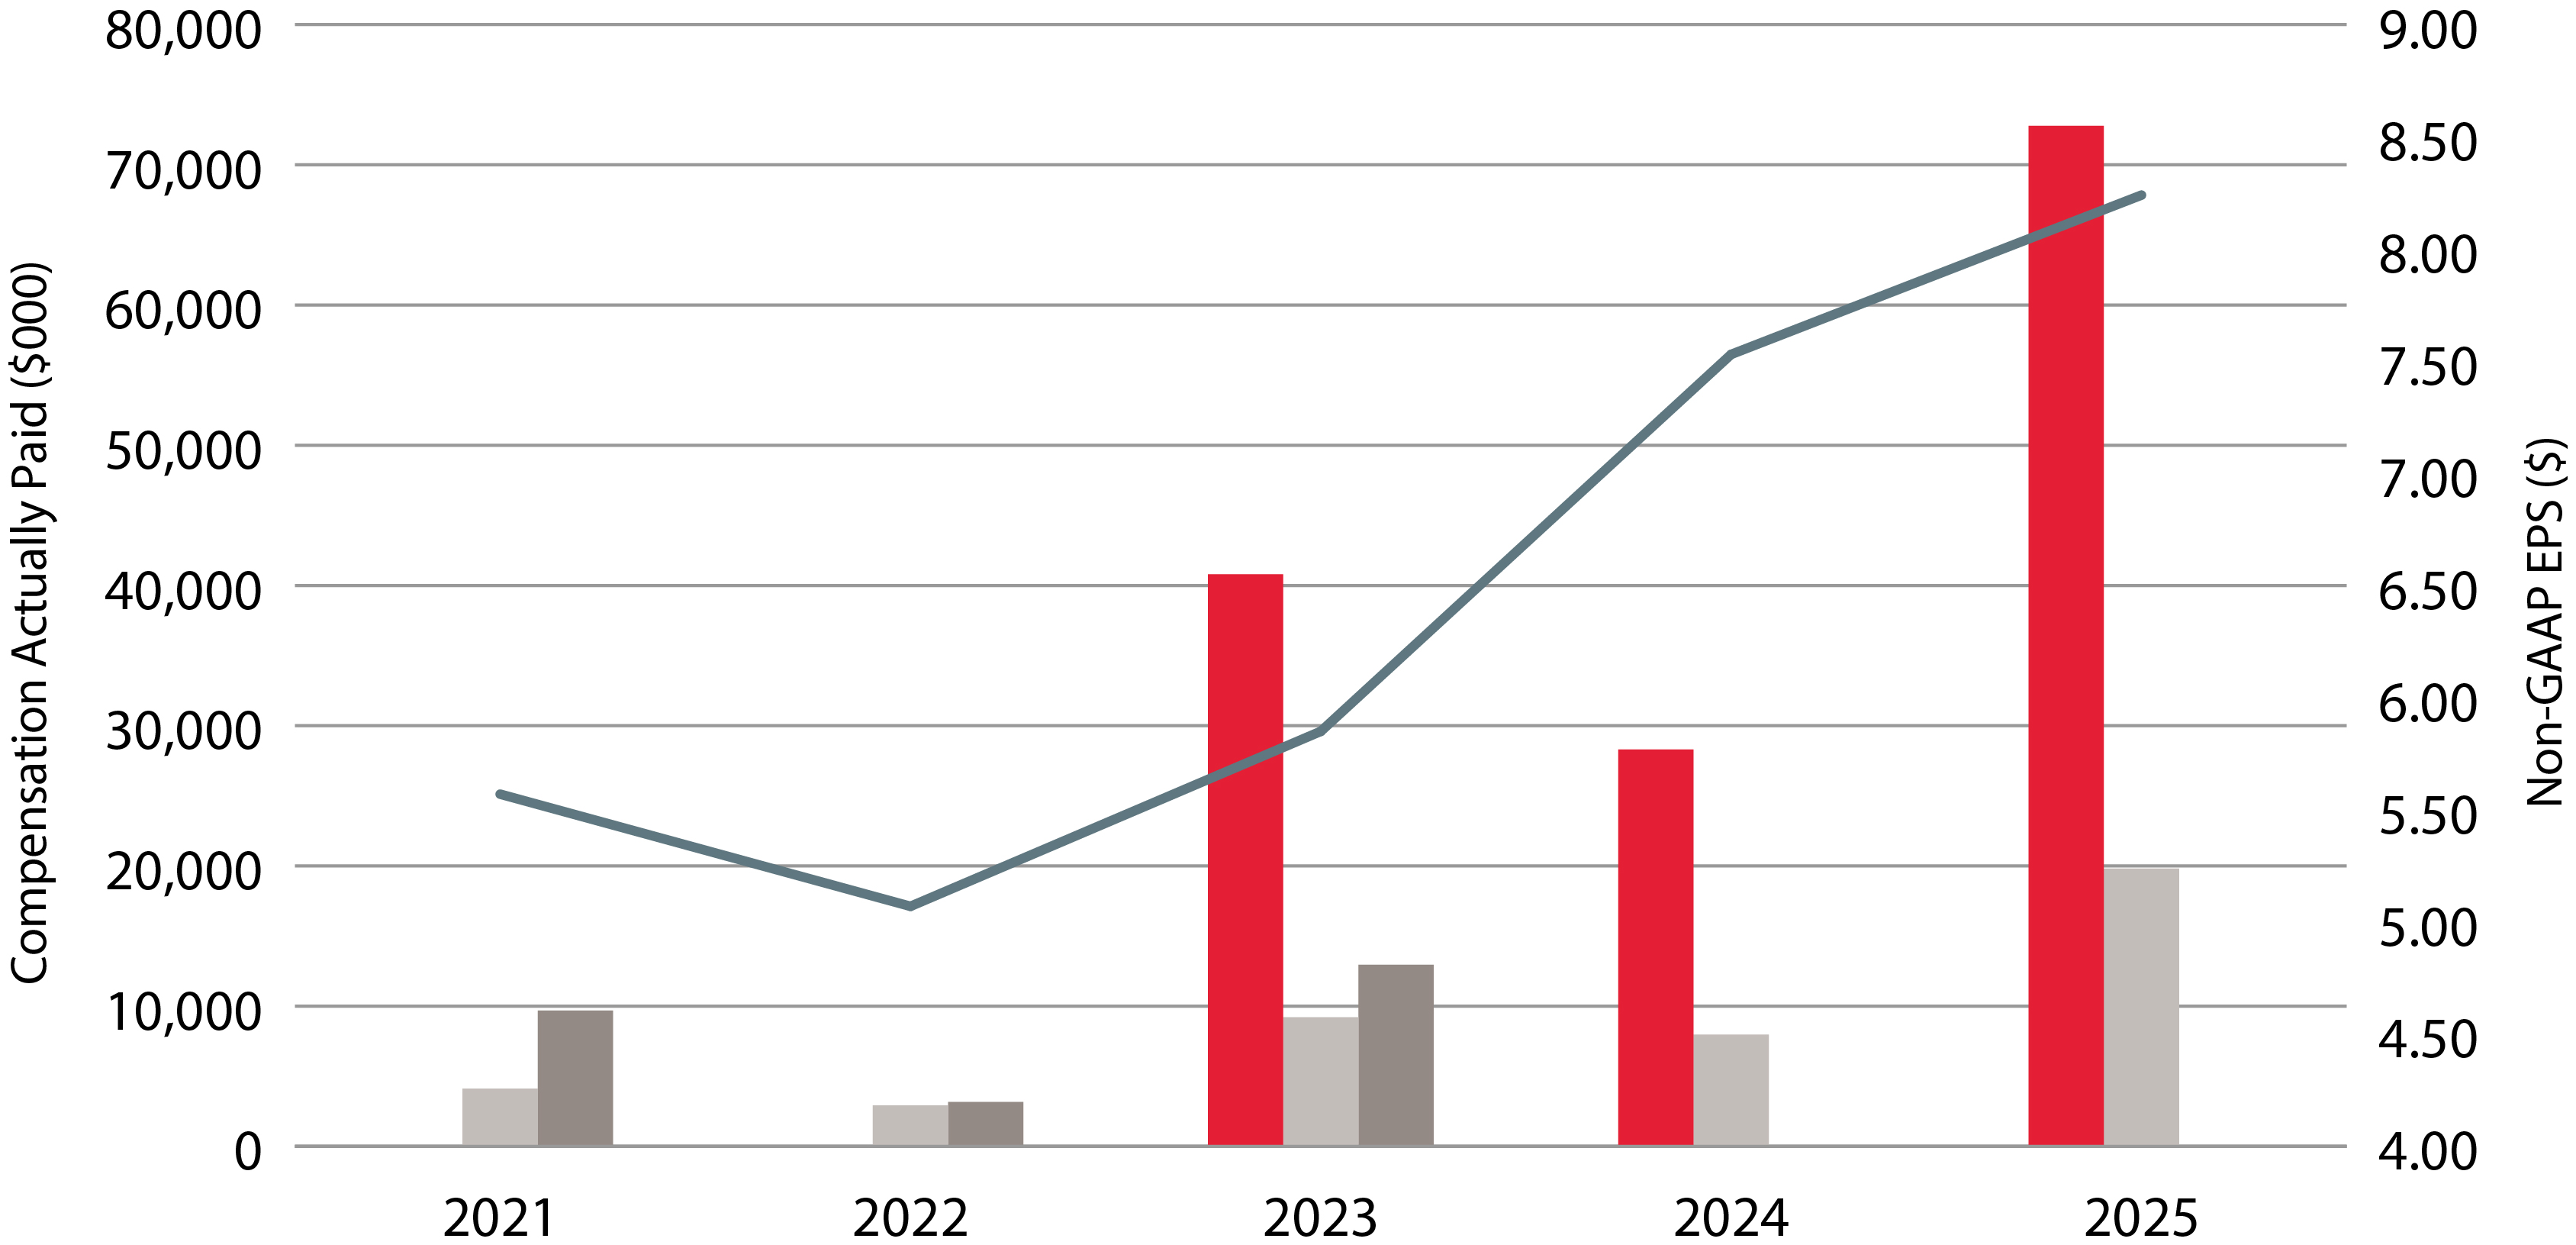
| Compensation Actually Paid vs. Company Selected Measure |
Compensation Actually Paid vs. Non-GAAP EPS | | | | | | | | | | | | | Compensation Actually Paid to Hollar | | Average Compensation Actually Paid to Non-PEO NEOs | | Compensation Actually Paid to Kaufmann | | Non-GAAP EPS |
|
|
|
|
|
| Total Shareholder Return Vs Peer Group |
Compensation Actually Paid vs. Company and Total Shareholder Return | | | | | | | | | | | | | Compensation Actually Paid to Hollar | | Average Compensation Actually Paid to Non-PEO NEOs | | Compensation Actually Paid to Kaufmann | | Cardinal Health TSR | | S&P500 Health Care Index TSR | | |
|
|
|
|
|
| Tabular List, Table |
| | | | Non-GAAP diluted EPS | | Non-GAAP operating earnings | | Segment profit | | Non-GAAP adjusted free cash flow | | Annual dividend yield |
|
|
|
|
|
| Total Shareholder Return Amount |
$ 371
|
213
|
202
|
109
|
115
|
| Peer Group Total Shareholder Return Amount |
134
|
145
|
132
|
127
|
125
|
| Net Income (Loss), Including Portion Attributable to Noncontrolling Interest |
$ 1,569,000,000
|
$ 853,000,000
|
$ 331,000,000
|
$ (937,000,000)
|
$ 612,000,000
|
| Company Selected Measure Amount | $ / shares |
8.24
|
7.53
|
5.85
|
5.07
|
5.57
|
| Additional 402(v) Disclosure |
The primary financial metric for our PSU program is adjusted non-GAAP diluted EPS, which is defined under “Performance Measure Calculations” beginning on page 63. See Annex A for a reconciliation to the comparable financial measure prepared in accordance with GAAP and the reasons why we use non-GAAP financial measures.
|
|
|
|
|
| Measure:: 1 |
|
|
|
|
|
| Pay vs Performance Disclosure |
|
|
|
|
|
| Name |
Non-GAAP diluted EPS
|
|
|
|
|
| Measure:: 2 |
|
|
|
|
|
| Pay vs Performance Disclosure |
|
|
|
|
|
| Name |
Non-GAAP operating earnings
|
|
|
|
|
| Measure:: 3 |
|
|
|
|
|
| Pay vs Performance Disclosure |
|
|
|
|
|
| Name |
Segment profit
|
|
|
|
|
| Measure:: 4 |
|
|
|
|
|
| Pay vs Performance Disclosure |
|
|
|
|
|
| Name |
Non-GAAP adjusted free cash flow
|
|
|
|
|
| Measure:: 5 |
|
|
|
|
|
| Pay vs Performance Disclosure |
|
|
|
|
|
| Name |
Annual dividend yield
|
|
|
|
|
| Hollar [Member] |
|
|
|
|
|
| Pay vs Performance Disclosure |
|
|
|
|
|
| PEO Total Compensation Amount |
$ 18,976,195
|
$ 25,651,209
|
$ 18,786,467
|
|
|
| PEO Actually Paid Compensation Amount |
72,784,925
|
28,304,507
|
40,796,971
|
|
|
| Kaufmann [Member] |
|
|
|
|
|
| Pay vs Performance Disclosure |
|
|
|
|
|
| PEO Total Compensation Amount |
|
|
3,528,968
|
$ 13,463,557
|
$ 12,482,378
|
| PEO Actually Paid Compensation Amount |
|
|
12,948,517
|
3,175,014
|
9,686,761
|
| PEO | Hollar [Member] | Aggregate Grant Date Fair Value of Equity Award Amounts Reported in Summary Compensation Table |
|
|
|
|
|
| Pay vs Performance Disclosure |
|
|
|
|
|
| Adjustment to Compensation, Amount |
(13,431,441)
|
(20,640,912)
|
(14,828,888)
|
|
|
| PEO | Hollar [Member] | Year-end Fair Value of Equity Awards Granted in Covered Year that are Outstanding and Unvested |
|
|
|
|
|
| Pay vs Performance Disclosure |
|
|
|
|
|
| Adjustment to Compensation, Amount |
25,060,892
|
20,398,094
|
29,849,423
|
|
|
| PEO | Hollar [Member] | Year-over-Year Change in Fair Value of Equity Awards Granted in Prior Years That are Outstanding and Unvested |
|
|
|
|
|
| Pay vs Performance Disclosure |
|
|
|
|
|
| Adjustment to Compensation, Amount |
39,015,871
|
2,379,497
|
5,649,120
|
|
|
| PEO | Hollar [Member] | Change in Fair Value as of Vesting Date of Prior Year Equity Awards Vested in Covered Year |
|
|
|
|
|
| Pay vs Performance Disclosure |
|
|
|
|
|
| Adjustment to Compensation, Amount |
1,748,061
|
(329,335)
|
460,516
|
|
|
| PEO | Hollar [Member] | Dividends or Other Earnings Paid on Equity Awards not Otherwise Reflected in Total Compensation for Covered Year |
|
|
|
|
|
| Pay vs Performance Disclosure |
|
|
|
|
|
| Adjustment to Compensation, Amount |
1,415,347
|
845,955
|
880,332
|
|
|
| PEO | Kaufmann [Member] | Aggregate Grant Date Fair Value of Equity Award Amounts Reported in Summary Compensation Table |
|
|
|
|
|
| Pay vs Performance Disclosure |
|
|
|
|
|
| Adjustment to Compensation, Amount |
|
|
0
|
(11,051,066)
|
(10,197,832)
|
| PEO | Kaufmann [Member] | Year-end Fair Value of Equity Awards Granted in Covered Year that are Outstanding and Unvested |
|
|
|
|
|
| Pay vs Performance Disclosure |
|
|
|
|
|
| Adjustment to Compensation, Amount |
|
|
0
|
10,213,707
|
10,748,666
|
| PEO | Kaufmann [Member] | Year-over-Year Change in Fair Value of Equity Awards Granted in Prior Years That are Outstanding and Unvested |
|
|
|
|
|
| Pay vs Performance Disclosure |
|
|
|
|
|
| Adjustment to Compensation, Amount |
|
|
5,791,292
|
(6,590,127)
|
(482,158)
|
| PEO | Kaufmann [Member] | Change in Fair Value as of Vesting Date of Prior Year Equity Awards Vested in Covered Year |
|
|
|
|
|
| Pay vs Performance Disclosure |
|
|
|
|
|
| Adjustment to Compensation, Amount |
|
|
2,703,218
|
(4,290,114)
|
(4,389,981)
|
| PEO | Kaufmann [Member] | Dividends or Other Earnings Paid on Equity Awards not Otherwise Reflected in Total Compensation for Covered Year |
|
|
|
|
|
| Pay vs Performance Disclosure |
|
|
|
|
|
| Adjustment to Compensation, Amount |
|
|
925,040
|
1,429,057
|
1,525,687
|
| Non-PEO NEO | Aggregate Grant Date Fair Value of Equity Award Amounts Reported in Summary Compensation Table |
|
|
|
|
|
| Pay vs Performance Disclosure |
|
|
|
|
|
| Adjustment to Compensation, Amount |
(3,577,473)
|
(4,370,314)
|
(2,764,459)
|
(3,137,498)
|
(2,447,474)
|
| Non-PEO NEO | Year-end Fair Value of Equity Awards Granted in Covered Year that are Outstanding and Unvested |
|
|
|
|
|
| Pay vs Performance Disclosure |
|
|
|
|
|
| Adjustment to Compensation, Amount |
7,243,294
|
5,630,751
|
4,439,800
|
2,948,596
|
2,579,674
|
| Non-PEO NEO | Year-over-Year Change in Fair Value of Equity Awards Granted in Prior Years That are Outstanding and Unvested |
|
|
|
|
|
| Pay vs Performance Disclosure |
|
|
|
|
|
| Adjustment to Compensation, Amount |
9,539,342
|
567,703
|
2,636,182
|
(1,185,583)
|
(30,365)
|
| Non-PEO NEO | Change in Fair Value as of Vesting Date of Prior Year Equity Awards Vested in Covered Year |
|
|
|
|
|
| Pay vs Performance Disclosure |
|
|
|
|
|
| Adjustment to Compensation, Amount |
899,559
|
(105,237)
|
464,885
|
(138,220)
|
25,940
|
| Non-PEO NEO | Dividends or Other Earnings Paid on Equity Awards not Otherwise Reflected in Total Compensation for Covered Year |
|
|
|
|
|
| Pay vs Performance Disclosure |
|
|
|
|
|
| Adjustment to Compensation, Amount |
$ 367,506
|
$ 264,879
|
$ 281,692
|
$ 320,508
|
$ 278,103
|