Pay vs Performance Disclosure - USD ($)
Dec. 31, 2024
Dec. 31, 2023
Dec. 31, 2022
| Pay Versus Performance | ||||||||||||||||||||||||||||||||
| Value of | ||||||||||||||||||||||||||||||||
| Average | Average | Initial Fixed | ||||||||||||||||||||||||||||||
| Summary | Summary | Compensation | Summary | Compensation | $100 | |||||||||||||||||||||||||||
| Compensation | Compensation | Compensation | Actually | Compensation | Actually | Investment | ||||||||||||||||||||||||||
| Table Total | Actually | Table Total | Paid | Table Total | Paid | Total | ||||||||||||||||||||||||||
| Year | for First PEO1 | Paid for First PEO2 | for Second PEO1 | for Second PEO2 | for Non-PEO NEOs3 | for Non-PEO NEOs4 | Shareholder Return5 | Net Income or Loss6 | ||||||||||||||||||||||||
| (a) | (b) | (c) | (b) | (c) | (d) | (e) | (f) | (h) | ||||||||||||||||||||||||
| 2024 | $ | N/A | $ | N/A | $ | 813,000 | $ | 691,605 | $ | 581,000 | $ | 525,409 | $ | 0 | $ | -14,438,000 | ||||||||||||||||
| 2023 | $ | N/A | $ | N/A | $ | 1,277,100 | $ | 1,048,872 | $ | 328,723 | $ | 317,500 | $ | 1 | $ | -12,300,047 | ||||||||||||||||
| 2022 | $ | 533,822 | $ | 269,883 | 613,561 | $ | 460,933 | $ | 249,577 | $ | 216,433 | $ | 8 | $ | -14,260,000 | |||||||||||||||||
| 1 | The dollar amounts reported in columns (b) represent the amounts of total compensation reported for Thomas Hallam, Ph.D. (our “First PEO”), who was as our principal executive officer or PEO for part of 2022, and J.D. Finley (our “Second PEO”), who was our PEO for part of 2022 and in 2023 and 2024, for each covered fiscal year in the “Total” column of the Summary Compensation Table for each applicable year. Please refer to “Executive Compensation – Summary Compensation Table.” |
| Second PEO - J.D. Finley | |||||||
| Summary Compensation Table - Total Compensation | (a) | $ | 813,000 | ||||
| - | Grant Date Fair Value of Stock Awards and Option Awards Granted in Fiscal Year | (b) | $ | 0 | |||
| + | Fair Value at Fiscal Year End of Outstanding and Unvested Stock Awards and Option Awards Granted in Fiscal Year | (c) | $ | 0 | |||
| + | Change in Fair Value of Outstanding and Unvested Stock Awards and Option Awards Granted in Prior Fiscal Years | (d) | $ | -66,285 | |||
| + | Fair Value at Vesting of Stock Awards and Option Awards Granted in Fiscal Year That Vested During Fiscal Year | (e) | $ | 0 | |||
| + | Change in Fair Value as of Vesting Date of Stock Awards and Option Awards Granted in Prior Fiscal Years For Which Applicable Vesting Conditions Were Satisfied During Fiscal Year | (f) | $ | -55,111 | |||
| - | Fair Value as of Prior Fiscal Year End of Stock Awards and Option Awards Granted in Prior Fiscal Years That Failed to Meet Applicable Vesting Conditions During Fiscal Year | (g) | $ | 0 | |||
| = | Compensation Actually Paid | $ | 691,605 | ||||
| (a) | The reported total compensation reflects the “Total” compensation as reported in the Summary Compensation Table for the covered fiscal year. | |
| (b) | The reported grant date fair value of equity awards represents the total of the amounts reported in the “Stock Awards” and “Option Awards” columns in the Summary Compensation Table for the covered fiscal year. These equity award values are adjusted for the covered fiscal year by the addition (or subtraction, as applicable) as described in footnotes (c), (d), (e), (f), and (g). | |
| (c) | The year-end fair value of all equity awards granted in the covered fiscal year that are outstanding and unvested as of the end of the covered fiscal year; | |
| (d) | The amount equal to the change as of the end of the covered fiscal year (from the end of the prior fiscal year) in fair value of any equity awards granted in any prior fiscal year that are outstanding and unvested as of the end of the covered fiscal year; | |
| (e) | For equity awards that are granted and vest in the same covered fiscal year, the fair value as of the vesting date; | |
| (f) | For equity awards granted in any prior fiscal year for which all applicable vesting conditions were satisfied at the end of or during the covered fiscal year, the amount equal to the change in fair value as of the vesting date (from the end of the prior fiscal year); and |
| (g) | For equity awards that are granted in any prior fiscal year that fail to meet the applicable vesting conditions during the covered fiscal year, the amount equal to the fair value at the end of the prior fiscal year. |
| NEO Average | |||||||
| 2024 | |||||||
| Summary Compensation Table - Total Compensation | (a) | $ | 581,000 | ||||
| - | Grant Date Fair Value of Stock Awards and Option Awards Granted in Fiscal Year | (b) | $ | 0 | |||
| + | Fair Value at Fiscal Year End of Outstanding and Unvested Stock Awards and Option Awards Granted in Fiscal Year | (c) | $ | 0 | |||
| + | Change in Fair Value of Outstanding and Unvested Stock Awards and Option Awards Granted in Prior Fiscal Years | (d) | $ | -26,267 | |||
| + | Fair Value at Vesting of Stock Awards and Option Awards Granted in Fiscal Year That Vested During Fiscal Year | (e) | $ | 0 | |||
| + | Change in Fair Value as of Vesting Date of Stock Awards and Option Awards Granted in Prior Fiscal Years For Which Applicable Vesting Conditions Were Satisfied During Fiscal Year | (f) | $ | -29,324 | |||
| - | Fair Value as of Prior Fiscal Year End of Stock Awards and Option Awards Granted in Prior Fiscal Years That Failed to Meet Applicable Vesting Conditions During Fiscal Year | (g) | $ | 0 | |||
| = | Compensation Actually Paid | $ | 525,409 | ||||
| (a) | The reported total compensation reflects the “Total” compensation as reported in the Summary Compensation Table for the covered fiscal year. |
| (b) | The reported grant date fair value of equity awards represents the total of the amounts reported in the “Stock Awards” and “Option Awards” columns in the Summary Compensation Table for the covered fiscal year. These equity award values are adjusted for the covered fiscal year by the addition (or subtraction, as applicable) as described in footnotes (c), (d), (e), (f), and (g). | |
| (c) | The year-end fair value of all equity awards granted in the covered fiscal year that are outstanding and unvested as of the end of the covered fiscal year; | |
| (d) | The amount equal to the change as of the end of the covered fiscal year (from the end of the prior fiscal year) in fair value of any equity awards granted in any prior fiscal year that are outstanding and unvested as of the end of the covered fiscal year; | |
| (e) | For equity awards that are granted and vest in the same covered fiscal year, the fair value as of the vesting date; | |
| (f) | For equity awards granted in any prior fiscal year for which all applicable vesting conditions were satisfied at the end of or during the covered fiscal year, the amount equal to the change in fair value as of the vesting date (from the end of the prior fiscal year); and | |
| (g) | For equity awards that are granted in any prior fiscal year that fail to meet the applicable vesting conditions during the covered fiscal year, the amount equal to the fair value at the end of the prior fiscal year. |
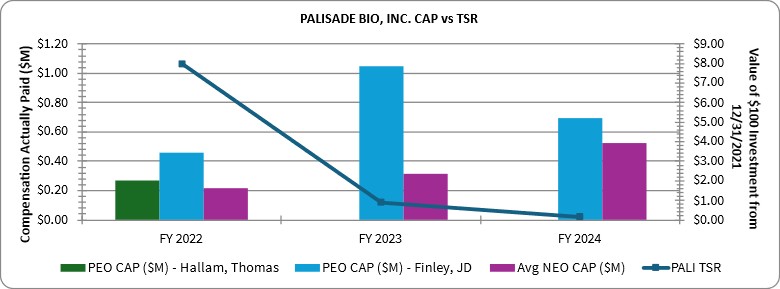
The following graph presents the alignment between the amount of compensation actually paid to PEOs, and the average amount of compensation actually paid to our Non-PEO NEOs with our TSR over the period presented in the Pay-Versus-Performance Table.
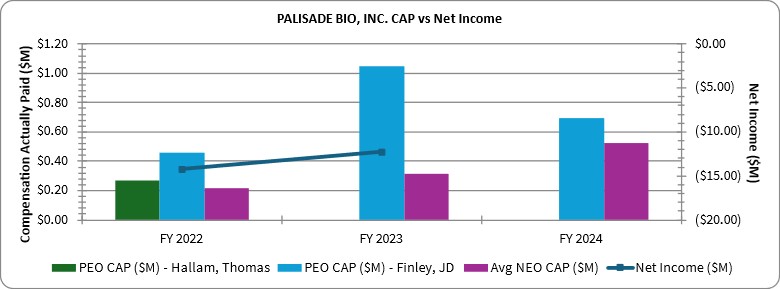
Compensation Actually Paid and Net Income
The following graph presents the alignment between the amount of compensation actually paid to our PEOs, and the average amount of compensation actually paid to our Non-PEO NEOs with our Net Income over the period presented in the Pay-Versus-Performance Table.
| 2 | The dollar amounts reported in columns (c) represent the amounts of “compensation actually paid” to Thomas Hallam, Ph.D., and J.D. Finley, as computed in accordance with Item 402(v) of Regulation S-K for each covered fiscal year. The dollar amounts in columns (b) do not reflect the actual amounts of compensation earned or received by or paid to these two individuals during the applicable fiscal year. In accordance with the requirements of Item 402(v) of Regulation S-K, the following adjustments were made to J.D. Finley’s total compensation reported in the Summary Compensation Table for the covered fiscal year to determine the “compensation actually paid” to him for such fiscal year: |
| [1] | The dollar amounts reported in column (d) represent the average of the amounts of total compensation reported for our Non-PEOs for each covered fiscal year in the “Total” column of the Summary Compensation Table for each applicable year. These amounts exclude Thomas Hallam, Ph.D., who served as PEO in 2022, and J.D. Finley, who served as PEO in 2022, 2023 and 2024. The names of each Non-PEO NEO included for purposes of calculating the average amounts of total compensation in each covered fiscal year are as follows: |
| [2] | The dollar amounts reported in column (e) represent the average amount of “executive compensation actually paid” to our Non-PEO NEOs, as computed in accordance with Item 402(v) of Regulation S-K for each covered fiscal year. The dollar amounts reported in column (d) do not reflect the actual average amount of compensation earned or received by or paid to our Non-PEO NEOs during the applicable fiscal year. In accordance with the requirements of Item 402(v) of Regulation S-K, the following adjustments were made to the average total compensation reported in the Summary Compensation Table for the covered fiscal year to determine the “compensation actually paid” for such fiscal year: |
| [3] | Cumulative total stockholder return (“TSR”) is calculated by dividing the sum of the cumulative amount of dividends during the measurement period, assuming dividend reinvestment, and the difference between our share price at the end of the applicable measurement period and the beginning of the measurement period (December 31, 2021) by our share price at the beginning of the measurement period. |
| [4] | The dollar amounts reported represent the amount of net income (loss) reflected in our audited financial statements for each covered fiscal year. |
| [5] | The dollar amounts reported in columns (b) represent the amounts of total compensation reported for Thomas Hallam, Ph.D. (our “First PEO”), who was as our principal executive officer or PEO for part of 2022, and J.D. Finley (our “Second PEO”), who was our PEO for part of 2022 and in 2023 and 2024, for each covered fiscal year in the “Total” column of the Summary Compensation Table for each applicable year. Please refer to “Executive Compensation – Summary Compensation Table.” |
| [6] | The reported total compensation reflects the “Total” compensation as reported in the Summary Compensation Table for the covered fiscal year. |
| [7] | The dollar amounts reported in columns (c) represent the amounts of “compensation actually paid” to Thomas Hallam, Ph.D., and J.D. Finley, as computed in accordance with Item 402(v) of Regulation S-K for each covered fiscal year. The dollar amounts in columns (b) do not reflect the actual amounts of compensation earned or received by or paid to these two individuals during the applicable fiscal year. In accordance with the requirements of Item 402(v) of Regulation S-K, the following adjustments were made to J.D. Finley’s total compensation reported in the Summary Compensation Table for the covered fiscal year to determine the “compensation actually paid” to him for such fiscal year: |
| [8] | The reported grant date fair value of equity awards represents the total of the amounts reported in the “Stock Awards” and “Option Awards” columns in the Summary Compensation Table for the covered fiscal year. These equity award values are adjusted for the covered fiscal year by the addition (or subtraction, as applicable) as described in footnotes (c), (d), (e), (f), and (g). |
| [9] | The year-end fair value of all equity awards granted in the covered fiscal year that are outstanding and unvested as of the end of the covered fiscal year; |
| [10] | The amount equal to the change as of the end of the covered fiscal year (from the end of the prior fiscal year) in fair value of any equity awards granted in any prior fiscal year that are outstanding and unvested as of the end of the covered fiscal year; |
| [11] | For equity awards that are granted and vest in the same covered fiscal year, the fair value as of the vesting date; |
| [12] | For equity awards granted in any prior fiscal year for which all applicable vesting conditions were satisfied at the end of or during the covered fiscal year, the amount equal to the change in fair value as of the vesting date (from the end of the prior fiscal year); and |
| [13] | For equity awards that are granted in any prior fiscal year that fail to meet the applicable vesting conditions during the covered fiscal year, the amount equal to the fair value at the end of the prior fiscal year. |
| [14] | The reported total compensation reflects the “Total” compensation as reported in the Summary Compensation Table for the covered fiscal year. |
| [15] | The reported grant date fair value of equity awards represents the total of the amounts reported in the “Stock Awards” and “Option Awards” columns in the Summary Compensation Table for the covered fiscal year. These equity award values are adjusted for the covered fiscal year by the addition (or subtraction, as applicable) as described in footnotes (c), (d), (e), (f), and (g). |
| [16] | The year-end fair value of all equity awards granted in the covered fiscal year that are outstanding and unvested as of the end of the covered fiscal year; |
| [17] | The amount equal to the change as of the end of the covered fiscal year (from the end of the prior fiscal year) in fair value of any equity awards granted in any prior fiscal year that are outstanding and unvested as of the end of the covered fiscal year; |
| [18] | For equity awards that are granted and vest in the same covered fiscal year, the fair value as of the vesting date; |
| [19] | For equity awards granted in any prior fiscal year for which all applicable vesting conditions were satisfied at the end of or during the covered fiscal year, the amount equal to the change in fair value as of the vesting date (from the end of the prior fiscal year); and |
| [20] | For equity awards that are granted in any prior fiscal year that fail to meet the applicable vesting conditions during the covered fiscal year, the amount equal to the fair value at the end of the prior fiscal year. |