Pay Versus Performance Disclosure
The following disclosure regarding executive “compensation actually paid” (“CAP”) and certain Company and peer group financial performance measures for the fiscal years listed below is provided in accordance with rules adopted by the SEC pursuant to the Dodd-Frank Wall Street Reform and Consumer Protection Act of 2010. Please refer to the “Compensation Discussion and Analysis” section for a complete description of how executive compensation relates to Company performance and how the Compensation Committee makes its decisions.
The Company chose the S&P SmallCap 600 Index as the peer group for purposes of Item 201(e) of Regulation S-K in the Company’s Annual Report on Form 10-K for fiscal 2025. The S&P SmallCap 600 Index seeks to measure the small-cap segment of the U.S. equity market, which the Company believes includes companies with characteristics most similar to UNIFI.
|
|
|
|
|
|
|
|
|
|
|
|
|
|
|
|
|
|
|
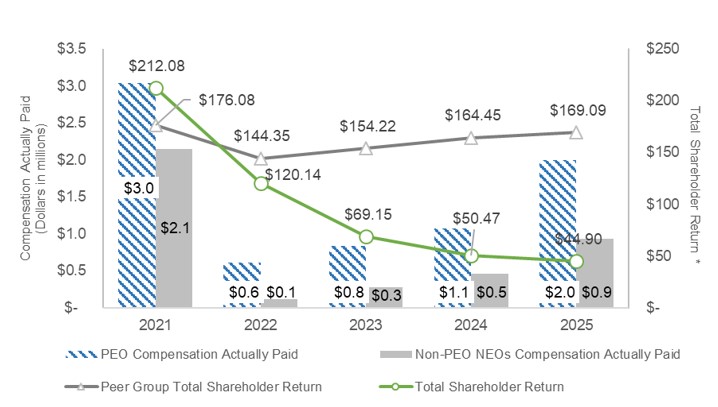
Value of Initial Fixed $100 Investment Based on: |
|
|
|
|
|
|
|
|
||||||||||
Year |
|
|
Summary Compensation Table Total for PEO |
|
|
|
Compensation Actually Paid to PEO |
|
|
|
Average Summary Compensation Table Total for Non-PEO NEOs |
|
|
|
Average Compensation Actually Paid to Non-PEO NEOs |
|
|
|
Total Shareholder Return |
|
|
Peer Group Total Shareholder Return |
|
|
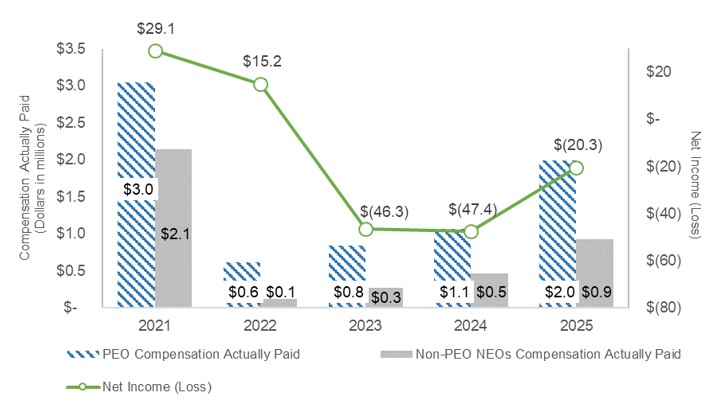
Net (Loss) Income (in thousands) |
|
|
|
Adjusted EBITDA (in thousands) |
|
|||||||
2025 |
|
|
|
2,219,431 |
|
|
|
|
1,992,419 |
|
|
|
|
1,061,857 |
|
|
|
|
929,660 |
|
|
|
|
44.90 |
|
|
169.09 |
|
|
|
(20,348 |
) |
|
|
|
(11,551 |
) |
2024 |
|
|
|
1,248,408 |
|
|
|
|
1,069,578 |
|
|
|
|
634,597 |
|
|
|
|
462,645 |
|
|
|
|
50.47 |
|
|
164.45 |
|
|
|
(47,395 |
) |
|
|
|
(5,197 |
) |
2023 |
|
|
|
1,244,710 |
|
|
|
|
824,527 |
|
|
|
|
696,777 |
|
|
|
|
273,051 |
|
|
|
|
69.15 |
|
|
154.22 |
|
|
|
(46,344 |
) |
|
|
|
(4,085 |
) |
2022 |
|
|
|
1,617,866 |
|
|
|
|
613,314 |
|
|
|
|
869,763 |
|
|
|
|
90,814 |
|
|
|
|
120.14 |
|
|
144.35 |
|
|
|
15,171 |
|
|
|
|
55,190 |
|
2021 |
|
|
|
1,748,373 |
|
|
|
|
3,040,666 |
|
|
|
|
1,198,197 |
|
|
|
|
2,145,892 |
|
|
|
|
212.08 |
|
|
176.08 |
|
|
|
29,073 |
|
|
|
|
64,643 |
|
2025: Andrew J. Eaker, Albert P. Carey, Brian D. Moore, and Hongjun Ning.
2024: Andrew J. Eaker, Albert P. Carey, Hongjun Ning, Meredith S. Boyd and Craig A. Creaturo.
2023: Albert P. Carey, Hongjun Ning, Gregory K. Sigmon, Craig A. Creaturo, and Lucas de Carvalho Rocha.
2022: Albert P. Carey, Craig A. Creaturo, Hongjun Ning, and Lucas de Carvalho Rocha.
2021: Thomas H. Caudle, Jr., Albert P. Carey, Craig A. Creaturo, and Hongjun Ning.
|
|
PEO |
|
|
Average Non-PEO NEOs |
|
||||||||||||||||||||||||||||||||||
|
|
2025 |
|
|
2024 |
|
|
2023 |
|
|
2022 |
|
|
2021 |
|
|
2025 |
|
|
2024 |
|
|
2023 |
|
|
2022 |
|
|
2021 |
|
||||||||||
Total Compensation from Summary Compensation Table |
|
|
2,219,431 |
|
|
|
1,248,408 |
|
|
|
1,244,710 |
|
|
|
1,617,866 |
|
|
|
1,748,373 |
|
|
|
1,061,857 |
|
|
|
634,597 |
|
|
|
696,777 |
|
|
|
869,763 |
|
|
|
1,198,197 |
|
Adjustments for Equity Awards: |
|
|
|
|
|
|
|
|
|
|
|
|
|
|
|
|
|
|
|
|
|
|
|
|
|
|
|
|
|
|
||||||||||
Grant date values in the Summary Compensation Table |
|
|
(775,283 |
) |
|
|
(387,500 |
) |
|
|
(387,500 |
) |
|
|
(387,500 |
) |
|
|
— |
|
|
|
(472,280 |
) |
|
|
(157,318 |
) |
|
|
(142,500 |
) |
|
|
(162,500 |
) |
|
|
(275,000 |
) |
Year-end fair value for unvested awards granted in the current year |
|
|
575,908 |
|
|
|
342,582 |
|
|
|
376,477 |
|
|
|
229,604 |
|
|
|
— |
|
|
|
352,051 |
|
|
|
141,650 |
|
|
|
138,451 |
|
|
|
100,463 |
|
|
|
511,010 |
|
Year-over-year difference of year-end fair values for unvested awards granted in prior years |
|
|
(36,335 |
) |
|
|
(105,105 |
) |
|
|
(72,240 |
) |
|
|
(549,678 |
) |
|
|
1,139,756 |
|
|
|
(15,671 |
) |
|
|
(32,743 |
) |
|
|
(280,639 |
) |
|
|
(687,937 |
) |
|
|
587,118 |
|
Fair values at vest date for awards granted and vested in the current year |
|
|
— |
|
|
|
— |
|
|
|
— |
|
|
|
— |
|
|
|
— |
|
|
|
— |
|
|
|
— |
|
|
|
— |
|
|
|
— |
|
|
|
— |
|
Difference in prior year-end fair values and vest date fair values for awards granted in prior years |
|
|
8,698 |
|
|
|
(28,807 |
) |
|
|
(336,920 |
) |
|
|
(296,978 |
) |
|
|
152,537 |
|
|
|
3,703 |
|
|
|
(16,080 |
) |
|
|
(127,515 |
) |
|
|
(28,975 |
) |
|
|
124,567 |
|
Value at last day of prior year for awards forfeited during the current year |
|
|
— |
|
|
|
— |
|
|
|
— |
|
|
|
— |
|
|
|
— |
|
|
|
— |
|
|
|
(107,461 |
) |
|
|
(11,523 |
) |
|
|
— |
|
|
|
— |
|
Total Adjustments for Equity Awards |
|
|
(227,012 |
) |
|
|
(178,830 |
) |
|
|
(420,183 |
) |
|
|
(1,004,552 |
) |
|
|
1,292,293 |
|
|
|
(132,197 |
) |
|
|
(171,952 |
) |
|
|
(423,726 |
) |
|
|
(778,949 |
) |
|
|
947,695 |
|
Compensation Actually Paid |
|
|
1,992,419 |
|
|
|
1,069,578 |
|
|
|
824,527 |
|
|
|
613,314 |
|
|
|
3,040,666 |
|
|
|
929,660 |
|
|
|
462,645 |
|
|
|
273,051 |
|
|
|
90,814 |
|
|
|
2,145,892 |
|
2025: Andrew J. Eaker, Albert P. Carey, Brian D. Moore, and Hongjun Ning.
2024: Andrew J. Eaker, Albert P. Carey, Hongjun Ning, Meredith S. Boyd and Craig A. Creaturo.
2023: Albert P. Carey, Hongjun Ning, Gregory K. Sigmon, Craig A. Creaturo, and Lucas de Carvalho Rocha.
2022: Albert P. Carey, Craig A. Creaturo, Hongjun Ning, and Lucas de Carvalho Rocha.
2021: Thomas H. Caudle, Jr., Albert P. Carey, Craig A. Creaturo, and Hongjun Ning.
The following disclosure regarding executive “compensation actually paid” (“CAP”) and certain Company and peer group financial performance measures for the fiscal years listed below is provided in accordance with rules adopted by the SEC pursuant to the Dodd-Frank Wall Street Reform and Consumer Protection Act of 2010. Please refer to the “Compensation Discussion and Analysis” section for a complete description of how executive compensation relates to Company performance and how the Compensation Committee makes its decisions.
The Company chose the S&P SmallCap 600 Index as the peer group for purposes of Item 201(e) of Regulation S-K in the Company’s Annual Report on Form 10-K for fiscal 2025. The S&P SmallCap 600 Index seeks to measure the small-cap segment of the U.S. equity market, which the Company believes includes companies with characteristics most similar to UNIFI.
|
|
|
|
|
|
|
|
|
|
|
|
|
|
|
|
|
|
|
Value of Initial Fixed $100 Investment Based on: |
|
|
|
|
|
|
|
|
||||||||||
Year |
|
|
Summary Compensation Table Total for PEO |
|
|
|
Compensation Actually Paid to PEO |
|
|
|
Average Summary Compensation Table Total for Non-PEO NEOs |
|
|
|
Average Compensation Actually Paid to Non-PEO NEOs |
|
|
|
Total Shareholder Return |
|
|
Peer Group Total Shareholder Return |
|
|
Net (Loss) Income (in thousands) |
|
|
|
Adjusted EBITDA (in thousands) |
|
|||||||
2025 |
|
|
|
2,219,431 |
|
|
|
|
1,992,419 |
|
|
|
|
1,061,857 |
|
|
|
|
929,660 |
|
|
|
|
44.90 |
|
|
169.09 |
|
|
|
(20,348 |
) |
|
|
|
(11,551 |
) |
2024 |
|
|
|
1,248,408 |
|
|
|
|
1,069,578 |
|
|
|
|
634,597 |
|
|
|
|
462,645 |
|
|
|
|
50.47 |
|
|
164.45 |
|
|
|
(47,395 |
) |
|
|
|
(5,197 |
) |
2023 |
|
|
|
1,244,710 |
|
|
|
|
824,527 |
|
|
|
|
696,777 |
|
|
|
|
273,051 |
|
|
|
|
69.15 |
|
|
154.22 |
|
|
|
(46,344 |
) |
|
|
|
(4,085 |
) |
2022 |
|
|
|
1,617,866 |
|
|
|
|
613,314 |
|
|
|
|
869,763 |
|
|
|
|
90,814 |
|
|
|
|
120.14 |
|
|
144.35 |
|
|
|
15,171 |
|
|
|
|
55,190 |
|
2021 |
|
|
|
1,748,373 |
|
|
|
|
3,040,666 |
|
|
|
|
1,198,197 |
|
|
|
|
2,145,892 |
|
|
|
|
212.08 |
|
|
176.08 |
|
|
|
29,073 |
|
|
|
|
64,643 |
|
2025: Andrew J. Eaker, Albert P. Carey, Brian D. Moore, and Hongjun Ning.
2024: Andrew J. Eaker, Albert P. Carey, Hongjun Ning, Meredith S. Boyd and Craig A. Creaturo.
2023: Albert P. Carey, Hongjun Ning, Gregory K. Sigmon, Craig A. Creaturo, and Lucas de Carvalho Rocha.
2022: Albert P. Carey, Craig A. Creaturo, Hongjun Ning, and Lucas de Carvalho Rocha.
2021: Thomas H. Caudle, Jr., Albert P. Carey, Craig A. Creaturo, and Hongjun Ning.
|
|
PEO |
|
|
Average Non-PEO NEOs |
|
||||||||||||||||||||||||||||||||||
|
|
2025 |
|
|
2024 |
|
|
2023 |
|
|
2022 |
|
|
2021 |
|
|
2025 |
|
|
2024 |
|
|
2023 |
|
|
2022 |
|
|
2021 |
|
||||||||||
Total Compensation from Summary Compensation Table |
|
|
2,219,431 |
|
|
|
1,248,408 |
|
|
|
1,244,710 |
|
|
|
1,617,866 |
|
|
|
1,748,373 |
|
|
|
1,061,857 |
|
|
|
634,597 |
|
|
|
696,777 |
|
|
|
869,763 |
|
|
|
1,198,197 |
|
Adjustments for Equity Awards: |
|
|
|
|
|
|
|
|
|
|
|
|
|
|
|
|
|
|
|
|
|
|
|
|
|
|
|
|
|
|
||||||||||
Grant date values in the Summary Compensation Table |
|
|
(775,283 |
) |
|
|
(387,500 |
) |
|
|
(387,500 |
) |
|
|
(387,500 |
) |
|
|
— |
|
|
|
(472,280 |
) |
|
|
(157,318 |
) |
|
|
(142,500 |
) |
|
|
(162,500 |
) |
|
|
(275,000 |
) |
Year-end fair value for unvested awards granted in the current year |
|
|
575,908 |
|
|
|
342,582 |
|
|
|
376,477 |
|
|
|
229,604 |
|
|
|
— |
|
|
|
352,051 |
|
|
|
141,650 |
|
|
|
138,451 |
|
|
|
100,463 |
|
|
|
511,010 |
|
Year-over-year difference of year-end fair values for unvested awards granted in prior years |
|
|
(36,335 |
) |
|
|
(105,105 |
) |
|
|
(72,240 |
) |
|
|
(549,678 |
) |
|
|
1,139,756 |
|
|
|
(15,671 |
) |
|
|
(32,743 |
) |
|
|
(280,639 |
) |
|
|
(687,937 |
) |
|
|
587,118 |
|
Fair values at vest date for awards granted and vested in the current year |
|
|
— |
|
|
|
— |
|
|
|
— |
|
|
|
— |
|
|
|
— |
|
|
|
— |
|
|
|
— |
|
|
|
— |
|
|
|
— |
|
|
|
— |
|
Difference in prior year-end fair values and vest date fair values for awards granted in prior years |
|
|
8,698 |
|
|
|
(28,807 |
) |
|
|
(336,920 |
) |
|
|
(296,978 |
) |
|
|
152,537 |
|
|
|
3,703 |
|
|
|
(16,080 |
) |
|
|
(127,515 |
) |
|
|
(28,975 |
) |
|
|
124,567 |
|
Value at last day of prior year for awards forfeited during the current year |
|
|
— |
|
|
|
— |
|
|
|
— |
|
|
|
— |
|
|
|
— |
|
|
|
— |
|
|
|
(107,461 |
) |
|
|
(11,523 |
) |
|
|
— |
|
|
|
— |
|
Total Adjustments for Equity Awards |
|
|
(227,012 |
) |
|
|
(178,830 |
) |
|
|
(420,183 |
) |
|
|
(1,004,552 |
) |
|
|
1,292,293 |
|
|
|
(132,197 |
) |
|
|
(171,952 |
) |
|
|
(423,726 |
) |
|
|
(778,949 |
) |
|
|
947,695 |
|
Compensation Actually Paid |
|
|
1,992,419 |
|
|
|
1,069,578 |
|
|
|
824,527 |
|
|
|
613,314 |
|
|
|
3,040,666 |
|
|
|
929,660 |
|
|
|
462,645 |
|
|
|
273,051 |
|
|
|
90,814 |
|
|
|
2,145,892 |
|
 * Value of initial fixed investment of $100
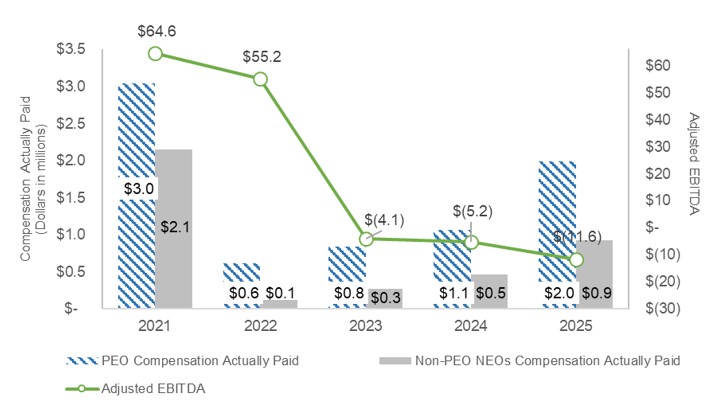
Financial Performance Measures
The Compensation Committee chose Adjusted EBITDA and Asia Adjusted EBITDA as the performance measures for the fiscal 2025 annual incentive compensation plan and Adjusted Free Cash Flow for the performance measure for the performance share units awarded as part of the fiscal 2025 long-term incentive compensation plan. As discussed, due to various unique factors in fiscal 2025, the Compensation Committee determined that the fiscal 2025 annual incentive plan would be adjusted to have a single objective financial performance metric consisting of the sale of the Madison Facility. See “Compensation Discussion and Analysis—Detailed Review of Compensation Components—Annual Incentive Compensation.” Despite that change, the Company has determined that the following financial performance measures remain appropriate to link CAP of the Company’s NEOs in fiscal 2025 to the Company’s performance: