Shareholder Report
Jun. 30, 2025
USD ($)
Holding


Shareholder Report |
6 Months Ended |
|---|---|
|
Jun. 30, 2025
USD ($)
Holding
| |
| Shareholder Report [Line Items] | |
| Document Type | N-CSRS/A |
| Amendment Flag | true |
| Amendment Description | amended |
| Registrant Name | Johnson Mutual Funds Trust |
| Entity Central Index Key | 0000892657 |
| Entity Investment Company Type | N-1A |
| Document Period End Date | Jun. 30, 2025 |
| C000015708 | |
| Shareholder Report [Line Items] | |
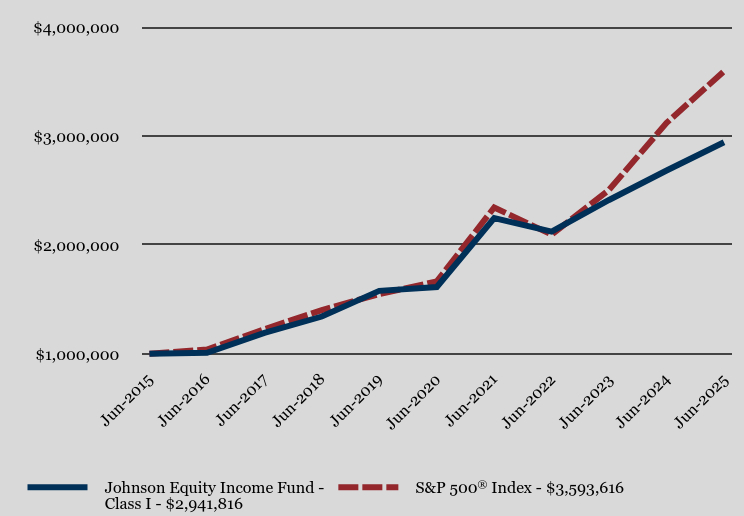
| Fund Name | Johnson Equity Income Fund |
| Class Name | Class I |
| Trading Symbol | JEQIX |
| Annual or Semi-Annual Statement [Text Block] | This semi-annual shareholder report contains important information about Johnson Equity Income Fund (the "Fund") for the period of January 1, 2025 to June 30, 2025. |
| Shareholder Report Annual or Semi-Annual | Semi-Annual Shareholder Report |
| Additional Information [Text Block] | You can find additional information about the Fund at www.johnsoninv.com/mutualfunds. You can also request this information by contacting us at (800) 541-0170. |
| Additional Information Phone Number | (800) 541-0170 |
| Additional Information Website | <span style="font-weight: 700; box-sizing: border-box; color: rgb(0, 0, 0); display: inline; flex-wrap: nowrap; font-size: 10.6667px; grid-area: auto; line-height: 16px; margin: 0px; overflow: visible; text-align: left; text-align-last: left; white-space-collapse: preserve-breaks;">www.johnsoninv.com/mutualfunds</span> |
| Expenses [Text Block] | |
| Expenses Paid, Amount | $ 38 |
| Expense Ratio, Percent | 0.75% |
| Performance Past Does Not Indicate Future [Text] | The Fund's past performance is not a good predictor of how the Fund will perform in the future. |
| Line Graph [Table Text Block] | |
| Average Annual Return [Table Text Block] | |
| No Deduction of Taxes [Text Block] | The graph and table do not reflect the deduction of taxes that a shareholder would pay on fund distributions or redemption of fund shares. |
| AssetsNet | $ 685,708,276 |
| Holdings Count | Holding | 47 |
| Advisory Fees Paid, Amount | $ 2,470,965 |
| InvestmentCompanyPortfolioTurnover | 8.00% |
| Additional Fund Statistics [Text Block] | |
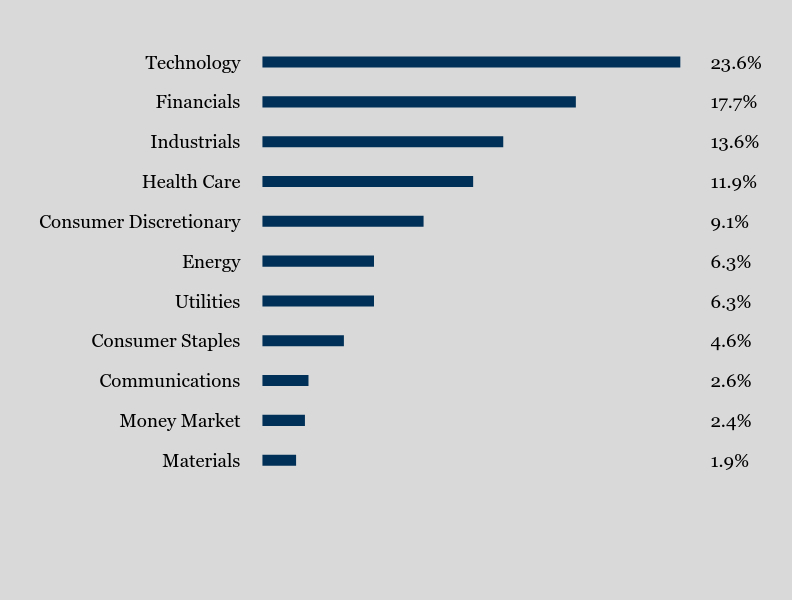
| Holdings [Text Block] | |
| Material Fund Change [Text Block] | |
| C000244749 | |
| Shareholder Report [Line Items] | |
| Fund Name | Johnson Equity Income Fund |
| Class Name | Class S |
| Trading Symbol | JEQSX |
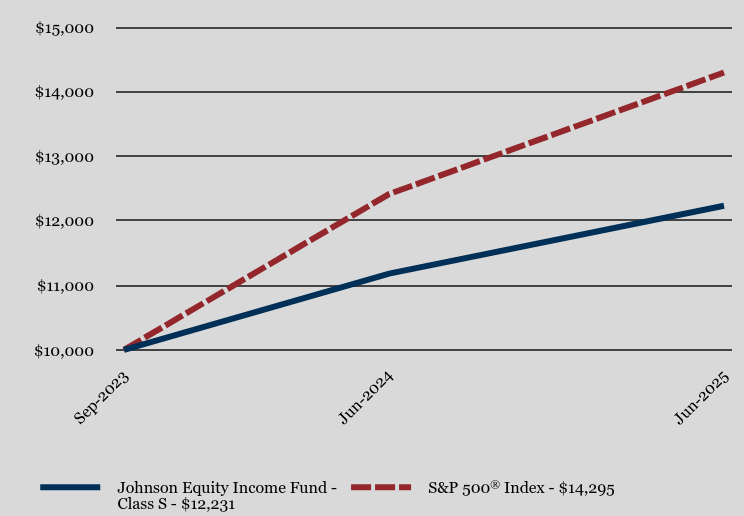
| Annual or Semi-Annual Statement [Text Block] | This semi-annual shareholder report contains important information about Johnson Equity Income Fund (the "Fund") for the period of January 1, 2025 to June 30, 2025. |
| Shareholder Report Annual or Semi-Annual | Semi-Annual Shareholder Report |
| Additional Information [Text Block] | You can find additional information about the Fund at www.johnsoninv.com/mutualfunds. You can also request this information by contacting us at (800) 541-0170. |
| Additional Information Phone Number | (800) 541-0170 |
| Additional Information Website | <span style="font-weight: 700; box-sizing: border-box; color: rgb(0, 0, 0); display: inline; flex-wrap: nowrap; font-size: 10.6667px; grid-area: auto; line-height: 16px; margin: 0px; overflow: visible; text-align: left; text-align-last: left; white-space-collapse: preserve-breaks;">www.johnsoninv.com/mutualfunds</span> |
| Expenses [Text Block] | |
| Expenses Paid, Amount | $ 51 |
| Expense Ratio, Percent | 1.00% |
| Performance Past Does Not Indicate Future [Text] | The Fund's past performance is not a good predictor of how the Fund will perform in the future. |
| Line Graph [Table Text Block] | |
| Average Annual Return [Table Text Block] | |
| Performance Inception Date | Sep. 15, 2023 |
| No Deduction of Taxes [Text Block] | The graph and table do not reflect the deduction of taxes that a shareholder would pay on fund distributions or redemption of fund shares. |
| AssetsNet | $ 685,708,276 |
| Holdings Count | Holding | 47 |
| Advisory Fees Paid, Amount | $ 2,470,965 |
| InvestmentCompanyPortfolioTurnover | 8.00% |
| Additional Fund Statistics [Text Block] | |
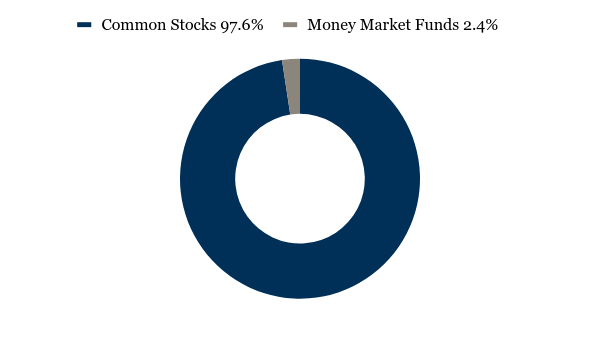
| Holdings [Text Block] | |
| Material Fund Change [Text Block] | |
| C000015712 | |
| Shareholder Report [Line Items] | |
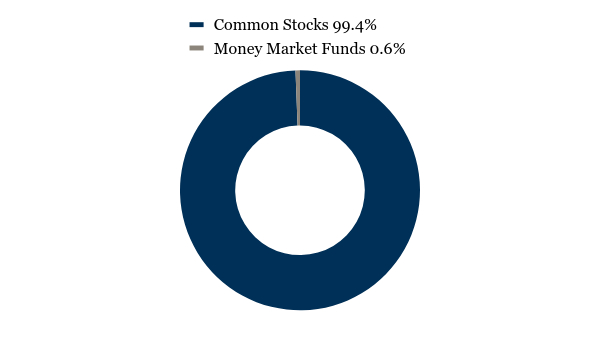
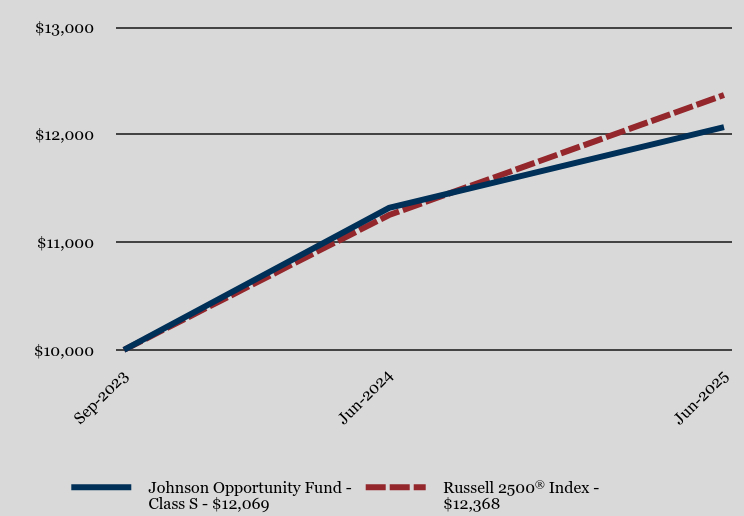
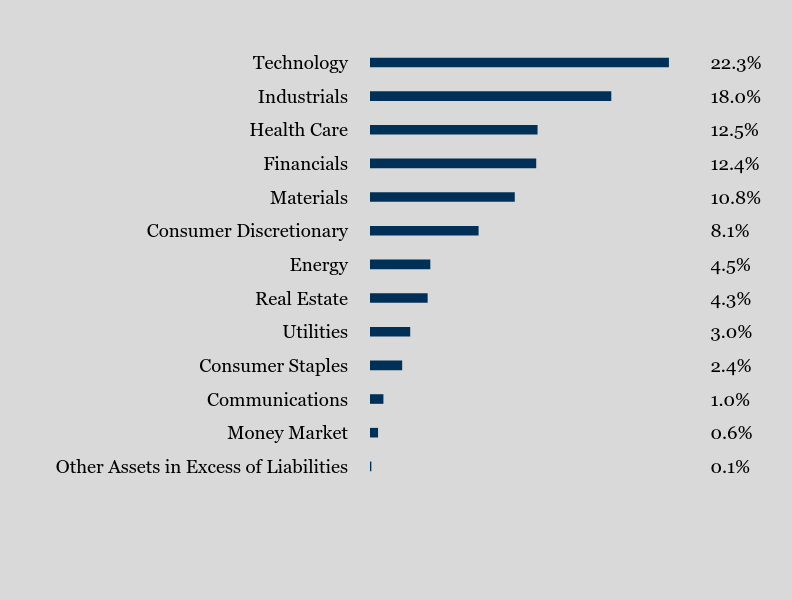
| Fund Name | Johnson Opportunity Fund |
| Class Name | Class I |
| Trading Symbol | JOPPX |
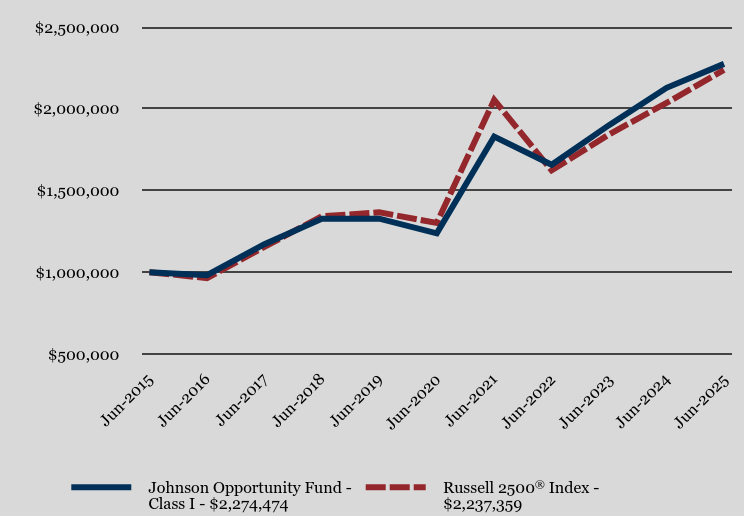
| Annual or Semi-Annual Statement [Text Block] | This semi-annual shareholder report contains important information about Johnson Opportunity Fund (the "Fund") for the period of January 1, 2025 to June 30, 2025. |
| Shareholder Report Annual or Semi-Annual | Semi-Annual Shareholder Report |
| Additional Information [Text Block] | You can find additional information about the Fund at www.johnsoninv.com/mutualfunds. You can also request this information by contacting us at (800) 541-0170. |
| Additional Information Phone Number | (800) 541-0170 |
| Additional Information Website | <span style="font-weight: 700; box-sizing: border-box; color: rgb(0, 0, 0); display: inline; flex-wrap: nowrap; font-size: 10.6667px; grid-area: auto; line-height: 16px; margin: 0px; overflow: visible; text-align: left; text-align-last: left; white-space-collapse: preserve-breaks;">www.johnsoninv.com/mutualfunds</span> |
| Expenses [Text Block] | |
| Expenses Paid, Amount | $ 45 |
| Expense Ratio, Percent | 0.90% |
| Performance Past Does Not Indicate Future [Text] | The Fund's past performance is not a good predictor of how the Fund will perform in the future. |
| Line Graph [Table Text Block] | |
| Average Annual Return [Table Text Block] | |
| No Deduction of Taxes [Text Block] | The graph and table do not reflect the deduction of taxes that a shareholder would pay on fund distributions or redemption of fund shares. |
| AssetsNet | $ 178,398,524 |
| Holdings Count | Holding | 86 |
| Advisory Fees Paid, Amount | $ 760,418 |
| InvestmentCompanyPortfolioTurnover | 13.00% |
| Additional Fund Statistics [Text Block] | |
| Holdings [Text Block] | |
| Material Fund Change [Text Block] | |
| C000244750 | |
| Shareholder Report [Line Items] | |
| Fund Name | Johnson Opportunity Fund |
| Class Name | Class S |
| Trading Symbol | JOSSX |
| Annual or Semi-Annual Statement [Text Block] | This semi-annual shareholder report contains important information about Johnson Opportunity Fund (the "Fund") for the period of January 1, 2025 to June 30, 2025. |
| Shareholder Report Annual or Semi-Annual | Semi-Annual Shareholder Report |
| Additional Information [Text Block] | You can find additional information about the Fund at www.johnsoninv.com/mutualfunds. You can also request this information by contacting us at (800) 541-0170. |
| Additional Information Phone Number | (800) 541-0170 |
| Additional Information Website | <span style="font-weight: 700; box-sizing: border-box; color: rgb(0, 0, 0); display: inline; flex-wrap: nowrap; font-size: 10.6667px; grid-area: auto; line-height: 16px; margin: 0px; overflow: visible; text-align: left; text-align-last: left; white-space-collapse: preserve-breaks;">www.johnsoninv.com/mutualfunds</span> |
| Expenses [Text Block] | |
| Expenses Paid, Amount | $ 57 |
| Expense Ratio, Percent | 1.15% |
| Performance Past Does Not Indicate Future [Text] | The Fund's past performance is not a good predictor of how the Fund will perform in the future. |
| Line Graph [Table Text Block] | |
| Average Annual Return [Table Text Block] | |
| Performance Inception Date | Sep. 15, 2023 |
| No Deduction of Taxes [Text Block] | The graph and table do not reflect the deduction of taxes that a shareholder would pay on fund distributions or redemption of fund shares. |
| AssetsNet | $ 178,398,524 |
| Holdings Count | Holding | 86 |
| Advisory Fees Paid, Amount | $ 760,418 |
| InvestmentCompanyPortfolioTurnover | 13.00% |
| Additional Fund Statistics [Text Block] | |
| Holdings [Text Block] | |
| Material Fund Change [Text Block] | |
| C000071343 | |
| Shareholder Report [Line Items] | |
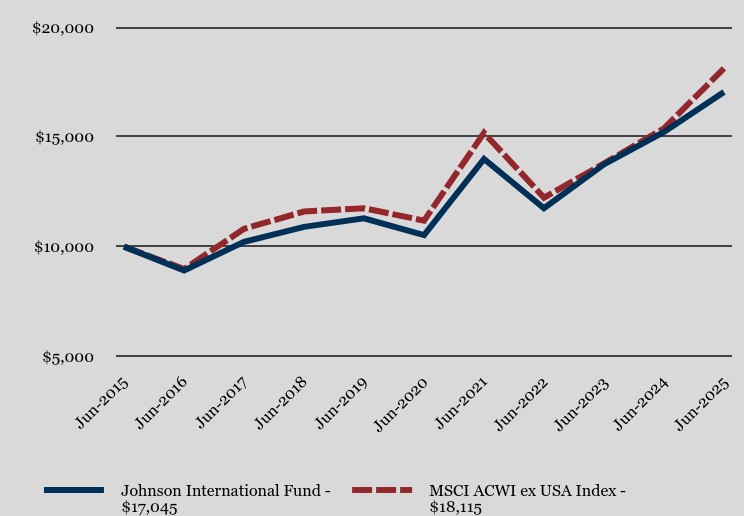
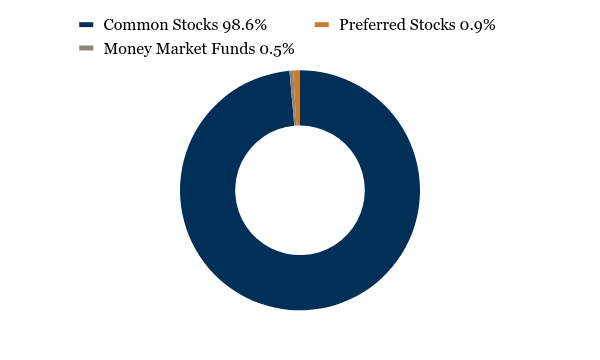
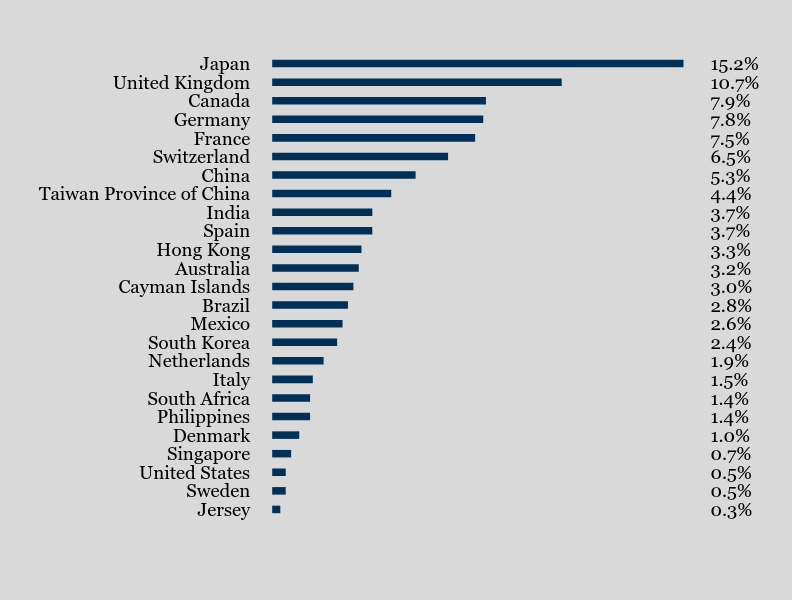
| Fund Name | Johnson International Fund |
| Trading Symbol | JINTX |
| Annual or Semi-Annual Statement [Text Block] | This semi-annual shareholder report contains important information about Johnson International Fund (the "Fund") for the period of January 1, 2025 to June 30, 2025. |
| Shareholder Report Annual or Semi-Annual | Semi-Annual Shareholder Report |
| Additional Information [Text Block] | You can find additional information about the Fund at www.johnsoninv.com/mutualfunds. You can also request this information by contacting us at (800) 541-0170. |
| Material Fund Change Notice [Text Block] | This report describes changes to the Fund that occurred during the reporting period. |
| Additional Information Phone Number | (800) 541-0170 |
| Additional Information Website | <span style="font-weight: 700; box-sizing: border-box; color: rgb(0, 0, 0); display: inline; flex-wrap: nowrap; font-size: 10.6667px; grid-area: auto; line-height: 16px; margin: 0px; overflow: visible; text-align: left; text-align-last: left; white-space-collapse: preserve-breaks;">www.johnsoninv.com/mutualfunds</span> |
| Expenses [Text Block] | |
| Expenses Paid, Amount | $ 54 |
| Expense Ratio, Percent | 1.01% |
| Performance Past Does Not Indicate Future [Text] | The Fund's past performance is not a good predictor of how the Fund will perform in the future. |
| Line Graph [Table Text Block] | |
| Average Annual Return [Table Text Block] | |
| No Deduction of Taxes [Text Block] | The graph and table do not reflect the deduction of taxes that a shareholder would pay on fund distributions or redemption of fund shares. |
| AssetsNet | $ 21,562,272 |
| Holdings Count | Holding | 90 |
| Advisory Fees Paid, Amount | $ 105,207 |
| InvestmentCompanyPortfolioTurnover | 4.00% |
| Additional Fund Statistics [Text Block] | |
| Holdings [Text Block] | |
| Material Fund Change [Text Block] | |
| C000015709 | |
| Shareholder Report [Line Items] | |
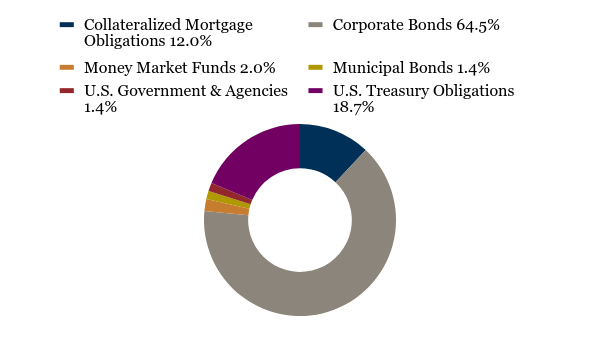
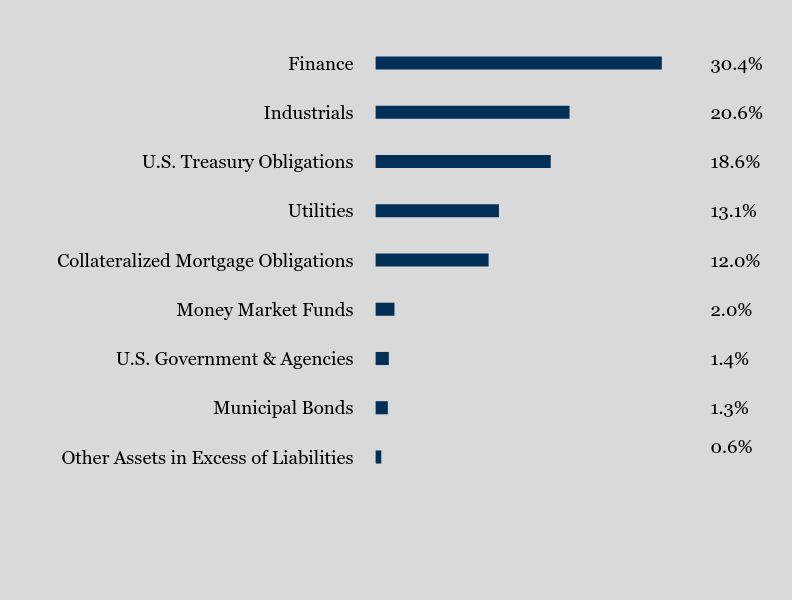
| Fund Name | Johnson Enhanced Return Fund |
| Trading Symbol | JENHX |
| Annual or Semi-Annual Statement [Text Block] | This semi-annual shareholder report contains important information about Johnson Enhanced Return Fund (the "Fund") for the period of January 1, 2025 to June 30, 2025. |
| Shareholder Report Annual or Semi-Annual | Semi-Annual Shareholder Report |
| Additional Information [Text Block] | You can find additional information about the Fund at www.johnsoninv.com/mutualfunds. You can also request this information by contacting us at (800) 541-0170. |
| Additional Information Phone Number | (800) 541-0170 |
| Additional Information Website | <span style="font-weight: 700; box-sizing: border-box; color: rgb(0, 0, 0); display: inline; flex-wrap: nowrap; font-size: 10.6667px; grid-area: auto; line-height: 16px; margin: 0px; overflow: visible; text-align: left; text-align-last: left; white-space-collapse: preserve-breaks;">www.johnsoninv.com/mutualfunds</span> |
| Expenses [Text Block] | |
| Expenses Paid, Amount | $ 18 |
| Expense Ratio, Percent | 0.35% |
| Performance Past Does Not Indicate Future [Text] | The Fund's past performance is not a good predictor of how the Fund will perform in the future. |
| Average Annual Return [Table Text Block] | |
| No Deduction of Taxes [Text Block] | The graph and table do not reflect the deduction of taxes that a shareholder would pay on fund distributions or redemption of fund shares. |
| AssetsNet | $ 280,963,820 |
| Holdings Count | Holding | 102 |
| Advisory Fees Paid, Amount | $ 464,093 |
| InvestmentCompanyPortfolioTurnover | 27.00% |
| Additional Fund Statistics [Text Block] | |
| Holdings [Text Block] | |
| Material Fund Change [Text Block] | |
| C000244751 | |
| Shareholder Report [Line Items] | |
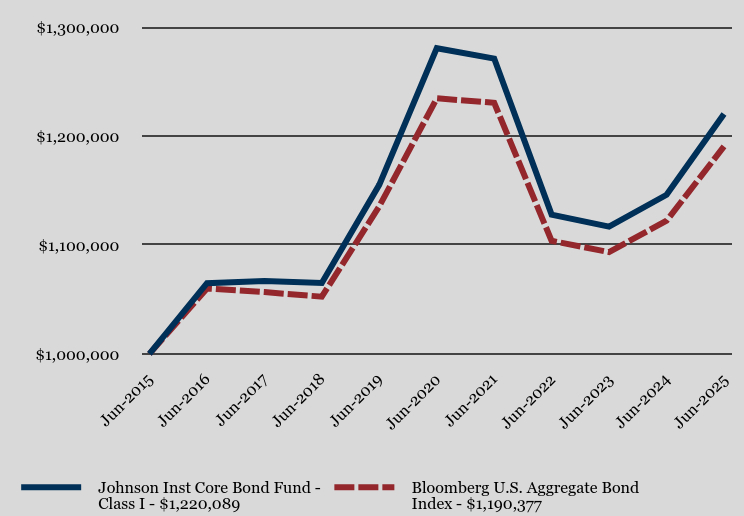
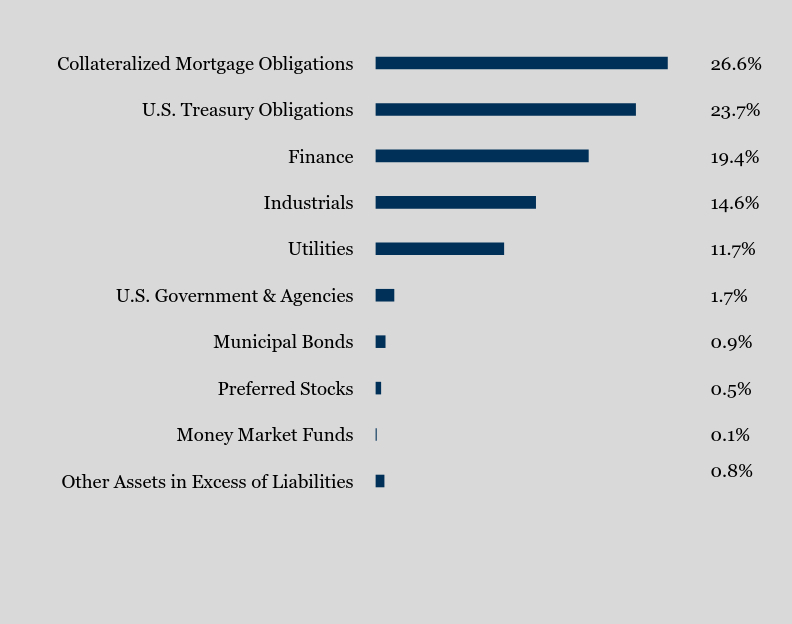
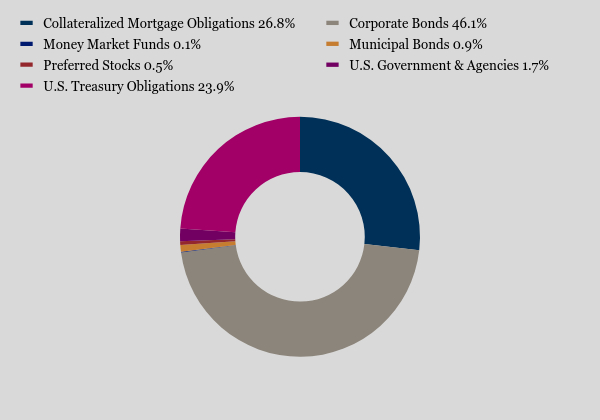
| Fund Name | Johnson Institutional Core Bond Fund |
| Class Name | Class I |
| Trading Symbol | JIBFX |
| Annual or Semi-Annual Statement [Text Block] | This semi-annual shareholder report contains important information about Johnson Institutional Core Bond Fund (the "Fund") for the period of January 1, 2025 to June 30, 2025. |
| Shareholder Report Annual or Semi-Annual | Semi-Annual Shareholder Report |
| Additional Information [Text Block] | You can find additional information about the Fund at www.johnsoninv.com/mutualfunds. You can also request this information by contacting us at (800) 541-0170. |
| Additional Information Phone Number | (800) 541-0170 |
| Additional Information Website | <span style="font-weight: 700; box-sizing: border-box; color: rgb(0, 0, 0); display: inline; flex-wrap: nowrap; font-size: 10.6667px; grid-area: auto; line-height: 16px; margin: 0px; overflow: visible; text-align: left; text-align-last: left; white-space-collapse: preserve-breaks;">www.johnsoninv.com/mutualfunds</span> |
| Expenses [Text Block] | |
| Expenses Paid, Amount | $ 13 |
| Expense Ratio, Percent | 0.25% |
| Performance Past Does Not Indicate Future [Text] | The Fund's past performance is not a good predictor of how the Fund will perform in the future. |
| Line Graph [Table Text Block] | |
| Average Annual Return [Table Text Block] | |
| No Deduction of Taxes [Text Block] | The graph and table do not reflect the deduction of taxes that a shareholder would pay on fund distributions or redemption of fund shares. |
| AssetsNet | $ 1,807,109,735 |
| Holdings Count | Holding | 212 |
| Advisory Fees Paid, Amount | $ 2,229,507 |
| InvestmentCompanyPortfolioTurnover | 8.00% |
| Additional Fund Statistics [Text Block] | |
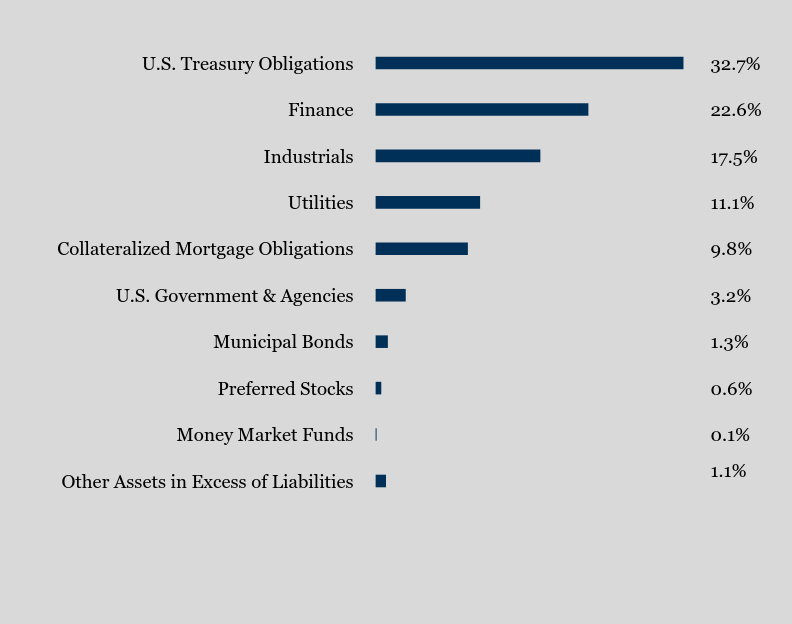
| Holdings [Text Block] | |
| Material Fund Change [Text Block] | |
| C000200604 | |
| Shareholder Report [Line Items] | |
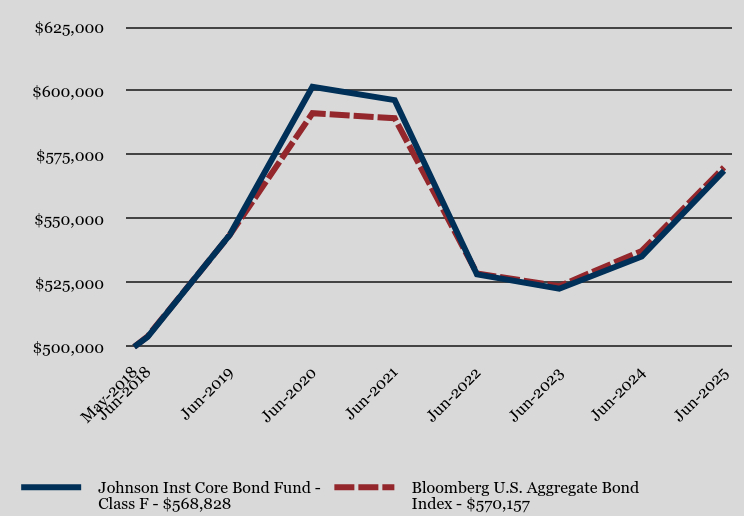
| Fund Name | Johnson Institutional Core Bond Fund |
| Class Name | Class F |
| Trading Symbol | JIMFX |
| Annual or Semi-Annual Statement [Text Block] | This semi-annual shareholder report contains important information about Johnson Institutional Core Bond Fund (the "Fund") for the period of January 1, 2025 to June 30, 2025. |
| Shareholder Report Annual or Semi-Annual | Semi-Annual Shareholder Report |
| Additional Information [Text Block] | You can find additional information about the Fund at www.johnsoninv.com/mutualfunds. You can also request this information by contacting us at (800) 541-0170. |
| Additional Information Phone Number | (800) 541-0170 |
| Additional Information Website | <span style="font-weight: 700; box-sizing: border-box; color: rgb(0, 0, 0); display: inline; flex-wrap: nowrap; font-size: 10.6667px; grid-area: auto; line-height: 16px; margin: 0px; overflow: visible; text-align: left; text-align-last: left; white-space-collapse: preserve-breaks;">www.johnsoninv.com/mutualfunds</span> |
| Expenses [Text Block] | |
| Expenses Paid, Amount | $ 20 |
| Expense Ratio, Percent | 0.40% |
| Performance Past Does Not Indicate Future [Text] | The Fund's past performance is not a good predictor of how the Fund will perform in the future. |
| Line Graph [Table Text Block] | |
| Average Annual Return [Table Text Block] | |
| Performance Inception Date | May 01, 2018 |
| No Deduction of Taxes [Text Block] | The graph and table do not reflect the deduction of taxes that a shareholder would pay on fund distributions or redemption of fund shares. |
| AssetsNet | $ 1,807,109,735 |
| Holdings Count | Holding | 212 |
| Advisory Fees Paid, Amount | $ 2,229,507 |
| InvestmentCompanyPortfolioTurnover | 8.00% |
| Additional Fund Statistics [Text Block] | |
| Holdings [Text Block] | |
| Material Fund Change [Text Block] | |
| C000015718 | |
| Shareholder Report [Line Items] | |
| Fund Name | Johnson Institutional Core Bond Fund |
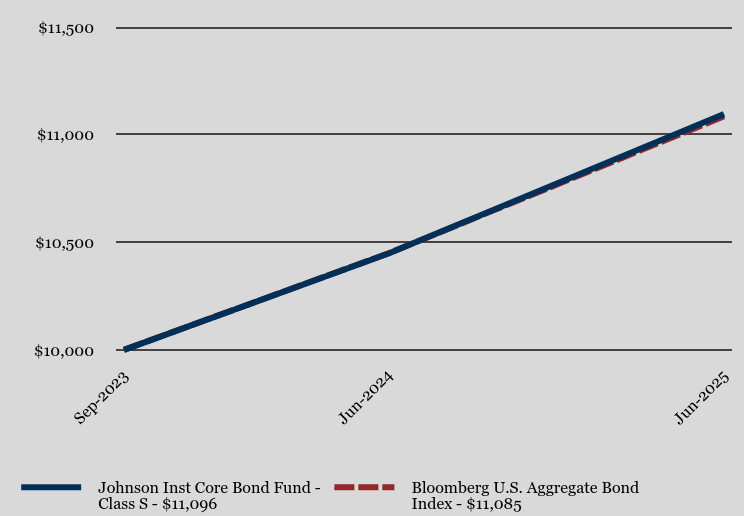
| Class Name | Class S |
| Trading Symbol | JIBSX |
| Annual or Semi-Annual Statement [Text Block] | This semi-annual shareholder report contains important information about Johnson Institutional Core Bond Fund (the "Fund") for the period of January 1, 2025 to June 30, 2025. |
| Shareholder Report Annual or Semi-Annual | Semi-Annual Shareholder Report |
| Additional Information [Text Block] | You can find additional information about the Fund at www.johnsoninv.com/mutualfunds. You can also request this information by contacting us at (800) 541-0170. |
| Additional Information Phone Number | (800) 541-0170 |
| Additional Information Website | <span style="font-weight: 700; box-sizing: border-box; color: rgb(0, 0, 0); display: inline; flex-wrap: nowrap; font-size: 10.6667px; grid-area: auto; line-height: 16px; margin: 0px; overflow: visible; text-align: left; text-align-last: left; white-space-collapse: preserve-breaks;">www.johnsoninv.com/mutualfunds</span> |
| Expenses [Text Block] | |
| Expenses Paid, Amount | $ 25 |
| Expense Ratio, Percent | 0.50% |
| Performance Past Does Not Indicate Future [Text] | The Fund's past performance is not a good predictor of how the Fund will perform in the future. |
| Line Graph [Table Text Block] | |
| Average Annual Return [Table Text Block] | |
| Performance Inception Date | Sep. 15, 2023 |
| No Deduction of Taxes [Text Block] | The graph and table do not reflect the deduction of taxes that a shareholder would pay on fund distributions or redemption of fund shares. |
| AssetsNet | $ 1,807,109,735 |
| Holdings Count | Holding | 212 |
| Advisory Fees Paid, Amount | $ 2,229,507 |
| InvestmentCompanyPortfolioTurnover | 8.00% |
| Additional Fund Statistics [Text Block] | |
| Holdings [Text Block] | |
| Material Fund Change [Text Block] | |
| C000015717 | |
| Shareholder Report [Line Items] | |
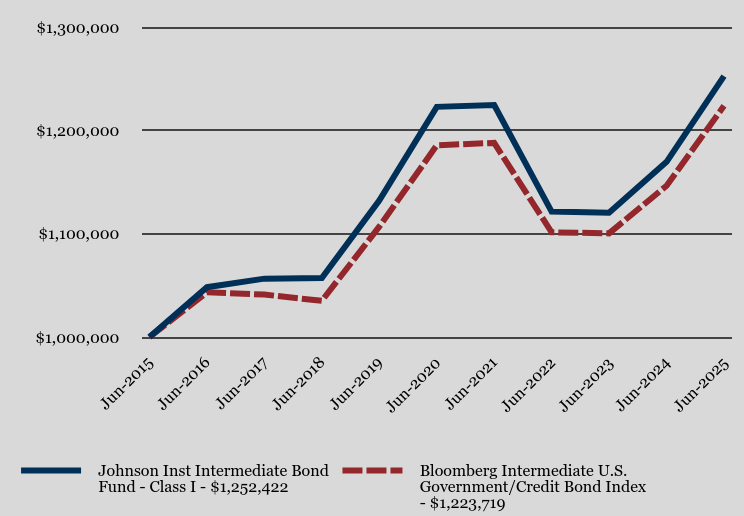
| Fund Name | Johnson Institutional Intermediate Bond Fund |
| Class Name | Class I |
| Trading Symbol | JIBEX |
| Annual or Semi-Annual Statement [Text Block] | This semi-annual shareholder report contains important information about Johnson Institutional Intermediate Bond Fund (the "Fund") for the period of January 1, 2025 to June 30, 2025. |
| Shareholder Report Annual or Semi-Annual | Semi-Annual Shareholder Report |
| Additional Information [Text Block] | You can find additional information about the Fund at www.johnsoninv.com/mutualfunds. You can also request this information by contacting us at (800) 541-0170. |
| Additional Information Phone Number | (800) 541-0170 |
| Additional Information Website | <span style="font-weight: 700; box-sizing: border-box; color: rgb(0, 0, 0); display: inline; flex-wrap: nowrap; font-size: 10.6667px; grid-area: auto; line-height: 16px; margin: 0px; overflow: visible; text-align: left; text-align-last: left; white-space-collapse: preserve-breaks;">www.johnsoninv.com/mutualfunds</span> |
| Expenses [Text Block] | |
| Expenses Paid, Amount | $ 13 |
| Expense Ratio, Percent | 0.25% |
| Performance Past Does Not Indicate Future [Text] | The Fund's past performance is not a good predictor of how the Fund will perform in the future. |
| Line Graph [Table Text Block] | |
| Average Annual Return [Table Text Block] | |
| No Deduction of Taxes [Text Block] | The graph and table do not reflect the deduction of taxes that a shareholder would pay on fund distributions or redemption of fund shares. |
| AssetsNet | $ 254,454,505 |
| Holdings Count | Holding | 84 |
| Advisory Fees Paid, Amount | $ 351,222 |
| InvestmentCompanyPortfolioTurnover | 23.00% |
| Additional Fund Statistics [Text Block] | |
| Holdings [Text Block] | |
| Material Fund Change [Text Block] | |
| C000200603 | |
| Shareholder Report [Line Items] | |
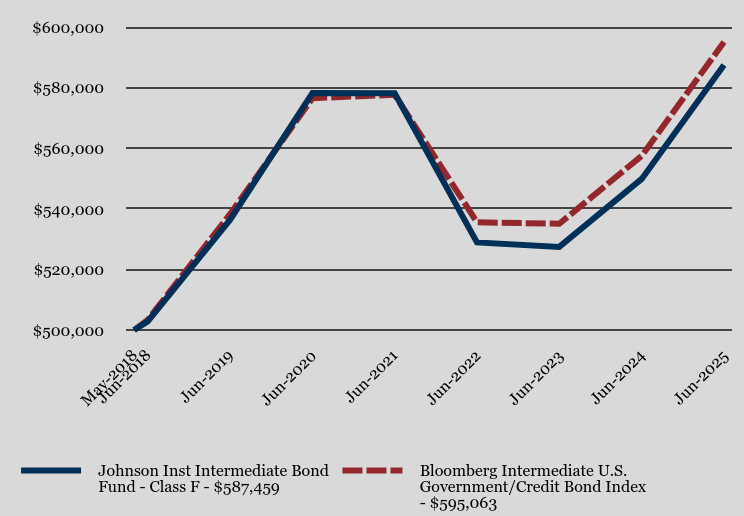
| Fund Name | Johnson Institutional Intermediate Bond Fund |
| Class Name | Class F |
| Trading Symbol | JIMEX |
| Annual or Semi-Annual Statement [Text Block] | This semi-annual shareholder report contains important information about Johnson Institutional Intermediate Bond Fund (the "Fund") for the period of January 1, 2025 to June 30, 2025. |
| Shareholder Report Annual or Semi-Annual | Semi-Annual Shareholder Report |
| Additional Information [Text Block] | You can find additional information about the Fund at www.johnsoninv.com/mutualfunds. You can also request this information by contacting us at (800) 541-0170. |
| Additional Information Phone Number | (800) 541-0170 |
| Additional Information Website | <span style="font-weight: 700; box-sizing: border-box; color: rgb(0, 0, 0); display: inline; flex-wrap: nowrap; font-size: 10.6667px; grid-area: auto; line-height: 16px; margin: 0px; overflow: visible; text-align: left; text-align-last: left; white-space-collapse: preserve-breaks;">www.johnsoninv.com/mutualfunds</span> |
| Expenses [Text Block] | |
| Expenses Paid, Amount | $ 20 |
| Expense Ratio, Percent | 0.40% |
| Performance Past Does Not Indicate Future [Text] | The Fund's past performance is not a good predictor of how the Fund will perform in the future. |
| Line Graph [Table Text Block] | |
| Average Annual Return [Table Text Block] | |
| Performance Inception Date | May 01, 2018 |
| No Deduction of Taxes [Text Block] | The graph and table do not reflect the deduction of taxes that a shareholder would pay on fund distributions or redemption of fund shares. |
| AssetsNet | $ 254,454,505 |
| Holdings Count | Holding | 84 |
| Advisory Fees Paid, Amount | $ 351,222 |
| InvestmentCompanyPortfolioTurnover | 23.00% |
| Additional Fund Statistics [Text Block] | |
| Holdings [Text Block] | |
| Material Fund Change [Text Block] | |
| C000015716 | |
| Shareholder Report [Line Items] | |
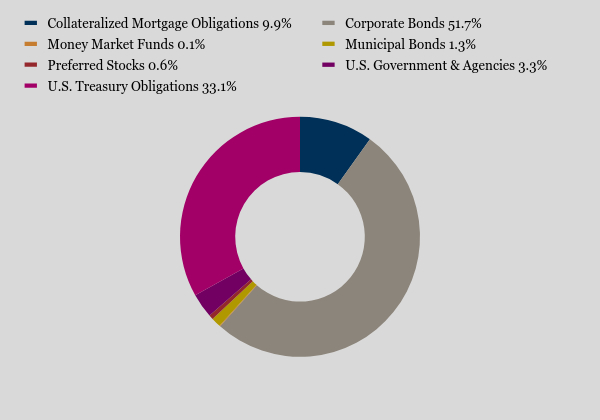
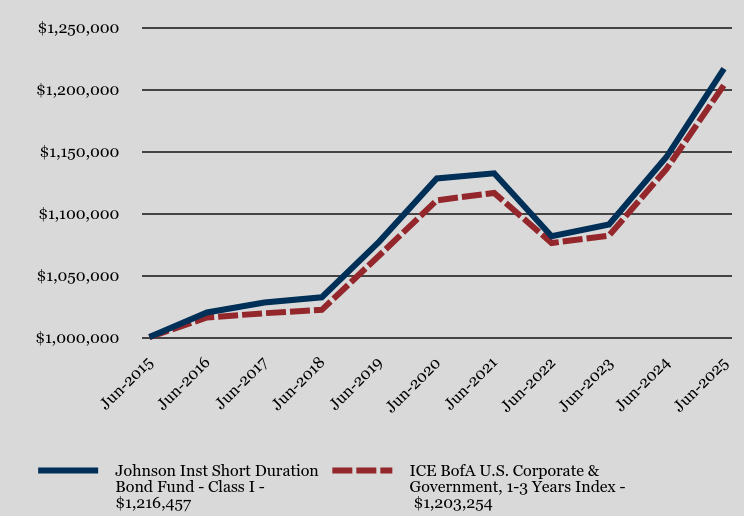
| Fund Name | Johnson Institutional Short Duration Bond Fund |
| Class Name | Class I |
| Trading Symbol | JIBDX |
| Annual or Semi-Annual Statement [Text Block] | This semi-annual shareholder report contains important information about Johnson Institutional Short Duration Bond Fund (the "Fund") for the period of January 1, 2025 to June 30, 2025. |
| Shareholder Report Annual or Semi-Annual | Semi-Annual Shareholder Report |
| Additional Information [Text Block] | You can find additional information about the Fund at www.johnsoninv.com/mutualfunds. You can also request this information by contacting us at (800) 541-0170. |
| Additional Information Phone Number | (800) 541-0170 |
| Additional Information Website | <span style="font-weight: 700; box-sizing: border-box; color: rgb(0, 0, 0); display: inline; flex-wrap: nowrap; font-size: 10.6667px; grid-area: auto; line-height: 16px; margin: 0px; overflow: visible; text-align: left; text-align-last: left; white-space-collapse: preserve-breaks;">www.johnsoninv.com/mutualfunds</span> |
| Expenses [Text Block] | |
| Expenses Paid, Amount | $ 13 |
| Expense Ratio, Percent | 0.25% |
| Performance Past Does Not Indicate Future [Text] | The Fund's past performance is not a good predictor of how the Fund will perform in the future. |
| Line Graph [Table Text Block] | |
| Average Annual Return [Table Text Block] | |
| No Deduction of Taxes [Text Block] | The graph and table do not reflect the deduction of taxes that a shareholder would pay on fund distributions or redemption of fund shares. |
| AssetsNet | $ 191,864,142 |
| Holdings Count | Holding | 91 |
| Advisory Fees Paid, Amount | $ 273,503 |
| InvestmentCompanyPortfolioTurnover | 14.00% |
| Additional Fund Statistics [Text Block] | |
| Holdings [Text Block] | |
| Material Fund Change [Text Block] | |
| C000200602 | |
| Shareholder Report [Line Items] | |
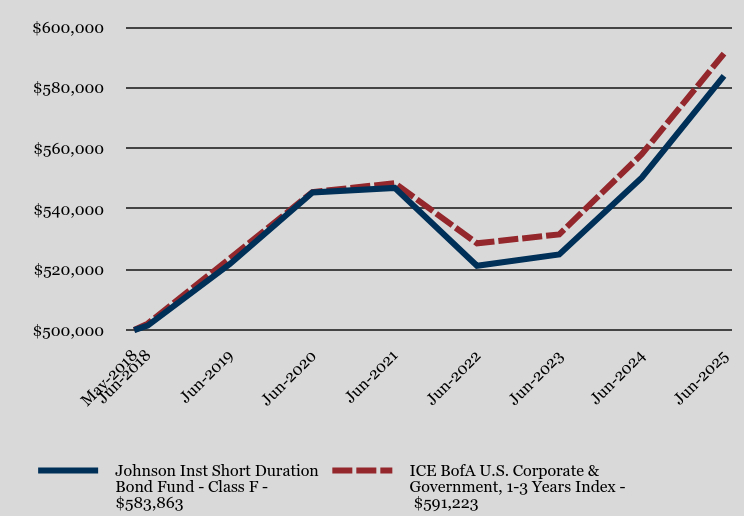
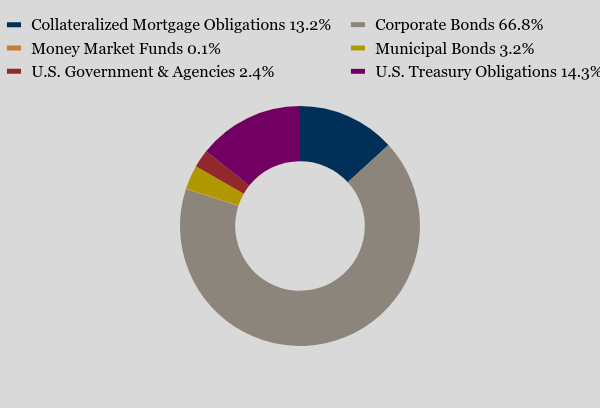
| Fund Name | Johnson Institutional Short Duration Bond Fund |
| Class Name | Class F |
| Trading Symbol | JIMDX |
| Annual or Semi-Annual Statement [Text Block] | This semi-annual shareholder report contains important information about Johnson Institutional Short Duration Bond Fund (the "Fund") for the period of January 1, 2025 to June 30, 2025. |
| Shareholder Report Annual or Semi-Annual | Semi-Annual Shareholder Report |
| Additional Information [Text Block] | You can find additional information about the Fund at www.johnsoninv.com/mutualfunds. You can also request this information by contacting us at (800) 541-0170. |
| Additional Information Phone Number | (800) 541-0170 |
| Additional Information Website | <span style="font-weight: 700; box-sizing: border-box; color: rgb(0, 0, 0); display: inline; flex-wrap: nowrap; font-size: 10.6667px; grid-area: auto; line-height: 16px; margin: 0px; overflow: visible; text-align: left; text-align-last: left; white-space-collapse: preserve-breaks;">www.johnsoninv.com/mutualfunds</span> |
| Expenses [Text Block] | |
| Expenses Paid, Amount | $ 20 |
| Expense Ratio, Percent | 0.40% |
| Performance Past Does Not Indicate Future [Text] | The Fund's past performance is not a good predictor of how the Fund will perform in the future. |
| Line Graph [Table Text Block] | |
| Average Annual Return [Table Text Block] | |
| Performance Inception Date | May 01, 2018 |
| No Deduction of Taxes [Text Block] | The graph and table do not reflect the deduction of taxes that a shareholder would pay on fund distributions or redemption of fund shares. |
| AssetsNet | $ 191,864,142 |
| Holdings Count | Holding | 91 |
| Advisory Fees Paid, Amount | $ 273,503 |
| InvestmentCompanyPortfolioTurnover | 14.00% |
| Additional Fund Statistics [Text Block] | |
| Holdings [Text Block] | |
| Material Fund Change [Text Block] | |
| C000229855 | |
| Shareholder Report [Line Items] | |
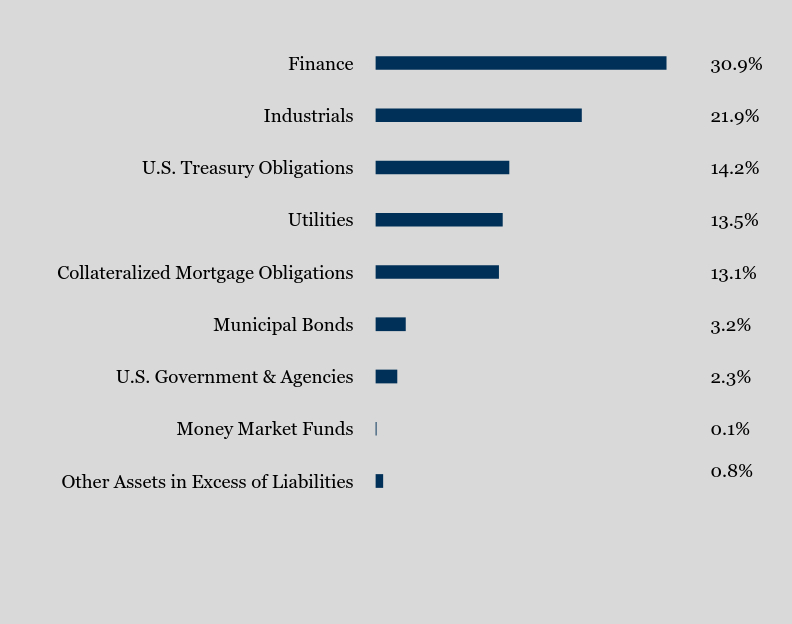
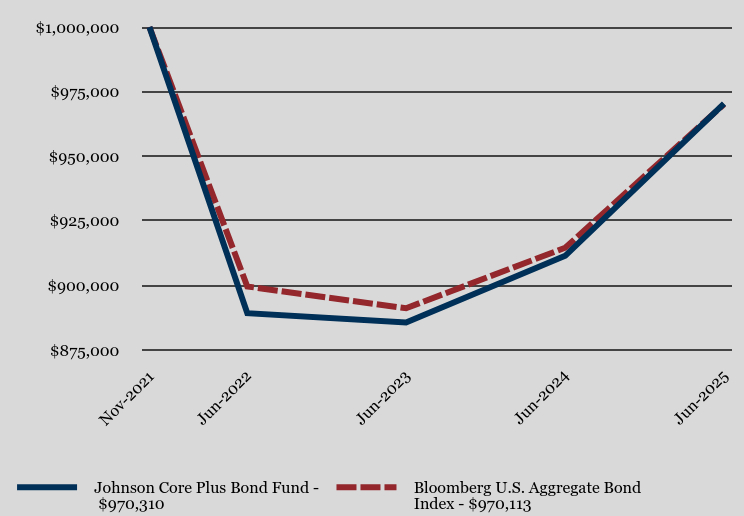
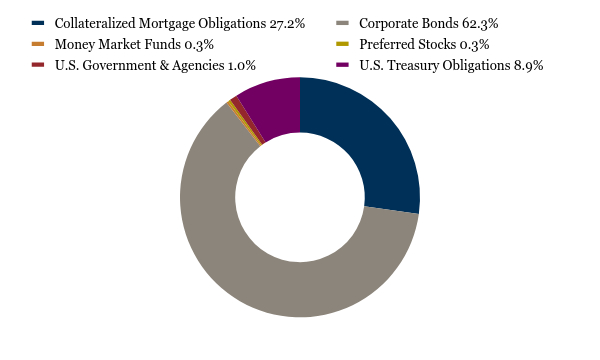
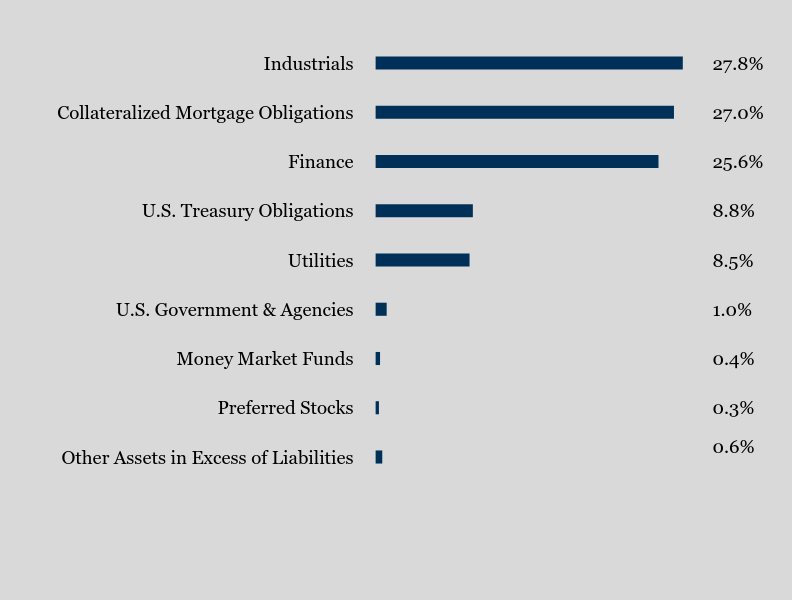
| Fund Name | Johnson Core Plus Bond Fund |
| Trading Symbol | JCPLX |
| Annual or Semi-Annual Statement [Text Block] | This semi-annual shareholder report contains important information about Johnson Core Plus Bond Fund (the "Fund") for the period of January 1, 2025 to June 30, 2025. |
| Shareholder Report Annual or Semi-Annual | Semi-Annual Shareholder Report |
| Additional Information [Text Block] | You can find additional information about the Fund at www.johnsoninv.com/mutualfunds. You can also request this information by contacting us at (800) 541-0170. |
| Additional Information Phone Number | (800) 541-0170 |
| Additional Information Website | <span style="font-weight: 700; box-sizing: border-box; color: rgb(0, 0, 0); display: inline; flex-wrap: nowrap; font-size: 10.6667px; grid-area: auto; line-height: 16px; margin: 0px; overflow: visible; text-align: left; text-align-last: left; white-space-collapse: preserve-breaks;">www.johnsoninv.com/mutualfunds</span> |
| Expenses [Text Block] | |
| Expenses Paid, Amount | $ 23 |
| Expense Ratio, Percent | 0.45% |
| Performance Past Does Not Indicate Future [Text] | The Fund's past performance is not a good predictor of how the Fund will perform in the future. |
| Line Graph [Table Text Block] | |
| Average Annual Return [Table Text Block] | |
| Performance Inception Date | Nov. 17, 2021 |
| No Deduction of Taxes [Text Block] | The graph and table do not reflect the deduction of taxes that a shareholder would pay on fund distributions or redemption of fund shares. |
| AssetsNet | $ 49,121,267 |
| Holdings Count | Holding | 98 |
| Advisory Fees Paid, Amount | $ 106,744 |
| InvestmentCompanyPortfolioTurnover | 18.00% |
| Additional Fund Statistics [Text Block] | |
| Holdings [Text Block] | |
| Material Fund Change [Text Block] | |
| C000015715 | |
| Shareholder Report [Line Items] | |
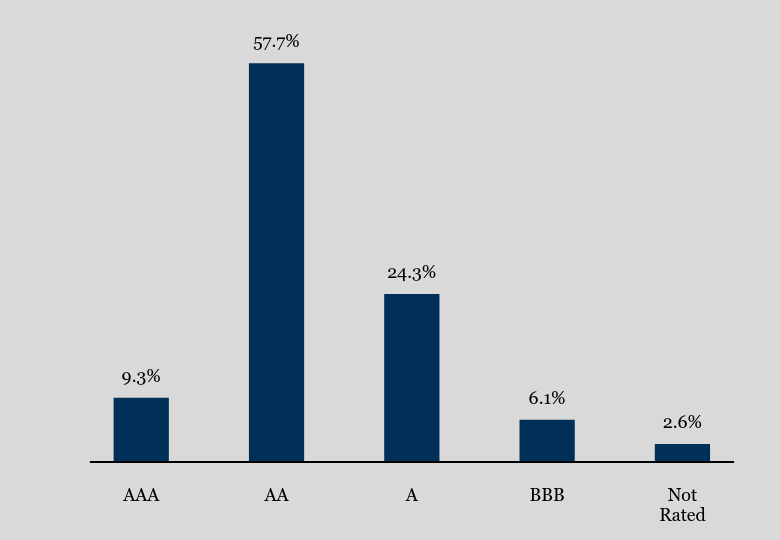
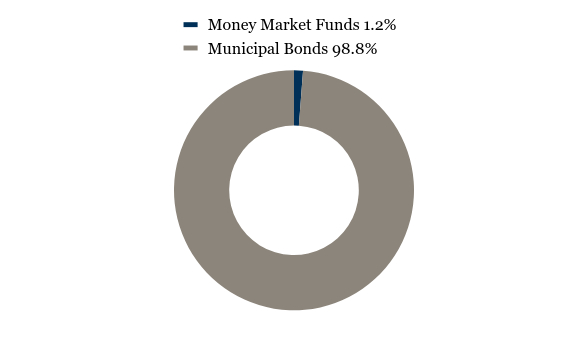
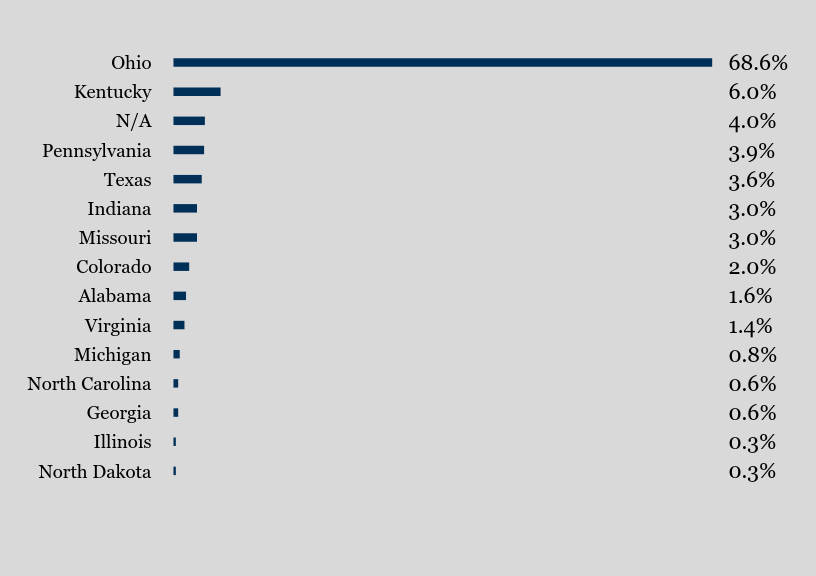
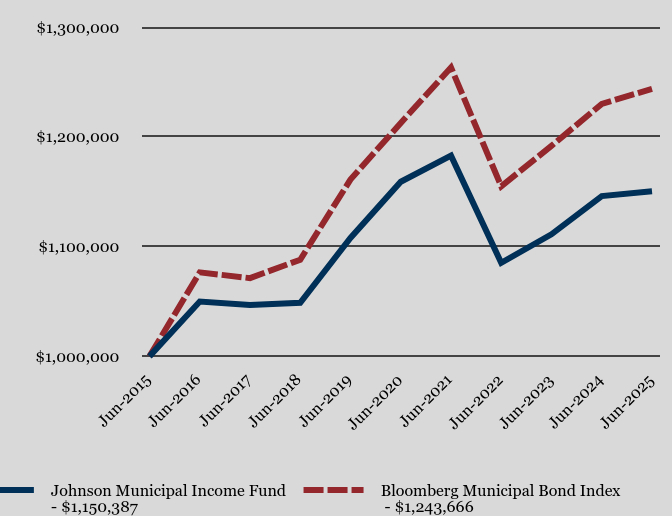
| Fund Name | Johnson Municipal Income Fund |
| Trading Symbol | JMUNX |
| Annual or Semi-Annual Statement [Text Block] | This semi-annual shareholder report contains important information about Johnson Municipal Income Fund (the "Fund") for the period of January 1, 2025 to June 30, 2025. |
| Shareholder Report Annual or Semi-Annual | Semi-Annual Shareholder Report |
| Additional Information [Text Block] | You can find additional information about the Fund at www.johnsoninv.com/mutualfunds. You can also request this information by contacting us at (800) 541-0170. |
| Additional Information Phone Number | (800) 541-0170 |
| Additional Information Website | <span style="font-weight: 700; box-sizing: border-box; color: rgb(0, 0, 0); display: inline; flex-wrap: nowrap; font-size: 12px; grid-area: auto; line-height: 18px; margin: 0px; overflow: visible; text-align: left; text-align-last: left; white-space-collapse: preserve-breaks;">www.johnsoninv.com/mutualfunds</span> |
| Expenses [Text Block] | |
| Expenses Paid, Amount | $ 15 |
| Expense Ratio, Percent | 0.30% |
| Performance Past Does Not Indicate Future [Text] | The Fund's past performance is not a good predictor of how the Fund will perform in the future. |
| Line Graph [Table Text Block] | |
| Average Annual Return [Table Text Block] | |
| No Deduction of Taxes [Text Block] | The graph and table do not reflect the deduction of taxes that a shareholder would pay on fund distributions or redemption of fund shares. |
| AssetsNet | $ 175,687,948 |
| Holdings Count | Holding | 170 |
| Advisory Fees Paid, Amount | $ 257,274 |
| InvestmentCompanyPortfolioTurnover | 15.00% |
| Additional Fund Statistics [Text Block] | |
| Holdings [Text Block] | |
| Material Fund Change [Text Block] |