v3.25.2
Pay vs Performance Disclosure - USD ($)
12 Months Ended
May 31, 2025
May 31, 2024
May 31, 2023
May 31, 2022
May 31, 2021
Pay vs Performance Disclosure          
Pay vs Performance Disclosure, Table

Pay Versus Performance

The following tables provide additional compensation information regarding our NEOs, prepared in accordance with the SEC's pay versus performance disclosure regulations for fiscal years 2025, 2024, 2023, 2022, and 2021.

Pay Versus Performance (PVP) Table


Value of Initial Fixed $100
Investment Based On:


Fiscal Year


Summary
Compensation Table
(SCT) Total for PEO


Compensation Actually Paid (CAP) to PEO(1)


Average SCT Total for Non-PEO NEOs(2)


Average CAP to Non-PEO NEOs(3)


Neogen TSR


S&P MidCap
400 Health
Care Index TSR


Net (Loss) Income
(in millions)


Adjusted EBITDA
(Company
Selected Measure)
(in millions)


2025


$

6,824,891


$

(457,682

)


$

2,241,470


$

90,305


16.5


102.8


$

(1,092.0

)


$

184.2


2024


7,221,352


4,499,416


2,991,286


2,366,175


36.9


109.4


(9.4

)


213.2


2023


5,325,174


4,853,105


1,327,952


1,251,767


49.1


105.5


(20.9

)


205.1


2022


4,315,427


2,315,621


1,220,774


727,779


74.3


110.8


48.3


115.4


2021


2,507,046


4,575,029


714,856


1,226,880


129.6


129.8


60.9


104.2


(1)
Amounts reported reflect CAP for Mr. Adent, as computed in accordance with Item 402(v) of Regulation S-K, for each corresponding year, which amounts do not reflect the actual amount of compensation earned by or paid to Mr. Adent during the applicable year. The adjustments below were made to Mr. Adent’s total compensation for each year to determine the CAP for such year in accordance with the requirements of Item 402(v) of Regulation S-K.

CEO SCT Total to CAP Reconciliation


Fiscal Year


SCT Total


Reported Value of
Equity Awards


Equity Award
Adjustments
(a)


Compensation
Actually Paid


2025


$

6,824,891


$

6,000,000


(1,282,573

)


$

(457,682

)


2024


7,221,352


6,000,000


3,278,064


4,499,416


2023


5,325,174


4,000,000


3,527,931


4,853,105


2022


4,315,427


2,925,547


925,741


2,315,621


2021


2,507,046


1,662,618


3,730,601


4,575,029


a)
The following table details the amounts deducted or added in calculating the equity award adjustments for our CEO, as computed in accordance with Item 402(v). The valuation assumptions used to calculate equity award fair values did not materially differ from those disclosed at the time of grant.

CEO Equity Component of CAP


Fiscal Year


Awards Granted During Current Fiscal Year and Unvested at End of Fiscal Year


Awards Granted in Prior Fiscal Year(s) and Unvested at End of Fiscal Year


Awards Granted in Prior Fiscal Year(s) and Vested During Current Fiscal Year


Equity Adjustment
Included in CAP


2025


$

2,305,639


$

(3,335,247

)


$

(252,965

)


(1,282,573

)


2024


4,787,158


(1,363,377

)


(145,717

)


3,278,064


2023


5,647,124


(1,100,298

)


(1,018,895

)


3,527,931


2022


2,731,035


(1,731,231

)


(74,063

)


925,741


2021


2,658,177


1,029,084


43,340


3,730,601


(1)
Reflects the average amount reported in the “Total” column of the Summary Compensation Table for our other NEOs as a group (excluding Mr. Adent) for each corresponding year. The names of each of the other NEOs (excluding Mr. Adent) included for purposes of calculating the average amounts in each applicable year are as follows: (i) for fiscal years 2025 and 2024, Douglas Jones, David Naemura, and Amy Rocklin; (ii) for fiscal year 2023, Douglas Jones, Steven Quinlan, Jason Lilly, David Naemura, and Amy Rocklin; and (iii) for fiscal year 2022 and fiscal year 2021, Douglas Jones, Steven Quinlan, Jason Lilly, and Jerome Hagedorn.
(2)
Amounts reported reflect CAP for the other NEOs as a group (excluding Mr. Adent), as computed in accordance with Item 402(v) of Regulation S-K, for each corresponding year, which amounts do not reflect an average of the actual amount of compensation earned by or paid to the other NEOs as a group (excluding Mr. Adent) during the applicable fiscal year. The adjustments below were made for each fiscal year to determine the CAP for such fiscal year in accordance with the requirements of Item 402(v) of Regulation S-K.

Average Other NEOs SCT Total to CAP Reconciliation


Fiscal Year


SCT Total


Reported Value of
Equity Awards


Equity Award
Adjustments
(a)


Compensation
Actually Paid


2025


$

2,241,470


$

1,730,333


$

(420,831

)


$

90,305


2024


2,991,286


2,300,000


1,674,889


2,366,175


2023


1,327,952


776,244


725,576


1,251,767


2022


1,220,774


673,894


180,899


727,779


2021


714,856


342,362


854,386


1,226,880


a)
The following table details the amounts deducted or added in calculating the equity award adjustments for our CEO, as computed in accordance with Item 402(v). The valuation assumptions used to calculate equity award fair values did not materially differ from those disclosed at the time of grant.

Average Other NEOs Equity Component of CAP


Fiscal Year


Awards Granted During Current Fiscal Year and Unvested at End of Fiscal Year


Awards Granted in Prior Fiscal Year(s) and Unvested at End of Fiscal Year


Awards Granted in Prior Fiscal Year(s) and Vested During Current Fiscal Year


Equity Adjustment
Included in CAP


2025


$

671,195


$

(1,015,084

)


$

(76,942

)


(420,831

)


2024


1,830,083


(128,113

)


(27,081

)


1,674,889


2023


1,060,429


(224,528

)


(110,326

)


725,576


2022


617,287


(408,559

)


(27,828

)


180,899


2021


530,239


296,954


27,193


854,386


PEO Total Compensation Amount $ 6,824,891 $ 7,221,352 $ 5,325,174 $ 4,315,427 $ 2,507,046
PEO Actually Paid Compensation Amount $ (457,682) 4,499,416 4,853,105 2,315,621 4,575,029
Adjustment To PEO Compensation, Footnote
(1)
Amounts reported reflect CAP for Mr. Adent, as computed in accordance with Item 402(v) of Regulation S-K, for each corresponding year, which amounts do not reflect the actual amount of compensation earned by or paid to Mr. Adent during the applicable year. The adjustments below were made to Mr. Adent’s total compensation for each year to determine the CAP for such year in accordance with the requirements of Item 402(v) of Regulation S-K.
       
Non-PEO NEO Average Total Compensation Amount $ 2,241,470 2,991,286 1,327,952 1,220,774 714,856
Non-PEO NEO Average Compensation Actually Paid Amount $ 90,305 2,366,175 1,251,767 727,779 1,226,880
Adjustment to Non-PEO NEO Compensation Footnote
(1)
Reflects the average amount reported in the “Total” column of the Summary Compensation Table for our other NEOs as a group (excluding Mr. Adent) for each corresponding year. The names of each of the other NEOs (excluding Mr. Adent) included for purposes of calculating the average amounts in each applicable year are as follows: (i) for fiscal years 2025 and 2024, Douglas Jones, David Naemura, and Amy Rocklin; (ii) for fiscal year 2023, Douglas Jones, Steven Quinlan, Jason Lilly, David Naemura, and Amy Rocklin; and (iii) for fiscal year 2022 and fiscal year 2021, Douglas Jones, Steven Quinlan, Jason Lilly, and Jerome Hagedorn.
(2)
Amounts reported reflect CAP for the other NEOs as a group (excluding Mr. Adent), as computed in accordance with Item 402(v) of Regulation S-K, for each corresponding year, which amounts do not reflect an average of the actual amount of compensation earned by or paid to the other NEOs as a group (excluding Mr. Adent) during the applicable fiscal year. The adjustments below were made for each fiscal year to determine the CAP for such fiscal year in accordance with the requirements of Item 402(v) of Regulation S-K.
       
Compensation Actually Paid vs. Total Shareholder Return

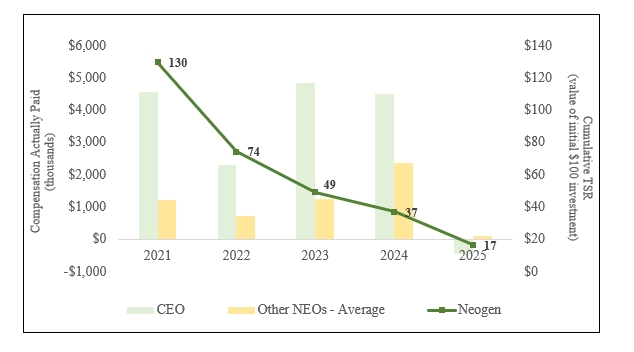
2. Compensation Actually Paid (CAP) versus Neogen TSR

The graph below compares Neogen’s Total Shareholder Return (TSR) to the CEO’s and Other NEOs’ Compensation Actually Paid (CAP) for the five fiscal years beginning with 2021. As shown in the graph, the CAP to the CEO declined in 2022 and increased in 2023 before declining again in 2024 and 2025. CAP to Other NEOs increased in 2023 and 2024, primarily reflecting the completion of the merger with the former 3M Food Safety Division and the resulting increase in size and complexity of the Company, before declining in 2025.

img194661545_16.jpg

       
Compensation Actually Paid vs. Net Income

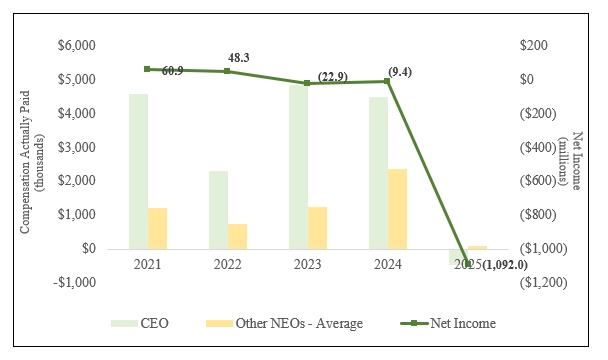
3. CAP versus Net Income

The graph below compares Neogen’s net income to the CEO’s and Other NEOs’ Compensation Actually Paid (CAP) for the five fiscal years beginning with 2021. Net income declined in 2023, primarily as a result of transaction costs, the amortization of acquired intangibles and interest expense incurred on debt related to the merger with the former 3M Food Safety Division. The decline in net income in 2025 was due primarily to a non-cash goodwill impairment charge. CAP to the CEO increased in 2023 before declining in 2024 and 2025, while CAP to Other NEOs increased in 2023 and 2024 before declining in 2025. Neogen does not use net income as a metric in the determination of executive compensation.


img194661545_17.jpg

       
Compensation Actually Paid vs. Company Selected Measure

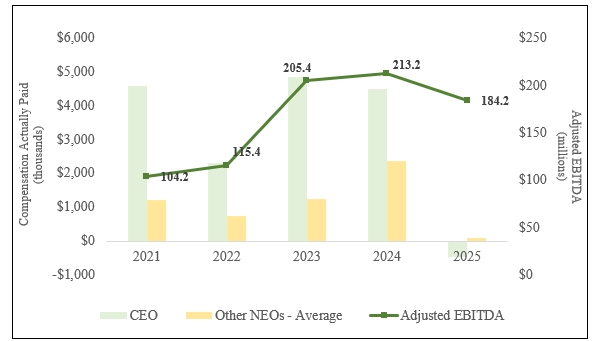
4. CAP versus Adjusted EBITDA (Company Selected Measure)

The graph below compares Neogen’s Adjusted EBITDA to the CEO’s and Other NEOs’ Compensation Actually Paid (CAP) for the five fiscal years beginning with 2021. Management defines Adjusted EBITDA as EBITDA, adjusted for share-based compensation, certain transaction and integration costs and other non-recurring charges. Adjusted EBITDA increased from 2022 to 2024, due primarily to the merger with the former 3M Food Safety Division. In 2025, the decline in Adjusted EBITDA was driven by a combination of end-market weakness, foreign currency headwinds and challenges related to the integration of the former 3M Food Safety Division. CAP to the CEO increased in 2023 before declining in 2024 and 2025, while CAP to Other NEOs increased in 2023 and 2024 before declining in 2025. While the Company uses other financial and non-financial performance measures in its compensation programs, Neogen has determined that Adjusted EBITDA is the most important performance measure used to link CAP to the CEO and Other NEOs in 2025 to the performance of the Company.

img194661545_18.jpg

       
Total Shareholder Return Vs Peer Group

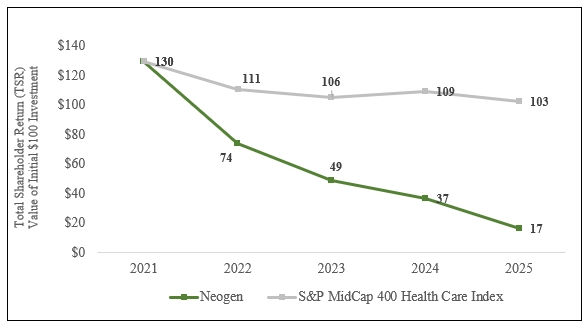
1. Total Shareholder Return (TSR): Neogen versus S&P Midcap 400 Health Care Index

The graph below assumes an initial investment of $100 on May 31, 2020, in Neogen common stock and the S&P MidCap 400 Health Care Index, and assumes dividends, if any, were reinvested. As shown in the graph, Neogen’s TSR has been below the S&P MidCap 400 Health Care Index. The companies included in the S&P MidCap 400 Health Care Index are not the same as those used in our compensation benchmarking.


img194661545_15.jpg

       
Tabular List, Table

List of Most Important Measures

The items listed below represent the most important metrics used to determine CAP for fiscal year 2025 as further described in our Compensation Discussion & Analysis (CD&A) within the sections titled “Incentive Compensation Plan (ICP)” and “Long-Term Incentive (LTI) Compensation:”


Performance Measure

Revenue

Adjusted EBITDA

Free Cash Flow

       
Total Shareholder Return Amount $ 16.5 36.9 49.1 74.3 129.6
Peer Group Total Shareholder Return Amount 102.8 109.4 105.5 110.8 129.8
Net Income (Loss) $ (1,092,000,000) $ (9,400,000) $ (20,900,000) $ 48,300,000 $ 60,900,000
Company Selected Measure Amount 184,200,000 213,200,000 205,100,000 115,400,000 104,200,000
Measure:: 1          
Pay vs Performance Disclosure          
Name Revenue        
PEO | Aggregate Grant Date Fair Value of Equity Award Amounts Reported in Summary Compensation Table          
Pay vs Performance Disclosure          
Adjustment to Compensation, Amount $ (6,000,000) $ (6,000,000) $ (4,000,000) $ (2,925,547) $ (1,662,618)
PEO | Equity Awards Adjustments, Excluding Value Reported in Compensation Table          
Pay vs Performance Disclosure          
Adjustment to Compensation, Amount (1,282,573) 3,278,064 3,527,931 925,741 3,730,601
PEO | Year-end Fair Value of Equity Awards Granted in Covered Year that are Outstanding and Unvested          
Pay vs Performance Disclosure          
Adjustment to Compensation, Amount 2,305,639 4,787,158 5,647,124 2,731,035 2,658,177
PEO | Year-over-Year Change in Fair Value of Equity Awards Granted in Prior Years That are Outstanding and Unvested          
Pay vs Performance Disclosure          
Adjustment to Compensation, Amount (3,335,247) (1,363,377) (1,100,298) (1,731,231) 1,029,084
PEO | Change in Fair Value as of Vesting Date of Prior Year Equity Awards Vested in Covered Year          
Pay vs Performance Disclosure          
Adjustment to Compensation, Amount (252,965) (145,717) (1,018,895) (74,063) 43,340
Non-PEO NEO | Aggregate Grant Date Fair Value of Equity Award Amounts Reported in Summary Compensation Table          
Pay vs Performance Disclosure          
Adjustment to Compensation, Amount 1,730,333 2,300,000 776,244 673,894 342,362
Non-PEO NEO | Equity Awards Adjustments, Excluding Value Reported in Compensation Table          
Pay vs Performance Disclosure          
Adjustment to Compensation, Amount (420,831) 1,674,889 725,576 180,899 854,386
Non-PEO NEO | Year-end Fair Value of Equity Awards Granted in Covered Year that are Outstanding and Unvested          
Pay vs Performance Disclosure          
Adjustment to Compensation, Amount 671,195 1,830,083 1,060,429 617,287 530,239
Non-PEO NEO | Year-over-Year Change in Fair Value of Equity Awards Granted in Prior Years That are Outstanding and Unvested          
Pay vs Performance Disclosure          
Adjustment to Compensation, Amount (1,015,084) (128,113) (224,528) (408,559) 296,954
Non-PEO NEO | Change in Fair Value as of Vesting Date of Prior Year Equity Awards Vested in Covered Year          
Pay vs Performance Disclosure          
Adjustment to Compensation, Amount $ (76,942) $ (27,081) $ (110,326) $ (27,828) $ 27,193