Shareholder Report
|
12 Months Ended |
|
Nov. 30, 2024
USD ($)
Holding
|
|---|
| Shareholder Report [Line Items] |
|
| Document Type |
N-CSR
|
| Amendment Flag |
true
|
| Amendment Description |
Explanatory Note: The Registrant is filing this amendment to its Form N-CSR (the "Amendment") for the period ended November 30, 2024 originally filed with the Securities and Exchange Commission on January 29, 2025 (Accession Number 0000811860-25-000004). The sole purpose of the Amendment is to correct the Renewal of Investment Advisory Contract.
Except as set forth above, the Amendment does not amend, update or change any other items or disclosures found in the Original Filing.
|
| Registrant Name |
SATURNA INVESTMENT TRUST
|
| Entity Central Index Key |
0000811860
|
| Entity Investment Company Type |
N-1A
|
| Document Period End Date |
Nov. 30, 2024
|
| C000065113 |
|
| Shareholder Report [Line Items] |
|
| Fund Name |
Sextant Bond Income Fund
|
| Class Name |
SEXTANT BOND INCOME
|
| Trading Symbol |
SBIFX
|
| Annual or Semi-Annual Statement [Text Block] |
This Annual Shareholder Report contains important information about the Sextant Bond Income Fund for the period of December 1, 2023 to November 30, 2024.
|
| Shareholder Report Annual or Semi-Annual |
Annual Shareholder Report
|
| Additional Information [Text Block] |
You can find additional information about the Fund at www.saturna.com/sextant/bond-income-fund. You can also request this information by contacting us at 1-800-728-8762 or investorservices@saturna.com.
|
| Additional Information Phone Number |
1-800-728-8762
|
| Additional Information Email |
<span style="box-sizing: border-box; color: rgb(68, 68, 68); display: inline; flex-wrap: nowrap; font-size: 10.6667px; font-weight: 400; grid-area: auto; line-height: 16px; margin: 0px; overflow: visible; text-align: left;">investorservices@saturna.com</span>
|
| Additional Information Website |
<span style="box-sizing: border-box; color: rgb(68, 68, 68); display: inline; flex-wrap: nowrap; font-size: 10.6667px; font-weight: 400; grid-area: auto; line-height: 16px; margin: 0px; overflow: visible; text-align: left;">www.saturna.com/sextant/bond-income-fund</span>
|
| Expenses [Text Block] |
What were the Fund’s costs for the last year? (Based on a hypothetical $10,000 investment) Class Name | Cost of a $10,000 Investment | Cost Paid as a % of a $10,000 Investment |
|---|
Sextant Bond Income | $67 | 0.65% |
|---|
|
| Expenses Paid, Amount |
$ 67
|
| Expense Ratio, Percent |
0.65%
|
| Factors Affecting Performance [Text Block] |
How did the Fund perform over the last year? For the fiscal year ended November 30, 2024, the Sextant Bond Income Fund returned 6.73% and the Bloomberg US Aggregate Index returned 6.88%. For the five-year period ended November 30, 2024, the Fund reported an annualized total return of -1.05%, compared to -0.01% for the Bloomberg US Aggregate Index. The primary reason for the Fund’s underperformance was a higher allocation to longer-duration securities relative to the Bloomberg US Aggregate Index. Factors Affecting Past Performance Elevated inflation, an uncertain growth outlook, and a global election cycle made 2024 another volatile year across fixed income markets. Although the Federal Funds Rate was reduced by 100 basis points, the yield curve experienced a pronounced steepening, demonstrating the opposing forces of a weakening labor market, strong output growth, and high inflation expectations. Last December, a steep drop in long-end yields was a large contributor to one-year performance. However, since the beginning of 2024, longer duration was generally a detractor. Together, the portfolio's performance kept pace with the Bloomberg US Aggregate Index, only underperforming by 15 basis points despite the longer duration. Even amid macroeconomic and political uncertainty, corporate debt was well-bid, leading to extensive spread compression across both investment-grade and high-yield debt. Credit-risky debt rallied as investors welcomed the newfound yield, with participants aiming to lock in the higher yield no matter the cost. The Fund maintained a lower weighting to credit-risky debt, instead opting for yield enhancement in other areas of the market. This positioning should help reduce volatility in case the market experiences a risk-off move during 2025. Looking Forward To end the year, politics was top of mind as the United States headed to the polls in November. Along with a new regime comes a new set of opportunities and risks in 2025. As policy becomes clearer, the Sextant Bond Income Fund will remain defensively positioned, ready to take advantage of any new developments. While adaptability is crucial, our goal has always been to choose good companies and invest through cycles rather than engaging in market timing with outsized active bets. |
| Line Graph [Table Text Block] |
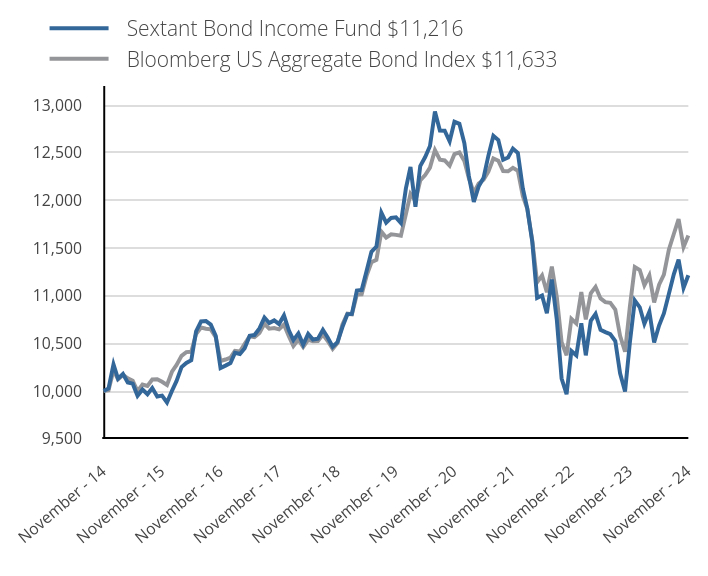 | Sextant Bond Income Fund $11,216 | Bloomberg US Aggregate Bond Index $11,633 |
|---|
November - 14 | 10,000 | 10,000 |
|---|
December - 14 | 10,027 | 10,009 |
|---|
January - 15 | 10,280 | 10,219 |
|---|
February - 15 | 10,131 | 10,123 |
|---|
March - 15 | 10,180 | 10,170 |
|---|
April - 15 | 10,091 | 10,134 |
|---|
May - 15 | 10,078 | 10,109 |
|---|
June - 15 | 9,951 | 9,999 |
|---|
July - 15 | 10,017 | 10,069 |
|---|
August - 15 | 9,967 | 10,054 |
|---|
September - 15 | 10,033 | 10,122 |
|---|
October - 15 | 9,944 | 10,124 |
|---|
November - 15 | 9,953 | 10,097 |
|---|
December - 15 | 9,881 | 10,064 |
|---|
January - 16 | 10,002 | 10,203 |
|---|
February - 16 | 10,106 | 10,275 |
|---|
March - 16 | 10,252 | 10,370 |
|---|
April - 16 | 10,296 | 10,409 |
|---|
May - 16 | 10,323 | 10,412 |
|---|
June - 16 | 10,626 | 10,599 |
|---|
July - 16 | 10,730 | 10,666 |
|---|
August - 16 | 10,734 | 10,654 |
|---|
September - 16 | 10,697 | 10,648 |
|---|
October - 16 | 10,581 | 10,566 |
|---|
November - 16 | 10,242 | 10,316 |
|---|
December - 16 | 10,267 | 10,331 |
|---|
January - 17 | 10,295 | 10,351 |
|---|
February - 17 | 10,401 | 10,421 |
|---|
March - 17 | 10,389 | 10,415 |
|---|
April - 17 | 10,450 | 10,496 |
|---|
May - 17 | 10,581 | 10,576 |
|---|
June - 17 | 10,588 | 10,566 |
|---|
July - 17 | 10,658 | 10,611 |
|---|
August - 17 | 10,770 | 10,706 |
|---|
September - 17 | 10,713 | 10,655 |
|---|
October - 17 | 10,741 | 10,662 |
|---|
November - 17 | 10,704 | 10,648 |
|---|
December - 17 | 10,794 | 10,697 |
|---|
January - 18 | 10,635 | 10,574 |
|---|
February - 18 | 10,535 | 10,473 |
|---|
March - 18 | 10,605 | 10,540 |
|---|
April - 18 | 10,487 | 10,462 |
|---|
May - 18 | 10,600 | 10,537 |
|---|
June - 18 | 10,541 | 10,524 |
|---|
July - 18 | 10,550 | 10,526 |
|---|
August - 18 | 10,643 | 10,594 |
|---|
September - 18 | 10,563 | 10,526 |
|---|
October - 18 | 10,466 | 10,443 |
|---|
November - 18 | 10,514 | 10,505 |
|---|
December - 18 | 10,672 | 10,698 |
|---|
January - 19 | 10,807 | 10,812 |
|---|
February - 19 | 10,810 | 10,805 |
|---|
March - 19 | 11,054 | 11,013 |
|---|
April - 19 | 11,060 | 11,016 |
|---|
May - 19 | 11,263 | 11,211 |
|---|
June - 19 | 11,462 | 11,352 |
|---|
July - 19 | 11,515 | 11,377 |
|---|
August - 19 | 11,872 | 11,672 |
|---|
September - 19 | 11,767 | 11,610 |
|---|
October - 19 | 11,817 | 11,645 |
|---|
November - 19 | 11,823 | 11,639 |
|---|
December - 19 | 11,763 | 11,630 |
|---|
January - 20 | 12,124 | 11,854 |
|---|
February - 20 | 12,351 | 12,068 |
|---|
March - 20 | 11,933 | 11,997 |
|---|
April - 20 | 12,361 | 12,210 |
|---|
May - 20 | 12,455 | 12,267 |
|---|
June - 20 | 12,571 | 12,344 |
|---|
July - 20 | 12,933 | 12,528 |
|---|
August - 20 | 12,733 | 12,427 |
|---|
September - 20 | 12,732 | 12,420 |
|---|
October - 20 | 12,620 | 12,365 |
|---|
November - 20 | 12,825 | 12,486 |
|---|
December - 20 | 12,804 | 12,504 |
|---|
January - 21 | 12,601 | 12,414 |
|---|
February - 21 | 12,258 | 12,235 |
|---|
March - 21 | 11,985 | 12,082 |
|---|
April - 21 | 12,146 | 12,177 |
|---|
May - 21 | 12,239 | 12,217 |
|---|
June - 21 | 12,470 | 12,303 |
|---|
July - 21 | 12,679 | 12,440 |
|---|
August - 21 | 12,634 | 12,417 |
|---|
September - 21 | 12,427 | 12,309 |
|---|
October - 21 | 12,451 | 12,306 |
|---|
November - 21 | 12,544 | 12,342 |
|---|
December - 21 | 12,498 | 12,311 |
|---|
January - 22 | 12,126 | 12,045 |
|---|
February - 22 | 11,914 | 11,911 |
|---|
March - 22 | 11,564 | 11,580 |
|---|
April - 22 | 10,978 | 11,141 |
|---|
May - 22 | 11,003 | 11,213 |
|---|
June - 22 | 10,816 | 11,037 |
|---|
July - 22 | 11,171 | 11,306 |
|---|
August - 22 | 10,748 | 10,987 |
|---|
September - 22 | 10,132 | 10,512 |
|---|
October - 22 | 9,967 | 10,376 |
|---|
November - 22 | 10,420 | 10,758 |
|---|
December - 22 | 10,375 | 10,709 |
|---|
January - 23 | 10,711 | 11,039 |
|---|
February - 23 | 10,375 | 10,753 |
|---|
March - 23 | 10,737 | 11,026 |
|---|
April - 23 | 10,810 | 11,093 |
|---|
May - 23 | 10,643 | 10,972 |
|---|
June - 23 | 10,619 | 10,933 |
|---|
July - 23 | 10,597 | 10,926 |
|---|
August - 23 | 10,526 | 10,856 |
|---|
September - 23 | 10,187 | 10,580 |
|---|
October - 23 | 9,995 | 10,413 |
|---|
November - 23 | 10,509 | 10,884 |
|---|
December - 23 | 10,951 | 11,301 |
|---|
January - 24 | 10,879 | 11,270 |
|---|
February - 24 | 10,707 | 11,111 |
|---|
March - 24 | 10,832 | 11,213 |
|---|
April - 24 | 10,511 | 10,930 |
|---|
May - 24 | 10,688 | 11,116 |
|---|
June - 24 | 10,815 | 11,221 |
|---|
July - 24 | 11,019 | 11,483 |
|---|
August - 24 | 11,225 | 11,648 |
|---|
September - 24 | 11,380 | 11,804 |
|---|
October - 24 | 11,084 | 11,511 |
|---|
November - 24 | 11,216 | 11,633 |
|---|
|
| Average Annual Return [Table Text Block] |
Annual Average Total Return | 1 Year | 5 Year | 10 Year |
|---|
Sextant Bond Income | 6.73% | -1.05% | 1.15% |
|---|
Bloomberg US Aggregate Bond Index
| 6.88% | -0.01% | 1.52% |
|---|
|
| AssetsNet |
$ 11,104,589
|
| Holdings Count | Holding |
45
|
| Advisory Fees Paid, Amount |
$ 31,231
|
| InvestmentCompanyPortfolioTurnover |
4.00%
|
| Additional Fund Statistics [Text Block] |
Total Net Assets | $11,104,589 |
|---|
# of Portfolio Holdings | 45 |
|---|
Advisory Fees Paid | $31,231 |
|---|
Portfolio Turnover Rate | 4% |
|---|
|
| Holdings [Text Block] |
Government | 28.8% | Financials | 10.4% | Technology | 9.8% | Health Care | 9.3% | Industrials | 6.2% | Energy | 5.3% | Consumer Discretionary | 5.3% | Utilities | 4.9% | Consumer Staples | 4.8% | Materials | 4.6% | Other Sectors | 8.2% | Other Assets (net of liabilities) | 2.4% |
|
| Largest Holdings [Text Block] |
United States Treasury Bond (4.250% due 05/15/2039) | 6.9% | United States Treasury Bond (3.375% due 11/15/2048) | 4.2% | United States Treasury Bond (5.375% due 02/15/2031) | 3.9% | Apple (4.500% due 02/23/2036) | 3.2% | Microsoft (4.200% due 11/3/2035) | 3.1% | Intel (4.000% due 12/15/2032) | 3.0% | Home Depot (5.875% due 12/16/2036) | 2.9% | Minnesota Housing Finance Agency (5.925% due 07/1/2049) | 2.8% | Maryland Community Development Administration (5.991% due 09/1/2044) | 2.7% | Burlington Northern Santa Fe (5.050% due 03/1/2041) | 2.7% |
|
| Material Fund Change [Text Block] |
|
| Updated Prospectus Phone Number |
1-800-728-8762
|
| C000065111 |
|
| Shareholder Report [Line Items] |
|
| Fund Name |
Sextant Core Fund
|
| Class Name |
SEXTANT CORE
|
| Trading Symbol |
SCORX
|
| Annual or Semi-Annual Statement [Text Block] |
This Annual Shareholder Report contains important information about the Sextant Core Fund for the period of December 1, 2023 to November 30, 2024.
|
| Shareholder Report Annual or Semi-Annual |
Annual Shareholder Report
|
| Additional Information [Text Block] |
You can find additional information about the Fund at www.saturna.com/sextant/core-fund. You can also request this information by contacting us at 1-800-728-8762 or investorservices@saturna.com.
|
| Additional Information Phone Number |
1-800-728-8762
|
| Additional Information Email |
<span style="box-sizing: border-box; color: rgb(68, 68, 68); display: inline; flex-wrap: nowrap; font-size: 10.6667px; font-weight: 400; grid-area: auto; line-height: 16px; margin: 0px; overflow: visible; text-align: left;">investorservices@saturna.com</span>
|
| Additional Information Website |
<span style="box-sizing: border-box; color: rgb(68, 68, 68); display: inline; flex-wrap: nowrap; font-size: 10.6667px; font-weight: 400; grid-area: auto; line-height: 16px; margin: 0px; overflow: visible; text-align: left;">www.saturna.com/sextant/core-fund</span>
|
| Expenses [Text Block] |
What were the Fund’s costs for the last year? (Based on a hypothetical $10,000 investment) Class Name | Cost of a $10,000 Investment | Cost Paid as a % of a $10,000 Investment |
|---|
Sextant Core | $80 | 0.74% |
|---|
|
| Expenses Paid, Amount |
$ 80
|
| Expense Ratio, Percent |
0.74%
|
| Factors Affecting Performance [Text Block] |
How did the Fund perform over the last year? The Sextant Core Fund returned 16.84% for the fiscal year ended November 30, 2024. The Fund’s benchmark, a 60/40 blend of the S&P Global 1200 Equity Index and the Bloomberg US Aggregate Bond Index returned 18.97% for the same period. At fiscal year-end, the Fund recorded a 30-day yield of 1.08% and reported turnover of 17% for 2024. Factors Affecting Past Performance Equities The Sextant Core Fund’s mandate allocates a 60% weight in equity securities, with two-thirds being US-domiciled companies and one-third foreign-domiciled companies. The Fund generally holds equity positions in larger companies with strong balance sheets. The average market capitalization of positions held by the Fund was $404.2 billion with 20% total debt-to-market capitalization at year-end. The Fund’s 61.75% equity allocation was comprised of 59 positions across 15 countries. Fixed Income The Sextant Core Fund targets an allocation of 40% cash and investment-grade fixed-income securities. During the fiscal year, the Federal Reserve cut interest rate by 75 basis points (bps) from 5.375% at the mid-point to 4.625%. Despite cuts, longer-term treasuries were largely flat on the year, with the 10-year rising 48 bps from the start of easing through the end of fiscal year 2024. Looking Forward The US equity and bond markets ended fiscal 2024 with a buoyant November, driven by expectations that further rate cuts were likely and economic growth remained sturdy. In 2023, we noted that cuts may be in store for 2024, and the reason for those cuts is just as important as the amount. We maintain this view, acknowledging slow and steady cuts driven by cooling inflation should be supportive, whereas rapid cuts due to deteriorating real economic growth would be troubling. Such uncertainty bolsters the value of a 60/40 portfolio, where bonds can provide a ballast and equities a sail. |
| Line Graph [Table Text Block] |
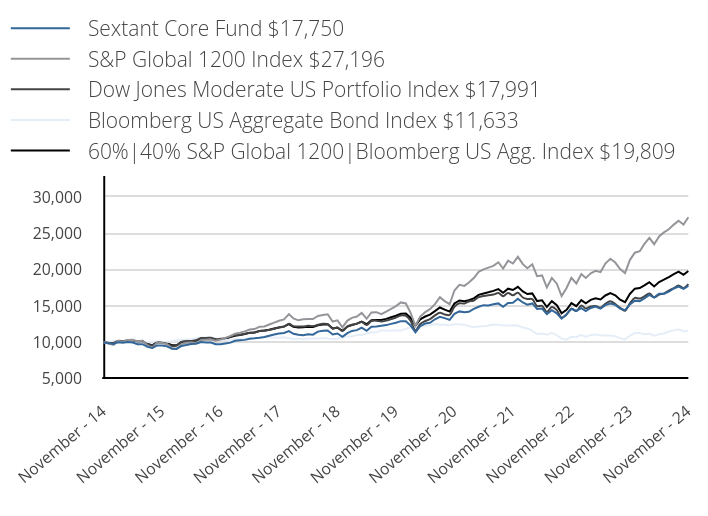 | Sextant Core Fund $17,750 | S&P Global 1200 Index $27,196 | Dow Jones Moderate US Portfolio Index $17,991 | Bloomberg US Aggregate Bond Index $11,633 | 60%|40% S&P Global 1200|Bloomberg US Agg. Index $19,809 |
|---|
November - 14 | 10,000 | 10,000 | 10,000 | 10,000 | 10,000 |
|---|
December - 14 | 9,871 | 9,836 | 9,944 | 10,009 | 9,906 |
|---|
January - 15 | 9,775 | 9,659 | 9,923 | 10,219 | 9,881 |
|---|
February - 15 | 10,016 | 10,209 | 10,198 | 10,123 | 10,182 |
|---|
March - 15 | 9,960 | 10,051 | 10,169 | 10,170 | 10,106 |
|---|
April - 15 | 10,032 | 10,331 | 10,252 | 10,134 | 10,261 |
|---|
May - 15 | 9,968 | 10,356 | 10,247 | 10,109 | 10,266 |
|---|
June - 15 | 9,743 | 10,111 | 10,108 | 9,999 | 10,075 |
|---|
July - 15 | 9,751 | 10,247 | 10,128 | 10,069 | 10,185 |
|---|
August - 15 | 9,381 | 9,579 | 9,776 | 10,054 | 9,780 |
|---|
September - 15 | 9,244 | 9,240 | 9,592 | 10,122 | 9,599 |
|---|
October - 15 | 9,582 | 9,975 | 9,995 | 10,124 | 10,058 |
|---|
November - 15 | 9,562 | 9,924 | 9,950 | 10,097 | 10,017 |
|---|
December - 15 | 9,451 | 9,752 | 9,824 | 10,064 | 9,899 |
|---|
January - 16 | 9,137 | 9,192 | 9,484 | 10,203 | 9,613 |
|---|
February - 16 | 9,103 | 9,129 | 9,544 | 10,275 | 9,600 |
|---|
March - 16 | 9,511 | 9,769 | 10,062 | 10,370 | 10,040 |
|---|
April - 16 | 9,647 | 9,931 | 10,175 | 10,409 | 10,155 |
|---|
May - 16 | 9,766 | 9,977 | 10,193 | 10,412 | 10,184 |
|---|
June - 16 | 9,800 | 9,902 | 10,282 | 10,599 | 10,211 |
|---|
July - 16 | 10,038 | 10,325 | 10,591 | 10,666 | 10,499 |
|---|
August - 16 | 9,995 | 10,361 | 10,594 | 10,654 | 10,516 |
|---|
September - 16 | 9,978 | 10,403 | 10,645 | 10,648 | 10,539 |
|---|
October - 16 | 9,740 | 10,237 | 10,447 | 10,566 | 10,406 |
|---|
November - 16 | 9,732 | 10,372 | 10,487 | 10,316 | 10,390 |
|---|
December - 16 | 9,850 | 10,619 | 10,577 | 10,331 | 10,544 |
|---|
January - 17 | 9,962 | 10,891 | 10,784 | 10,351 | 10,715 |
|---|
February - 17 | 10,221 | 11,186 | 10,996 | 10,421 | 10,918 |
|---|
March - 17 | 10,290 | 11,341 | 11,046 | 10,415 | 11,006 |
|---|
April - 17 | 10,341 | 11,513 | 11,171 | 10,496 | 11,140 |
|---|
May - 17 | 10,497 | 11,765 | 11,303 | 10,576 | 11,321 |
|---|
June - 17 | 10,549 | 11,830 | 11,346 | 10,566 | 11,353 |
|---|
July - 17 | 10,626 | 12,145 | 11,550 | 10,611 | 11,555 |
|---|
August - 17 | 10,730 | 12,183 | 11,603 | 10,706 | 11,618 |
|---|
September - 17 | 10,919 | 12,447 | 11,719 | 10,655 | 11,747 |
|---|
October - 17 | 11,092 | 12,707 | 11,864 | 10,662 | 11,897 |
|---|
November - 17 | 11,207 | 12,960 | 12,057 | 10,648 | 12,033 |
|---|
December - 17 | 11,286 | 13,151 | 12,178 | 10,697 | 12,161 |
|---|
January - 18 | 11,549 | 13,875 | 12,554 | 10,574 | 12,507 |
|---|
February - 18 | 11,181 | 13,298 | 12,229 | 10,473 | 12,148 |
|---|
March - 18 | 11,050 | 13,030 | 12,181 | 10,540 | 12,032 |
|---|
April - 18 | 10,972 | 13,171 | 12,170 | 10,462 | 12,074 |
|---|
May - 18 | 11,111 | 13,221 | 12,267 | 10,537 | 12,136 |
|---|
June - 18 | 11,059 | 13,198 | 12,235 | 10,524 | 12,117 |
|---|
July - 18 | 11,479 | 13,628 | 12,411 | 10,526 | 12,355 |
|---|
August - 18 | 11,610 | 13,765 | 12,552 | 10,594 | 12,462 |
|---|
September - 18 | 11,618 | 13,867 | 12,507 | 10,526 | 12,485 |
|---|
October - 18 | 11,076 | 12,860 | 11,875 | 10,443 | 11,902 |
|---|
November - 18 | 11,216 | 13,027 | 12,024 | 10,505 | 12,023 |
|---|
December - 18 | 10,765 | 12,077 | 11,545 | 10,698 | 11,585 |
|---|
January - 19 | 11,271 | 13,000 | 12,216 | 10,812 | 12,166 |
|---|
February - 19 | 11,572 | 13,369 | 12,425 | 10,805 | 12,370 |
|---|
March - 19 | 11,678 | 13,559 | 12,559 | 11,013 | 12,570 |
|---|
April - 19 | 12,024 | 14,056 | 12,793 | 11,016 | 12,848 |
|---|
May - 19 | 11,581 | 13,246 | 12,386 | 11,211 | 12,495 |
|---|
June - 19 | 12,140 | 14,116 | 12,933 | 11,352 | 13,050 |
|---|
July - 19 | 12,193 | 14,151 | 12,980 | 11,377 | 13,081 |
|---|
August - 19 | 12,273 | 13,887 | 12,855 | 11,672 | 13,070 |
|---|
September - 19 | 12,370 | 14,218 | 12,989 | 11,610 | 13,229 |
|---|
October - 19 | 12,539 | 14,595 | 13,198 | 11,645 | 13,455 |
|---|
November - 19 | 12,689 | 14,977 | 13,410 | 11,639 | 13,664 |
|---|
December - 19 | 12,917 | 15,486 | 13,692 | 11,630 | 13,939 |
|---|
January - 20 | 12,898 | 15,350 | 13,632 | 11,854 | 13,973 |
|---|
February - 20 | 12,315 | 14,093 | 12,990 | 12,068 | 13,387 |
|---|
March - 20 | 11,375 | 12,277 | 11,630 | 11,997 | 12,321 |
|---|
April - 20 | 12,240 | 13,546 | 12,532 | 12,210 | 13,172 |
|---|
May - 20 | 12,588 | 14,155 | 12,935 | 12,267 | 13,552 |
|---|
June - 20 | 12,700 | 14,564 | 13,190 | 12,344 | 13,821 |
|---|
July - 20 | 13,170 | 15,250 | 13,697 | 12,528 | 14,294 |
|---|
August - 20 | 13,509 | 16,213 | 14,071 | 12,427 | 14,790 |
|---|
September - 20 | 13,330 | 15,672 | 13,831 | 12,420 | 14,490 |
|---|
October - 20 | 13,095 | 15,242 | 13,763 | 12,365 | 14,226 |
|---|
November - 20 | 13,923 | 17,133 | 14,888 | 12,486 | 15,341 |
|---|
December - 20 | 14,255 | 17,898 | 15,367 | 12,504 | 15,760 |
|---|
January - 21 | 14,140 | 17,758 | 15,335 | 12,414 | 15,641 |
|---|
February - 21 | 14,207 | 18,214 | 15,612 | 12,235 | 15,792 |
|---|
March - 21 | 14,598 | 18,845 | 15,756 | 12,082 | 16,041 |
|---|
April - 21 | 14,894 | 19,700 | 16,222 | 12,177 | 16,528 |
|---|
May - 21 | 15,113 | 20,033 | 16,378 | 12,217 | 16,718 |
|---|
June - 21 | 15,075 | 20,263 | 16,483 | 12,303 | 16,880 |
|---|
July - 21 | 15,247 | 20,504 | 16,566 | 12,440 | 17,076 |
|---|
August - 21 | 15,351 | 21,008 | 16,791 | 12,417 | 17,314 |
|---|
September - 21 | 14,884 | 20,133 | 16,346 | 12,309 | 16,822 |
|---|
October - 21 | 15,418 | 21,235 | 16,782 | 12,306 | 17,373 |
|---|
November - 21 | 15,447 | 20,831 | 16,460 | 12,342 | 17,195 |
|---|
December - 21 | 15,982 | 21,754 | 16,813 | 12,311 | 17,634 |
|---|
January - 22 | 15,480 | 20,748 | 16,164 | 12,045 | 16,993 |
|---|
February - 22 | 15,175 | 20,195 | 15,957 | 11,911 | 16,645 |
|---|
March - 22 | 15,352 | 20,730 | 15,955 | 11,580 | 16,725 |
|---|
April - 22 | 14,595 | 19,090 | 14,980 | 11,141 | 15,677 |
|---|
May - 22 | 14,644 | 19,201 | 15,021 | 11,213 | 15,772 |
|---|
June - 22 | 13,877 | 17,557 | 14,163 | 11,037 | 14,863 |
|---|
July - 22 | 14,418 | 18,852 | 14,859 | 11,306 | 15,666 |
|---|
August - 22 | 13,995 | 18,065 | 14,432 | 10,987 | 15,097 |
|---|
September - 22 | 13,257 | 16,362 | 13,386 | 10,512 | 13,982 |
|---|
October - 22 | 13,877 | 17,475 | 13,821 | 10,376 | 14,480 |
|---|
November - 22 | 14,624 | 18,877 | 14,629 | 10,758 | 15,390 |
|---|
December - 22 | 14,323 | 18,093 | 14,296 | 10,709 | 14,979 |
|---|
January - 23 | 14,693 | 19,391 | 15,075 | 11,039 | 15,808 |
|---|
February - 23 | 14,303 | 18,841 | 14,656 | 10,753 | 15,375 |
|---|
March - 23 | 14,723 | 19,486 | 14,928 | 11,026 | 15,847 |
|---|
April - 23 | 14,912 | 19,821 | 14,996 | 11,093 | 16,049 |
|---|
May - 23 | 14,643 | 19,653 | 14,762 | 10,972 | 15,898 |
|---|
June - 23 | 15,122 | 20,822 | 15,296 | 10,933 | 16,443 |
|---|
July - 23 | 15,321 | 21,494 | 15,661 | 10,926 | 16,756 |
|---|
August - 23 | 15,152 | 20,969 | 15,265 | 10,856 | 16,468 |
|---|
September - 23 | 14,653 | 20,060 | 14,757 | 10,580 | 15,872 |
|---|
October - 23 | 14,423 | 19,522 | 14,351 | 10,413 | 15,517 |
|---|
November - 23 | 15,192 | 21,308 | 15,350 | 10,884 | 16,650 |
|---|
December - 23 | 15,732 | 22,324 | 16,112 | 11,301 | 17,381 |
|---|
January - 24 | 15,661 | 22,530 | 16,015 | 11,270 | 17,458 |
|---|
February - 24 | 16,046 | 23,529 | 16,322 | 11,111 | 17,824 |
|---|
March - 24 | 16,523 | 24,350 | 16,715 | 11,213 | 18,263 |
|---|
April - 24 | 16,148 | 23,488 | 16,189 | 10,930 | 17,690 |
|---|
May - 24 | 16,675 | 24,564 | 16,585 | 11,116 | 18,296 |
|---|
June - 24 | 16,696 | 25,113 | 16,692 | 11,221 | 18,611 |
|---|
July - 24 | 16,959 | 25,537 | 17,126 | 11,483 | 18,974 |
|---|
August - 24 | 17,406 | 26,179 | 17,440 | 11,648 | 19,369 |
|---|
September - 24 | 17,669 | 26,709 | 17,801 | 11,804 | 19,708 |
|---|
October - 24 | 17,345 | 26,192 | 17,450 | 11,511 | 19,283 |
|---|
November - 24 | 17,750 | 27,196 | 17,991 | 11,633 | 19,809 |
|---|
|
| Average Annual Return [Table Text Block] |
Annual Average Total Return | 1 Year | 5 Year | 10 Year |
|---|
Sextant Core | 16.84% | 6.94% | 5.91% |
|---|
S&P Global 1200 Index
| 27.63% | 12.66% | 10.51% |
|---|
Dow Jones Moderate US Portfolio Index
| 17.20% | 6.05% | 6.04% |
|---|
Bloomberg US Aggregate Bond Index
| 6.88% | -0.01% | 1.52% |
|---|
60%|40% S&P Global 1200|Bloomberg US Agg. Index
| 18.97% | 7.71% | 7.07% |
|---|
|
| AssetsNet |
$ 26,794,132
|
| Holdings Count | Holding |
79
|
| Advisory Fees Paid, Amount |
$ 124,345
|
| InvestmentCompanyPortfolioTurnover |
17.00%
|
| Additional Fund Statistics [Text Block] |
Total Net Assets | $26,794,132 |
|---|
# of Portfolio Holdings | 79 |
|---|
Advisory Fees Paid | $124,345 |
|---|
Portfolio Turnover Rate | 17% |
|---|
|
| Holdings [Text Block] |
Technology | 20.3% | Industrials | 14.9% | Consumer Discretionary | 6.2% | Health Care | 6.0% | Communications | 5.9% | Financials | 5.9% | Utilities | 5.6% | Consumer Staples | 5.2% | Materials | 4.7% | Government | 2.5% | Other Sectors | 3.6% | Other Assets (net of liabilities) | 19.2% |
|
| Largest Holdings [Text Block] |
Eaton | 2.8% | Oracle | 2.2% | Microsoft | 2.1% | Apple | 2.0% | Pacificorp (6.000% due 01/15/2039) | 2.0% | Comcast (5.650% due 06/15/2035) | 2.0% | Agnico-Eagle Mines | 1.9% | Motorola Solutions | 1.9% | Dominion Energy | 1.9% | SAP ADR | 1.9% |
|
| Material Fund Change [Text Block] |
|
| Updated Prospectus Phone Number |
1-800-728-8762
|
| C000112018 |
|
| Shareholder Report [Line Items] |
|
| Fund Name |
Sextant Global High Income Fund
|
| Class Name |
SEXTANT GLOBAL HIGH INCOME FUND
|
| Trading Symbol |
SGHIX
|
| Annual or Semi-Annual Statement [Text Block] |
This Annual Shareholder Report contains important information about the Sextant Global High Income Fund for the period of December 1, 2023 to November 30, 2024.
|
| Shareholder Report Annual or Semi-Annual |
Annual Shareholder Report
|
| Additional Information [Text Block] |
You can find additional information about the Fund at www.saturna.com/sextant/global-high-income-fund. You can also request this information by contacting us at 1-800-728-8762 or investorservices@saturna.com.
|
| Additional Information Phone Number |
1-800-728-8762
|
| Additional Information Email |
<span style="box-sizing: border-box; color: rgb(68, 68, 68); display: inline; flex-wrap: nowrap; font-size: 10.6667px; font-weight: 400; grid-area: auto; line-height: 16px; margin: 0px; overflow: visible; text-align: left;">investorservices@saturna.com</span>
|
| Additional Information Website |
<span style="box-sizing: border-box; color: rgb(68, 68, 68); display: inline; flex-wrap: nowrap; font-size: 10.6667px; font-weight: 400; grid-area: auto; line-height: 16px; margin: 0px; overflow: visible; text-align: left;">www.saturna.com/sextant/global-high-income-fund</span>
|
| Expenses [Text Block] |
What were the Fund’s costs for the last year? (Based on a hypothetical $10,000 investment) Class Name | Cost of a $10,000 Investment | Cost Paid as a % of a $10,000 Investment |
|---|
Sextant Global High Income Fund | $80 | 0.75% |
|---|
|
| Expenses Paid, Amount |
$ 80
|
| Expense Ratio, Percent |
0.75%
|
| Factors Affecting Performance [Text Block] |
How did the Fund perform over the last year? The Sextant Global High Income Fund completed fiscal year ended November 30, 2024 with a total return of 12.42%. The Fund distributed net income amounting to 3.79% of average net assets during the fiscal year. The Fund’s equity benchmark, the S&P Global 1200 Index, returned 27.63%, and the Fund’s fixed income benchmark, the Bloomberg Global High Yield Corporate Bond Index returned 11.88% at fiscal year ended November 30, 2024. Global equity market performance was led by strong returns from large capitalization US stocks, particularly those of technology companies such as semiconductor manufacturers and cloud infrastructure providers that stand to benefit from soaring investment in artificial intelligence. Gradually cooling inflation allowed the Federal Reserve to begin cutting interest rates. As a result of the Fund’s global income objective, it tends to underperform during periods when returns are driven by lower-dividend US stocks — which have led market performance for much of the past decade. With a generally flat yield curve during the fiscal year along with tight credit spreads, the Fund recycled proceeds from maturing bonds and other sources of cash into shorter-term money market securities, reducing sensitivity to longer-term interest rates. Equities Incumbent political parties are being swept out of office throughout the developed world, and the resulting political upheaval creates uncertainty, power vacuums, and opportunities for change — both positive and negative. Trump’s incoming administration will likely be more confrontational than Biden’s, adding uncertainty and risk for investments in non-US companies. Fixed Income With Republicans controlling the three branches of US government, they must balance conservatives’ desires to curb federal spending and narrow the budget deficit with determination to extend past tax cuts and possibly cut other taxes further. Trump’s pledge to impose tariffs adds further uncertainty to their impact on inflation and economic growth. Adding these up, the Fund’s bias will be to limit investment in longer-term bonds until their rates rise further or we develop conviction that an economic slowdown is more likely. |
| Line Graph [Table Text Block] |
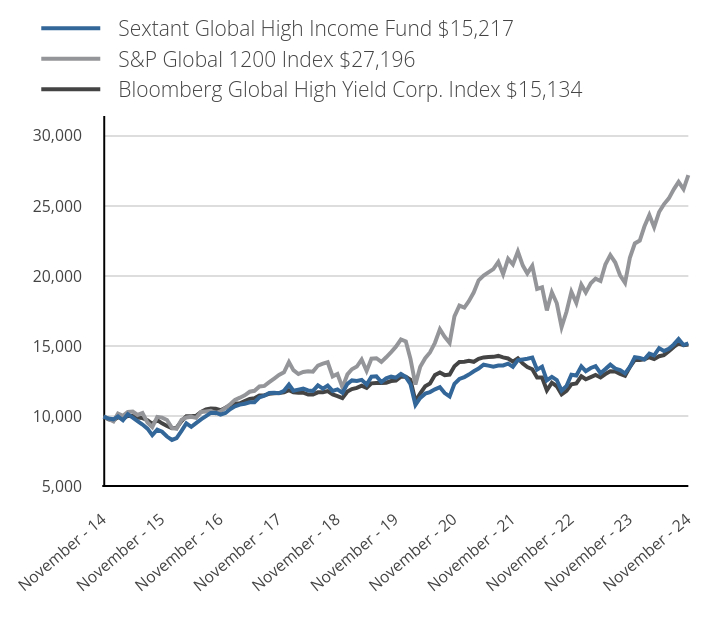 | Sextant Global High Income Fund $15,217 | S&P Global 1200 Index $27,196 | Bloomberg Global High Yield Corp. Index $15,134 |
|---|
November - 14 | 10,000 | 10,000 | 10,000 |
|---|
December - 14 | 9,858 | 9,836 | 9,806 |
|---|
January - 15 | 9,801 | 9,659 | 9,730 |
|---|
February - 15 | 10,009 | 10,209 | 9,960 |
|---|
March - 15 | 9,735 | 10,051 | 9,839 |
|---|
April - 15 | 10,161 | 10,331 | 10,046 |
|---|
May - 15 | 9,924 | 10,356 | 10,041 |
|---|
June - 15 | 9,678 | 10,111 | 9,927 |
|---|
July - 15 | 9,431 | 10,247 | 9,886 |
|---|
August - 15 | 9,137 | 9,579 | 9,742 |
|---|
September - 15 | 8,673 | 9,240 | 9,481 |
|---|
October - 15 | 9,062 | 9,975 | 9,743 |
|---|
November - 15 | 8,916 | 9,924 | 9,514 |
|---|
December - 15 | 8,575 | 9,752 | 9,322 |
|---|
January - 16 | 8,334 | 9,192 | 9,170 |
|---|
February - 16 | 8,465 | 9,129 | 9,197 |
|---|
March - 16 | 8,986 | 9,769 | 9,681 |
|---|
April - 16 | 9,518 | 9,931 | 10,022 |
|---|
May - 16 | 9,267 | 9,977 | 10,021 |
|---|
June - 16 | 9,528 | 9,902 | 10,054 |
|---|
July - 16 | 9,798 | 10,325 | 10,322 |
|---|
August - 16 | 10,029 | 10,361 | 10,514 |
|---|
September - 16 | 10,260 | 10,403 | 10,569 |
|---|
October - 16 | 10,270 | 10,237 | 10,560 |
|---|
November - 16 | 10,139 | 10,372 | 10,450 |
|---|
December - 16 | 10,250 | 10,619 | 10,626 |
|---|
January - 17 | 10,533 | 10,891 | 10,819 |
|---|
February - 17 | 10,722 | 11,186 | 10,936 |
|---|
March - 17 | 10,848 | 11,341 | 10,936 |
|---|
April - 17 | 10,911 | 11,513 | 11,106 |
|---|
May - 17 | 11,016 | 11,765 | 11,259 |
|---|
June - 17 | 11,016 | 11,830 | 11,303 |
|---|
July - 17 | 11,372 | 12,145 | 11,497 |
|---|
August - 17 | 11,487 | 12,183 | 11,522 |
|---|
September - 17 | 11,676 | 12,447 | 11,613 |
|---|
October - 17 | 11,697 | 12,707 | 11,650 |
|---|
November - 17 | 11,661 | 12,960 | 11,676 |
|---|
December - 17 | 11,833 | 13,151 | 11,719 |
|---|
January - 18 | 12,275 | 13,875 | 11,880 |
|---|
February - 18 | 11,833 | 13,298 | 11,728 |
|---|
March - 18 | 11,919 | 13,030 | 11,690 |
|---|
April - 18 | 11,984 | 13,171 | 11,699 |
|---|
May - 18 | 11,855 | 13,221 | 11,566 |
|---|
June - 18 | 11,822 | 13,198 | 11,576 |
|---|
July - 18 | 12,221 | 13,628 | 11,726 |
|---|
August - 18 | 11,984 | 13,765 | 11,737 |
|---|
September - 18 | 12,199 | 13,867 | 11,813 |
|---|
October - 18 | 11,822 | 12,860 | 11,580 |
|---|
November - 18 | 11,930 | 13,027 | 11,460 |
|---|
December - 18 | 11,687 | 12,077 | 11,313 |
|---|
January - 19 | 12,325 | 13,000 | 11,777 |
|---|
February - 19 | 12,571 | 13,369 | 11,958 |
|---|
March - 19 | 12,537 | 13,559 | 12,040 |
|---|
April - 19 | 12,615 | 14,056 | 12,198 |
|---|
May - 19 | 12,280 | 13,246 | 12,036 |
|---|
June - 19 | 12,839 | 14,116 | 12,362 |
|---|
July - 19 | 12,861 | 14,151 | 12,381 |
|---|
August - 19 | 12,459 | 13,887 | 12,381 |
|---|
September - 19 | 12,716 | 14,218 | 12,410 |
|---|
October - 19 | 12,839 | 14,595 | 12,526 |
|---|
November - 19 | 12,772 | 14,977 | 12,565 |
|---|
December - 19 | 13,028 | 15,486 | 12,832 |
|---|
January - 20 | 12,809 | 15,350 | 12,827 |
|---|
February - 20 | 12,299 | 14,093 | 12,619 |
|---|
March - 20 | 10,830 | 12,277 | 11,088 |
|---|
April - 20 | 11,328 | 13,546 | 11,644 |
|---|
May - 20 | 11,632 | 14,155 | 12,147 |
|---|
June - 20 | 11,741 | 14,564 | 12,347 |
|---|
July - 20 | 11,935 | 15,250 | 12,951 |
|---|
August - 20 | 12,093 | 16,213 | 13,132 |
|---|
September - 20 | 11,668 | 15,672 | 12,949 |
|---|
October - 20 | 11,425 | 15,242 | 12,988 |
|---|
November - 20 | 12,324 | 17,133 | 13,582 |
|---|
December - 20 | 12,673 | 17,898 | 13,879 |
|---|
January - 21 | 12,811 | 17,758 | 13,906 |
|---|
February - 21 | 12,987 | 18,214 | 13,973 |
|---|
March - 21 | 13,226 | 18,845 | 13,896 |
|---|
April - 21 | 13,414 | 19,700 | 14,106 |
|---|
May - 21 | 13,691 | 20,033 | 14,208 |
|---|
June - 21 | 13,628 | 20,263 | 14,245 |
|---|
July - 21 | 13,552 | 20,504 | 14,249 |
|---|
August - 21 | 13,628 | 21,008 | 14,317 |
|---|
September - 21 | 13,641 | 20,133 | 14,212 |
|---|
October - 21 | 13,766 | 21,235 | 14,135 |
|---|
November - 21 | 13,540 | 20,831 | 13,914 |
|---|
December - 21 | 14,015 | 21,754 | 14,152 |
|---|
January - 22 | 14,067 | 20,748 | 13,770 |
|---|
February - 22 | 14,118 | 20,195 | 13,528 |
|---|
March - 22 | 14,195 | 20,730 | 13,370 |
|---|
April - 22 | 13,336 | 19,090 | 12,781 |
|---|
May - 22 | 13,554 | 19,201 | 12,785 |
|---|
June - 22 | 12,579 | 17,557 | 11,866 |
|---|
July - 22 | 12,823 | 18,852 | 12,409 |
|---|
August - 22 | 12,592 | 18,065 | 12,156 |
|---|
September - 22 | 11,848 | 16,362 | 11,576 |
|---|
October - 22 | 12,182 | 17,475 | 11,830 |
|---|
November - 22 | 12,977 | 18,877 | 12,297 |
|---|
December - 22 | 12,925 | 18,093 | 12,362 |
|---|
January - 23 | 13,576 | 19,391 | 12,868 |
|---|
February - 23 | 13,231 | 18,841 | 12,656 |
|---|
March - 23 | 13,456 | 19,486 | 12,808 |
|---|
April - 23 | 13,589 | 19,821 | 12,959 |
|---|
May - 23 | 13,085 | 19,653 | 12,783 |
|---|
June - 23 | 13,377 | 20,822 | 13,029 |
|---|
July - 23 | 13,695 | 21,494 | 13,229 |
|---|
August - 23 | 13,416 | 20,969 | 13,208 |
|---|
September - 23 | 13,310 | 20,060 | 13,032 |
|---|
October - 23 | 13,071 | 19,522 | 12,897 |
|---|
November - 23 | 13,536 | 21,308 | 13,527 |
|---|
December - 23 | 14,221 | 22,324 | 14,031 |
|---|
January - 24 | 14,180 | 22,530 | 14,031 |
|---|
February - 24 | 14,069 | 23,529 | 14,078 |
|---|
March - 24 | 14,484 | 24,350 | 14,221 |
|---|
April - 24 | 14,359 | 23,488 | 14,088 |
|---|
May - 24 | 14,871 | 24,564 | 14,298 |
|---|
June - 24 | 14,664 | 25,113 | 14,375 |
|---|
July - 24 | 14,830 | 25,537 | 14,659 |
|---|
August - 24 | 15,134 | 26,179 | 14,962 |
|---|
September - 24 | 15,521 | 26,709 | 15,211 |
|---|
October - 24 | 15,093 | 26,192 | 15,074 |
|---|
November - 24 | 15,217 | 27,196 | 15,134 |
|---|
|
| Average Annual Return [Table Text Block] |
Annual Average Total Return | 1 Year | 5 Year | 10 Year |
|---|
Sextant Global High Income Fund | 12.42% | 3.57% | 4.29% |
|---|
S&P Global 1200 Index
| 27.63% | 12.66% | 10.51% |
|---|
Bloomberg Global High Yield Corp. Index
| 11.88% | 3.79% | 4.23% |
|---|
|
| AssetsNet |
$ 9,543,532
|
| Holdings Count | Holding |
36
|
| Advisory Fees Paid, Amount |
$ 32,336
|
| InvestmentCompanyPortfolioTurnover |
0.00%
|
| Additional Fund Statistics [Text Block] |
Total Net Assets | $9,543,532 |
|---|
# of Portfolio Holdings | 36 |
|---|
Advisory Fees Paid | $32,336 |
|---|
Portfolio Turnover Rate | -% |
|---|
|
| Holdings [Text Block] |
Communications | 15.3% | Materials | 13.1% | Financials | 11.9% | Industrials | 9.4% | Consumer Discretionary | 8.5% | Technology | 6.2% | Health Care | 5.3% | Energy | 5.3% | Government | 3.1% | Consumer Staples | 1.9% | Other Sectors | 0.5% | Other Assets (net of liabilities) | 19.5% |
|
| Largest Holdings [Text Block] |
Southern Copper | 5.3% | Skandinaviska Enskilda Banken, Cl A | 3.6% | ANZ Group Holdings ADR | 3.2% | Cisco Systems | 3.1% | Nintendo | 3.1% | BHP Biliton ADR | 3.1% | Virtu Financial | 3.0% | YUM! Brands (3.625% due 03/15/2031) | 2.8% | SK Telecom ADR | 2.8% | Verizon Communications | 2.8% |
|
| Material Fund Change [Text Block] |
|
| Updated Prospectus Phone Number |
1-800-728-8762
|
| C000012974 |
|
| Shareholder Report [Line Items] |
|
| Fund Name |
Sextant Growth Fund
|
| Class Name |
INVESTOR SHARES
|
| Trading Symbol |
SSGFX
|
| Annual or Semi-Annual Statement [Text Block] |
This Annual Shareholder Report contains important information about the Sextant Growth Fund for the period of December 1, 2023 to November 30, 2024.
|
| Shareholder Report Annual or Semi-Annual |
Annual Shareholder Report
|
| Additional Information [Text Block] |
You can find additional information about the Fund at www.saturna.com/sextant/growth-fund. You can also request this information by contacting us at 1-800-728-8762 or investorservices@saturna.com.
|
| Additional Information Phone Number |
1-800-728-8762
|
| Additional Information Email |
<span style="box-sizing: border-box; color: rgb(68, 68, 68); display: inline; flex-wrap: nowrap; font-size: 10.6667px; font-weight: 400; grid-area: auto; line-height: 16px; margin: 0px; overflow: visible; text-align: left;">investorservices@saturna.com</span>
|
| Additional Information Website |
<span style="box-sizing: border-box; color: rgb(68, 68, 68); display: inline; flex-wrap: nowrap; font-size: 10.6667px; font-weight: 400; grid-area: auto; line-height: 16px; margin: 0px; overflow: visible; text-align: left;">www.saturna.com/sextant/growth-fund</span>
|
| Expenses [Text Block] |
What were the Fund’s costs for the last year? (Based on a hypothetical $10,000 investment) Class Name | Cost of a $10,000 Investment | Cost Paid as a % of a $10,000 Investment |
|---|
Investor Shares | $111 | 0.96% |
|---|
|
| Expenses Paid, Amount |
$ 111
|
| Expense Ratio, Percent |
0.96%
|
| Factors Affecting Performance [Text Block] |
How did the Fund perform over the last year? For the fiscal year ended November 30, 2024, Sextant Growth Fund Investor Shares returned 30.23%, trailing the 33.89% return for the S&P 500 Index for the same period. As was the case in the previous fiscal year, the Fund returns suffered in comparison to the S&P 500 Index due to a handful of mega-cap Technology and artificial intelligence (AI) related stocks driving Index returns. What Factors Influenced Performance? Similarly to 2023, Nvidia was the dominant contributor to Index returns as other mega-cap stocks jumped on the AI/data center/large language model bandwagon. The Fund holds a position in Nvidia, but the benchmark weight is more than double the Fund’s exposure. We hold positions in Alphabet, Amazon, Apple, Meta Platforms, and Microsoft as well — all the Magnificent Seven stocks except Tesla — but typically at lower exposures than represented in the benchmarks. That said, Fund performance was boosted by several holdings not included among the mega-caps. These include Broadcom, Oracle, and ServiceNow in Technology, Boston Scientific in Health Care, and Motorola Solutions in Communications. The aforementioned stocks all appreciated by at least 50% over the course of the year. Other strong performers included Costco, Johnson Controls, and TJX. Portfolio returns were diminished by declines in the value of Adobe, Lululemon, Advanced Micro Devices, and Zoetis. As long-term investors, our interpretation of the long-term operational thesis behind an investment matters more than any short-term period of weakness. Looking Forward The US economy currently enjoys solid positive momentum, which is likely to continue well into the new year. While the new administration appears determined to implement a wide range of policy initiatives that will depart significantly from the past, executing on the changes will take time — as it will for the effects to be felt. Stock markets discount expectations well before the realities resonate in the economy or corporate earnings so we are reliant on the market’s interpretation of the mix of policy prescriptions. Following the pre-Christmas fiscal gymnastics, it appears that adopting a long-term government funding solution will be the first challenge, one likely to feature a plethora of political pyrotechnics. |
| Line Graph [Table Text Block] |
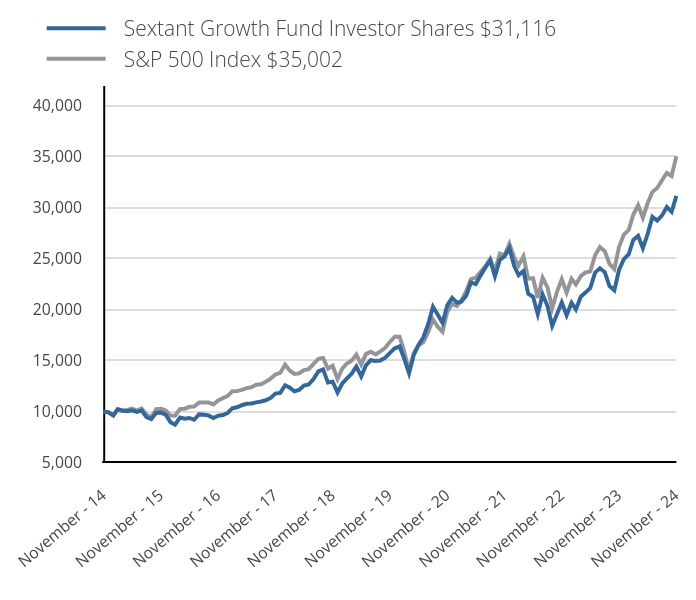 | Sextant Growth Fund Investor Shares $31,116 | S&P 500 Index $35,002 |
|---|
November - 14 | 10,000 | 10,000 |
|---|
December - 14 | 9,928 | 9,975 |
|---|
January - 15 | 9,613 | 9,675 |
|---|
February - 15 | 10,235 | 10,231 |
|---|
March - 15 | 10,118 | 10,070 |
|---|
April - 15 | 10,038 | 10,166 |
|---|
May - 15 | 10,125 | 10,297 |
|---|
June - 15 | 9,973 | 10,098 |
|---|
July - 15 | 10,110 | 10,309 |
|---|
August - 15 | 9,469 | 9,687 |
|---|
September - 15 | 9,268 | 9,447 |
|---|
October - 15 | 9,875 | 10,244 |
|---|
November - 15 | 9,913 | 10,275 |
|---|
December - 15 | 9,715 | 10,113 |
|---|
January - 16 | 8,972 | 9,611 |
|---|
February - 16 | 8,729 | 9,598 |
|---|
March - 16 | 9,418 | 10,249 |
|---|
April - 16 | 9,302 | 10,289 |
|---|
May - 16 | 9,385 | 10,474 |
|---|
June - 16 | 9,207 | 10,501 |
|---|
July - 16 | 9,731 | 10,888 |
|---|
August - 16 | 9,686 | 10,903 |
|---|
September - 16 | 9,636 | 10,905 |
|---|
October - 16 | 9,372 | 10,706 |
|---|
November - 16 | 9,594 | 11,103 |
|---|
December - 16 | 9,670 | 11,322 |
|---|
January - 17 | 9,893 | 11,537 |
|---|
February - 17 | 10,325 | 11,995 |
|---|
March - 17 | 10,423 | 12,009 |
|---|
April - 17 | 10,632 | 12,132 |
|---|
May - 17 | 10,765 | 12,303 |
|---|
June - 17 | 10,799 | 12,380 |
|---|
July - 17 | 10,910 | 12,635 |
|---|
August - 17 | 10,992 | 12,673 |
|---|
September - 17 | 11,111 | 12,935 |
|---|
October - 17 | 11,342 | 13,237 |
|---|
November - 17 | 11,766 | 13,642 |
|---|
December - 17 | 11,832 | 13,794 |
|---|
January - 18 | 12,585 | 14,584 |
|---|
February - 18 | 12,364 | 14,046 |
|---|
March - 18 | 11,999 | 13,689 |
|---|
April - 18 | 12,121 | 13,742 |
|---|
May - 18 | 12,549 | 14,073 |
|---|
June - 18 | 12,661 | 14,160 |
|---|
July - 18 | 13,198 | 14,686 |
|---|
August - 18 | 13,942 | 15,165 |
|---|
September - 18 | 14,144 | 15,251 |
|---|
October - 18 | 12,846 | 14,209 |
|---|
November - 18 | 12,936 | 14,498 |
|---|
December - 18 | 11,882 | 13,189 |
|---|
January - 19 | 12,777 | 14,246 |
|---|
February - 19 | 13,232 | 14,704 |
|---|
March - 19 | 13,720 | 14,989 |
|---|
April - 19 | 14,427 | 15,596 |
|---|
May - 19 | 13,450 | 14,605 |
|---|
June - 19 | 14,531 | 15,635 |
|---|
July - 19 | 15,038 | 15,859 |
|---|
August - 19 | 14,957 | 15,608 |
|---|
September - 19 | 15,010 | 15,900 |
|---|
October - 19 | 15,280 | 16,245 |
|---|
November - 19 | 15,758 | 16,834 |
|---|
December - 19 | 16,204 | 17,342 |
|---|
January - 20 | 16,384 | 17,335 |
|---|
February - 20 | 15,199 | 15,908 |
|---|
March - 20 | 13,752 | 13,944 |
|---|
April - 20 | 15,531 | 15,731 |
|---|
May - 20 | 16,554 | 16,480 |
|---|
June - 20 | 17,252 | 16,808 |
|---|
July - 20 | 18,558 | 17,756 |
|---|
August - 20 | 20,274 | 19,032 |
|---|
September - 20 | 19,513 | 18,309 |
|---|
October - 20 | 18,685 | 17,822 |
|---|
November - 20 | 20,406 | 19,773 |
|---|
December - 20 | 21,142 | 20,533 |
|---|
January - 21 | 20,667 | 20,326 |
|---|
February - 21 | 20,770 | 20,886 |
|---|
March - 21 | 21,348 | 21,801 |
|---|
April - 21 | 22,648 | 22,964 |
|---|
May - 21 | 22,486 | 23,125 |
|---|
June - 21 | 23,319 | 23,665 |
|---|
July - 21 | 24,094 | 24,227 |
|---|
August - 21 | 24,795 | 24,963 |
|---|
September - 21 | 23,241 | 23,802 |
|---|
October - 21 | 24,844 | 25,470 |
|---|
November - 21 | 25,197 | 25,294 |
|---|
December - 21 | 26,003 | 26,427 |
|---|
January - 22 | 24,256 | 25,060 |
|---|
February - 22 | 23,369 | 24,309 |
|---|
March - 22 | 23,754 | 25,212 |
|---|
April - 22 | 21,531 | 23,013 |
|---|
May - 22 | 21,242 | 23,056 |
|---|
June - 22 | 19,543 | 21,152 |
|---|
July - 22 | 21,472 | 23,103 |
|---|
August - 22 | 20,334 | 22,161 |
|---|
September - 22 | 18,404 | 20,120 |
|---|
October - 22 | 19,559 | 21,749 |
|---|
November - 22 | 20,692 | 22,964 |
|---|
December - 22 | 19,438 | 21,641 |
|---|
January - 23 | 20,660 | 23,001 |
|---|
February - 23 | 20,003 | 22,440 |
|---|
March - 23 | 21,241 | 23,263 |
|---|
April - 23 | 21,652 | 23,626 |
|---|
May - 23 | 22,107 | 23,729 |
|---|
June - 23 | 23,608 | 25,297 |
|---|
July - 23 | 24,030 | 26,110 |
|---|
August - 23 | 23,647 | 25,694 |
|---|
September - 23 | 22,293 | 24,469 |
|---|
October - 23 | 21,877 | 23,955 |
|---|
November - 23 | 23,893 | 26,142 |
|---|
December - 23 | 24,929 | 27,330 |
|---|
January - 24 | 25,411 | 27,789 |
|---|
February - 24 | 26,814 | 29,273 |
|---|
March - 24 | 27,214 | 30,215 |
|---|
April - 24 | 26,009 | 28,981 |
|---|
May - 24 | 27,406 | 30,418 |
|---|
June - 24 | 29,067 | 31,509 |
|---|
July - 24 | 28,705 | 31,893 |
|---|
August - 24 | 29,209 | 32,666 |
|---|
September - 24 | 30,031 | 33,364 |
|---|
October - 24 | 29,554 | 33,061 |
|---|
November - 24 | 31,116 | 35,002 |
|---|
|
| Average Annual Return [Table Text Block] |
Annual Average Total Return | 1 Year | 5 Year | 10 Year |
|---|
Investor Shares | 30.23% | 14.58% | 12.02% |
|---|
S&P 500 Index
| 33.89% | 15.75% | 13.33% |
|---|
|
| AssetsNet |
$ 75,697,326
|
| Holdings Count | Holding |
30
|
| Advisory Fees Paid, Amount |
$ 344,509
|
| InvestmentCompanyPortfolioTurnover |
6.00%
|
| Additional Fund Statistics [Text Block] |
Total Net Assets | $75,697,326 |
|---|
# of Portfolio Holdings | 30 |
|---|
Advisory Fees Paid | $344,509 |
|---|
Portfolio Turnover Rate | 6% |
|---|
|
| Holdings [Text Block] |
Infrastructure Software | 17.1% | Semiconductor Devices | 14.7% | Communications Equipment | 12.5% | Internet Media & Services | 9.2% | Online Marketplace | 7.4% | Medical Devices | 5.2% | Mass Merchants | 4.5% | Specialty Apparel Stores | 4.4% | Other Financial Services | 3.6% | Application Software | 3.0% | Other Industries | 15.8% | Other Assets (net of liabilities) | 2.6% |
|
| Largest Holdings [Text Block] |
Microsoft | 10.2% | Apple | 8.6% | Amazon.com | 7.4% | Alphabet, Class A | 7.1% | Nvidia | 6.4% | Costco Wholesale | 4.5% | Oracle | 4.3% | Motorola Solutions | 3.9% | Mastercard, Class A | 3.6% | TJX Companies | 3.1% |
|
| Material Fund Change [Text Block] |
|
| Updated Prospectus Phone Number |
1-800-728-8762
|
| C000188907 |
|
| Shareholder Report [Line Items] |
|
| Fund Name |
Sextant Growth Fund
|
| Class Name |
Z SHARES
|
| Trading Symbol |
SGZFX
|
| Annual or Semi-Annual Statement [Text Block] |
This Annual Shareholder Report contains important information about the Sextant Growth Fund for the period of December 1, 2023 to November 30, 2024.
|
| Shareholder Report Annual or Semi-Annual |
Annual Shareholder Report
|
| Additional Information [Text Block] |
You can find additional information about the Fund at www.saturna.com/sextant/growth-fund. You can also request this information by contacting us at 1-800-728-8762 or investorservices@saturna.com.
|
| Additional Information Phone Number |
1-800-728-8762
|
| Additional Information Email |
<span style="box-sizing: border-box; color: rgb(68, 68, 68); display: inline; flex-wrap: nowrap; font-size: 10.6667px; font-weight: 400; grid-area: auto; line-height: 16px; margin: 0px; overflow: visible; text-align: left;">investorservices@saturna.com</span>
|
| Additional Information Website |
<span style="box-sizing: border-box; color: rgb(68, 68, 68); display: inline; flex-wrap: nowrap; font-size: 10.6667px; font-weight: 400; grid-area: auto; line-height: 16px; margin: 0px; overflow: visible; text-align: left;">www.saturna.com/sextant/growth-fund</span>
|
| Expenses [Text Block] |
What were the Fund’s costs for the last year? (Based on a hypothetical $10,000 investment) Class Name | Cost of a $10,000 Investment | Cost Paid as a % of a $10,000 Investment |
|---|
Z Shares | $83 | 0.72% |
|---|
|
| Expenses Paid, Amount |
$ 83
|
| Expense Ratio, Percent |
0.72%
|
| Factors Affecting Performance [Text Block] |
How did the Fund perform over the last year? For the fiscal year ended November 30, 2024, Sextant Growth Fund Z Shares returned 30.23%, trailing the 33.89% return for the S&P 500 Index for the same period. As was the case in the previous fiscal year, the Fund returns suffered in comparison to the S&P 500 Index due to a handful of mega-cap Technology and artificial intelligence (AI) related stocks driving Index returns. What Factors Influenced Performance? Similarly to 2023, Nvidia was the dominant contributor to Index returns as other mega-cap stocks jumped on the AI/data center/large language model bandwagon. The Fund holds a position in Nvidia, but the benchmark weight is more than double the Fund’s exposure. We hold positions in Alphabet, Amazon, Apple, Meta Platforms, and Microsoft as well — all the Magnificent Seven stocks except Tesla — but typically at lower exposures than represented in the benchmarks. That said, Fund performance was boosted by several holdings not included among the mega-caps. These include Broadcom, Oracle, and ServiceNow in Technology, Boston Scientific in Health Care, and Motorola Solutions in Communications. The aforementioned stocks all appreciated by at least 50% over the course of the year. Other strong performers included Costco, Johnson Controls, and TJX. Portfolio returns were diminished by declines in the value of Adobe, Lululemon, Advanced Micro Devices, and Zoetis. As long-term investors, our interpretation of the long-term operational thesis behind an investment matters more than any short-term period of weakness. Looking Forward The US economy currently enjoys solid positive momentum, which is likely to continue well into the new year. While the new administration appears determined to implement a wide range of policy initiatives that will depart significantly from the past, executing on the changes will take time — as it will for the effects to be felt. Stock markets discount expectations well before the realities resonate in the economy or corporate earnings so we are reliant on the market’s interpretation of the mix of policy prescriptions. Following the pre-Christmas fiscal gymnastics, it appears that adopting a long-term government funding solution will be the first challenge, one likely to feature a plethora of political pyrotechnics. |
| Line Graph [Table Text Block] |
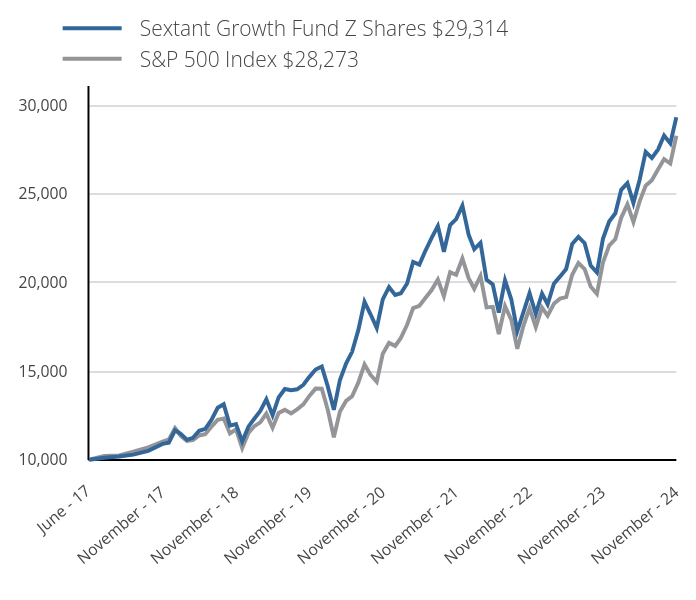 | Sextant Growth Fund Z Shares $29,314 | S&P 500 Index $28,273 |
|---|
June - 17 | 10,000 | 10,000 |
|---|
July - 17 | 10,107 | 10,206 |
|---|
August - 17 | 10,178 | 10,237 |
|---|
September - 17 | 10,285 | 10,448 |
|---|
October - 17 | 10,499 | 10,692 |
|---|
November - 17 | 10,893 | 11,020 |
|---|
December - 17 | 10,957 | 11,142 |
|---|
January - 18 | 11,661 | 11,780 |
|---|
February - 18 | 11,455 | 11,346 |
|---|
March - 18 | 11,120 | 11,058 |
|---|
April - 18 | 11,233 | 11,100 |
|---|
May - 18 | 11,631 | 11,367 |
|---|
June - 18 | 11,736 | 11,437 |
|---|
July - 18 | 12,239 | 11,863 |
|---|
August - 18 | 12,930 | 12,250 |
|---|
September - 18 | 13,123 | 12,319 |
|---|
October - 18 | 11,921 | 11,477 |
|---|
November - 18 | 12,004 | 11,711 |
|---|
December - 18 | 11,030 | 10,654 |
|---|
January - 19 | 11,862 | 11,508 |
|---|
February - 19 | 12,291 | 11,877 |
|---|
March - 19 | 12,751 | 12,108 |
|---|
April - 19 | 13,406 | 12,598 |
|---|
May - 19 | 12,503 | 11,797 |
|---|
June - 19 | 13,512 | 12,629 |
|---|
July - 19 | 13,986 | 12,810 |
|---|
August - 19 | 13,915 | 12,607 |
|---|
September - 19 | 13,968 | 12,843 |
|---|
October - 19 | 14,224 | 13,122 |
|---|
November - 19 | 14,671 | 13,598 |
|---|
December - 19 | 15,086 | 14,008 |
|---|
January - 20 | 15,259 | 14,003 |
|---|
February - 20 | 14,161 | 12,850 |
|---|
March - 20 | 12,812 | 11,263 |
|---|
April - 20 | 14,471 | 12,707 |
|---|
May - 20 | 15,428 | 13,312 |
|---|
June - 20 | 16,084 | 13,577 |
|---|
July - 20 | 17,306 | 14,342 |
|---|
August - 20 | 18,906 | 15,373 |
|---|
September - 20 | 18,204 | 14,789 |
|---|
October - 20 | 17,433 | 14,396 |
|---|
November - 20 | 19,042 | 15,972 |
|---|
December - 20 | 19,730 | 16,586 |
|---|
January - 21 | 19,294 | 16,418 |
|---|
February - 21 | 19,386 | 16,871 |
|---|
March - 21 | 19,937 | 17,610 |
|---|
April - 21 | 21,150 | 18,550 |
|---|
May - 21 | 21,003 | 18,679 |
|---|
June - 21 | 21,784 | 19,115 |
|---|
July - 21 | 22,514 | 19,569 |
|---|
August - 21 | 23,176 | 20,164 |
|---|
September - 21 | 21,729 | 19,226 |
|---|
October - 21 | 23,231 | 20,573 |
|---|
November - 21 | 23,566 | 20,431 |
|---|
December - 21 | 24,329 | 21,347 |
|---|
January - 22 | 22,693 | 20,242 |
|---|
February - 22 | 21,870 | 19,636 |
|---|
March - 22 | 22,231 | 20,365 |
|---|
April - 22 | 20,159 | 18,589 |
|---|
May - 22 | 19,888 | 18,623 |
|---|
June - 22 | 18,303 | 17,086 |
|---|
July - 22 | 20,114 | 18,661 |
|---|
August - 22 | 19,050 | 17,900 |
|---|
September - 22 | 17,249 | 16,252 |
|---|
October - 22 | 18,333 | 17,567 |
|---|
November - 22 | 19,397 | 18,549 |
|---|
December - 22 | 18,230 | 17,481 |
|---|
January - 23 | 19,372 | 18,579 |
|---|
February - 23 | 18,765 | 18,126 |
|---|
March - 23 | 19,928 | 18,791 |
|---|
April - 23 | 20,324 | 19,084 |
|---|
May - 23 | 20,756 | 19,167 |
|---|
June - 23 | 22,166 | 20,434 |
|---|
July - 23 | 22,568 | 21,090 |
|---|
August - 23 | 22,213 | 20,754 |
|---|
September - 23 | 20,947 | 19,765 |
|---|
October - 23 | 20,556 | 19,349 |
|---|
November - 23 | 22,459 | 21,116 |
|---|
December - 23 | 23,434 | 22,076 |
|---|
January - 24 | 23,898 | 22,447 |
|---|
February - 24 | 25,221 | 23,645 |
|---|
March - 24 | 25,602 | 24,406 |
|---|
April - 24 | 24,474 | 23,409 |
|---|
May - 24 | 25,792 | 24,570 |
|---|
June - 24 | 27,362 | 25,452 |
|---|
July - 24 | 27,023 | 25,761 |
|---|
August - 24 | 27,501 | 26,386 |
|---|
September - 24 | 28,284 | 26,950 |
|---|
October - 24 | 27,841 | 26,705 |
|---|
November - 24 | 29,314 | 28,273 |
|---|
|
| Average Annual Return [Table Text Block] |
Annual Average Total Return | 1 Year | 5 Year | Since Inception |
|---|
Z Shares | 30.52% | 14.85% | 15.25% |
|---|
S&P 500 Index
| 33.89% | 15.75% | 14.77% |
|---|
|
| AssetsNet |
$ 75,697,326
|
| Holdings Count | Holding |
30
|
| Advisory Fees Paid, Amount |
$ 344,509
|
| InvestmentCompanyPortfolioTurnover |
6.00%
|
| Additional Fund Statistics [Text Block] |
Total Net Assets | $75,697,326 |
|---|
# of Portfolio Holdings | 30 |
|---|
Advisory Fees Paid | $344,509 |
|---|
Portfolio Turnover Rate | 6% |
|---|
|
| Holdings [Text Block] |
Infrastructure Software | 17.1% | Semiconductor Devices | 14.7% | Communications Equipment | 12.5% | Internet Media & Services | 9.2% | Online Marketplace | 7.4% | Medical Devices | 5.2% | Mass Merchants | 4.5% | Specialty Apparel Stores | 4.4% | Other Financial Services | 3.6% | Application Software | 3.0% | Other Industries | 15.8% | Other Assets (net of liabilities) | 2.6% |
|
| Largest Holdings [Text Block] |
Microsoft | 10.2% | Apple | 8.6% | Amazon.com | 7.4% | Alphabet, Class A | 7.1% | Nvidia | 6.4% | Costco Wholesale | 4.5% | Oracle | 4.3% | Motorola Solutions | 3.9% | Mastercard, Class A | 3.6% | TJX Companies | 3.1% |
|
| Material Fund Change [Text Block] |
|
| Updated Prospectus Phone Number |
1-800-728-8762
|
| C000065110 |
|
| Shareholder Report [Line Items] |
|
| Fund Name |
Sextant International Fund
|
| Class Name |
INVESTOR SHARES
|
| Trading Symbol |
SSIFX
|
| Annual or Semi-Annual Statement [Text Block] |
This Annual Shareholder Report contains important information about the Sextant International Fund for the period of December 1, 2023 to November 30, 2024.
|
| Shareholder Report Annual or Semi-Annual |
Annual Shareholder Report
|
| Additional Information [Text Block] |
You can find additional information about the Fund at www.saturna.com/sextant/international-fund. You can also request this information by contacting us at 1-800-728-8762 or investorservices@saturna.com.
|
| Additional Information Phone Number |
1-800-728-8762
|
| Additional Information Email |
<span style="box-sizing: border-box; color: rgb(68, 68, 68); display: inline; flex-wrap: nowrap; font-size: 10.6667px; font-weight: 400; grid-area: auto; line-height: 16px; margin: 0px; overflow: visible; text-align: left;">investorservices@saturna.com</span>
|
| Additional Information Website |
<span style="box-sizing: border-box; color: rgb(68, 68, 68); display: inline; flex-wrap: nowrap; font-size: 10.6667px; font-weight: 400; grid-area: auto; line-height: 16px; margin: 0px; overflow: visible; text-align: left;">www.saturna.com/sextant/international-fund</span>
|
| Expenses [Text Block] |
What were the Fund’s costs for the last year? (Based on a hypothetical $10,000 investment) Class Name | Cost of a $10,000 Investment | Cost Paid as a % of a $10,000 Investment |
|---|
Investor Shares | $100 | 0.95% |
|---|
|
| Expenses Paid, Amount |
$ 100
|
| Expense Ratio, Percent |
0.95%
|
| Factors Affecting Performance [Text Block] |
How did the Fund perform over the last year? For the fiscal year ended November 30, 2024, the Sextant International Fund Investor Shares returned 9.82%. The MSCI EAFE Index returned 12.44% for the same period. Factors Affecting Past Performance The Sextant International Fund mandates 65% of net assets be held in companies with market capitalization greater than $1 billion as well as their headquarters and at least half of their assets and earnings outside the US. The Fund generally holds equity positions in larger companies with strong balance sheets. In terms of performance contribution, Financials was the primary detractor since it was the strongest performing sector this year and the Fund had no exposure. Industrials, Consumer Discretionary, Materials, and Technology were moderate contributors. Looking Forward In recent months, investor attention shifted from fears of a recession from mismanaged monetary policy, to fears of inflation potentially rearing its head again because of the new administration’s fiscal policy. A reasonable outcome is that global growth continues to bifurcate with relative strength coming from countries such as the US and India, while the eurozone struggles to keep pace. From an investment perspective, two categories of companies are poised to emerge as frontrunners as we approach 2025: productivity enablers, or enterprises offering products and services designed to boost efficiency for other businesses, and AI adopters, or organizations effectively implementing productivity-enhancing technologies internally. These winners will ride the wave of a dual transformation from the widespread adoption of artificial intelligence and the ongoing digitization of the economy. This technological convergence is set to reshape competitive landscapes across industries, favoring those at the forefront of innovation and adaptation. Unfortunately, this will likely lead to the disruption of certain legacy business models, services, and conventional jobs. This, in turn, may trigger negative market sentiment in the affected industry verticals. It will be important for investors to stay active in avoiding these pitfalls, while adequately participating in the companies that will define the future economy. |
| Line Graph [Table Text Block] |
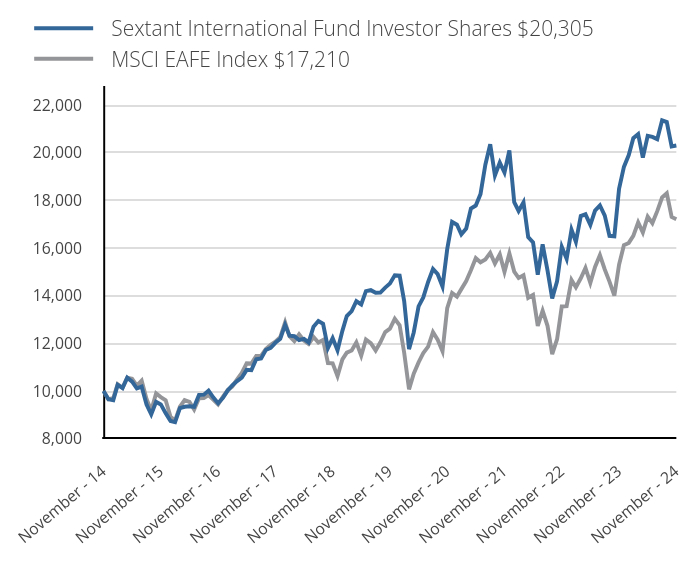 | Sextant International Fund Investor Shares $20,305 | MSCI EAFE Index $17,210 |
|---|
November - 14 | 10,000 | 10,000 |
|---|
December - 14 | 9,657 | 9,656 |
|---|
January - 15 | 9,619 | 9,704 |
|---|
February - 15 | 10,259 | 10,285 |
|---|
March - 15 | 10,129 | 10,139 |
|---|
April - 15 | 10,562 | 10,561 |
|---|
May - 15 | 10,394 | 10,519 |
|---|
June - 15 | 10,110 | 10,224 |
|---|
July - 15 | 10,187 | 10,436 |
|---|
August - 15 | 9,438 | 9,670 |
|---|
September - 15 | 9,024 | 9,182 |
|---|
October - 15 | 9,547 | 9,901 |
|---|
November - 15 | 9,442 | 9,748 |
|---|
December - 15 | 9,073 | 9,618 |
|---|
January - 16 | 8,744 | 8,924 |
|---|
February - 16 | 8,698 | 8,763 |
|---|
March - 16 | 9,284 | 9,341 |
|---|
April - 16 | 9,343 | 9,622 |
|---|
May - 16 | 9,363 | 9,546 |
|---|
June - 16 | 9,343 | 9,230 |
|---|
July - 16 | 9,836 | 9,698 |
|---|
August - 16 | 9,850 | 9,707 |
|---|
September - 16 | 10,021 | 9,830 |
|---|
October - 16 | 9,725 | 9,630 |
|---|
November - 16 | 9,488 | 9,439 |
|---|
December - 16 | 9,719 | 9,764 |
|---|
January - 17 | 10,032 | 10,047 |
|---|
February - 17 | 10,239 | 10,193 |
|---|
March - 17 | 10,419 | 10,485 |
|---|
April - 17 | 10,565 | 10,760 |
|---|
May - 17 | 10,892 | 11,169 |
|---|
June - 17 | 10,879 | 11,153 |
|---|
July - 17 | 11,338 | 11,475 |
|---|
August - 17 | 11,372 | 11,472 |
|---|
September - 17 | 11,725 | 11,762 |
|---|
October - 17 | 11,812 | 11,942 |
|---|
November - 17 | 12,027 | 12,069 |
|---|
December - 17 | 12,193 | 12,265 |
|---|
January - 18 | 12,782 | 12,881 |
|---|
February - 18 | 12,324 | 12,301 |
|---|
March - 18 | 12,302 | 12,092 |
|---|
April - 18 | 12,143 | 12,381 |
|---|
May - 18 | 12,193 | 12,119 |
|---|
June - 18 | 12,041 | 11,975 |
|---|
July - 18 | 12,702 | 12,270 |
|---|
August - 18 | 12,941 | 12,035 |
|---|
September - 18 | 12,825 | 12,144 |
|---|
October - 18 | 11,809 | 11,179 |
|---|
November - 18 | 12,223 | 11,166 |
|---|
December - 18 | 11,713 | 10,627 |
|---|
January - 19 | 12,529 | 11,327 |
|---|
February - 19 | 13,149 | 11,617 |
|---|
March - 19 | 13,354 | 11,703 |
|---|
April - 19 | 13,770 | 12,043 |
|---|
May - 19 | 13,636 | 11,482 |
|---|
June - 19 | 14,194 | 12,167 |
|---|
July - 19 | 14,233 | 12,014 |
|---|
August - 19 | 14,123 | 11,704 |
|---|
September - 19 | 14,131 | 12,045 |
|---|
October - 19 | 14,343 | 12,479 |
|---|
November - 19 | 14,515 | 12,622 |
|---|
December - 19 | 14,858 | 13,034 |
|---|
January - 20 | 14,841 | 12,763 |
|---|
February - 20 | 13,776 | 11,611 |
|---|
March - 20 | 11,759 | 10,073 |
|---|
April - 20 | 12,459 | 10,732 |
|---|
May - 20 | 13,556 | 11,206 |
|---|
June - 20 | 13,930 | 11,592 |
|---|
July - 20 | 14,581 | 11,864 |
|---|
August - 20 | 15,126 | 12,476 |
|---|
September - 20 | 14,906 | 12,157 |
|---|
October - 20 | 14,386 | 11,673 |
|---|
November - 20 | 15,955 | 13,484 |
|---|
December - 20 | 17,099 | 14,113 |
|---|
January - 21 | 16,985 | 13,964 |
|---|
February - 21 | 16,577 | 14,279 |
|---|
March - 21 | 16,821 | 14,621 |
|---|
April - 21 | 17,662 | 15,073 |
|---|
May - 21 | 17,785 | 15,579 |
|---|
June - 21 | 18,266 | 15,408 |
|---|
July - 21 | 19,499 | 15,526 |
|---|
August - 21 | 20,356 | 15,801 |
|---|
September - 21 | 19,050 | 15,354 |
|---|
October - 21 | 19,588 | 15,735 |
|---|
November - 21 | 19,172 | 15,005 |
|---|
December - 21 | 20,094 | 15,775 |
|---|
January - 22 | 17,932 | 15,014 |
|---|
February - 22 | 17,560 | 14,750 |
|---|
March - 22 | 17,923 | 14,862 |
|---|
April - 22 | 16,461 | 13,913 |
|---|
May - 22 | 16,240 | 14,037 |
|---|
June - 22 | 14,884 | 12,738 |
|---|
July - 22 | 16,160 | 13,374 |
|---|
August - 22 | 15,070 | 12,740 |
|---|
September - 22 | 13,892 | 11,554 |
|---|
October - 22 | 14,609 | 12,176 |
|---|
November - 22 | 16,054 | 13,550 |
|---|
December - 22 | 15,549 | 13,564 |
|---|
January - 23 | 16,771 | 14,664 |
|---|
February - 23 | 16,266 | 14,360 |
|---|
March - 23 | 17,347 | 14,734 |
|---|
April - 23 | 17,418 | 15,165 |
|---|
May - 23 | 16,975 | 14,543 |
|---|
June - 23 | 17,577 | 15,209 |
|---|
July - 23 | 17,790 | 15,703 |
|---|
August - 23 | 17,365 | 15,103 |
|---|
September - 23 | 16,514 | 14,594 |
|---|
October - 23 | 16,497 | 14,004 |
|---|
November - 23 | 18,490 | 15,306 |
|---|
December - 23 | 19,407 | 16,122 |
|---|
January - 24 | 19,905 | 16,216 |
|---|
February - 24 | 20,616 | 16,515 |
|---|
March - 24 | 20,785 | 17,077 |
|---|
April - 24 | 19,798 | 16,658 |
|---|
May - 24 | 20,714 | 17,324 |
|---|
June - 24 | 20,670 | 17,048 |
|---|
July - 24 | 20,572 | 17,551 |
|---|
August - 24 | 21,363 | 18,123 |
|---|
September - 24 | 21,292 | 18,298 |
|---|
October - 24 | 20,270 | 17,306 |
|---|
November - 24 | 20,305 | 17,210 |
|---|
|
| Average Annual Return [Table Text Block] |
Annual Average Total Return | 1 Year | 5 Year | 10 Year |
|---|
Investor Shares | 9.82% | 6.94% | 7.34% |
|---|
MSCI EAFE Index
| 12.44% | 6.39% | 5.57% |
|---|
|
| AssetsNet |
$ 72,220,400
|
| Holdings Count | Holding |
30
|
| Advisory Fees Paid, Amount |
$ 370,093
|
| InvestmentCompanyPortfolioTurnover |
19.00%
|
| Additional Fund Statistics [Text Block] |
Total Net Assets | $72,220,400 |
|---|
# of Portfolio Holdings | 30 |
|---|
Advisory Fees Paid | $370,093 |
|---|
Portfolio Turnover Rate | 19% |
|---|
|
| Holdings [Text Block] |
Application Software | 14.4% | Semiconductor Manufacturing | 10.9% | IT Services | 10.5% | Large Pharma | 9.9% | Electrical Power Equipment | 8.8% | Online Marketplace | 7.7% | Commercial & Residential Building Equipment & Systems | 5.2% | Semiconductor Devices | 4.7% | Industrial Wholesale & Rental | 4.3% | Basic & Diversified Chemicals | 3.2% | Other Industries | 18.3% | Other Assets (net of liabilities) | 2.1% |
|
| Largest Holdings [Text Block] |
MercadoLibre | 7.7% | Novo Nordisk ADR | 7.4% | Wolters Kluwer | 7.2% | Taiwan Semiconductor ADR | 5.9% | ASML Holding NY | 5.0% | SAP ADR | 4.8% | Broadcom | 4.7% | NICE Systems ADR | 4.4% | Ferguson Enterprises | 4.3% | Dassault Systemes ADR | 4.2% |
|
| Material Fund Change [Text Block] |
|
| Updated Prospectus Phone Number |
1-800-728-8762
|
| C000188908 |
|
| Shareholder Report [Line Items] |
|
| Fund Name |
Sextant International Fund
|
| Class Name |
Z SHARES
|
| Trading Symbol |
SIFZX
|
| Annual or Semi-Annual Statement [Text Block] |
This Annual Shareholder Report contains important information about the Sextant International Fund for the period of December 1, 2023 to November 30, 2024.
|
| Shareholder Report Annual or Semi-Annual |
Annual Shareholder Report
|
| Additional Information [Text Block] |
You can find additional information about the Fund at www.saturna.com/sextant/international-fund. You can also request this information by contacting us at 1-800-728-8762 or investorservices@saturna.com.
|
| Additional Information Phone Number |
1-800-728-8762
|
| Additional Information Email |
<span style="box-sizing: border-box; color: rgb(68, 68, 68); display: inline; flex-wrap: nowrap; font-size: 10.6667px; font-weight: 400; grid-area: auto; line-height: 16px; margin: 0px; overflow: visible; text-align: left;">investorservices@saturna.com</span>
|
| Additional Information Website |
<span style="box-sizing: border-box; color: rgb(68, 68, 68); display: inline; flex-wrap: nowrap; font-size: 10.6667px; font-weight: 400; grid-area: auto; line-height: 16px; margin: 0px; overflow: visible; text-align: left;">www.saturna.com/sextant/international-fund</span>
|
| Expenses [Text Block] |
What were the Fund’s costs for the last year? (Based on a hypothetical $10,000 investment) Class Name | Cost of a $10,000 Investment | Cost Paid as a % of a $10,000 Investment |
|---|
Z Shares | $76 | 0.72% |
|---|
|
| Expenses Paid, Amount |
$ 76
|
| Expense Ratio, Percent |
0.72%
|
| Factors Affecting Performance [Text Block] |
How did the Fund perform over the last year? For the fiscal year ended November 30, 2024, the Sextant International Fund Z Shares returned 10.04%. The MSCI EAFE Index returned 12.44% for the same period. Factors Affecting Past Performance The Sextant International Fund mandates 65% of net assets be held in companies with market capitalization greater than $1 billion as well as their headquarters and at least half of their assets and earnings outside the US. The Fund generally holds equity positions in larger companies with strong balance sheets. In terms of performance contribution, Financials was the primary detractor since it was the strongest performing sector this year and the Fund had no exposure. Industrials, Consumer Discretionary, Materials, and Technology were moderate contributors. Looking Forward In recent months, investor attention shifted from fears of a recession from mismanaged monetary policy, to fears of inflation potentially rearing its head again because of the new administration’s fiscal policy. A reasonable outcome is that global growth continues to bifurcate with relative strength coming from countries such as the US and India, while the eurozone struggles to keep pace. From an investment perspective, two categories of companies are poised to emerge as frontrunners as we approach 2025: productivity enablers, or enterprises offering products and services designed to boost efficiency for other businesses, and AI adopters, or organizations effectively implementing productivity-enhancing technologies internally. These winners will ride the wave of a dual transformation from the widespread adoption of artificial intelligence and the ongoing digitization of the economy. This technological convergence is set to reshape competitive landscapes across industries, favoring those at the forefront of innovation and adaptation. Unfortunately, this will likely lead to the disruption of certain legacy business models, services, and conventional jobs. This, in turn, may trigger negative market sentiment in the affected industry verticals. It will be important for investors to stay active in avoiding these pitfalls, while adequately participating in the companies that will define the future economy. |
| Line Graph [Table Text Block] |
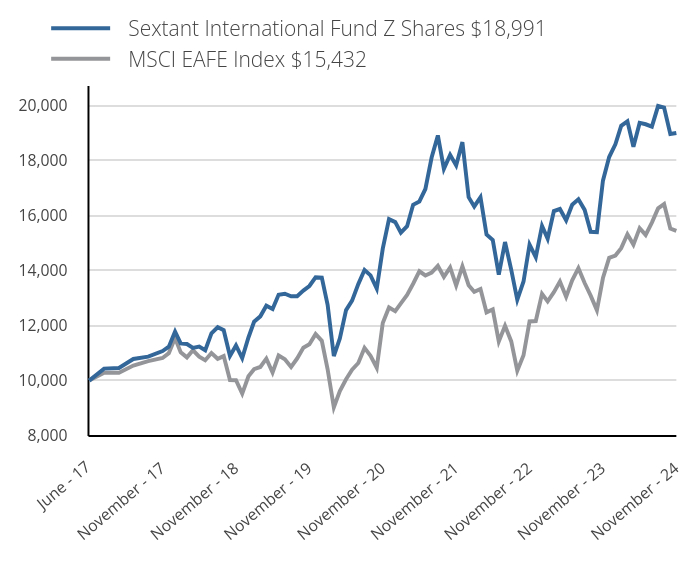 | Sextant International Fund Z Shares $18,991 | MSCI EAFE Index $15,432 |
|---|
June - 17 | 10,000 | 10,000 |
|---|
July - 17 | 10,435 | 10,289 |
|---|
August - 17 | 10,459 | 10,287 |
|---|
September - 17 | 10,783 | 10,547 |
|---|
October - 17 | 10,869 | 10,708 |
|---|
November - 17 | 11,073 | 10,821 |
|---|
December - 17 | 11,229 | 10,997 |
|---|
January - 18 | 11,777 | 11,549 |
|---|
February - 18 | 11,349 | 11,030 |
|---|
March - 18 | 11,329 | 10,842 |
|---|
April - 18 | 11,189 | 11,101 |
|---|
May - 18 | 11,236 | 10,867 |
|---|
June - 18 | 11,102 | 10,737 |
|---|
July - 18 | 11,717 | 11,002 |
|---|
August - 18 | 11,937 | 10,791 |
|---|
September - 18 | 11,831 | 10,889 |
|---|
October - 18 | 10,895 | 10,023 |
|---|
November - 18 | 11,276 | 10,012 |
|---|
December - 18 | 10,813 | 9,528 |
|---|
January - 19 | 11,566 | 10,156 |
|---|
February - 19 | 12,138 | 10,416 |
|---|
March - 19 | 12,333 | 10,493 |
|---|
April - 19 | 12,717 | 10,798 |
|---|
May - 19 | 12,601 | 10,295 |
|---|
June - 19 | 13,116 | 10,909 |
|---|
July - 19 | 13,152 | 10,772 |
|---|
August - 19 | 13,058 | 10,494 |
|---|
September - 19 | 13,065 | 10,800 |
|---|
October - 19 | 13,268 | 11,189 |
|---|
November - 19 | 13,434 | 11,317 |
|---|
December - 19 | 13,752 | 11,687 |
|---|
January - 20 | 13,737 | 11,444 |
|---|
February - 20 | 12,752 | 10,411 |
|---|
March - 20 | 10,888 | 9,032 |
|---|
April - 20 | 11,534 | 9,623 |
|---|
May - 20 | 12,557 | 10,048 |
|---|
June - 20 | 12,903 | 10,394 |
|---|
July - 20 | 13,504 | 10,638 |
|---|
August - 20 | 14,016 | 11,187 |
|---|
September - 20 | 13,820 | 10,901 |
|---|
October - 20 | 13,339 | 10,467 |
|---|
November - 20 | 14,790 | 12,090 |
|---|
December - 20 | 15,859 | 12,655 |
|---|
January - 21 | 15,753 | 12,521 |
|---|
February - 21 | 15,368 | 12,803 |
|---|
March - 21 | 15,602 | 13,110 |
|---|
April - 21 | 16,381 | 13,515 |
|---|
May - 21 | 16,502 | 13,969 |
|---|
June - 21 | 16,956 | 13,816 |
|---|
July - 21 | 18,098 | 13,921 |
|---|
August - 21 | 18,900 | 14,168 |
|---|
September - 21 | 17,690 | 13,767 |
|---|
October - 21 | 18,196 | 14,109 |
|---|
November - 21 | 17,811 | 13,454 |
|---|
December - 21 | 18,657 | 14,145 |
|---|
January - 22 | 16,658 | 13,462 |
|---|
February - 22 | 16,321 | 13,225 |
|---|
March - 22 | 16,658 | 13,326 |
|---|
April - 22 | 15,301 | 12,475 |
|---|
May - 22 | 15,104 | 12,586 |
|---|
June - 22 | 13,845 | 11,421 |
|---|
July - 22 | 15,030 | 11,991 |
|---|
August - 22 | 14,018 | 11,423 |
|---|
September - 22 | 12,932 | 10,360 |
|---|
October - 22 | 13,598 | 10,918 |
|---|
November - 22 | 14,939 | 12,149 |
|---|
December - 22 | 14,478 | 12,163 |
|---|
January - 23 | 15,613 | 13,149 |
|---|
February - 23 | 15,153 | 12,876 |
|---|
March - 23 | 16,156 | 13,211 |
|---|
April - 23 | 16,230 | 13,598 |
|---|
May - 23 | 15,819 | 13,040 |
|---|
June - 23 | 16,387 | 13,637 |
|---|
July - 23 | 16,584 | 14,080 |
|---|
August - 23 | 16,197 | 13,542 |
|---|
September - 23 | 15,399 | 13,086 |
|---|
October - 23 | 15,391 | 12,557 |
|---|
November - 23 | 17,259 | 13,724 |
|---|
December - 23 | 18,115 | 14,455 |
|---|
January - 24 | 18,578 | 14,540 |
|---|
February - 24 | 19,248 | 14,808 |
|---|
March - 24 | 19,413 | 15,312 |
|---|
April - 24 | 18,487 | 14,936 |
|---|
May - 24 | 19,355 | 15,534 |
|---|
June - 24 | 19,306 | 15,287 |
|---|
July - 24 | 19,223 | 15,737 |
|---|
August - 24 | 19,967 | 16,250 |
|---|
September - 24 | 19,909 | 16,407 |
|---|
October - 24 | 18,950 | 15,517 |
|---|
November - 24 | 18,991 | 15,432 |
|---|
|
| Average Annual Return [Table Text Block] |
Annual Average Total Return | 1 Year | 5 Year | Since Inception |
|---|
Z Shares | 10.04% | 7.17% | 8.74% |
|---|
MSCI EAFE Index
| 12.44% | 6.39% | 5.73% |
|---|
|
| AssetsNet |
$ 72,220,400
|
| Holdings Count | Holding |
30
|
| Advisory Fees Paid, Amount |
$ 370,093
|
| InvestmentCompanyPortfolioTurnover |
19.00%
|
| Additional Fund Statistics [Text Block] |
Total Net Assets | $72,220,400 |
|---|
# of Portfolio Holdings | 30 |
|---|
Advisory Fees Paid | $370,093 |
|---|
Portfolio Turnover Rate | 19% |
|---|
|
| Holdings [Text Block] |
Application Software | 14.4% | Semiconductor Manufacturing | 10.9% | IT Services | 10.5% | Large Pharma | 9.9% | Electrical Power Equipment | 8.8% | Online Marketplace | 7.7% | Commercial & Residential Building Equipment & Systems | 5.2% | Semiconductor Devices | 4.7% | Industrial Wholesale & Rental | 4.3% | Basic & Diversified Chemicals | 3.2% | Other Industries | 18.3% | Other Assets (net of liabilities) | 2.1% |
|
| Largest Holdings [Text Block] |
MercadoLibre | 7.7% | Novo Nordisk ADR | 7.4% | Wolters Kluwer | 7.2% | Taiwan Semiconductor ADR | 5.9% | ASML Holding NY | 5.0% | SAP ADR | 4.8% | Broadcom | 4.7% | NICE Systems ADR | 4.4% | Ferguson Enterprises | 4.3% | Dassault Systemes ADR | 4.2% |
|
| Material Fund Change [Text Block] |
|
| Updated Prospectus Phone Number |
1-800-728-8762
|
| C000065112 |
|
| Shareholder Report [Line Items] |
|
| Fund Name |
Sextant Short-Term Bond Fund
|
| Class Name |
SEXTANT SHORT-TERM BOND
|
| Trading Symbol |
STBFX
|
| Annual or Semi-Annual Statement [Text Block] |
This Annual Shareholder Report contains important information about the Sextant Short-Term Bond Fund for the period of December 1, 2023 to November 30, 2024.
|
| Shareholder Report Annual or Semi-Annual |
Annual Shareholder Report
|
| Additional Information [Text Block] |
You can find additional information about the Fund at www.saturna.com/sextant/short-term-bond-fund. You can also request this information by contacting us at 1-800-728-8762 or investorservices@saturna.com.
|
| Additional Information Phone Number |
1-800-728-8762
|
| Additional Information Email |
<span style="box-sizing: border-box; color: rgb(68, 68, 68); display: inline; flex-wrap: nowrap; font-size: 10.6667px; font-weight: 400; grid-area: auto; line-height: 16px; margin: 0px; overflow: visible; text-align: left;">investorservices@saturna.com</span>
|
| Additional Information Website |
<span style="box-sizing: border-box; color: rgb(68, 68, 68); display: inline; flex-wrap: nowrap; font-size: 10.6667px; font-weight: 400; grid-area: auto; line-height: 16px; margin: 0px; overflow: visible; text-align: left;">www.saturna.com/sextant/short-term-bond-fund</span>
|
| Expenses [Text Block] |
What were the Fund’s costs for the last year? (Based on a hypothetical $10,000 investment) Class Name | Cost of a $10,000 Investment | Cost Paid as a % of a $10,000 Investment |
|---|
Sextant Short-Term Bond | $61 | 0.60% |
|---|
|
| Expenses Paid, Amount |
$ 61
|
| Expense Ratio, Percent |
0.60%
|
| Factors Affecting Performance [Text Block] |
How did the Fund perform over the last year? For the fiscal year ended November 30, 2024, the Sextant Short-Term Bond Fund returned 4.71%. The Bloomberg US Aggregate 1-3 Year Index returned 5.41%, while the Bloomberg US Aggregate Index returned 6.88%. For the five-year period ended November 30, 2024, the Fund reported an annualized total return of 1.23%, compared to 1.53% for the Bloomberg US Aggregate 1-3 Year Index and -0.01% for the Bloomberg US Aggregate Index. The primary reason for the Fund’s underperformance over the past year was the Fund’s defensive cash position and a lack of exposure to securitized debt. The five-year outperformance relative to the Bloomberg US Aggregate Index is due to the fund’s shorter duration. Factors Affecting Past Performance Elevated inflation, an uncertain growth outlook, and a global election cycle made 2024 another volatile year across fixed income markets. Although the Federal Funds Rate was reduced by 100 basis points, the yield curve experienced a pronounced steepening, demonstrating the opposing forces of a weakening labor market, strong output growth, and high inflation expectations. The Sextant Short-Term Bond Fund’s 44.5% weighting to securities maturating within 1-3 years outperformed other areas of the curve, benefitting from the movement on the short end. Even amid macroeconomic and political uncertainty, corporate debt was well-bid, leading to extensive spread compression across both investment-grade and high-yield debt. Credit-risky debt rallied as investors welcomed the newfound yield, with participants aiming to lock in the higher yield no matter the cost. The Fund maintained a lower weighting to credit-risky debt, instead opting for yield enhancement in other areas of the market. Looking Forward To end the year, politics was top of mind as the United States headed to the polls in November. Along with a new regime comes a new set of opportunities and risks in 2025. As policy becomes clearer, the Sextant Short-Term Bond Fund will remain defensively positioned, ready to take advantage of any new developments. While adaptability is crucial, our goal has always been to choose good companies and invest through cycles rather than engaging in market timing with outsized active bets. |
| Line Graph [Table Text Block] |
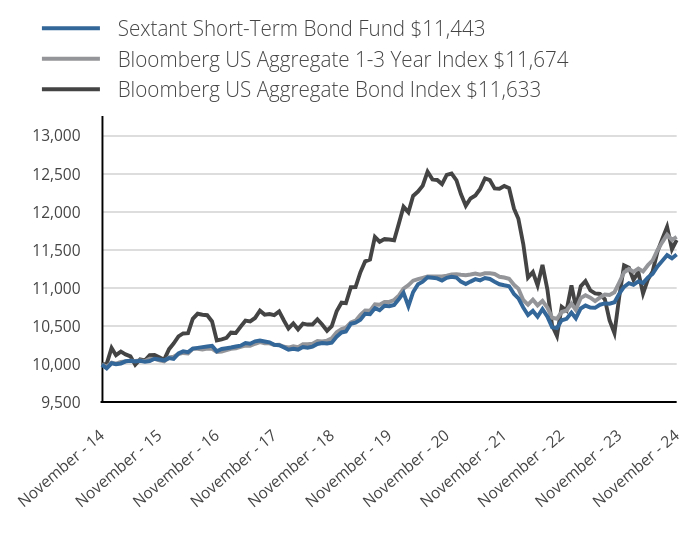 | Sextant Short-Term Bond Fund $11,443 | Bloomberg US Aggregate 1-3 Year Index $11,674 | Bloomberg US Aggregate Bond Index $11,633 |
|---|
November - 14 | 10,000 | 10,000 | 10,000 |
|---|
December - 14 | 9,950 | 9,975 | 10,009 |
|---|
January - 15 | 10,017 | 10,026 | 10,219 |
|---|
February - 15 | 10,005 | 10,011 | 10,123 |
|---|
March - 15 | 10,015 | 10,033 | 10,170 |
|---|
April - 15 | 10,043 | 10,042 | 10,134 |
|---|
May - 15 | 10,051 | 10,050 | 10,109 |
|---|
June - 15 | 10,040 | 10,047 | 9,999 |
|---|
July - 15 | 10,049 | 10,053 | 10,069 |
|---|
August - 15 | 10,039 | 10,047 | 10,054 |
|---|
September - 15 | 10,047 | 10,077 | 10,122 |
|---|
October - 15 | 10,077 | 10,074 | 10,124 |
|---|
November - 15 | 10,067 | 10,055 | 10,097 |
|---|
December - 15 | 10,056 | 10,041 | 10,064 |
|---|
January - 16 | 10,085 | 10,093 | 10,203 |
|---|
February - 16 | 10,075 | 10,103 | 10,275 |
|---|
March - 16 | 10,145 | 10,139 | 10,370 |
|---|
April - 16 | 10,174 | 10,153 | 10,409 |
|---|
May - 16 | 10,163 | 10,147 | 10,412 |
|---|
June - 16 | 10,210 | 10,208 | 10,599 |
|---|
July - 16 | 10,219 | 10,209 | 10,666 |
|---|
August - 16 | 10,229 | 10,199 | 10,654 |
|---|
September - 16 | 10,238 | 10,211 | 10,648 |
|---|
October - 16 | 10,246 | 10,207 | 10,566 |
|---|
November - 16 | 10,173 | 10,166 | 10,316 |
|---|
December - 16 | 10,204 | 10,172 | 10,331 |
|---|
January - 17 | 10,215 | 10,191 | 10,351 |
|---|
February - 17 | 10,225 | 10,208 | 10,421 |
|---|
March - 17 | 10,238 | 10,214 | 10,415 |
|---|
April - 17 | 10,248 | 10,233 | 10,496 |
|---|
May - 17 | 10,282 | 10,250 | 10,576 |
|---|
June - 17 | 10,273 | 10,246 | 10,566 |
|---|
July - 17 | 10,305 | 10,273 | 10,611 |
|---|
August - 17 | 10,315 | 10,294 | 10,706 |
|---|
September - 17 | 10,303 | 10,281 | 10,655 |
|---|
October - 17 | 10,292 | 10,279 | 10,662 |
|---|
November - 17 | 10,261 | 10,257 | 10,648 |
|---|
December - 17 | 10,254 | 10,260 | 10,697 |
|---|
January - 18 | 10,225 | 10,233 | 10,574 |
|---|
February - 18 | 10,195 | 10,223 | 10,473 |
|---|
March - 18 | 10,206 | 10,239 | 10,540 |
|---|
April - 18 | 10,197 | 10,229 | 10,462 |
|---|
May - 18 | 10,231 | 10,267 | 10,537 |
|---|
June - 18 | 10,222 | 10,268 | 10,524 |
|---|
July - 18 | 10,236 | 10,274 | 10,526 |
|---|
August - 18 | 10,270 | 10,310 | 10,594 |
|---|
September - 18 | 10,282 | 10,303 | 10,526 |
|---|
October - 18 | 10,276 | 10,314 | 10,443 |
|---|
November - 18 | 10,287 | 10,344 | 10,505 |
|---|
December - 18 | 10,365 | 10,425 | 10,698 |
|---|
January - 19 | 10,421 | 10,466 | 10,812 |
|---|
February - 19 | 10,434 | 10,483 | 10,805 |
|---|
March - 19 | 10,534 | 10,552 | 11,013 |
|---|
April - 19 | 10,550 | 10,575 | 11,016 |
|---|
May - 19 | 10,587 | 10,650 | 11,211 |
|---|
June - 19 | 10,665 | 10,708 | 11,352 |
|---|
July - 19 | 10,661 | 10,705 | 11,377 |
|---|
August - 19 | 10,740 | 10,789 | 11,672 |
|---|
September - 19 | 10,713 | 10,784 | 11,610 |
|---|
October - 19 | 10,771 | 10,821 | 11,645 |
|---|
November - 19 | 10,765 | 10,821 | 11,639 |
|---|
December - 19 | 10,781 | 10,846 | 11,630 |
|---|
January - 20 | 10,861 | 10,907 | 11,854 |
|---|
February - 20 | 10,940 | 10,996 | 12,068 |
|---|
March - 20 | 10,765 | 11,040 | 11,997 |
|---|
April - 20 | 10,951 | 11,100 | 12,210 |
|---|
May - 20 | 11,052 | 11,121 | 12,267 |
|---|
June - 20 | 11,087 | 11,137 | 12,344 |
|---|
July - 20 | 11,145 | 11,154 | 12,528 |
|---|
August - 20 | 11,138 | 11,155 | 12,427 |
|---|
September - 20 | 11,130 | 11,155 | 12,420 |
|---|
October - 20 | 11,101 | 11,154 | 12,365 |
|---|
November - 20 | 11,137 | 11,165 | 12,486 |
|---|
December - 20 | 11,150 | 11,180 | 12,504 |
|---|
January - 21 | 11,141 | 11,184 | 12,414 |
|---|
February - 21 | 11,087 | 11,177 | 12,235 |
|---|
March - 21 | 11,055 | 11,171 | 12,082 |
|---|
April - 21 | 11,088 | 11,180 | 12,177 |
|---|
May - 21 | 11,120 | 11,194 | 12,217 |
|---|
June - 21 | 11,104 | 11,177 | 12,303 |
|---|
July - 21 | 11,135 | 11,196 | 12,440 |
|---|
August - 21 | 11,122 | 11,196 | 12,417 |
|---|
September - 21 | 11,087 | 11,187 | 12,309 |
|---|
October - 21 | 11,053 | 11,151 | 12,306 |
|---|
November - 21 | 11,039 | 11,141 | 12,342 |
|---|
December - 21 | 11,027 | 11,124 | 12,311 |
|---|
January - 22 | 10,926 | 11,045 | 12,045 |
|---|
February - 22 | 10,869 | 10,995 | 11,911 |
|---|
March - 22 | 10,748 | 10,846 | 11,580 |
|---|
April - 22 | 10,649 | 10,786 | 11,141 |
|---|
May - 22 | 10,704 | 10,852 | 11,213 |
|---|
June - 22 | 10,628 | 10,777 | 11,037 |
|---|
July - 22 | 10,727 | 10,834 | 11,306 |
|---|
August - 22 | 10,629 | 10,747 | 10,987 |
|---|
September - 22 | 10,489 | 10,615 | 10,512 |
|---|
October - 22 | 10,479 | 10,601 | 10,376 |
|---|
November - 22 | 10,581 | 10,689 | 10,758 |
|---|
December - 22 | 10,600 | 10,710 | 10,709 |
|---|
January - 23 | 10,681 | 10,798 | 11,039 |
|---|
February - 23 | 10,607 | 10,717 | 10,753 |
|---|
March - 23 | 10,736 | 10,872 | 11,026 |
|---|
April - 23 | 10,774 | 10,909 | 11,093 |
|---|
May - 23 | 10,748 | 10,877 | 10,972 |
|---|
June - 23 | 10,744 | 10,833 | 10,933 |
|---|
July - 23 | 10,785 | 10,879 | 10,926 |
|---|
August - 23 | 10,802 | 10,919 | 10,856 |
|---|
September - 23 | 10,797 | 10,913 | 10,580 |
|---|
October - 23 | 10,817 | 10,948 | 10,413 |
|---|
November - 23 | 10,928 | 11,075 | 10,884 |
|---|
December - 23 | 11,019 | 11,208 | 11,301 |
|---|
January - 24 | 11,067 | 11,253 | 11,270 |
|---|
February - 24 | 11,045 | 11,214 | 11,111 |
|---|
March - 24 | 11,091 | 11,259 | 11,213 |
|---|
April - 24 | 11,070 | 11,221 | 10,930 |
|---|
May - 24 | 11,142 | 11,303 | 11,116 |
|---|
June - 24 | 11,189 | 11,366 | 11,221 |
|---|
July - 24 | 11,286 | 11,501 | 11,483 |
|---|
August - 24 | 11,361 | 11,606 | 11,648 |
|---|
September - 24 | 11,434 | 11,702 | 11,804 |
|---|
October - 24 | 11,393 | 11,635 | 11,511 |
|---|
November - 24 | 11,443 | 11,674 | 11,633 |
|---|
|
| Average Annual Return [Table Text Block] |
Annual Average Total Return | 1 Year | 5 Year | 10 Year |
|---|
Sextant Short-Term Bond | 4.71% | 1.23% | 1.36% |
|---|
Bloomberg US Aggregate 1-3 Year Index
| 5.41% | 1.53% | 1.56% |
|---|
Bloomberg US Aggregate Bond Index
| 6.88% | -0.01% | 1.52% |
|---|
|
| AssetsNet |
$ 12,544,555
|
| Holdings Count | Holding |
35
|
| Advisory Fees Paid, Amount |
$ 26,681
|
| InvestmentCompanyPortfolioTurnover |
23.00%
|
| Additional Fund Statistics [Text Block] |
Total Net Assets | $12,544,555 |
|---|
# of Portfolio Holdings | 35 |
|---|
Advisory Fees Paid | $26,681 |
|---|
Portfolio Turnover Rate | 23% |
|---|
|
| Holdings [Text Block] |
Government | 40.1% | Financials | 16.1% | Utilities | 7.0% | Communications | 6.3% | Consumer Staples | 5.2% | Technology | 4.9% | Consumer Discretionary | 4.1% | Materials | 2.4% | Industrials | 1.6% | Health Care | 1.2% | Other Assets (net of liabilities) | 11.1% |
|
| Largest Holdings [Text Block] |
United States Treasury Bond (6.125% due 08/15/2029) | 8.2% | United States Treasury Note (2.625% due 12/31/2025) | 5.9% | United States Treasury Note (2.250% due 08/15/2027) | 5.7% | United States Treasury Note (2.375% due 05/15/2027) | 5.0% | United States Treasury Bond (1.500% due 02/15/2025) | 4.7% | Florida Power & Light (2.850% due 04/1/2025) | 3.3% | Federal Farm Credit Bank (4.800% due 11/13/2029) | 3.2% | United States Treasury Note (2.875% due 04/30/2025) | 3.2% | Bank of America (3.500% due 04/19/2026) | 3.1% | Koninklijke KPN (8.375% due 10/1/2030) | 2.8% |
|
| Material Fund Change [Text Block] |
|
| Updated Prospectus Phone Number |
1-800-728-8762
|
| C000153268 |
|
| Shareholder Report [Line Items] |
|
| Fund Name |
Saturna Sustainable Bond Fund
|
| Class Name |
SUSTAINABLE BOND
|
| Trading Symbol |
SEBFX
|
| Annual or Semi-Annual Statement [Text Block] |
This Annual Shareholder Report contains important information about the Saturna Sustainable Bond Fund for the period of December 1, 2023 to November 30, 2024.
|
| Shareholder Report Annual or Semi-Annual |
Annual Shareholder Report
|
| Additional Information [Text Block] |
You can find additional information about the Fund at www.saturna.com/sustainable/bond-fund. You can also request this information by contacting us at 1-800-728-8762 or investorservices@saturna.com.
|
| Additional Information Phone Number |
1-800-728-8762
|
| Additional Information Email |
<span style="box-sizing: border-box; color: rgb(68, 68, 68); display: inline; flex-wrap: nowrap; font-size: 10.6667px; font-weight: 400; grid-area: auto; line-height: 16px; margin: 0px; overflow: visible; text-align: left;">investorservices@saturna.com</span>
|
| Additional Information Website |
<span style="box-sizing: border-box; color: rgb(68, 68, 68); display: inline; flex-wrap: nowrap; font-size: 10.6667px; font-weight: 400; grid-area: auto; line-height: 16px; margin: 0px; overflow: visible; text-align: left;">www.saturna.com/sustainable/bond-fund</span>
|
| Expenses [Text Block] |
What were the Fund’s costs for the last year? (Based on a hypothetical $10,000 investment) Class Name | Cost of a $10,000 Investment | Cost Paid as a % of a $10,000 Investment |
|---|
Sustainable Bond | $66 | 0.65% |
|---|
|
| Expenses Paid, Amount |
$ 66
|
| Expense Ratio, Percent |
0.65%
|
| Factors Affecting Performance [Text Block] |
How did the Fund perform over the last year? For the year-to-date ended November 30, 2024, the Saturna Sustainable Bond Fund returned 0.11%. The FTSE World Broad Investment-Grade Bond Index returned 0.69%. The Fund reported a 30-day yield of 4.30%. The Saturna Sustainable Bond Fund portfolio held 44 securities, excluding cash, as of November 30, 2024. For the same period, the Fund reported an effective duration of 4.72 years, reflecting an increase from 2.80 years as of May 31, 2024. The FTSE World Broad Investment-Grade Bond Index reported an effective duration of 6.57 years. The Fund extended its duration to lock in higher yields with the expectation of further benchmark rate reductions. This comes during an interest rate environment characterized by higher rates and the Federal Reserve's Open Market Committee lowering of benchmark rates. As of November 30, 2024, Saturna Sustainable Bond Fund held 59.93% of its assets in US dollar-denominated securities, followed by 13.01% in euro-denominated securities, and 6.32% in Canadian dollar-denominated securities. The Fund retained a currency weighting of 5.75% to the Colombian peso, 5.10% to the Mexican peso, 4.08% to the British pound, 2.91% to the Brazilian real, and 2.90% to the Australian dollar. In contrast, the FTSE World Broad Investment-Grade Bond Index had 53.16% of its portfolio in the US dollar, 27.87% in the euro, and 5.98% in Japanese yen. |
| Line Graph [Table Text Block] |
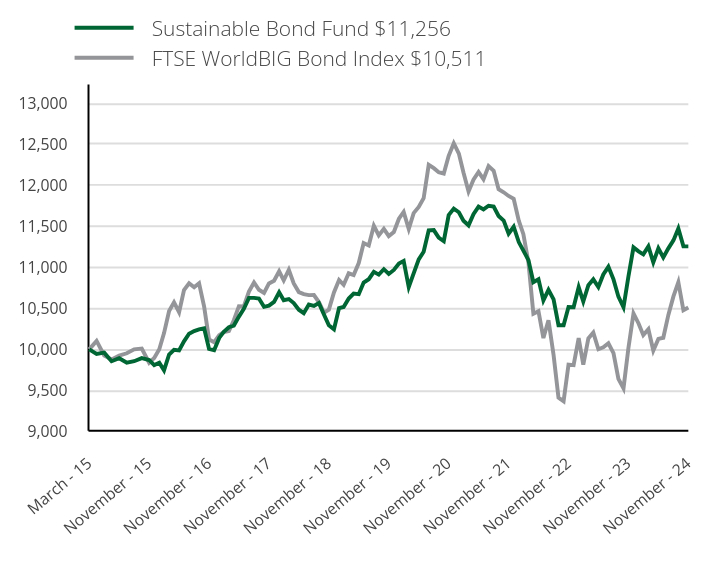 | Sustainable Bond Fund $11,256 | FTSE WorldBIG Bond Index $10,511 |
|---|
March - 15 | 10,000 | 10,000 |
|---|
April - 15 | 9,945 | 10,103 |
|---|
May - 15 | 9,960 | 9,926 |
|---|
June - 15 | 9,856 | 9,878 |
|---|
July - 15 | 9,893 | 9,924 |
|---|
August - 15 | 9,839 | 9,953 |
|---|
September - 15 | 9,856 | 10,001 |
|---|
October - 15 | 9,894 | 10,009 |
|---|
November - 15 | 9,871 | 9,838 |
|---|
December - 15 | 9,809 | 9,896 |
|---|
January - 16 | 9,837 | 10,002 |
|---|
February - 16 | 9,744 | 10,199 |
|---|
March - 16 | 9,938 | 10,468 |
|---|
April - 16 | 9,996 | 10,574 |
|---|
May - 16 | 9,988 | 10,453 |
|---|
June - 16 | 10,099 | 10,724 |
|---|
July - 16 | 10,191 | 10,807 |
|---|
August - 16 | 10,224 | 10,757 |
|---|
September - 16 | 10,244 | 10,806 |
|---|
October - 16 | 10,257 | 10,521 |
|---|
November - 16 | 10,006 | 10,122 |
|---|
December - 16 | 9,990 | 10,088 |
|---|
January - 17 | 10,140 | 10,173 |
|---|
February - 17 | 10,214 | 10,212 |
|---|
March - 17 | 10,271 | 10,223 |
|---|
April - 17 | 10,291 | 10,355 |
|---|
May - 17 | 10,400 | 10,527 |
|---|
June - 17 | 10,496 | 10,524 |
|---|
July - 17 | 10,628 | 10,704 |
|---|
August - 17 | 10,628 | 10,816 |
|---|
September - 17 | 10,621 | 10,727 |
|---|
October - 17 | 10,519 | 10,688 |
|---|
November - 17 | 10,534 | 10,804 |
|---|
December - 17 | 10,579 | 10,838 |
|---|
January - 18 | 10,696 | 10,952 |
|---|
February - 18 | 10,600 | 10,842 |
|---|
March - 18 | 10,614 | 10,971 |
|---|
April - 18 | 10,565 | 10,804 |
|---|
May - 18 | 10,484 | 10,699 |
|---|
June - 18 | 10,442 | 10,674 |
|---|
July - 18 | 10,547 | 10,662 |
|---|
August - 18 | 10,531 | 10,663 |
|---|
September - 18 | 10,566 | 10,578 |
|---|
October - 18 | 10,425 | 10,449 |
|---|
November - 18 | 10,293 | 10,485 |
|---|
December - 18 | 10,244 | 10,695 |
|---|
January - 19 | 10,503 | 10,847 |
|---|
February - 19 | 10,517 | 10,788 |
|---|
March - 19 | 10,621 | 10,928 |
|---|
April - 19 | 10,680 | 10,907 |
|---|
May - 19 | 10,673 | 11,053 |
|---|
June - 19 | 10,816 | 11,298 |
|---|
July - 19 | 10,856 | 11,268 |
|---|
August - 19 | 10,946 | 11,508 |
|---|
September - 19 | 10,912 | 11,390 |
|---|
October - 19 | 10,978 | 11,470 |
|---|
November - 19 | 10,920 | 11,381 |
|---|
December - 19 | 10,969 | 11,431 |
|---|
January - 20 | 11,047 | 11,594 |
|---|
February - 20 | 11,079 | 11,676 |
|---|
March - 20 | 10,760 | 11,468 |
|---|
April - 20 | 10,927 | 11,662 |
|---|
May - 20 | 11,097 | 11,737 |
|---|
June - 20 | 11,191 | 11,844 |
|---|
July - 20 | 11,452 | 12,250 |
|---|
August - 20 | 11,455 | 12,210 |
|---|
September - 20 | 11,363 | 12,161 |
|---|
October - 20 | 11,319 | 12,145 |
|---|
November - 20 | 11,637 | 12,361 |
|---|
December - 20 | 11,717 | 12,514 |
|---|
January - 21 | 11,672 | 12,388 |
|---|
February - 21 | 11,570 | 12,157 |
|---|
March - 21 | 11,513 | 11,926 |
|---|
April - 21 | 11,650 | 12,069 |
|---|
May - 21 | 11,741 | 12,163 |
|---|
June - 21 | 11,707 | 12,075 |
|---|
July - 21 | 11,752 | 12,236 |
|---|
August - 21 | 11,741 | 12,179 |
|---|
September - 21 | 11,627 | 11,954 |
|---|
October - 21 | 11,570 | 11,916 |
|---|
November - 21 | 11,411 | 11,871 |
|---|
December - 21 | 11,496 | 11,836 |
|---|
January - 22 | 11,309 | 11,570 |
|---|
February - 22 | 11,204 | 11,405 |
|---|
March - 22 | 11,088 | 11,059 |
|---|
April - 22 | 10,820 | 10,434 |
|---|
May - 22 | 10,855 | 10,465 |
|---|
June - 22 | 10,598 | 10,138 |
|---|
July - 22 | 10,726 | 10,356 |
|---|
August - 22 | 10,610 | 9,932 |
|---|
September - 22 | 10,295 | 9,412 |
|---|
October - 22 | 10,295 | 9,367 |
|---|
November - 22 | 10,517 | 9,815 |
|---|
December - 22 | 10,514 | 9,808 |
|---|
January - 23 | 10,760 | 10,137 |
|---|
February - 23 | 10,584 | 9,813 |
|---|
March - 23 | 10,784 | 10,134 |
|---|
April - 23 | 10,854 | 10,205 |
|---|
May - 23 | 10,760 | 10,002 |
|---|
June - 23 | 10,913 | 10,025 |
|---|
July - 23 | 11,007 | 10,075 |
|---|
August - 23 | 10,854 | 9,954 |
|---|
September - 23 | 10,643 | 9,641 |
|---|
October - 23 | 10,514 | 9,526 |
|---|
November - 23 | 10,889 | 10,018 |
|---|
December - 23 | 11,244 | 10,439 |
|---|
January - 24 | 11,195 | 10,316 |
|---|
February - 24 | 11,159 | 10,174 |
|---|
March - 24 | 11,256 | 10,245 |
|---|
April - 24 | 11,061 | 9,986 |
|---|
May - 24 | 11,232 | 10,128 |
|---|
June - 24 | 11,122 | 10,142 |
|---|
July - 24 | 11,232 | 10,421 |
|---|
August - 24 | 11,329 | 10,646 |
|---|
September - 24 | 11,475 | 10,819 |
|---|
October - 24 | 11,256 | 10,477 |
|---|
November - 24 | 11,256 | 10,511 |
|---|
|
| Average Annual Return [Table Text Block] |
Annual Average Total Return | 1 Year | 5 Year | Since Inception |
|---|
Sustainable Bond | 3.36% | 0.61% | 1.23% |
|---|
FTSE WorldBIG Bond Index
| 4.92% | -1.58% | 0.47% |
|---|
|
| AssetsNet |
$ 36,291,467
|
| Holdings Count | Holding |
44
|
| Advisory Fees Paid, Amount |
$ 134,373
|
| InvestmentCompanyPortfolioTurnover |
25.00%
|
| Additional Fund Statistics [Text Block] |
Total Net Assets | $36,291,467 |
|---|
# of Portfolio Holdings | 44 |
|---|
Advisory Fees Paid | $134,373 |
|---|
Portfolio Turnover Rate | 25% |
|---|
|
| Holdings [Text Block] |
United States | 21.5% | United Arab Emirates | 11.9% | Germany | 9.8% | United Kingdom | 7.9% | Finland | 6.9% | Canada | 6.1% | Netherlands | 5.2% | France | 4.6% | Brazil | 3.2% | Singapore | 3.0% | Other Countries | 19.9% |
|
| Largest Holdings [Text Block] |
State Street (Quarterly US LIBOR plus 100) (6.552% due 06/15/2047) | 4.8% | AXA (5.125% due 01/17/2027) | 4.6% | Munich RE (1.000% due 05/26/2042) | 4.4% | First Abu Dhabi Bank PJSC (5.125% due 10/13/2027) | 4.2% | United Utilities (6.875% due 08/15/2028) | 4.1% | Canadian Imperial Bank (4.375% due 10/28/2080) | 4.1% | Int'l Bk Recon & Develop (5.000% due 10/7/2026) | 3.5% | MAF Global Securities (7.875% due PERP) | 3.4% | Natura Cosmeticos SA (4.125% due 05/3/2028) | 3.2% | Starbucks (2.450% due 06/15/2026) | 3.2% |
|
| Material Fund Change [Text Block] |
|
| Updated Prospectus Phone Number |
1-800-728-8762
|
| C000153267 |
|
| Shareholder Report [Line Items] |
|
| Fund Name |
Saturna Sustainable Equity Fund
|
| Class Name |
SUSTAINABLE EQUITY
|
| Trading Symbol |
SEEFX
|
| Annual or Semi-Annual Statement [Text Block] |
This Annual Shareholder Report contains important information about the Saturna Sustainable Equity Fund for the period of December 1, 2023 to November 30, 2024.
|
| Shareholder Report Annual or Semi-Annual |
Annual Shareholder Report
|
| Additional Information [Text Block] |
You can find additional information about the Fund at www.saturna.com/sustainable/equity-fund. You can also request this information by contacting us at 1-800-728-8762 or investorservices@saturna.com.
|
| Additional Information Phone Number |
1-800-728-8762
|
| Additional Information Email |
<span style="box-sizing: border-box; color: rgb(68, 68, 68); display: inline; flex-wrap: nowrap; font-size: 10.6667px; font-weight: 400; grid-area: auto; line-height: 16px; margin: 0px; overflow: visible; text-align: left;">investorservices@saturna.com</span>
|
| Additional Information Website |
<span style="box-sizing: border-box; color: rgb(68, 68, 68); display: inline; flex-wrap: nowrap; font-size: 10.6667px; font-weight: 400; grid-area: auto; line-height: 16px; margin: 0px; overflow: visible; text-align: left;">www.saturna.com/sustainable/equity-fund</span>
|
| Expenses [Text Block] |
What were the Fund’s costs for the last year? (Based on a hypothetical $10,000 investment) Class Name | Cost of a $10,000 Investment | Cost Paid as a % of a $10,000 Investment |
|---|
Sustainable Equity | $82 | 0.75% |
|---|
|
| Expenses Paid, Amount |
$ 82
|
| Expense Ratio, Percent |
0.75%
|
| Factors Affecting Performance [Text Block] |
How did the Fund perform over the last year? For the fiscal year ended November 30, 2024, the Saturna Sustainable Equity Fund rose 18.80%, trailing the S&P Global 1200 Index which returned 27.63%. The Morningstar Global Large-Stock Blend category returned 22.97% for the same period. The greatest contributors to underperformance were relative underweights to the US and the financial sector, as well as a cash overweight. Domestic equities outperformed their foreign counterparts as US economic growth remains resilient, outpacing trends and most of the globe. While US politics feature plenty of bombast, such uncertainty is a global fixture. 2024 was the year of the challenger as incumbents fared poorly. We highlight politics as a realm whose importance is rivaled by its unpredictability. Much ink is spilled attempting to forecast policies and their possible consequences — intended or otherwise. We believe predictions are risks, and as always, we focus on allocating capital to quality companies poised to adapt to changing circumstances. Considering possible futures is paramount to our role as stewards of your capital. Believing we can accurately forecast the future is antithetical to it. In equity investing, uncertainty is opportunity. We realigned the portfolio in October and November, selling less adaptable companies and allocating to more resilient ones. In October, we sold Legrand, Lululemon, and Reckitt Benckiser. We added Broadcom, Fuji Electric, Dollarama, and Canadian Pacific Kansas City. Fuji Electric is a top industrial power supply company in Japan benefitting from near-shoring and grid modernization. Broadcom is an infrastructure software and semiconductor company whose networking silicon and chip design prowess allow hyperscalers to train and deploy ever-larger artificial intelligence models. Dollarama is Canada's leading dollar store, selling affordable everyday essentials to households pressured by rising living costs. Canadian Pacific Kansas City operates critical railways connecting the US, Canada, and Mexico. Demographic and near-shoring realities necessitate closer economic ties between these three countries, despite ongoing political threats. In November, we sold Lowe's, Kenvue, and Haleon and added Linde — whose services reduce the carbon intensity of industrial activities — and renewable energy generator NextEra Energy. |
| Line Graph [Table Text Block] |
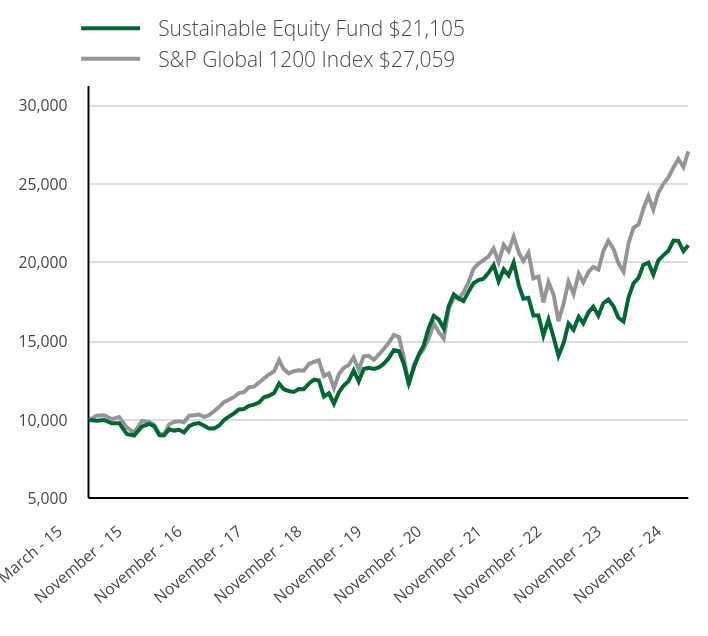 | Sustainable Equity Fund $21,105 | S&P Global 1200 Index $27,059 |
|---|
March - 15 | 10,000 | 10,000 |
|---|
April - 15 | 9,960 | 10,279 |
|---|
May - 15 | 10,000 | 10,304 |
|---|
June - 15 | 9,790 | 10,060 |
|---|
July - 15 | 9,800 | 10,196 |
|---|
August - 15 | 9,118 | 9,531 |
|---|
September - 15 | 9,018 | 9,193 |
|---|
October - 15 | 9,579 | 9,925 |
|---|
November - 15 | 9,759 | 9,874 |
|---|
December - 15 | 9,599 | 9,703 |
|---|
January - 16 | 9,047 | 9,146 |
|---|
February - 16 | 9,017 | 9,082 |
|---|
March - 16 | 9,408 | 9,720 |
|---|
April - 16 | 9,328 | 9,881 |
|---|
May - 16 | 9,378 | 9,927 |
|---|
June - 16 | 9,208 | 9,852 |
|---|
July - 16 | 9,609 | 10,273 |
|---|
August - 16 | 9,749 | 10,308 |
|---|
September - 16 | 9,810 | 10,351 |
|---|
October - 16 | 9,629 | 10,186 |
|---|
November - 16 | 9,459 | 10,320 |
|---|
December - 16 | 9,462 | 10,566 |
|---|
January - 17 | 9,654 | 10,836 |
|---|
February - 17 | 9,987 | 11,130 |
|---|
March - 17 | 10,219 | 11,284 |
|---|
April - 17 | 10,410 | 11,455 |
|---|
May - 17 | 10,673 | 11,706 |
|---|
June - 17 | 10,703 | 11,770 |
|---|
July - 17 | 10,905 | 12,084 |
|---|
August - 17 | 10,975 | 12,121 |
|---|
September - 17 | 11,106 | 12,384 |
|---|
October - 17 | 11,449 | 12,643 |
|---|
November - 17 | 11,540 | 12,895 |
|---|
December - 17 | 11,711 | 13,085 |
|---|
January - 18 | 12,310 | 13,805 |
|---|
February - 18 | 11,955 | 13,231 |
|---|
March - 18 | 11,843 | 12,964 |
|---|
April - 18 | 11,782 | 13,104 |
|---|
May - 18 | 11,975 | 13,154 |
|---|
June - 18 | 11,955 | 13,131 |
|---|
July - 18 | 12,300 | 13,559 |
|---|
August - 18 | 12,564 | 13,696 |
|---|
September - 18 | 12,514 | 13,797 |
|---|
October - 18 | 11,487 | 12,795 |
|---|
November - 18 | 11,700 | 12,962 |
|---|
December - 18 | 11,036 | 12,016 |
|---|
January - 19 | 11,775 | 12,935 |
|---|
February - 19 | 12,185 | 13,301 |
|---|
March - 19 | 12,472 | 13,491 |
|---|
April - 19 | 13,149 | 13,985 |
|---|
May - 19 | 12,452 | 13,179 |
|---|
June - 19 | 13,241 | 14,045 |
|---|
July - 19 | 13,323 | 14,079 |
|---|
August - 19 | 13,241 | 13,817 |
|---|
September - 19 | 13,334 | 14,146 |
|---|
October - 19 | 13,580 | 14,521 |
|---|
November - 19 | 13,929 | 14,902 |
|---|
December - 19 | 14,452 | 15,407 |
|---|
January - 20 | 14,370 | 15,273 |
|---|
February - 20 | 13,596 | 14,022 |
|---|
March - 20 | 12,329 | 12,215 |
|---|
April - 20 | 13,287 | 13,478 |
|---|
May - 20 | 14,153 | 14,084 |
|---|
June - 20 | 14,741 | 14,491 |
|---|
July - 20 | 15,854 | 15,173 |
|---|
August - 20 | 16,617 | 16,131 |
|---|
September - 20 | 16,390 | 15,593 |
|---|
October - 20 | 15,813 | 15,165 |
|---|
November - 20 | 17,235 | 17,046 |
|---|
December - 20 | 17,977 | 17,808 |
|---|
January - 21 | 17,729 | 17,669 |
|---|
February - 21 | 17,553 | 18,122 |
|---|
March - 21 | 18,142 | 18,750 |
|---|
April - 21 | 18,691 | 19,600 |
|---|
May - 21 | 18,887 | 19,932 |
|---|
June - 21 | 18,980 | 20,161 |
|---|
July - 21 | 19,353 | 20,400 |
|---|
August - 21 | 19,839 | 20,902 |
|---|
September - 21 | 18,804 | 20,031 |
|---|
October - 21 | 19,570 | 21,128 |
|---|
November - 21 | 19,187 | 20,726 |
|---|
December - 21 | 20,007 | 21,645 |
|---|
January - 22 | 18,560 | 20,643 |
|---|
February - 22 | 17,706 | 20,093 |
|---|
March - 22 | 17,769 | 20,625 |
|---|
April - 22 | 16,645 | 18,993 |
|---|
May - 22 | 16,645 | 19,104 |
|---|
June - 22 | 15,354 | 17,468 |
|---|
July - 22 | 16,384 | 18,757 |
|---|
August - 22 | 15,260 | 17,974 |
|---|
September - 22 | 14,084 | 16,280 |
|---|
October - 22 | 14,885 | 17,386 |
|---|
November - 22 | 16,124 | 18,782 |
|---|
December - 22 | 15,727 | 18,002 |
|---|
January - 23 | 16,557 | 19,293 |
|---|
February - 23 | 16,147 | 18,746 |
|---|
March - 23 | 16,840 | 19,387 |
|---|
April - 23 | 17,198 | 19,721 |
|---|
May - 23 | 16,630 | 19,553 |
|---|
June - 23 | 17,418 | 20,717 |
|---|
July - 23 | 17,649 | 21,385 |
|---|
August - 23 | 17,229 | 20,863 |
|---|
September - 23 | 16,494 | 19,959 |
|---|
October - 23 | 16,252 | 19,423 |
|---|
November - 23 | 17,765 | 21,201 |
|---|
December - 23 | 18,686 | 22,212 |
|---|
January - 24 | 19,025 | 22,417 |
|---|
February - 24 | 19,853 | 23,410 |
|---|
March - 24 | 19,991 | 24,227 |
|---|
April - 24 | 19,227 | 23,370 |
|---|
May - 24 | 20,139 | 24,440 |
|---|
June - 24 | 20,458 | 24,986 |
|---|
July - 24 | 20,744 | 25,408 |
|---|
August - 24 | 21,402 | 26,047 |
|---|
September - 24 | 21,381 | 26,574 |
|---|
October - 24 | 20,723 | 26,059 |
|---|
November - 24 | 21,105 | 27,059 |
|---|
|
| Average Annual Return [Table Text Block] |
Annual Average Total Return | 1 Year | 5 Year | Since Inception |
|---|
Sustainable Equity | 18.80% | 8.67% | 8.00% |
|---|
S&P Global 1200 Index
| 27.63% | 12.66% | 10.81% |
|---|
|
| AssetsNet |
$ 25,180,488
|
| Holdings Count | Holding |
45
|
| Advisory Fees Paid, Amount |
$ 120,369
|
| InvestmentCompanyPortfolioTurnover |
19.00%
|
| Additional Fund Statistics [Text Block] |
Total Net Assets | $25,180,488 |
|---|
# of Portfolio Holdings | 45 |
|---|
Advisory Fees Paid | $120,369 |
|---|
Portfolio Turnover Rate | 19% |
|---|
|
| Holdings [Text Block] |
United States | 34.1% | Japan | 8.4% | France | 8.0% | Netherlands | 7.0% | Switzerland | 6.5% | United Kingdom | 6.4% | Canada | 4.7% | Denmark | 4.3% | Ireland | 4.2% | Taiwan | 3.9% | Other Countries | 12.5% |
|
| Largest Holdings [Text Block] |
Nvidia | 5.5% | Novo Nordisk ADR | 4.3% | Taiwan Semiconductor ADR | 3.9% | Schneider Electric ADR | 3.5% | Wolters Kluwer | 3.3% | Nintendo ADR | 3.3% | Apple | 2.9% | Eli Lilly | 2.9% | Assa Abloy ADR | 2.7% | ServiceNow | 2.7% |
|
| Material Fund Change [Text Block] |
|
| Updated Prospectus Phone Number |
1-800-728-8762
|