Pay Versus Performance Disclosure
As required by Section 953(a) of the Dodd-Frank Wall Street Reform and Consumer Protection Act of 2010 and Rule 402(v) of Regulation S-K, we are providing the following information regarding the relationship between executive compensation actually paid ("CAP") to our principal executive officer ("PEO") and our non-PEO named executive officers ("Non-PEO NEOs") and certain financial performance of the Company.
Amounts included as CAP do not represent the value of cash compensation and equity awards actually received by our PEO and Non-PEO NEOs but instead are amounts calculated pursuant to Commission rules and which result in adjustments to the amounts reported above in the summary compensation table. For further information concerning the Company's pay-for-performance philosophy and how we seek to align executive compensation with performance, refer to “Executive Compensation.” Our Compensation Committee did not consider the following Pay Versus Performance analysis and disclosures in making compensation decisions with respect to any fiscal year shown below.
Pay Versus Performance Table
Fiscal Year |
|
Summary |
|
Compensation |
|
Summary |
|
Compensation |
|
Average |
|
Average |
|
Value of Initial |
|
Net (Loss) |
|
||||||||||||||||||||||||||||||
|
|
|
|
|
|
|
|
|
|
|
|
|
|
|
|
|
|
|
|
|
|
|
|
|
|
|
|
|
|
|
|
|
|
|
|
|
|
|
|
||||||||
|
|
|
|
|
|
|
|
|
|
|
|
|
|
|
|
|
|
|
|
|
|
|
|
|
|
|
|
|
|
|
|
|
|
|
|
|
|
|
|
||||||||
|
|
|
|
|
|
|
|
|
|
|
|
|
|
|
|
|
|
|
|
|
|
|
|
|
|
|
|
|
|
|
|
|
|
|
|
|
|
|
|
||||||||
2025 |
|
|
$ |
5,352,066 |
|
|
|
|
$ |
7,071,945 |
|
|
|
|
$ |
— |
|
|
|
|
$ |
— |
|
|
|
|
$ |
1,063,825 |
|
|
|
|
$ |
1,204,957 |
|
|
|
|
$ |
184.91 |
|
|
|
|
$ |
18,685,000 |
|
2024 |
|
|
$ |
737,445 |
|
|
|
|
$ |
805,641 |
|
|
|
|
$ |
795,876 |
|
|
|
|
$ |
839,093 |
|
|
|
|
$ |
585,006 |
|
|
|
|
$ |
625,550 |
|
|
|
|
$ |
75.76 |
|
|
|
|
$ |
16,313,000 |
|
2023 |
|
|
$ |
803,267 |
|
|
|
|
$ |
664,603 |
|
|
|
|
$ |
— |
|
|
|
|
$ |
— |
|
|
|
|
$ |
635,177 |
|
|
|
|
$ |
556,471 |
|
|
|
|
$ |
54.97 |
|
|
|
|
$ |
(6,670,000 |
) |
|
|
|
|
|
|
|
|
|
|
|
|
|
|
|
|
|
|
|
|
|
|
|
|
|
|
|
|
|
|
|
|
|
|
|
|
|
|
|
|
||||||||
|
|
|
|
|
|
|
|
|
|
|
|
|
|
|
|
|
|
|
|
|
|
|
|
|
|
|
|
|
|
|
|
|
|
|
|
|
|
|
|
||||||||
|
|
|
|
|
|
|
|
|
|
|
|
|
|
|
|
|
|
|
|
|
|
|
|
|
|
|
|
|
|
|
|
|
|
|
|
|
|
|
|
||||||||
Fiscal Year |
|
First PEO |
|
Second PEO |
|
Non-PEO Named Executive Officers |
|
|
|
|
|
|
|
|
|
|
|
|
|
|
|
|
|
|
|
|
|
2025 |
|
Jennifer Slater |
|
N/A |
|
Matthew Pauli, Rolando Guillot |
2024 |
|
Frank Krejci |
|
Rolando Guillot |
|
Richard Messina, Al-Waleed Hamdan |
2023 |
|
Frank Krejci |
|
N/A |
|
Patrick Hansen, Rolando Guillot, Richard Messina |
|
|
|
|
|
|
|
|
|
|
|
|
|
|
|
|
|
|
|
|
|
|
|
2025 |
|
2024 |
|
2023 |
|
||||||||||||||||||||||||||||||||||
|
|
|
|
||||||||||||||||||||||||||||||||||||||
|
|
|
|
|
|
|
|
|
|
|
|
|
|
|
|
|
|
|
|
|
|
|
|
|
|
|
|
|
|
|
|
|
|
|
|||||||
|
|
|
|
|
|
|
|
|
|
|
|
|
|
|
|
|
|
|
|
|
|
|
|
|
|
|
|
|
|
|
|
|
|
|
|||||||
|
|
First PEO ($) |
|
Average for |
|
First PEO ($) |
|
Second |
|
Average for |
|
First PEO ($) |
|
Average for |
|
||||||||||||||||||||||||||
|
|
|
|
|
|
|
|
|
|
|
|
|
|
|
|
|
|
|
|
|
|
|
|
|
|
|
|
|
|
|
|
|
|
|
|||||||
|
|
|
|
|
|
|
|
|
|
|
|
|
|
|
|
|
|
|
|
|
|
|
|
|
|
|
|
|
|
|
|
|
|
|
|||||||
|
|
|
|
|
|
|
|
|
|
|
|
|
|
|
|
|
|
|
|
|
|
|
|
|
|
|
|
|
|
|
|
|
|
|
|||||||
Summary Compensation Table Total: |
|
|
$ |
5,352,066 |
|
|
|
|
$ |
1,063,825 |
|
|
|
|
$ |
737,445 |
|
|
|
|
$ |
795,876 |
|
|
|
|
$ |
585,006 |
|
|
|
|
$ |
803,267 |
|
|
|
|
$ |
635,177 |
|
|
|
|
|
|
|
|
|
|
|
|
|
|
|
|
|
|
|
|
|
|
|
|
|
|
|
|
|
|
|
|
|
|
|
|
|||||||
Adjustments: |
|
|
|
|
|
|
|
|
|
|
|
|
|
|
|
|
|
|
|
|
|
|
|
|
|
|
|
|
|
|
|
|
|
|
|||||||
|
|
|
|
|
|
|
|
|
|
|
|
|
|
|
|
|
|
|
|
|
|
|
|
|
|
|
|
|
|
|
|
|
|
|
|||||||
Deduction for Amounts Reported in the “Stock Awards” Column in the Summary Compensation Table: |
|
|
$ |
(2,804,248 |
) |
|
|
|
$ |
(207,736 |
) |
|
|
|
$ |
(113,016 |
) |
|
|
|
$ |
(76,452 |
) |
|
|
|
$ |
(69,804 |
) |
|
|
|
$ |
(154,734 |
) |
|
|
|
$ |
(62,197 |
) |
|
|
|
|
|
|
|
|
|
|
|
|
|
|
|
|
|
|
|
|
|
|
|
|
|
|
|
|
|
|
|
|
|
|
|
|||||||
Increase for fair value of awards granted during the covered fiscal year that vested during the covered fiscal year: |
|
|
|
— |
|
|
|
|
|
— |
|
|
|
|
$ |
129,234 |
|
|
|
|
|
— |
|
|
|
|
|
— |
|
|
|
|
|
— |
|
|
|
|
|
— |
|
|
|
|
|
|
|
|
|
|
|
|
|
|
|
|
|
|
|
|
|
|
|
|
|
|
|
|
|
|
|
|
|
|
|
|
|||||||
Increase for fair value of awards granted during the covered fiscal year that remain outstanding and unvested as of the covered fiscal year end: |
|
|
$ |
4,524,127 |
|
|
|
|
$ |
263,637 |
|
|
|
|
|
— |
|
|
|
|
$ |
86,250 |
|
|
|
|
$ |
78,750 |
|
|
|
|
$ |
92,514 |
|
|
|
|
$ |
38,094 |
|
|
|
|
|
|
|
|
|
|
|
|
|
|
|
|
|
|
|
|
|
|
|
|
|
|
|
|
|
|
|
|
|
|
|
|
|||||||
Increase (deduction) for year-over-year change in fair value at covered fiscal year end of awards granted in any prior fiscal year that were outstanding and unvested at the covered fiscal year end: |
|
|
|
— |
|
|
|
|
$ |
62,135 |
|
|
|
|
|
— |
|
|
|
|
$ |
23,324 |
|
|
|
|
$ |
19,208 |
|
|
|
|
$ |
(75,786 |
) |
|
|
|
$ |
(44,580 |
) |
|
|
|
|
|
|
|
|
|
|
|
|
|
|
|
|
|
|
|
|
|
|
|
|
|
|
|
|
|
|
|
|
|
|
|
|||||||
Increase (deduction) for change in vesting date fair value of awards granted during the prior fiscal years that vested during the covered fiscal year compared to fair value of awards of prior fiscal year end: |
|
|
|
— |
|
|
|
|
$ |
23,096 |
|
|
|
|
$ |
51,978 |
|
|
|
|
$ |
10,095 |
|
|
|
|
$ |
12,390 |
|
|
|
|
$ |
(658 |
) |
|
|
|
$ |
(10,023 |
) |
|
|
|
|
|
|
|
|
|
|
|
|
|
|
|
|
|
|
|
|
|
|
|
|
|
|
|
|
|
|
|
|
|
|
|
|||||||
Total Adjustments: |
|
|
$ |
1,719,879 |
|
|
|
|
$ |
141,132 |
|
|
|
|
$ |
68,196 |
|
|
|
|
$ |
43,217 |
|
|
|
|
$ |
40,544 |
|
|
|
|
$ |
(138,664 |
) |
|
|
|
$ |
(78,706 |
) |
|
|
|
|
|
|
|
|
|
|
|
|
|
|
|
|
|
|
|
|
|
|
|
|
|
|
|
|
|
|
|
|
|
|
|
|||||||
Compensation Actually Paid: |
|
|
$ |
7,071,945 |
|
|
|
|
$ |
1,204,957 |
|
|
|
|
$ |
805,641 |
|
|
|
|
$ |
839,093 |
|
|
|
|
$ |
625,550 |
|
|
|
|
$ |
664,603 |
|
|
|
|
$ |
556,471 |
|
|
|
|
|
|
|
|
|
|
|
|
|
|
|
|
|
|
|
|
|
|
|
|
|
|
|
|
|
|
|
|
|
|
|
|
|||||||
|
|
|
|
|
|
|
|
|
|
|
|
|
|
|
|
|
|
|
|
|
|
|
|
|
|
|
|
|
|
|
|
|
|
|
|||||||
|
|
|
|
|
|
|
|
|
|
|
|
|
|
|
|
|
|
|
|
|
|
|
|
|
|
|
|
|
|
|
|
|
|
|
|||||||
|
|
2025 |
|
2024 |
|
2023 |
|
||||||||||||||||||||||||||||||||||
|
|
|
|
||||||||||||||||||||||||||||||||||||||
|
|
|
|
|
|
|
|
|
|
|
|
|
|
|
|
|
|
|
|
|
|
|
|
|
|
|
|
|
|
|
|
|
|
|
|||||||
|
|
|
|
|
|
|
|
|
|
|
|
|
|
|
|
|
|
|
|
|
|
|
|
|
|
|
|
|
|
|
|
|
|
|
|||||||
|
|
First PEO ($) |
|
Average for |
|
First PEO ($) |
|
Second |
|
Average for |
|
First PEO ($) |
|
Average for |
|
||||||||||||||||||||||||||
|
|
|
|
|
|
|
|
|
|
|
|
|
|
|
|
|
|
|
|
|
|
|
|
|
|
|
|
|
|
|
|
|
|
|
|||||||
|
|
|
|
|
|
|
|
|
|
|
|
|
|
|
|
|
|
|
|
|
|
|
|
|
|
|
|
|
|
|
|
|
|
|
|||||||
|
|
|
|
|
|
|
|
|
|
|
|
|
|
|
|
|
|
|
|
|
|
|
|
|
|
|
|
|
|
|
|
|
|
|
|||||||
Summary Compensation Table Total: |
|
|
$ |
5,352,066 |
|
|
|
|
$ |
1,063,825 |
|
|
|
|
$ |
737,445 |
|
|
|
|
$ |
795,876 |
|
|
|
|
$ |
585,006 |
|
|
|
|
$ |
803,267 |
|
|
|
|
$ |
635,177 |
|
|
|
|
|
|
|
|
|
|
|
|
|
|
|
|
|
|
|
|
|
|
|
|
|
|
|
|
|
|
|
|
|
|
|
|
|||||||
Adjustments: |
|
|
|
|
|
|
|
|
|
|
|
|
|
|
|
|
|
|
|
|
|
|
|
|
|
|
|
|
|
|
|
|
|
|
|||||||
|
|
|
|
|
|
|
|
|
|
|
|
|
|
|
|
|
|
|
|
|
|
|
|
|
|
|
|
|
|
|
|
|
|
|
|||||||
Deduction for Amounts Reported in the “Stock Awards” Column in the Summary Compensation Table: |
|
|
$ |
(2,804,248 |
) |
|
|
|
$ |
(207,736 |
) |
|
|
|
$ |
(113,016 |
) |
|
|
|
$ |
(76,452 |
) |
|
|
|
$ |
(69,804 |
) |
|
|
|
$ |
(154,734 |
) |
|
|
|
$ |
(62,197 |
) |
|
|
|
|
|
|
|
|
|
|
|
|
|
|
|
|
|
|
|
|
|
|
|
|
|
|
|
|
|
|
|
|
|
|
|
|||||||
Increase for fair value of awards granted during the covered fiscal year that vested during the covered fiscal year: |
|
|
|
— |
|
|
|
|
|
— |
|
|
|
|
$ |
129,234 |
|
|
|
|
|
— |
|
|
|
|
|
— |
|
|
|
|
|
— |
|
|
|
|
|
— |
|
|
|
|
|
|
|
|
|
|
|
|
|
|
|
|
|
|
|
|
|
|
|
|
|
|
|
|
|
|
|
|
|
|
|
|
|||||||
Increase for fair value of awards granted during the covered fiscal year that remain outstanding and unvested as of the covered fiscal year end: |
|
|
$ |
4,524,127 |
|
|
|
|
$ |
263,637 |
|
|
|
|
|
— |
|
|
|
|
$ |
86,250 |
|
|
|
|
$ |
78,750 |
|
|
|
|
$ |
92,514 |
|
|
|
|
$ |
38,094 |
|
|
|
|
|
|
|
|
|
|
|
|
|
|
|
|
|
|
|
|
|
|
|
|
|
|
|
|
|
|
|
|
|
|
|
|
|||||||
Increase (deduction) for year-over-year change in fair value at covered fiscal year end of awards granted in any prior fiscal year that were outstanding and unvested at the covered fiscal year end: |
|
|
|
— |
|
|
|
|
$ |
62,135 |
|
|
|
|
|
— |
|
|
|
|
$ |
23,324 |
|
|
|
|
$ |
19,208 |
|
|
|
|
$ |
(75,786 |
) |
|
|
|
$ |
(44,580 |
) |
|
|
|
|
|
|
|
|
|
|
|
|
|
|
|
|
|
|
|
|
|
|
|
|
|
|
|
|
|
|
|
|
|
|
|
|||||||
Increase (deduction) for change in vesting date fair value of awards granted during the prior fiscal years that vested during the covered fiscal year compared to fair value of awards of prior fiscal year end: |
|
|
|
— |
|
|
|
|
$ |
23,096 |
|
|
|
|
$ |
51,978 |
|
|
|
|
$ |
10,095 |
|
|
|
|
$ |
12,390 |
|
|
|
|
$ |
(658 |
) |
|
|
|
$ |
(10,023 |
) |
|
|
|
|
|
|
|
|
|
|
|
|
|
|
|
|
|
|
|
|
|
|
|
|
|
|
|
|
|
|
|
|
|
|
|
|||||||
Total Adjustments: |
|
|
$ |
1,719,879 |
|
|
|
|
$ |
141,132 |
|
|
|
|
$ |
68,196 |
|
|
|
|
$ |
43,217 |
|
|
|
|
$ |
40,544 |
|
|
|
|
$ |
(138,664 |
) |
|
|
|
$ |
(78,706 |
) |
|
|
|
|
|
|
|
|
|
|
|
|
|
|
|
|
|
|
|
|
|
|
|
|
|
|
|
|
|
|
|
|
|
|
|
|||||||
Compensation Actually Paid: |
|
|
$ |
7,071,945 |
|
|
|
|
$ |
1,204,957 |
|
|
|
|
$ |
805,641 |
|
|
|
|
$ |
839,093 |
|
|
|
|
$ |
625,550 |
|
|
|
|
$ |
664,603 |
|
|
|
|
$ |
556,471 |
|
|
|
|
|
|
|
|
|
|
|
|
|
|
|
|
|
|
|
|
|
|
|
|
|
|
|
|
|
|
|
|
|
|
|
|
|||||||
|
|
|
|
|
|
|
|
|
|
|
|
|
|
|
|
|
|
|
|
|
|
|
|
|
|
|
|
|
|
|
|
|
|
|
|||||||
|
|
|
|
|
|
|
|
|
|
|
|
|
|
|
|
|
|
|
|
|
|
|
|
|
|
|
|
|
|
|
|
|
|
|
|||||||
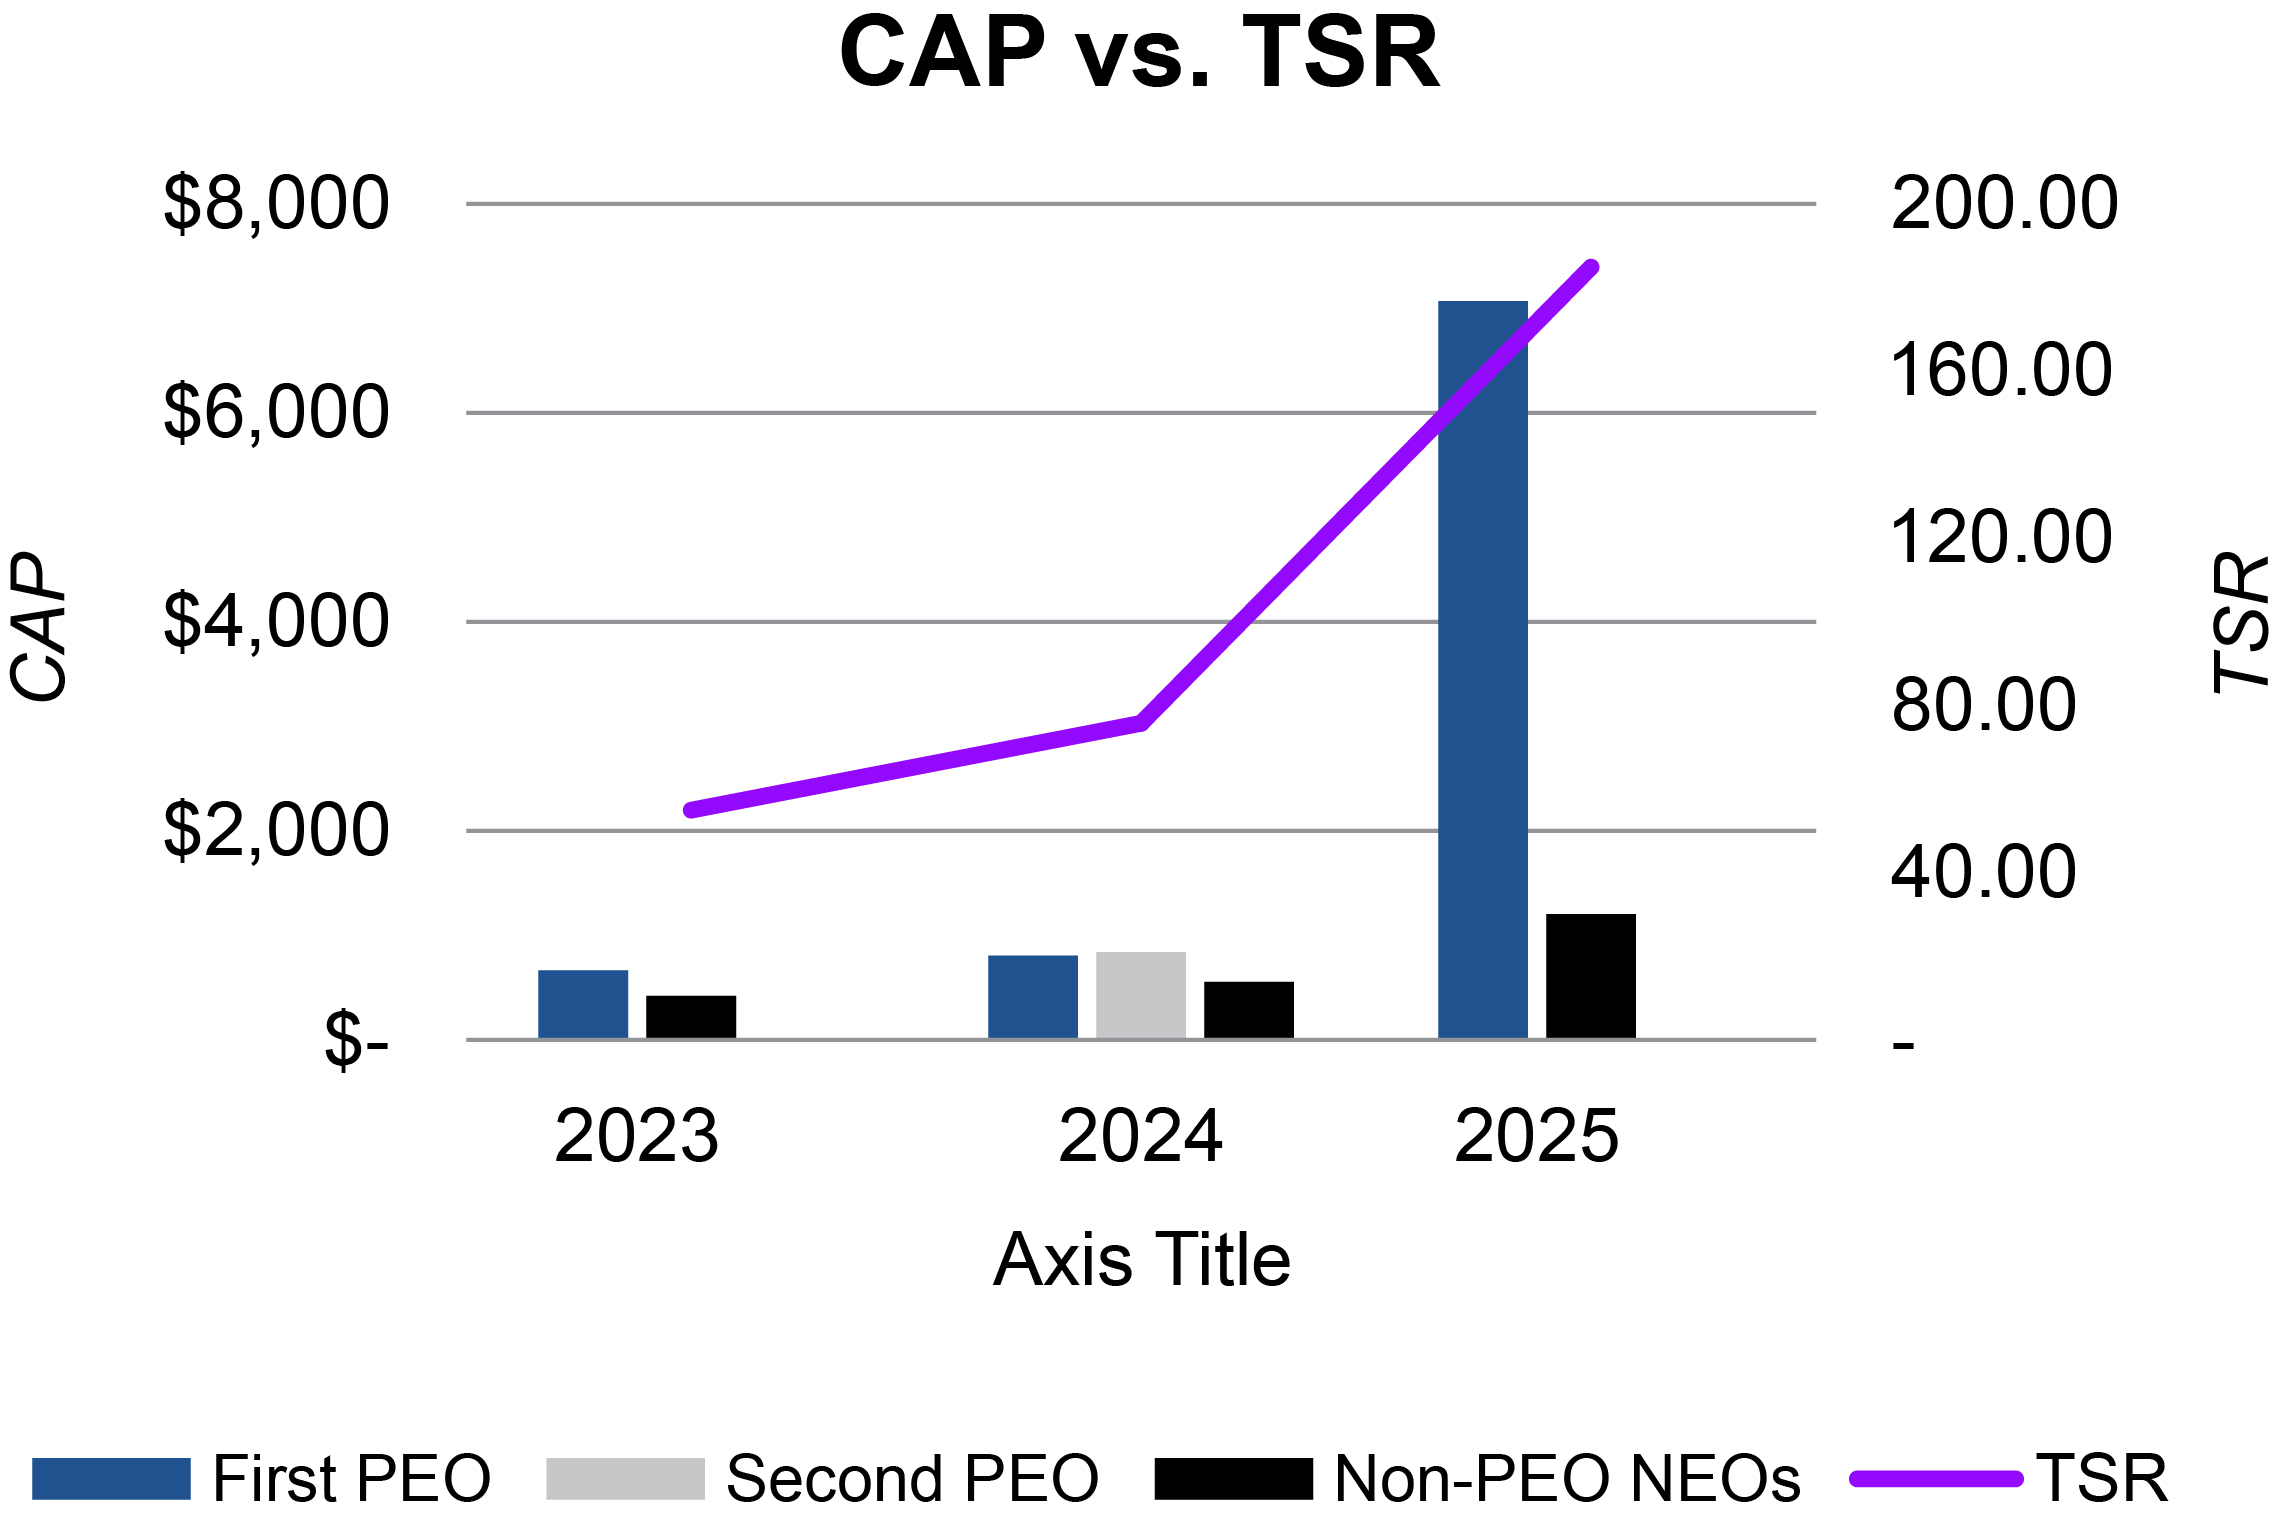
Compensation Actually Paid and Cumulative TSR:
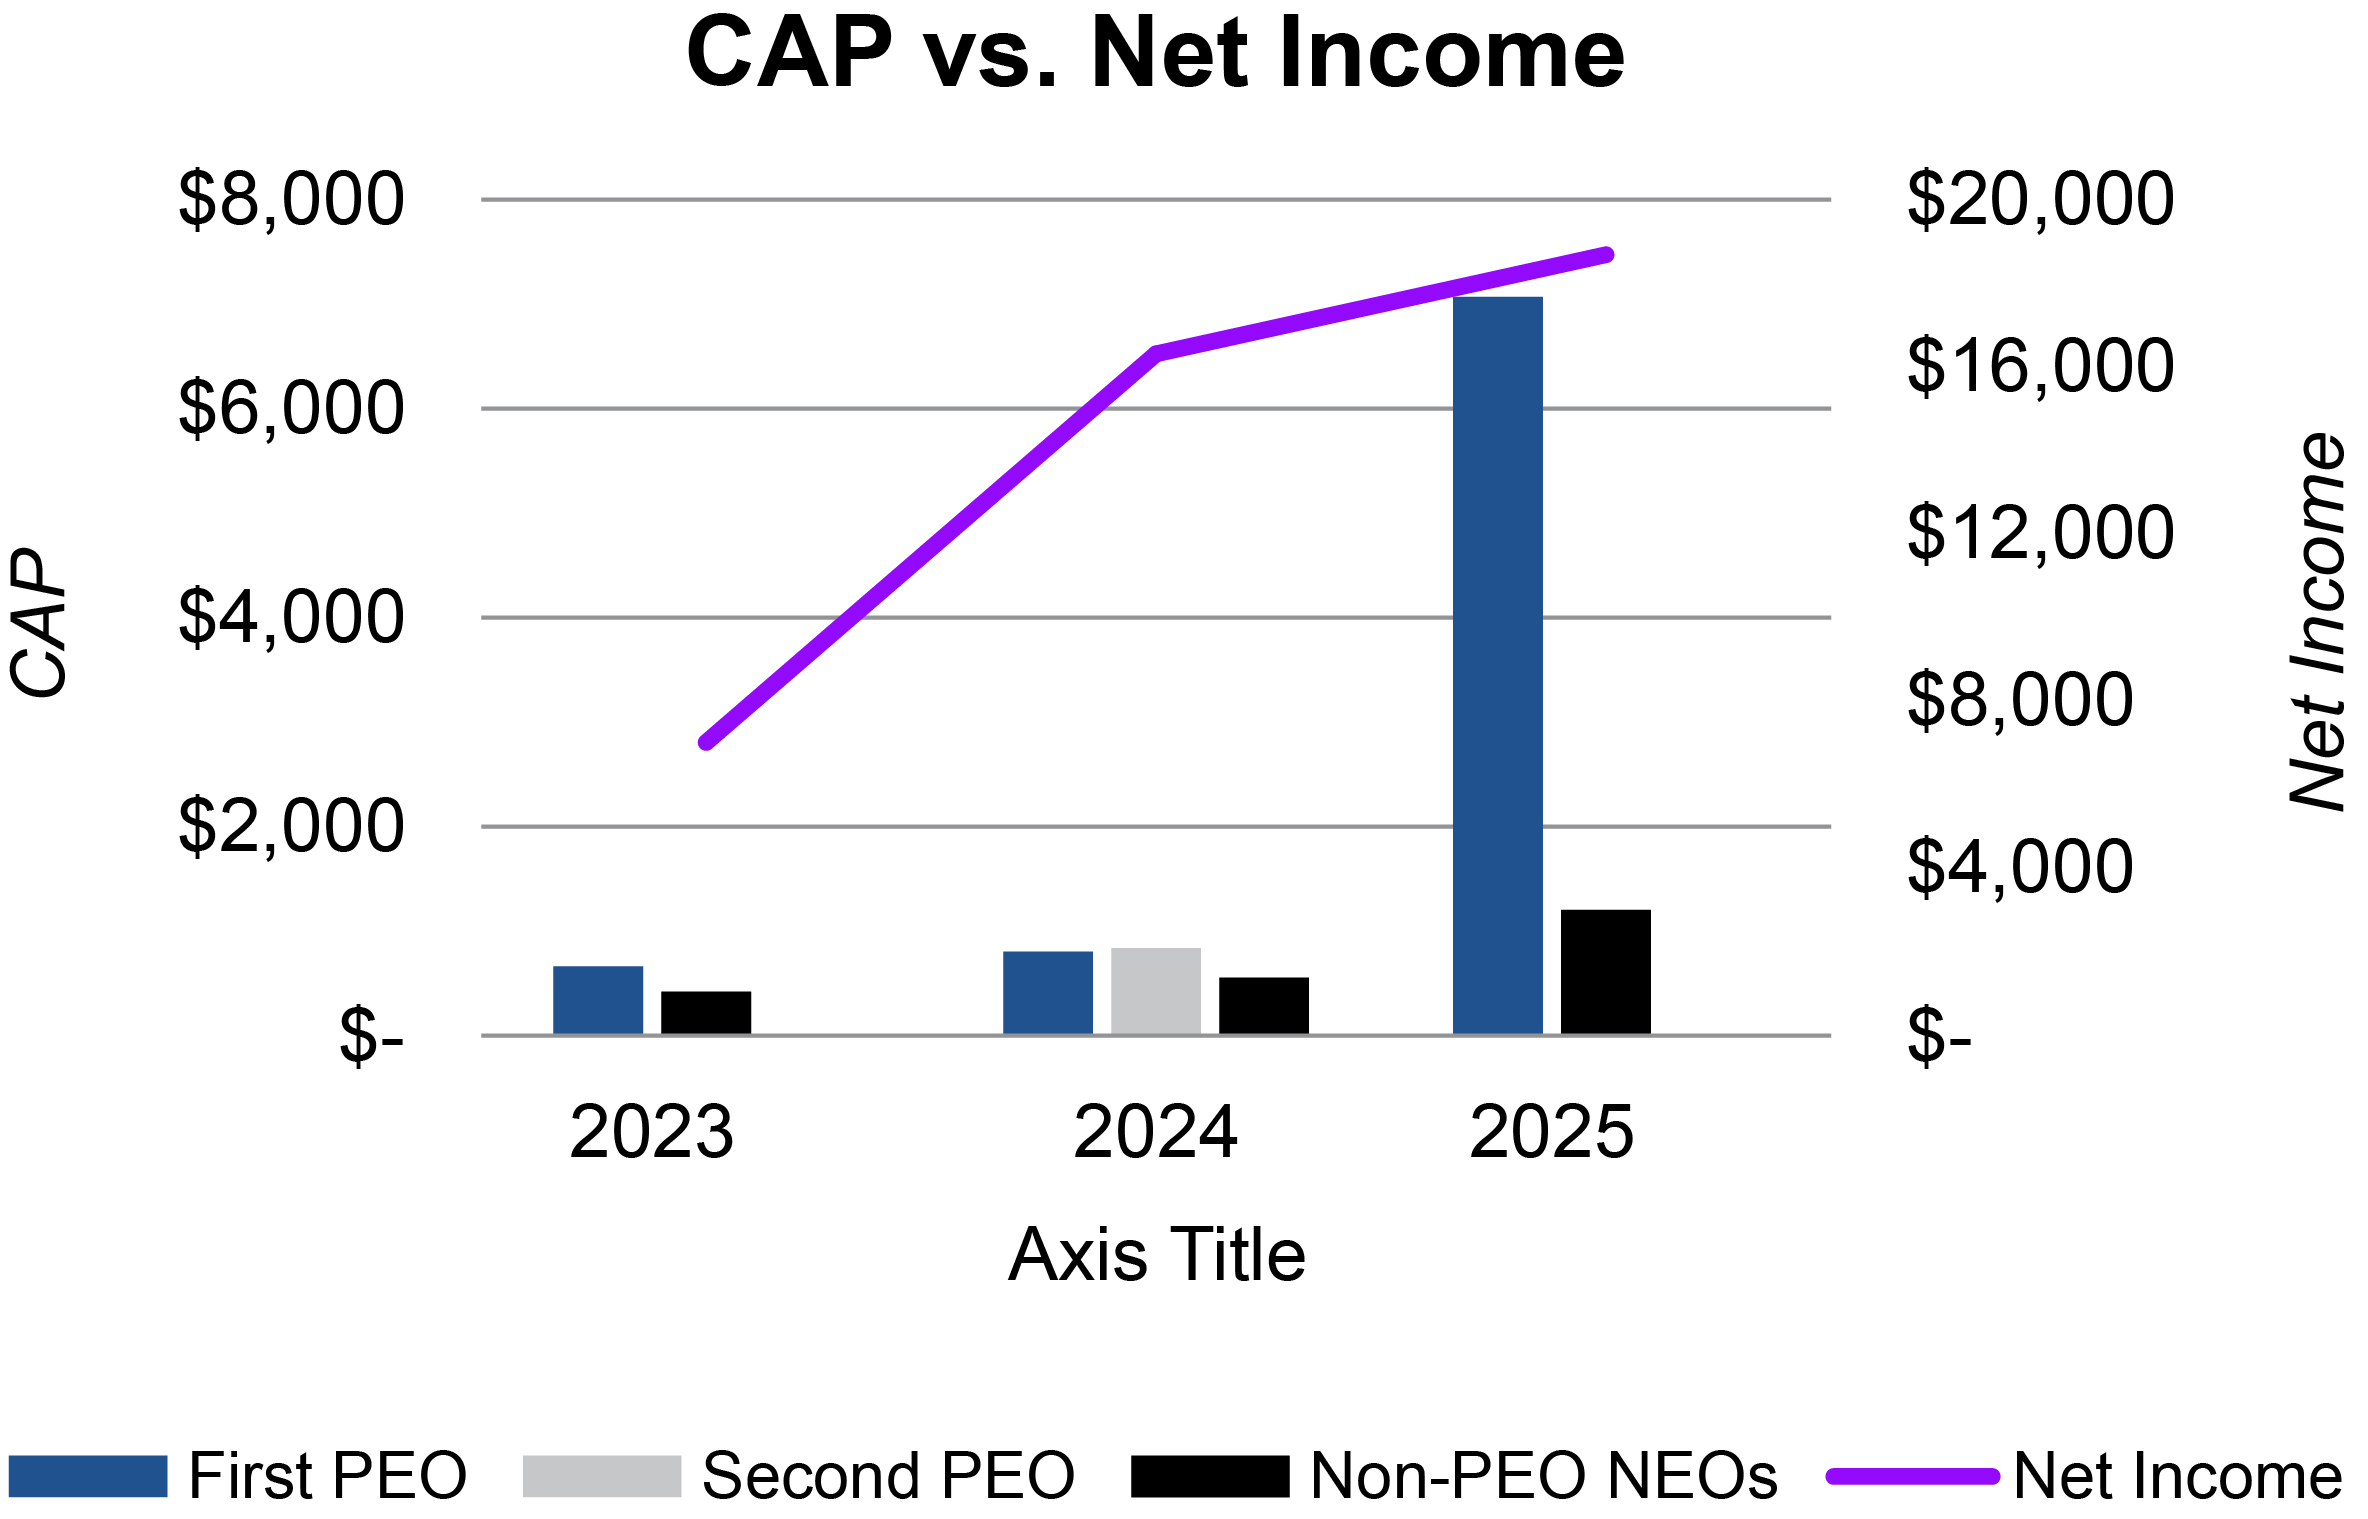
Compensation Actually Paid and Net (Loss) Income: