Exhibit 99.2

OPERATING AND FINANCIAL REVIEW AND PROSPECTS

You should read the following discussion and analysis of results of operations, financial condition and prospects of Freightos Limited (referred to as “Freightos”, “the Company”, “our company”, “we”, “us” and similar terms) together with (i) our interim unaudited consolidated financial statements for the six months ended June 30, 2025, included as Exhibit 99.1 to the Report of Foreign Private Issuer on Form 6-K (the “Report”) to which this Operating and Financial Review and Prospects is attached, and (ii) our audited consolidated financial statements and the related notes for the year ended December 31, 2024 appearing in our Annual Report on Form 20-F for the year ended December 31, 2024, filed with the Securities and Exchange Commission (the “SEC”) on March 24, 2025 (our “Annual Report”) and “Item 5 – Operating and Financial Review and Prospects” of that Annual Report. This discussion contains forward-looking statements that reflect our plans, estimates and beliefs that involve risks and uncertainties. As a result of many factors, such as those set forth under the “Risk Factors” and “Cautionary Note Regarding Forward-Looking Statements” sections of our Annual Report, our actual results may differ materially from those anticipated in these forward-looking statements.

Overview

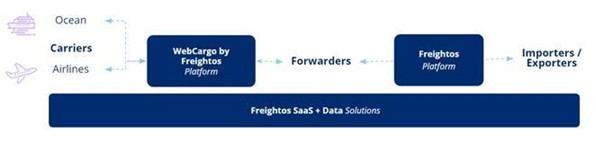
Our mission is to expand trade among the people of the world, making global trade more efficient and transparent by streamlining air, ocean and land freight pricing and booking across carriers, freight forwarders, importers and exporters on the world’s digital freight platform.

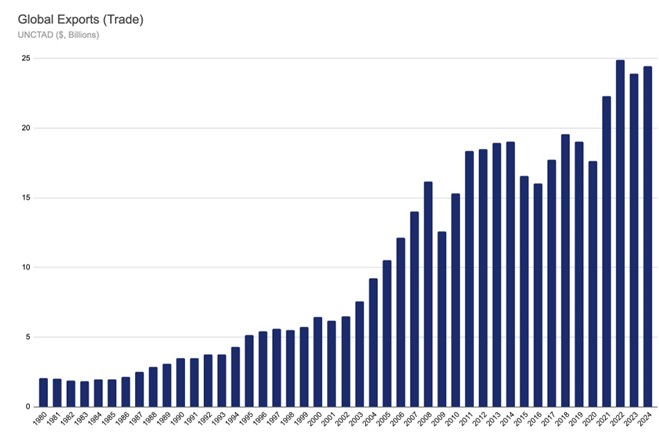
We operate a leading, vendor-neutral booking and payment platform for international freight, spanning air, ocean and ground. Our Platform supports supply chain efficiency and agility by enabling real-time procurement of ocean and air shipping across more than ten thousand importers/exporters, thousands of freight forwarders, and dozens of airlines and ocean carriers. According to the United Nations Conference on Trade and Development (“UNCTAD”), the value of goods traded internationally reached an estimated $24.4 trillion in 2024, representing approximately 22% of global gross domestic product (“GDP”). International trade is facilitated by the third-party logistics market, which, according to logistics research firm Armstrong & Associates, generated 1.22 trillion dollars in revenue in 2024, exceeding pre-pandemic numbers by some 25%.

Despite its size and importance, global freight has not yet undergone a comprehensive digital transformation. Unlike passenger travel, hotels and retail, cross-border freight services remain largely offline, opaque and inefficient. Most international air and ocean shipments involve multiple intermediaries, often with as many as 30 actors and 100 people, communicating across time zones. These manual processes, replicated hundreds of thousands of times each day, typically result in delays, non-binding and inconsistent pricing, and uncertain transit times. Even on major trade lanes, such as Asia to the United States, our research shows that - even in 2024 - it is common for importers/exporters to wait several days for a spot price quote, and prices often vary by tens of percentage points. Actual prices and transit times are usually not guaranteed and are unpredictable.

The consequences of this dysfunction flow through international freight, supply chains and, ultimately, businesses and consumers everywhere. As a result, consumers pay more for goods, businesses experience reduced margins, and goods remain under or overstocked. The environment also suffers from this lack of efficiency; according to the International Air Transport Association (“IATA”), air cargo holds in 2024 were only 46% utilized - more than half empty.

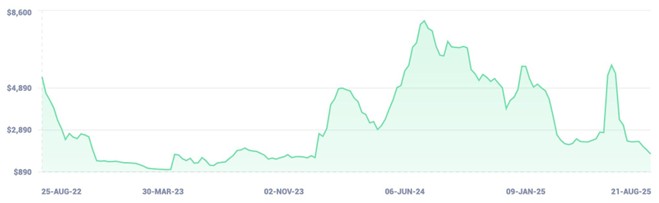
These inefficiencies are amplified by persistent volatility impacting the global trade environment. These impact factors can range from global wars, like the Russia-Ukraine conflict that changed air routes or the shutdown of the Red Sea by Houthi terrorists, “trade wars”, like that experienced in 2025, pandemics and natural disasters. Without fully deployed digitalization - we estimate that even in the air cargo spot market - a relatively advanced market when it comes to digital adoption - less than 10% of bookings are booked through digital platforms and well over half of capacity is booked offline. As a result,supply chains are unable to respond to stressors in an agile and cost-effective manner.

We operate our business in two segments. In our Platform segment, we connect Buyers and Sellers of freight services to provide digitalized price quoting, booking, payments and basic shipment management - the sellers are typically carriers or forwarders while buyers can be carriers, forwarders, or importers and exporters (sometimes referred to as “shippers”). In our Solutions segment, we provide software tools and data to help industry participants automate their pricing, sales and procurement processes. In addition to driving significant value for companies around the world, our SaaS products encourage adoption of our Platform. Other companies that have successfully deployed SaaS-enabled marketplace strategies include OpenTable, Zenefits and Carta.

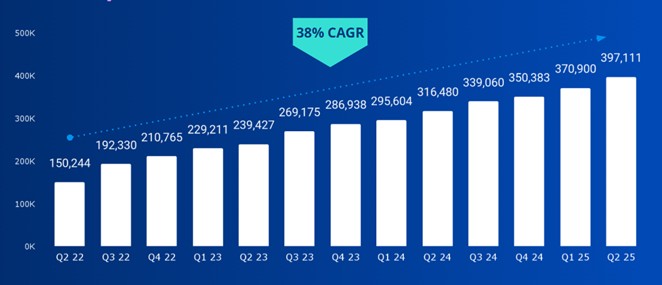
Given the size, complexity and conservatism of the international freight industry, it took us a decade to achieve direct digital connections with multiple layers of the industry: carriers, freight forwarders (who are analogous to sophisticated travel agents for goods) and importers/exporters. Around 2020, we achieved a critical mass of airlines offering digital connections, and our Platform reached an inflection point. Since then, we have achieved rapid growth of our gross booking value (“GBV”, also referred to by some as “GMV”), which is equal to the total value of freight services and related services purchased on our Platform. In most cases, freight


services are purchased by importers/exporters or by freight forwarders (as purchasers of services, “Buyers”) from carriers or freight forwarders (as sellers of services, “Sellers”) who meet, transact and often pay each other on our Platform.

Our growth in the number of transactions is illustrated by the following graphic (in thousands):

Graphic

After several years of consistent and predictable rapid transaction growth, we believe we are well positioned to maintain our accelerated growth trajectory and establish ourselves as a leading platform in the years to come. We also believe that our deep technology, multi-modal support and broad network that uniquely spans carriers, forwarders and shippers, provided us with a first mover advantage in the industry and allowed us to distinguish ourselves from our competitors. As the only vendor-neutral, end-to-end digital booking platform, connecting carriers, forwarders and importers/exporters for air and ocean freight, we are uniquely positioned to lead the international freight industry through a digital transformation that has already begun to gain momentum.

Our Business Model and Revenue Sources

Our Platform is a three-sided marketplace, digitally connecting freight carriers (primarily airlines, and also ocean liners and trucking companies), freight forwarders and importers/exporters. We also provide Solutions including software as a service (“SaaS”) and market intelligence data to help market participants automate and optimize their buying, pricing and selling processes. As more market participants use our Platform, we are able to drive increased efficiencies throughout the highly-fragmented international freight industry.

Graphic

We derive most of our revenue from (1) transaction fees and service fees through our Platform segment and (2) subscriptions and professional service fees through our Solutions segment, which includes SaaS solutions as well as market intelligence data offerings such as price indexes. As of the date of this Operating and Financial Review and Prospects, the majority of our revenue is generated from our Solutions segment, but we anticipate that, driven by marketplace growth dynamics and increased monetization across a growing suite of features, our Platform segment will in the long term grow more quickly than our Solutions segment and eventually become our main source of revenue.

Recent Acquisition

In August 2024, we acquired all of the shares of Shipsta S.à r.l. (“Shipsta”), a leading freight tender procurement platform used by dozens of Global 1000 enterprises to procure freight at scale from leading freight forwarders and carriers. The acquisition was financed through a combination of cash and equity. The consideration included a cash payment of approximately €4.5 million and the


issuance of approximately 640 thousand Freightos Ordinary Shares to a key Shipsta shareholder, subject to adjustment for working capital, and customary holdbacks.

Segment Reporting

We operate under two segments, Platform and Solutions.

Platform Segment

In our Platform segment, we generate revenue from facilitating transactions between Buyers and Sellers on our Platform based on flat fees per transaction and/or fees that are a percentage of transaction value. In addition to freight services, certain ancillary services offered by Sellers, such as insurance and customs brokerage, generate additional revenue. These services often have higher margins than freight services allowing us to generate a higher fee for introducing Buyers. In certain Platform transactions, with respect to U.S. and Canadian customs brokerage transactions only, a Freightos company is the Seller, while in all other cases the Seller is a third party. Buyers typically pay for access to, and the ability to compare, prices, shipping options and historical performance across multiple Sellers. Our services save Buyers time and money with instant freight quoting, convenient online payments through our payment processing partners, and online booking and management tools.

Our Platform revenue has evolved as our Platform grows and matures. In certain cases, Sellers may utilize our Platform without charge for a limited period of time or benefit from other special arrangements. Platform revenue is generally derived either as a flat fee per transaction or as a percentage of booking value. Overall, our operational Platform revenue take rate ranges from zero to approximately 10% of booking value, with an average of approximately 1% during the first half of 2025.

Solutions Segment

In our Solutions segment, we generate revenue through our software-as-a-service offerings, which are typically recurring subscriptions priced per user or per site per month or year, depending on the type of product or based on a negotiated global license. This segment also includes subscriptions to our data products, called Freightos Terminal, such as FBX, FAX, contract benchmarking, route-level pricing intelligence and more, which are priced per unit of time based on the number of users, granularity of data, number of data points and permitted data usage. We also generate some non-recurring revenue, including revenue from professional services, such as engineering, customization and setup and data services for digitizing offline data. SaaS fees are typically collected on a monthly, quarterly or annual basis. Our Freightos Enterprise solution includes Procure - a tendering solution that was acquired in the Shipsta acquisition and will be accounted for in our Solutions segment.

Geography

Given the nature of international shipping, we are an international business. Our Solutions revenue is strongest in Europe and North America. Importer/exporter bookings on our Platform are strongest in the United States, where we also have a customs brokerage solution. The airline bookings on our Platform, which are strongest in Europe and the Middle East air hubs, are now growing fast in the United States. While Asian airlines have been slower to digitize than airlines in Europe, the Middle East and North America, we are working to expand both our business segments on a global basis and have seen recent positive progress, including onboarding multiple Asian airlines.

Key financial and operating metrics

Platform Segment

For our Platform segment, which is effectively a marketplace, we believe that certain KPIs are important to help understand our business. We monitor the KPIs listed in the table below to evaluate our Platform business, measure our performance, identify trends affecting our business, formulate business plans and make strategic decisions.


Q3 2023


Q4 2023


Q1 2024


Q2 2024


Q3 2024


Q4 2024


Q1 2025


Q2 2025

#Transactions

269,175

286,938

295,604

316,480

339,060

350,383

370,900

397,111

GBV (in thousands)

$

160,658

$

187,545

$

192,416

$

203,388

$

217,541

$

280,696

276,084

316,820

#Unique Buyer Users

17,312

17,586

17,992

19,088

19,749

20,131

19,708

20,191

#Carriers

39

45

49

51

55

67

71

75


#Transactions

#Transactions represents the number of bookings for freight services, and related services, placed by Buyers across our Platform with third-party Sellers and with Clearit. Sellers of Transactions include Carriers (that is, airlines, ocean liners and less-than-container load (LCL) consolidators) and also other providers of freight services such as trucking companies, freight forwarders, general sales agents, and air master loaders. The number of Transactions booked on the Platform in any given time period is net of transactions that were canceled prior to the end of the period. Transactions booked on white label portals hosted by Freightos are included if there is a transactional fee associated with them.

Gross Bookings Value

GBV represents the total value of #Transactions, which is the monetary value of freight and related services contracted between Buyers and Sellers on our Platform, plus related fees charged to Buyers and Sellers, and pass-through payments such as duties. GBV is converted to U.S. dollars at the time of each transaction on our Platform. This metric may be similar to what others call gross merchandise value (GMV) or gross services volume (GSV).

#Unique Buyer Users

#Unique Buyer Users represents the number of individual users placing bookings, typically counted based on unique email logins. The number of Buyers, which counts unique customer businesses, does not reflect the fact that some Buyers are large multinational organizations while others are small or midsize businesses. Therefore, we find it more useful to monitor #Unique Buyer Users than the number of Buyer businesses.

#Carriers

#Carriers represents the number of unique air and ocean carriers, mostly airlines who have been sellers of #Transactions. For airlines, we count booking carriers, which include separate airlines within the same carrier group. We do not count dozens of other airlines that operate individual segments of air cargo #Transactions as we do not have a direct booking relationship with them. Carriers include ocean LCL consolidators. In addition, we only count carriers when more than five bookings were placed with them over the course of a quarter.

Solutions Segment

We do not currently utilize supplemental KPIs for our Solutions segment, as we believe revenue provides a good indication of this segment’s performance.

Key Factors Affecting Our Performance

We believe our performance and future success depend on several factors, including those discussed below and in Item 3.D of our Annual Report titled “Risk Factors.”


World Trade and Industry Trends

International freight shipping helps to enable world trade, specifically the exchange of goods between countries. We believe that the size of the total addressable market for our Platform is positively correlated with world trade in goods. Since the early 1940s, world trade has increased dramatically in most decades, but the size of our addressable market could contract if world trade is reduced by recession, trade wars, reshoring/nearshoring and other factors. Historical trends indicate that even following major stressors, such as the 2008 financial crisis, global trade has continued to steadily expand, as presented in the following illustration of the global trade of goods by value, which we created from information available from UNCTAD.

Graphic

Our business is seasonal and as a result, our revenues and profitability fluctuate from quarter to quarter. For example, the third and fourth calendar quarters are typically strong in our industry in the ramp up to the Western peak shopping season, while the first quarter is typically weakest.

Smaller importers/exporters tend to adopt our Platform more readily than larger enterprises. Therefore, our Platform may benefit if niche e-commerce vendors and other SMB importers/exporters continue to flourish, as they have over the past few years, and could potentially be impacted negatively if the industry becomes more consolidated.

We have also observed a trend of more short-term, or spot, bookings for freight services, compared to long-term fixed-price contracts. Our Platform, which focuses on matching Buyers and Sellers for spot transactions, has benefited from this trend.

Carrier Digitalization

Our Platform is highly dependent on the availability of direct digital connections, known as application programming interfaces (“APIs”), to carriers, which enable instant binding price quotes and bookings. To our knowledge, prior to 2018, no air or ocean carriers had APIs for instant quoting and booking against actual capacity, and price quotes were rarely binding. This is now changing rapidly, first in air cargo transportation and, more recently, in ocean freight transportation.

To some extent, we are able to digitalize freight bookings even when carriers are offline by offering services from freight forwarding companies, without specifying the voyage, but our Platform provides better service and will grow faster if the digitalization of carriers continues.


Shipping Costs

Our GBV is impacted by market rates of air and ocean shipping. Some of our Platform revenue is generated as a percentage of GBV and directly impacted when price levels change, whereas the majority of our Platform revenue is generated from flat per-transaction fees and not directly impacted by shipping costs, although it’s still impacted by shipping volumes. We believe that lower market rates may attract more small and medium business importers/exporters to our Platform and may therefore increase the volume of transactions on our Platform, partially offsetting lost GBV and revenue as a result of lower market rates.

The following graphic of our FBX01 index illustrates the volatility of an indicative price for shipping a 40-foot container Trans-Pacific from East Asia to North American West Coast. We view the FBX01 index as a bellwether trade lane. The graph shows clearly the dramatic price increases during the COVID-19 pandemic, the sharp slump due to dropping demand and excess capacity post-COVID, and the sharp increase once again in 2024 due to the Red Sea crisis, which caused increased shipping distances, heightened fuel consumption and rising insurance premiums. As the industry stabilized and tariffs led to reduced shipping, prices abated. Following a brief spike during the U.S. government’s initial tariff pause in April, prices returned to lower levels, reflecting the ability of the industry to adapt to long-term trends.

Graphic

Growth Strategy

We are focused on our long-term Platform potential as measured primarily by Transactions. GBV is a secondary measure of our Platform growth - it shows how much revenue is booked by Buyers with Sellers on our Platform; however it is influenced by fluctuations of freight rates, which are out of our control. We believe that our market opportunity is immense, and we will continue to invest significantly in scaling in order to enhance our growth prospects. Our growth depends, in part, on our users’ experience, and we continue to invest heavily in research and development to create a modern, stable, fast-performing, user-friendly Platform. We intend to continue to invest in sales and marketing. We have also leveraged complementary acquisitions to expand our user base and improve our offerings.

We believe that investments in growth will have a strong positive impact on our long-term financial results. We intend to implement a responsible expenditure strategy, limiting our spending and therefore our negative free cash flow, while maintaining high gross profit margins and a goal to achieve positive free cash flow with the cash reserves on hand. The success of our efforts to enhance our long-term potential may be impacted by our competition. For additional information, see the section titled “Business Overview — Competition” in our Annual Report.

Global Disruptions

The recent uncertainty around US and global tariffs directly impacted the industry causing disruptions in global trade. Moreover, increased tariffs may have a material impact on global trade volumes. In addition, the Red Sea Crisis initially created significant disruption to shipping, including a sharp increase in shipping rates, while subsequently, shipping routes settled down to a new normal, mostly avoiding the Suez Canal with rates temporarily reaching a new balance at a higher rate. The graph of FBX01 demonstrates how the recent “trade war” and tariffs have impacted global freight pricing, with stop-and-go booking behavior. While the impact and persistence of the tariffs still remains to be seen, booking behavior was impacted on a short-term basis following announcements of tariffs or their repeal.

High shipping prices affect our business in a mixed way. While increasing GBV per transaction, and in some cases increasing Platform revenue per Transaction, higher prices likely decrease #Transactions, as some importers/exporters, especially SMBs, are price sensitive. As a result, lower prices typically lead to increased small business bookings.


Operational issues also have a mixed approach on our Platform. On the one hand, any disruption to shipping patterns, due to trade wars, pandemics, strikes, weather, or wars, sends people looking for alternatives, which is good for a marketplace. On the other hand, disruptions negatively impact the overall Buyer experience on our Platform, even if the disruption is totally out of our control.

Rapidly Evolving Technologies

The software market, including the LogTech market, is characterized by rapid technological change, frequent new product introductions, and evolving industry standards, which is being accelerated through the increasing use of artificial intelligence (“AI”) and machine learning. Our future success depends on our ability to continue enhancing our products and services, including through AI integration, to meet rapidly evolving customer demands. As an example, due to increased usage of AI to augment internet search patterns, inbound user registration from smaller businesses may be adversely affected. While we continue to adapt our customer acquisition strategies to address these challenges, these trends could negatively impact our future growth, particularly our ability to attract new small business customers. To date, however, this trend has not materially impacted inbound patterns of qualified users, with inbound new business from small businesses remaining stable.

Components of Our Results of Operations

Revenue

Platform Revenue

Platform revenue reflects fees charged to Buyers and Sellers in relation to transactions executed on our Platform. For bookings conducted by importers/exporters, our fees are typically structured as a percentage of booking value, depending on the mode and nature of the service. When freight forwarders book with carriers, the Sellers often pay a pre-negotiated flat fee per transaction. When Sellers transact with a Buyer who is a new customer to the Seller, we may charge a percentage of the booking value as a fee. When we handle payments for transactions on our Platform, Buyer and Sellers will typically pay a percentage fee for the payment handling.

Clearit customs brokerage fees are reported in our Platform segment. We charge flat fees for customs brokerage through Clearit, depending on the mode and complexity, and may charge additional fees for ancillary services.

Solutions Revenue

Solutions revenue is primarily subscription-based SaaS and data. It is typically priced per user or per site, per time period, with larger customers such as multinational freight forwarders often negotiating flat all- inclusive subscriptions. Revenue from our Solutions segment includes certain non-recurring revenue from services ancillary to our SaaS products, such as engineering, customization, configuration and data services for digitizing offline data. We also recognize revenue from data subscriptions, including subscriptions to FBX and FAX indexes, and market intelligence reports.

Cost of Revenue

Cost of revenue consists primarily of customer service costs, which include salaries of team members directly involved in supporting our Platform and Solutions service delivery, cloud hosting costs, and direct financial costs, such as credit card processing fees and collection costs.

Research and Development Expenses

Research and development expenses consist primarily of personnel-related costs, third-party hosting costs and third-party software expenses related to development. Research and development costs are expensed as incurred. We make significant investments in research and development to create new product features and launch new products. We believe continued investments in research and development are important to achieve our strategic goals. As a result, we expect research and development expenses to increase in future periods.

Selling and Marketing Expenses

Selling and marketing expenses consist primarily of expenses related to personnel-related costs, including sales commissions and travel, which we expense as incurred, and advertising and marketing activities, including external public relations, trade shows, content and search engine optimization service providers. We make significant investments in sales and marketing to grow our business, including finding and acquiring new clients and driving brand awareness.


General and Administrative Expenses

General and administrative expenses consist primarily of personnel-related expenses attributable to our finance, legal, human resources and operations functions. General and administrative expenses also include costs related to outside consulting, legal and accounting services, rent and insurance. We expect to continue to invest in our corporate infrastructure and to incur additional expenses associated with operating as a public company, including legal and accounting costs, investor relations costs, insurance premiums and compliance costs.

Change in fair value of warrants

Change in fair value of warrants consists of changes in the fair value of the Company’s public warrants (the “Freightos Warrants”) that were issued as part of our business combination completed in January 2023 (the “Business Combination”), and are traded under the symbol “CRGOW”.

Finance Income

Finance income consists primarily of interest income on bank deposits and investments, changes in the fair value of certain financial liabilities, hedging income and foreign exchange rate differences, net.

Finance Expenses

Finance expenses consist primarily of hedging expenses, financial expenses on severance provision, interest expense in respect of our lease liabilities and bank charges.

Income Taxes (tax benefit), net

Income taxes consist primarily of income taxes attributable to our subsidiaries in Spain, United States (the “US”) and the Palestinian Authority, which have been profitable in recent years, and, to a limited extent, certain other jurisdictions. Tax benefits consist mainly of an increase in deferred tax assets attributable to our subsidiaries in the US, Spain and the Palestinian Authority. Our subsidiaries in Hong Kong, Israel and Luxembourg have accumulated significant carry-forward losses for tax purposes in past years, for which we do not recognize deferred tax assets because the utilization of such assets in the foreseeable future is not probable. As we expand our international business activities, any changes in the tax regime of the jurisdictions in which we operate may increase our overall provision for income taxes in the future.

Pursuant to a ruling received by us from the ITA, we are required to register for tax purposes in Israel and, accordingly, will be treated as an Israeli resident company for Israeli tax purposes. The current corporate tax rate in Israel is 23%. However, the corporate tax rate applicable to a company’s income that is eligible for certain tax benefits under Israeli government programs may be considerably lower. For additional information, see the section titled “Item 10.E. Additional Information - Certain Material Israeli Tax Considerations” in our Annual Report.


Six months ended June 30, 2025, compared with the six months ended June 30, 2024

Results of Operations

The following tables summarizes Freightos’ historical results of operations for the six months ended June 30, 2025 and 2024:

Six months ended June 30,

(dollars in thousands)


2025


2024

Revenue

$

14,383

$

11,013

Cost of revenue


4,751


3,989

Gross profit


9,632


7,024

Operating expenses:

Research and development


5,914


4,901

Selling and marketing


7,536


6,829

General and administrative


5,377


5,342

Total operating expenses


18,827


17,072

Operating loss


(9,195)


(10,048)

Change in fair value of warrants


(508)


(1,040)

Finance income


1,153


1,275

Finance expenses


(134)


(137)

Financing income (expenses), net


1,019


1,138

Loss before taxes on income


(8,684)


(9,950)

Income taxes (tax benefit), net


93


(20)

Loss

$

(8,777)

$

(9,930)

Six months ended June 30,


(as % of revenue)


2025


2024


Revenue


100

%  

100

%

Cost of revenue


33


36

Gross profit


67


64

Operating expenses:


Research and development


41


45

Selling and marketing


52


62

General and administrative


37


49

Total operating expenses


130


155

Operating loss


(63)


(91)

Change in fair value of warrants


(4)


(9)

Finance income


8


12

Finance expenses


(1)


(1)

Financing income, net


7


10

Loss before taxes on income


(60)


(90)

Income taxes (tax benefit), net


1


(*)

Loss


(61)

%  

(90)

%


(*) Less than 1%

Revenue by Segment

Six months ended June 30,

2025 Vs. 2024


(in thousands, except for percentages)


2025


2024


Change $


Change %


Platform

$

4,756

$

3,872

$

884

23

%

percentage of total revenue

33

%  

35

%  


Solutions

$

9,627

$

7,141

$

2,486


35

%

percentage of total revenue


67

%  


65

%  


Total revenue

$

14,383

$

11,013

$

3,370


31

%

Comparison of the Six Months Ended June 30, 2025 and 2024

Revenue increased by $3.4 million, or 31%, to $14.4 million for the six months ended June 30, 2025, compared to $11.0 million for the six months ended June 30, 2024.


Platform revenue increased by $0.9 million, or 23%, to $4.8 million for the six months ended June 30, 2025, compared to $3.9 million for the six months ended June 30, 2024. The increase reflects growth of air cargo digital bookings and digital customs brokerage services, and was primarily a result of an increase in GBV and the number of transactions.

Solutions revenue increased by $2.5 million, or 35%, to $9.6 million for the six months ended June 30, 2025, compared to $7.1 million for the six months ended June 30, 2024. The increase was primarily a result of strong customer acquisition, and also attributable to the acquisition of Shipsta (acquired in August 2024 and included in our consolidated results for the first half of 2025, but not 2024), which increased Solutions revenue by $1.2 million in the six months ended June 30, 2025.

Cost of Revenue

Six months ended June 30,


(in thousands, except for percentages)


2025


2024


Change $


Change %

Cost of revenue

$

4,751

$

3,989

$

762


19

%

Total gross margins


67

%  


64

%  


Comparison of the Six Months Ended June 30, 2025 and 2024

Cost of revenue increased by $0.8 million, or 19%, to $4.8 million for the six months ended June 30, 2025, compared to $4.0 million for the six months ended June 30, 2024. The increase was primarily due to an increase of $0.4 million in labor costs and an increase of $0.2 million in amortization of technology related mainly to the acquisition of Shipsta.

Research and Development

Six months ended June 30,


(in thousands, except for percentages)


2025


2024


Change $


Change %

Research and development

$

5,914

$

4,901

$

1,013

21

%

Comparison of the Six Months Ended June 30, 2025 and 2024

Research and development expenses increased by $1.0 million, or 21%, to $5.9 million for the six months ended June 30, 2025, compared to $4.9 million for the six months ended June 30, 2024. The increase was primarily due to an increase of $0.8 million in labor costs, resulting mainly from the consolidation of Shipsta’s labor costs in the six months ended June 30, 2025, and an increase of $0.1 million in share-based compensation expense.

Selling and Marketing

Six months ended June 30,


(in thousands, except for percentages)


2025


2024


Change $


Change %

Selling and marketing

$

7,536

$

6,829

$

707

10

%

Comparison of the Six Months Ended June 30, 2025 and 2024

Selling and marketing expenses increased by $0.7 million, or 10%, to $7.5 million for the six months ended June 30, 2025, compared to $6.8 million for the six months ended June 30, 2024. The increase was primarily due to an increase of $0.8 million in labor costs and an increase of $0.2 million in depreciation and amortization expenses, partially offset by a decrease of $0.4 million in the non-cash marketing and promotion expense related to issuing shares to airlines as part of our Digital Air Cargo Council.

General and Administrative

Six months ended June 30,


(in thousands, except for percentages)


2025


2024


Change $


Change %

General and administrative

$

5,377

$

5,342

$

35


1

%

Comparison of the Six Months Ended June 30, 2025 and 2024

General and administrative expenses were essentially even for the six months ended June 30, 2025, compared to general and administrative expenses for the six months ended June 30, 2024. An increase of $0.4 million in labor costs was primarily offset by a decrease of $0.2 million in share-based compensation expense, a decrease of $0.1 million in insurance premiums, and a decrease of $0.1 million in consulting expenses.


Change in Fair Value of Warrants

Six months ended June 30,


(in thousands, except for percentages)


2025


2024


Change $


Change %

Change in fair value of warrants

$

(508)

$

(1,040)

$

532

(51)

%

Comparison of the Six Months Ended June 30, 2025 and 2024

The cost for change in fair value of warrants decreased by $0.5 million, or 51%, in the six months ended June 30, 2025, as the fair value of our outstanding warrants increased by $0.5 million in the six months ended June 30, 2025, compared to an increase in the fair value of the warrants by $1.0 million for the six months ended June 30, 2024.

Finance Income

Six months ended June 30,


(in thousands, except for percentages)


2025


2024


Change $


Change %

Finance income

$

1,153

$

1,275

$

(122)


(10)

%

Comparison of the Six Months Ended June 30, 2025 and 2024

Finance income decreased by $0.1 million, or 10%, to $1.2 million for the six months ended June 30, 2025, compared to $1.3 million for the six months ended June 30, 2024. The decrease was primarily due to a decrease in interest on bank deposits of $0.5 million offset in part by an increase in income from investment in hedging instruments of $0.2 million and an increase in exchange rate differences of $0.1 million.

Finance Expenses

Six months ended June 30,


(in thousands, except for percentages)


2025


2024


Change $


Change %

Finance expenses

$

(134)

$

(137)

$

3

(2)

%

Comparison of the Six Months Ended June 30, 2025 and 2024

Finance expenses were essentially even for the six months ended June 30, 2025, compared to finance expenses for the six months ended June 30, 2024.

Income taxes (tax benefit), net

Six months ended June 30,


(in thousands, except for percentages)


2025


2024


Change $


Change %

Income taxes (tax benefit), net

$

93

$

(20)

$

113


(565)

%

Comparison of the Six Months Ended June 30, 2025 and 2024

Income taxes (tax benefit), net increased by $0.1 million or 565% to a tax expense, net of $0.1 million for the six months ended June 30, 2025, compared to a tax benefit, net of $0.0 million for the six months ended June 30, 2024. The increase was primarily due to an increase in deferred tax expenses in some of our subsidiaries.

Non-IFRS Financial Measures

Our management team uses loss before income taxes, finance income, finance expenses, change in fair value of warrants, share-based payment expense, depreciation and amortization and operating expense settled by issuance of shares (“Adjusted EBITDA”), a non-IFRS financial measure, to evaluate our operating performance and make strategic decisions. We believe that Adjusted EBITDA provides useful information to investors and others in understanding and evaluating our operating results because it provides a supplemental measure of our core operating performance and offers consistency and comparability with both past financial performance and with financial information of peer companies.

However, Adjusted EBITDA is presented for supplemental information purposes only, has limitations as an analytical tool, and should not be considered in isolation or as a substitute for financial information presented in accordance with IFRS.


The following table provides a reconciliation of loss to Adjusted EBITDA for the time periods presented:

Six Months Ended


June 30,


(in thousands, except for percentage)


2025


2024

Loss

$

(8,777)

$

(9,930)

Income taxes (tax benefit)


93


(20)

Finance income


(1,153)


(1,275)

Finance expenses


134


137

Change in fair value of warrants


508


1,040

Operating loss

(9,195)

(10,048)

Share-based payment expense


1,508


1,594

Depreciation and amortization


1,744


1,410

Operating expense settled by issuance of shares

351

Adjusted EBITDA

$

(5,943)

$

(6,693)

Adjusted EBITDA margins

(41.3)

%

(60.8)

%

Loss margin (under IFRS)

(61.0)

%

(90.2)

%

Comparison of the Six Months Ended June 30, 2025 and 2024

Adjusted EBITDA increased by $0.8 million, or 11%, to $(5.9) million for the six months ended June 30, 2025, compared to $(6.7) million for the six months ended June 30, 2024. Adjusted EBITDA increased primarily due to a decrease in loss in the first half of 2025 as well as the decrease in finance income and the increase in depreciation and amortization, offset, in part, by the decrease in change in fair value of warrants and by there not being any adjustment for operating expense settled by issuance of shares in the first half of 2025, as opposed to the first half of 2024.

Liquidity and Capital Resources

Since our inception, we have financed our operations primarily through equity financings.

Our cash, cash equivalents and short term bank deposits were $34.1 million as of June 30, 2025, a decrease of $3.2 million, compared to $37.3 million as of December 31, 2024. In addition, we had restricted deposits to secure payments to airlines, to support currency hedging activity, a bank guarantee and credit cards, that amounted to $1.6 million in the aggregate as of each of June 30, 2025 and December 31, 2024.

The development and commercialization of our Platform and Solutions segments will continue to require substantial expenditures and we expect to continue to be reliant upon continued investments from existing and new shareholders to fund operations.

Our primary uses of our liquidity and capital resources are: financing research and development, and selling and marketing, expenses that drive growth; increasing our working capital; investing in capital expenditures; and general corporate purposes. We believe that our sources of liquidity and capital resources will be sufficient to meet our business needs for at least the next 12 months.

Our capital expenditures consist primarily of computers, peripheral equipment and leasehold improvements from time to time in our leased offices. Capital expenditures were $0.1 million for the six months ended June 30, 2025, compared to $0.02 million for the six months ended June 30, 2024.

In January 2023, as part of the Business Combination, we raised $82.4 million; net of expenses, we raised $67.5 million.

Cash Flows

The following table summarizes our cash flows for the periods presented:

Six Months Ended June 30,

(in thousands)


2025


2024

Net cash used in operating activities

$

(2,532)

$

(4,505)

Net cash provided by investing activities


11,944


5,508

Net cash provided by (used in) financing activities


189


(108)

Exchange differences on balances of cash and cash equivalents

236


(59)

Gains from translation of cash and cash equivalents of foreign activity

26

Increase in cash and cash equivalents

$

9,863

$

836


Net Cash Used In Operating Activities

Six months ended June 30, 2025, compared with six months ended June 30, 2024

Net cash used in operating activities was $2.5 million for the six months ended June 30, 2025, a decrease of $2.0 million compared to the net cash used in operating activities of $4.5 million for the six months ended June 30, 2024. The decrease primarily resulted from a decrease in loss of $1.2 million, as well as the net increase of $1.7 million in changes in assets and liabilities, both of which were offset, in part, by a decrease of $0.7 million in net cash received during the period from interest.

Net Cash Provided By Investing Activities

Six months ended June 30, 2025, compared with six months ended June 30, 2024

Net cash provided by investing activities was $11.9 million for the six months ended June 30, 2025, an increase of $6.4 million, compared to the net cash provided by investing activities of $5.5 million for the six months ended June 30, 2024. The increase primarily resulted from an increase of $6.5 million in the net withdrawal of short-term bank deposits and short-term investments.

Net Cash Provided By (Used In) Financing Activities

Six months ended June 30, 2025, compared with six months ended June 30, 2024

Net cash provided by financing activities was $0.2 million for the six months ended June 30, 2025, a difference of $0.3 million, compared to the net cash used in financing activities of $0.1 million for the six months ended June 30, 2024. The change primarily resulted from an increase of $0.3 million in proceeds from the exercise of share options.

Contractual Obligations and Other Commitments

We have various contractual obligations and commercial commitments that are recorded as liabilities in our financial statements. In addition, we may pay the sellers of Shipsta up to $0.5 million in cash, subject to customary holdback provisions (and we may be able to cancel certain Ordinary shares that we have issued as part of the acquisition). As of June 30, 2025, the fair value of this contingent consideration was $0.7 million.

As of June 30, 2025, Freightos has contractual, undiscounted lease liabilities of $2.5 million, as shown in the below table:


(dollars in thousands)

Remainder of 2025


$

502

2026


603

2027


215

2028


200

2029

207

Thereafter

738

Total

$

2,465

Off-Balance Sheet Arrangements

As of June 30, 2025, we had outstanding unfulfilled orders placed with our Platform Sellers of approximately $0.4 million (compared to $0.5 million as of December 31, 2024) for which Buyers’ funds were not yet collected and, therefore, no liability was recorded in our financial statements. These amounts will be recorded as liabilities once the shipments are delivered, at which time we will also record receivables from the respective Buyers.

Recently Issued Accounting Pronouncements

For information on recently issued accounting pronouncements, refer to Note 3 to our audited consolidated financial statements in our Annual Report.