Shareholder Report
|
12 Months Ended |
|
Dec. 31, 2024
USD ($)
Holding
|
|---|
| Shareholder Report [Line Items] |
|
| Document Type |
N-CSR/A
|
| Amendment Flag |
false
|
| Registrant Name |
Vanguard Variable Insurance Funds
|
| Entity Central Index Key |
0000857490
|
| Entity Investment Company Type |
N-1A
|
| Document Period End Date |
Dec. 31, 2024
|
| C000012146 |
|
| Shareholder Report [Line Items] |
|
| Fund Name |
Variable Insurance Funds - Balanced Portfolio
|
| No Trading Symbol [Flag] |
true
|
| Annual or Semi-Annual Statement [Text Block] |
This annual shareholder report contains important information about Balanced Portfolio (the "Fund") for the period of January 1, 2024, to December 31, 2024.
|
| Shareholder Report Annual or Semi-Annual |
Annual Shareholder Report
|
| Additional Information [Text Block] |
You can find additional information about the Fund at https://personal1.vanguard.com/ngf-next-gen-form-webapp/fund-literature. You can also request this information by contacting us at 800-662-7447.
|
| Additional Information Phone Number |
800-662-7447
|
| Additional Information Website |
https://personal1.vanguard.com/ngf-next-gen-form-webapp/fund-literature
|
| Expenses [Text Block] |
What were the Fund costs for the last year?(based on a hypothetical $10,000 investment) Share Class Name | Costs of a $10,000 investment | Costs paid as a percentage of a $10,000 investment |
|---|
Vanguard Variable Insurance Funds - Balanced Portfolio | $21 | 0.20% |
|---|
|
| Expenses Paid, Amount |
$ 21
|
| Expense Ratio, Percent |
0.20%
|
| Factors Affecting Performance [Text Block] |
How did the Fund perform during the reporting period? For the 12 months ended December 31, 2024, the Fund underperformed its composite benchmark. U.S. economic growth hovered around 3% on a year-over-year basis for much of the period, and consumer price inflation trended lower, falling below 3% in July. The Federal Reserve began cutting short-term interest rates in September, boosting stock returns, but sticky inflation and solid growth reduced expectations for further rate cuts, which weighed on bond prices. The Fund’s stocks fell short of the 25.02% return of the Standard & Poor's 500 Index, the equity portion of the composite benchmark. Stock selection in financials and communication services outpaced those in the index, but this was more than offset by lagging performance in information technology and other sectors. The Fund’s bonds slightly outperformed the 1.52% return of their benchmark, the Bloomberg U.S. Credit A or Better Bond Index. Security selection more than offset an underweight to duration. Note that the Fund’s returns differ from those of variable annuity products that invest in the Fund. Annuity returns take insurance-related fees and expenses into account, and the Fund’s returns do not.
|
| Line Graph [Table Text Block] |
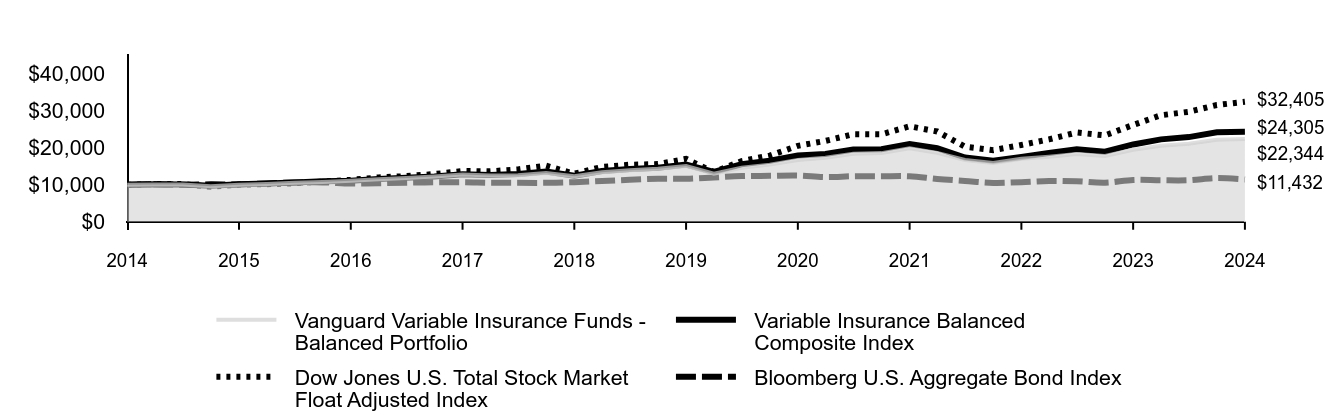 | Vanguard Variable Insurance Funds - Balanced Portfolio | Variable Insurance Balanced Composite Index | Dow Jones U.S. Total Stock Market Float Adjusted Index | Bloomberg U.S. Aggregate Bond Index |
|---|
2014 | $10,000 | $10,000 | $10,000 | $10,000 |
|---|
2015 | $10,081 | $10,143 | $10,180 | $10,161 |
|---|
2015 | $10,032 | $10,069 | $10,192 | $9,990 |
|---|
2015 | $9,623 | $9,698 | $9,451 | $10,113 |
|---|
2015 | $10,009 | $10,138 | $10,044 | $10,055 |
|---|
2016 | $10,200 | $10,362 | $10,136 | $10,360 |
|---|
2016 | $10,508 | $10,631 | $10,401 | $10,589 |
|---|
2016 | $10,769 | $10,922 | $10,862 | $10,638 |
|---|
2016 | $11,111 | $11,072 | $11,312 | $10,321 |
|---|
2017 | $11,487 | $11,545 | $11,967 | $10,406 |
|---|
2017 | $11,796 | $11,861 | $12,327 | $10,556 |
|---|
2017 | $12,197 | $12,252 | $12,890 | $10,645 |
|---|
2017 | $12,747 | $12,817 | $13,705 | $10,687 |
|---|
2018 | $12,501 | $12,667 | $13,623 | $10,531 |
|---|
2018 | $12,595 | $12,922 | $14,150 | $10,514 |
|---|
2018 | $13,199 | $13,588 | $15,156 | $10,516 |
|---|
2018 | $12,312 | $12,421 | $12,979 | $10,688 |
|---|
2019 | $13,369 | $13,693 | $14,802 | $11,003 |
|---|
2019 | $13,889 | $14,276 | $15,407 | $11,341 |
|---|
2019 | $14,337 | $14,575 | $15,582 | $11,599 |
|---|
2019 | $15,080 | $15,451 | $16,990 | $11,620 |
|---|
2020 | $12,993 | $13,467 | $13,429 | $11,985 |
|---|
2020 | $14,579 | $15,529 | $16,395 | $12,332 |
|---|
2020 | $15,437 | $16,490 | $17,883 | $12,409 |
|---|
2020 | $16,691 | $17,892 | $20,523 | $12,492 |
|---|
2021 | $17,271 | $18,313 | $21,846 | $12,071 |
|---|
2021 | $18,362 | $19,518 | $23,657 | $12,291 |
|---|
2021 | $18,550 | $19,592 | $23,629 | $12,298 |
|---|
2021 | $19,865 | $20,995 | $25,788 | $12,299 |
|---|
2022 | $18,615 | $19,860 | $24,396 | $11,569 |
|---|
2022 | $16,671 | $17,352 | $20,288 | $11,026 |
|---|
2022 | $15,864 | $16,508 | $19,362 | $10,502 |
|---|
2022 | $17,024 | $17,501 | $20,752 | $10,699 |
|---|
2023 | $17,591 | $18,557 | $22,255 | $11,016 |
|---|
2023 | $18,326 | $19,568 | $24,123 | $10,923 |
|---|
2023 | $17,758 | $18,943 | $23,329 | $10,570 |
|---|
2023 | $19,463 | $20,889 | $26,160 | $11,291 |
|---|
2024 | $20,540 | $22,265 | $28,788 | $11,203 |
|---|
2024 | $21,063 | $22,876 | $29,720 | $11,210 |
|---|
2024 | $22,154 | $24,202 | $31,551 | $11,793 |
|---|
2024 | $22,344 | $24,305 | $32,405 | $11,432 |
|---|
|
| Average Annual Return [Table Text Block] |
| 1 Year | 5 Years | 10 Years |
|---|
Vanguard Variable Insurance Funds - Balanced Portfolio | 14.80% | 8.18% | 8.37% |
|---|
Variable Insurance Balanced Composite Index | 16.35% | 9.48% | 9.29% |
|---|
Dow Jones U.S. Total Stock Market Float Adjusted Index | 23.88% | 13.78% | 12.48% |
|---|
Bloomberg U.S. Aggregate Bond Index | 1.25% | -0.33% | 1.35% |
|---|
|
| AssetsNet |
$ 3,535,000,000
|
| Holdings Count | Holding |
1,438
|
| Advisory Fees Paid, Amount |
$ 1,543,000
|
| InvestmentCompanyPortfolioTurnover |
64.00%
|
| Additional Fund Statistics [Text Block] |
Fund Statistics (as of December 31, 2024)Fund Net Assets (in millions) | $3,535 |
|---|
Number of Portfolio Holdings | 1,438 |
|---|
Portfolio Turnover Rate | 64% |
|---|
Total Investment Advisory Fees (in thousands) | $1,543 |
|---|
|
| Additional Fund Statistics Significance or Limits [Text Block] |
Where can I find additional information about the Fund?Additional information about the Fund, including its prospectus, financial information, holdings, and proxy voting information is available at https://personal1.vanguard.com/ngf-next-gen-form-webapp/fund-literature. |
| Holdings [Text Block] |
This table reflects the Fund's investments, including short-term investments, derivatives and other assets and liabilities. Portfolio Composition % of Net Assets (as of December 31, 2024)Communication Services | 7.9% | | Consumer Discretionary | 9.2% | | Consumer Staples | 2.9% | | Energy | 4.5% | | Financials | 18.9% | | Health Care | 8.3% | | Industrials | 4.8% | | Information Technology | 22.5% | | Materials | 0.9% | | Other | 11.9% | | Real Estate | 1.9% | | Utilities | 5.0% | | Other Assets and Liabilities—Net | 1.3% | |
|
| Material Fund Change [Text Block] |
|
| Updated Prospectus Web Address |
https://personal1.vanguard.com/ngf-next-gen-form-webapp/fund-literature
|
| C000012147 |
|
| Shareholder Report [Line Items] |
|
| Fund Name |
Variable Insurance Funds - Money Market Portfolio
|
| No Trading Symbol [Flag] |
true
|
| Annual or Semi-Annual Statement [Text Block] |
This annual shareholder report contains important information about Money Market Portfolio (the "Fund") for the period of January 1, 2024, to December 31, 2024.
|
| Shareholder Report Annual or Semi-Annual |
Annual Shareholder Report
|
| Additional Information [Text Block] |
You can find additional information about the Fund at https://personal1.vanguard.com/ngf-next-gen-form-webapp/fund-literature. You can also request this information by contacting us at 800-662-7447.
|
| Additional Information Phone Number |
800-662-7447
|
| Additional Information Website |
https://personal1.vanguard.com/ngf-next-gen-form-webapp/fund-literature
|
| Expenses [Text Block] |
What were the Fund costs for the last year?(based on a hypothetical $10,000 investment) Share Class Name | Costs of a $10,000 investment | Costs paid as a percentage of a $10,000 investment |
|---|
Vanguard Variable Insurance Funds - Money Market Portfolio | $15 | 0.15% |
|---|
|
| Expenses Paid, Amount |
$ 15
|
| Expense Ratio, Percent |
0.15%
|
| AssetsNet |
$ 1,232,000,000
|
| Holdings Count | Holding |
251
|
| Advisory Fees Paid, Amount |
$ 8,000
|
| Additional Fund Statistics [Text Block] |
Fund Statistics (as of December 31, 2024)Fund Net Assets (in millions) | $1,232 |
|---|
Number of Portfolio Holdings | 251 |
|---|
Total Investment Advisory Fees (in thousands) | $8 |
|---|
|
| Holdings [Text Block] |
This table reflects the Fund's investments, including short-term investments and other assets and liabilities. Distribution by Effective Maturity % of Net Assets(as of December 31, 2024)1 to 7 Days | 67.5% | 8 to 30 Days | 14.8% | 31 to 60 Days | 9.9% | 61 to 90 Days | 7.5% | 91 to 180 Days | 1.9% | Over 180 Days | 0.9% | Other Assets and Liabilities—Net | (2.5%) |
|
| Material Fund Change [Text Block] |
|
| Updated Prospectus Web Address |
https://personal1.vanguard.com/ngf-next-gen-form-webapp/fund-literature
|
| C000012149 |
|
| Shareholder Report [Line Items] |
|
| Fund Name |
Variable Insurance Funds - Short-Term Investment-Grade Portfolio
|
| No Trading Symbol [Flag] |
true
|
| Annual or Semi-Annual Statement [Text Block] |
This annual shareholder report contains important information about Short-Term Investment-Grade Portfolio (the "Fund") for the period of January 1, 2024, to December 31, 2024.
|
| Shareholder Report Annual or Semi-Annual |
Annual Shareholder Report
|
| Additional Information [Text Block] |
You can find additional information about the Fund at https://personal1.vanguard.com/ngf-next-gen-form-webapp/fund-literature. You can also request this information by contacting us at 800-662-7447.
|
| Additional Information Phone Number |
800-662-7447
|
| Additional Information Website |
https://personal1.vanguard.com/ngf-next-gen-form-webapp/fund-literature
|
| Expenses [Text Block] |
What were the Fund costs for the last year?(based on a hypothetical $10,000 investment) Share Class Name | Costs of a $10,000 investment | Costs paid as a percentage of a $10,000 investment |
|---|
Vanguard Variable Insurance Funds - Short-Term Investment-Grade Portfolio | $14 | 0.14% |
|---|
|
| Expenses Paid, Amount |
$ 14
|
| Expense Ratio, Percent |
0.14%
|
| Factors Affecting Performance [Text Block] |
How did the Fund perform during the reporting period? For the 12 months ended December 31, 2024, the Fund outperformed its benchmark, the Bloomberg U.S. 1–5 Year Credit Bond Index. U.S. economic growth hovered around 3% on a year-over-year basis for much of the period, and consumer price inflation trended lower, falling below 3% in July. While the Federal Reserve began cutting short-term interest rates in September, sticky inflation and solid growth reduced expectations for further rate cuts, which weighed on bond prices. The Fund’s overweight to overall credit risk was the primary driver of outperformance. Out-of-benchmark allocations to asset-backed securities and commercial mortgage-backed securities as well as security selection in industrial investment-grade issuers also added value. Note that the Fund’s returns differ from those of variable annuity products that invest in the Fund. Annuity returns take insurance-related fees and expenses into account, and the Fund’s returns do not.
|
| Line Graph [Table Text Block] |
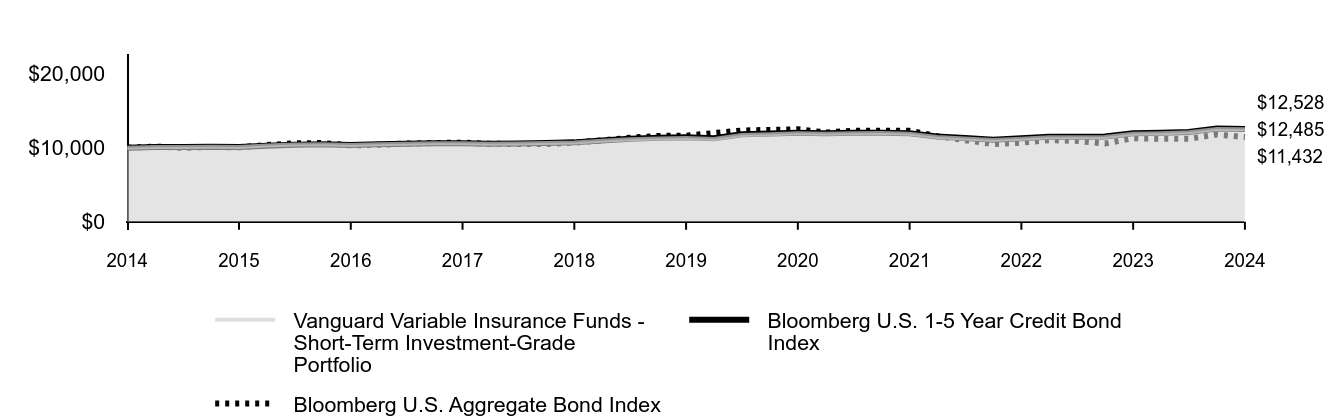 | Vanguard Variable Insurance Funds - Short-Term Investment-Grade Portfolio | Bloomberg U.S. 1-5 Year Credit Bond Index | Bloomberg U.S. Aggregate Bond Index |
|---|
2014 | $10,000 | $10,000 | $10,000 |
|---|
2015 | $10,103 | $10,115 | $10,161 |
|---|
2015 | $10,093 | $10,104 | $9,990 |
|---|
2015 | $10,141 | $10,148 | $10,113 |
|---|
2015 | $10,112 | $10,106 | $10,055 |
|---|
2016 | $10,289 | $10,281 | $10,360 |
|---|
2016 | $10,426 | $10,416 | $10,589 |
|---|
2016 | $10,485 | $10,461 | $10,638 |
|---|
2016 | $10,387 | $10,367 | $10,321 |
|---|
2017 | $10,474 | $10,459 | $10,406 |
|---|
2017 | $10,544 | $10,548 | $10,556 |
|---|
2017 | $10,614 | $10,622 | $10,645 |
|---|
2017 | $10,614 | $10,608 | $10,687 |
|---|
2018 | $10,552 | $10,533 | $10,531 |
|---|
2018 | $10,572 | $10,561 | $10,514 |
|---|
2018 | $10,633 | $10,627 | $10,516 |
|---|
2018 | $10,715 | $10,726 | $10,688 |
|---|
2019 | $10,938 | $10,982 | $11,003 |
|---|
2019 | $11,147 | $11,208 | $11,341 |
|---|
2019 | $11,262 | $11,336 | $11,599 |
|---|
2019 | $11,325 | $11,431 | $11,620 |
|---|
2020 | $11,184 | $11,291 | $11,985 |
|---|
2020 | $11,721 | $11,815 | $12,332 |
|---|
2020 | $11,829 | $11,911 | $12,409 |
|---|
2020 | $11,947 | $12,024 | $12,492 |
|---|
2021 | $11,882 | $11,956 | $12,071 |
|---|
2021 | $11,970 | $12,029 | $12,291 |
|---|
2021 | $11,981 | $12,040 | $12,298 |
|---|
2021 | $11,893 | $11,958 | $12,299 |
|---|
2022 | $11,450 | $11,522 | $11,569 |
|---|
2022 | $11,246 | $11,320 | $11,026 |
|---|
2022 | $11,031 | $11,095 | $10,502 |
|---|
2022 | $11,212 | $11,293 | $10,699 |
|---|
2023 | $11,429 | $11,489 | $11,016 |
|---|
2023 | $11,418 | $11,479 | $10,923 |
|---|
2023 | $11,441 | $11,508 | $10,570 |
|---|
2023 | $11,903 | $11,963 | $11,291 |
|---|
2024 | $11,970 | $12,025 | $11,203 |
|---|
2024 | $12,090 | $12,138 | $11,210 |
|---|
2024 | $12,545 | $12,588 | $11,793 |
|---|
2024 | $12,485 | $12,528 | $11,432 |
|---|
|
| Average Annual Return [Table Text Block] |
| 1 Year | 5 Years | 10 Years |
|---|
Vanguard Variable Insurance Funds - Short-Term Investment-Grade Portfolio | 4.89% | 1.97% | 2.24% |
|---|
Bloomberg U.S. 1-5 Year Credit Bond Index | 4.72% | 1.85% | 2.28% |
|---|
Bloomberg U.S. Aggregate Bond Index | 1.25% | -0.33% | 1.35% |
|---|
|
| AssetsNet |
$ 2,365,000,000
|
| Holdings Count | Holding |
2,061
|
| Advisory Fees Paid, Amount |
$ 259,000
|
| InvestmentCompanyPortfolioTurnover |
72.00%
|
| Additional Fund Statistics [Text Block] |
Fund Statistics (as of December 31, 2024)Fund Net Assets (in millions) | $2,365 |
|---|
Number of Portfolio Holdings | 2,061 |
|---|
Portfolio Turnover Rate | 72% |
|---|
Total Investment Advisory Fees (in thousands) | $259 |
|---|
|
| Additional Fund Statistics Significance or Limits [Text Block] |
Where can I find additional information about the Fund?Additional information about the Fund, including its prospectus, financial information, holdings, and proxy voting information is available at https://personal1.vanguard.com/ngf-next-gen-form-webapp/fund-literature. |
| Holdings [Text Block] |
This table reflects the Fund's investments, including short-term investments, derivatives and other assets and liabilities. Portfolio Composition % of Net Assets (as of December 31, 2024)Communications | 5.0% | | Consumer Discretionary | 5.3% | | Consumer Staples | 4.1% | | Energy | 6.0% | | Financials | 26.6% | | Health Care | 7.6% | | Industrials | 5.2% | | Materials | 1.8% | | Real Estate | 3.6% | | Technology | 5.0% | | Utilities | 5.6% | | Other | 22.7% | | Other Assets and Liabilities—NetFootnote Reference | 1.5% | |
|
| Material Fund Change [Text Block] |
|
| Updated Prospectus Web Address |
https://personal1.vanguard.com/ngf-next-gen-form-webapp/fund-literature
|
| C000012150 |
|
| Shareholder Report [Line Items] |
|
| Fund Name |
Variable Insurance Funds - Small Company Growth Portfolio
|
| No Trading Symbol [Flag] |
true
|
| Annual or Semi-Annual Statement [Text Block] |
This annual shareholder report contains important information about Small Company Growth Portfolio (the "Fund") for the period of January 1, 2024, to December 31, 2024.
|
| Shareholder Report Annual or Semi-Annual |
Annual Shareholder Report
|
| Additional Information [Text Block] |
You can find additional information about the Fund at https://personal1.vanguard.com/ngf-next-gen-form-webapp/fund-literature. You can also request this information by contacting us at 800-662-7447.
|
| Additional Information Phone Number |
800-662-7447
|
| Additional Information Website |
https://personal1.vanguard.com/ngf-next-gen-form-webapp/fund-literature
|
| Expenses [Text Block] |
What were the Fund costs for the last year?(based on a hypothetical $10,000 investment) Share Class Name | Costs of a $10,000 investment | Costs paid as a percentage of a $10,000 investment |
|---|
Vanguard Variable Insurance Funds - Small Company Growth Portfolio | $31 | 0.29% |
|---|
|
| Expenses Paid, Amount |
$ 31
|
| Expense Ratio, Percent |
0.29%
|
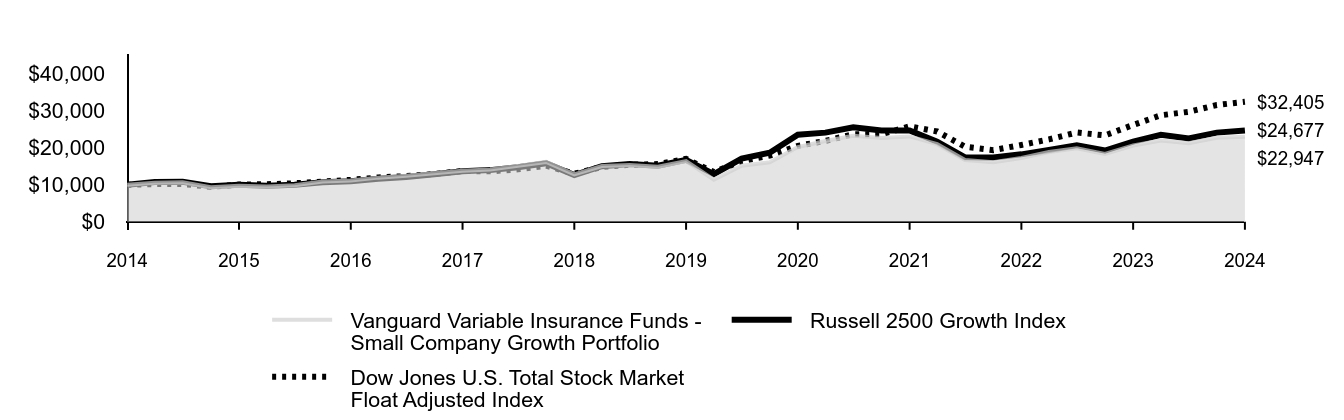
| Factors Affecting Performance [Text Block] |
How did the Fund perform during the reporting period? For the 12 months ended December 31, 2024, the Fund underperformed its benchmark, the Russell 2500 Growth Index. U.S. economic growth hovered around 3% on a year-over-year basis for much of the period, and consumer price inflation trended lower, falling below 3% in July. The Federal Reserve began cutting short-term interest rates in September, which boosted stock returns, as did the prospect of tax cuts and deregulation under the incoming administration. Growth stocks generally outperformed their value counterparts over the 12 months, but small-capitalization stocks lagged large-caps. In absolute terms, the Fund posted solid gains in most sectors—double digits in most cases—with only three of 11 sectors seeing declines. However, stock selection in information technology and communication services weighed down relative performance. Note that the Fund’s returns differ from those of variable annuity products that invest in the Fund. Annuity returns take insurance-related fees and expenses into account, and the Fund’s returns do not.
|
| Line Graph [Table Text Block] |
 | Vanguard Variable Insurance Funds - Small Company Growth Portfolio | Russell 2500 Growth Index | Dow Jones U.S. Total Stock Market Float Adjusted Index |
|---|
2014 | $10,000 | $10,000 | $10,000 |
|---|
2015 | $10,511 | $10,744 | $10,180 |
|---|
2015 | $10,698 | $10,809 | $10,192 |
|---|
2015 | $9,327 | $9,615 | $9,451 |
|---|
2015 | $9,725 | $9,981 | $10,044 |
|---|
2016 | $9,503 | $9,716 | $10,136 |
|---|
2016 | $9,841 | $9,978 | $10,401 |
|---|
2016 | $10,876 | $10,675 | $10,862 |
|---|
2016 | $11,177 | $10,952 | $11,312 |
|---|
2017 | $11,922 | $11,637 | $11,967 |
|---|
2017 | $12,432 | $12,117 | $12,327 |
|---|
2017 | $13,116 | $12,817 | $12,890 |
|---|
2017 | $13,800 | $13,631 | $13,705 |
|---|
2018 | $14,110 | $13,955 | $13,623 |
|---|
2018 | $15,100 | $14,726 | $14,150 |
|---|
2018 | $16,172 | $15,782 | $15,156 |
|---|
2018 | $12,804 | $12,613 | $12,979 |
|---|
2019 | $15,060 | $15,008 | $14,802 |
|---|
2019 | $15,308 | $15,629 | $15,407 |
|---|
2019 | $14,896 | $15,132 | $15,582 |
|---|
2019 | $16,395 | $16,732 | $16,990 |
|---|
2020 | $11,397 | $12,847 | $13,429 |
|---|
2020 | $15,116 | $17,069 | $16,395 |
|---|
2020 | $16,056 | $18,669 | $17,883 |
|---|
2020 | $20,196 | $23,503 | $20,523 |
|---|
2021 | $21,831 | $24,087 | $21,846 |
|---|
2021 | $23,241 | $25,541 | $23,657 |
|---|
2021 | $22,650 | $24,639 | $23,629 |
|---|
2021 | $23,067 | $24,688 | $25,788 |
|---|
2022 | $20,971 | $21,651 | $24,396 |
|---|
2022 | $16,695 | $17,418 | $20,288 |
|---|
2022 | $16,101 | $17,397 | $19,362 |
|---|
2022 | $17,219 | $18,217 | $20,752 |
|---|
2023 | $18,859 | $19,409 | $22,255 |
|---|
2023 | $19,830 | $20,655 | $24,123 |
|---|
2023 | $18,321 | $19,242 | $23,329 |
|---|
2023 | $20,602 | $21,666 | $26,160 |
|---|
2024 | $21,982 | $23,509 | $28,788 |
|---|
2024 | $21,241 | $22,518 | $29,720 |
|---|
2024 | $22,723 | $24,092 | $31,551 |
|---|
2024 | $22,947 | $24,677 | $32,405 |
|---|
|
| Average Annual Return [Table Text Block] |
| 1 Year | 5 Years | 10 Years |
|---|
Vanguard Variable Insurance Funds - Small Company Growth Portfolio | 11.38% | 6.96% | 8.66% |
|---|
Russell 2500 Growth Index | 13.90% | 8.08% | 9.45% |
|---|
Dow Jones U.S. Total Stock Market Float Adjusted Index | 23.88% | 13.78% | 12.48% |
|---|
|
| AssetsNet |
$ 1,537,000,000
|
| Holdings Count | Holding |
527
|
| Advisory Fees Paid, Amount |
$ 1,245,000
|
| InvestmentCompanyPortfolioTurnover |
51.00%
|
| Additional Fund Statistics [Text Block] |
Fund Statistics (as of December 31, 2024)Fund Net Assets (in millions) | $1,537 |
|---|
Number of Portfolio Holdings | 527 |
|---|
Portfolio Turnover Rate | 51% |
|---|
Total Investment Advisory Fees (in thousands) | $1,245 |
|---|
|
| Additional Fund Statistics Significance or Limits [Text Block] |
Where can I find additional information about the Fund?Additional information about the Fund, including its prospectus, financial information, holdings, and proxy voting information is available at https://personal1.vanguard.com/ngf-next-gen-form-webapp/fund-literature. |
| Holdings [Text Block] |
This table reflects the Fund's investments, including short-term investments, derivatives and other assets and liabilities. Portfolio Composition % of Net Assets (as of December 31, 2024)Communication Services | 5.2% | | Consumer Discretionary | 10.6% | | Consumer Staples | 1.6% | | Energy | 2.9% | | Financials | 7.8% | | Health Care | 24.2% | | Industrials | 21.5% | | Information Technology | 20.1% | | Materials | 2.0% | | Real Estate | 0.6% | | Utilities | 0.4% | | Other Assets and Liabilities—Net | 3.1% | |
|
| Material Fund Change [Text Block] |
|
| Updated Prospectus Web Address |
https://personal1.vanguard.com/ngf-next-gen-form-webapp/fund-literature
|
| C000012151 |
|
| Shareholder Report [Line Items] |
|
| Fund Name |
Variable Insurance Funds - Total Bond Market Index Portfolio
|
| No Trading Symbol [Flag] |
true
|
| Annual or Semi-Annual Statement [Text Block] |
This annual shareholder report contains important information about Total Bond Market Index Portfolio (the "Fund") for the period of January 1, 2024, to December 31, 2024.
|
| Shareholder Report Annual or Semi-Annual |
Annual Shareholder Report
|
| Additional Information [Text Block] |
You can find additional information about the Fund at https://personal1.vanguard.com/ngf-next-gen-form-webapp/fund-literature. You can also request this information by contacting us at 800-662-7447.
|
| Additional Information Phone Number |
800-662-7447
|
| Additional Information Website |
https://personal1.vanguard.com/ngf-next-gen-form-webapp/fund-literature
|
| Expenses [Text Block] |
What were the Fund costs for the last year?(based on a hypothetical $10,000 investment) Share Class Name | Costs of a $10,000 investment | Costs paid as a percentage of a $10,000 investment |
|---|
Vanguard Variable Insurance Funds - Total Bond Market Index Portfolio | $14 | 0.14% |
|---|
|
| Expenses Paid, Amount |
$ 14
|
| Expense Ratio, Percent |
0.14%
|
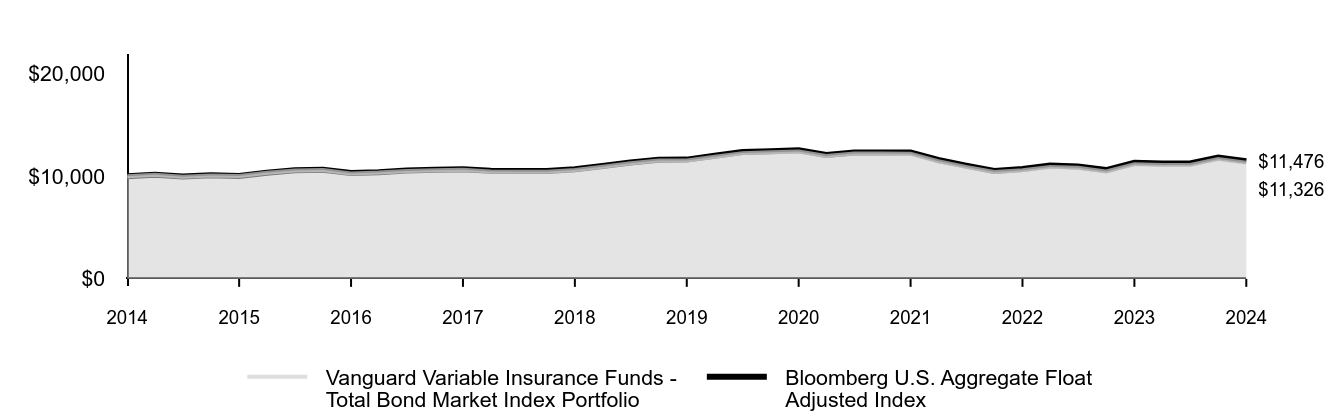
| Factors Affecting Performance [Text Block] |
How did the Fund perform during the reporting period? For the 12 months ended December 31, 2024, the Fund performed in line with its expense-free benchmark, the Bloomberg U.S. Aggregate Float Adjusted Index. U.S. economic growth hovered around 3% on a year-over-year basis for much of the period, and consumer price inflation trended lower, falling below 3% in July. While the Federal Reserve began cutting short-term interest rates in September, sticky inflation and solid growth reduced expectations for further rate cuts, which weighed on bond prices. U.S. Treasuries returned 0.58% for the period. Returns were higher for agency bonds (+3.14%), corporate bonds (+2.13%), and mortgage-backed securities (+1.54%), as measured by components of the Bloomberg U.S. Aggregate Float Adjusted Index. By credit quality, the highest- and lowest-rated investment-grade bonds outperformed those in the middle. By maturity, shorter-dated bonds outperformed other categories. Note that the Fund’s returns differ from those of variable annuity products that invest in the Fund. Annuity returns take insurance-related fees and expenses into account, and the Fund’s returns do not.
|
| Line Graph [Table Text Block] |
| Vanguard Variable Insurance Funds - Total Bond Market Index Portfolio | Bloomberg U.S. Aggregate Float Adjusted Index |
|---|
2014 | $10,000 | $10,000 |
|---|
2015 | $10,161 | $10,166 |
|---|
2015 | $9,974 | $9,987 |
|---|
2015 | $10,093 | $10,106 |
|---|
2015 | $10,033 | $10,044 |
|---|
2016 | $10,342 | $10,358 |
|---|
2016 | $10,578 | $10,598 |
|---|
2016 | $10,622 | $10,646 |
|---|
2016 | $10,281 | $10,321 |
|---|
2017 | $10,370 | $10,408 |
|---|
2017 | $10,522 | $10,563 |
|---|
2017 | $10,603 | $10,652 |
|---|
2017 | $10,648 | $10,695 |
|---|
2018 | $10,478 | $10,537 |
|---|
2018 | $10,460 | $10,516 |
|---|
2018 | $10,460 | $10,520 |
|---|
2018 | $10,625 | $10,687 |
|---|
2019 | $10,942 | $11,007 |
|---|
2019 | $11,273 | $11,354 |
|---|
2019 | $11,547 | $11,618 |
|---|
2019 | $11,547 | $11,635 |
|---|
2020 | $11,918 | $12,004 |
|---|
2020 | $12,267 | $12,367 |
|---|
2020 | $12,345 | $12,448 |
|---|
2020 | $12,423 | $12,536 |
|---|
2021 | $11,979 | $12,090 |
|---|
2021 | $12,219 | $12,326 |
|---|
2021 | $12,219 | $12,333 |
|---|
2021 | $12,209 | $12,338 |
|---|
2022 | $11,479 | $11,596 |
|---|
2022 | $10,925 | $11,047 |
|---|
2022 | $10,421 | $10,531 |
|---|
2022 | $10,596 | $10,726 |
|---|
2023 | $10,924 | $11,049 |
|---|
2023 | $10,829 | $10,954 |
|---|
2023 | $10,482 | $10,613 |
|---|
2023 | $11,187 | $11,326 |
|---|
2024 | $11,099 | $11,245 |
|---|
2024 | $11,109 | $11,253 |
|---|
2024 | $11,683 | $11,830 |
|---|
2024 | $11,326 | $11,476 |
|---|
|
| Average Annual Return [Table Text Block] |
| 1 Year | 5 Years | 10 Years |
|---|
Vanguard Variable Insurance Funds - Total Bond Market Index Portfolio | 1.24% | -0.39% | 1.25% |
|---|
Bloomberg U.S. Aggregate Float Adjusted Index | 1.33% | -0.27% | 1.39% |
|---|
|
| AssetsNet |
$ 4,582,000,000
|
| Holdings Count | Holding |
10,989
|
| Advisory Fees Paid, Amount |
$ 100,000
|
| InvestmentCompanyPortfolioTurnover |
41.00%
|
| Additional Fund Statistics [Text Block] |
Fund Statistics (as of December 31, 2024)Fund Net Assets (in millions) | $4,582 |
|---|
Number of Portfolio Holdings | 10,989 |
|---|
Portfolio Turnover Rate | 41% |
|---|
Total Investment Advisory Fees (in thousands) | $100 |
|---|
|
| Additional Fund Statistics Significance or Limits [Text Block] |
Where can I find additional information about the Fund?Additional information about the Fund, including its prospectus, financial information, holdings, and proxy voting information is available at https://personal1.vanguard.com/ngf-next-gen-form-webapp/fund-literature. |
| Holdings [Text Block] |
This table reflects the Fund's investments, including short-term investments and other assets and liabilities. Portfolio Composition % of Net Assets (as of December 31, 2024)Asset-Backed/Commercial Mortgage-Backed Securities | 2.4% | Corporate Bonds | 26.0% | Sovereign Bonds | 3.2% | Taxable Municipal Bonds | 0.5% | U.S. Government and Agency Obligations | 67.1% | Other Assets and Liabilities—NetFootnote Reference | 0.8% |
|
| Material Fund Change [Text Block] |
|
| Updated Prospectus Web Address |
https://personal1.vanguard.com/ngf-next-gen-form-webapp/fund-literature
|
| C000012153 |
|
| Shareholder Report [Line Items] |
|
| Fund Name |
Variable Insurance Funds - Capital Growth Portfolio
|
| No Trading Symbol [Flag] |
true
|
| Annual or Semi-Annual Statement [Text Block] |
This annual shareholder report contains important information about Capital Growth Portfolio (the "Fund") for the period of January 1, 2024, to December 31, 2024.
|
| Shareholder Report Annual or Semi-Annual |
Annual Shareholder Report
|
| Additional Information [Text Block] |
You can find additional information about the Fund at https://personal1.vanguard.com/ngf-next-gen-form-webapp/fund-literature. You can also request this information by contacting us at 800-662-7447.
|
| Additional Information Phone Number |
800-662-7447
|
| Additional Information Website |
https://personal1.vanguard.com/ngf-next-gen-form-webapp/fund-literature
|
| Expenses [Text Block] |
What were the Fund costs for the last year?(based on a hypothetical $10,000 investment) Share Class Name | Costs of a $10,000 investment | Costs paid as a percentage of a $10,000 investment |
|---|
Vanguard Variable Insurance Funds - Capital Growth Portfolio | $36 | 0.34% |
|---|
|
| Expenses Paid, Amount |
$ 36
|
| Expense Ratio, Percent |
0.34%
|
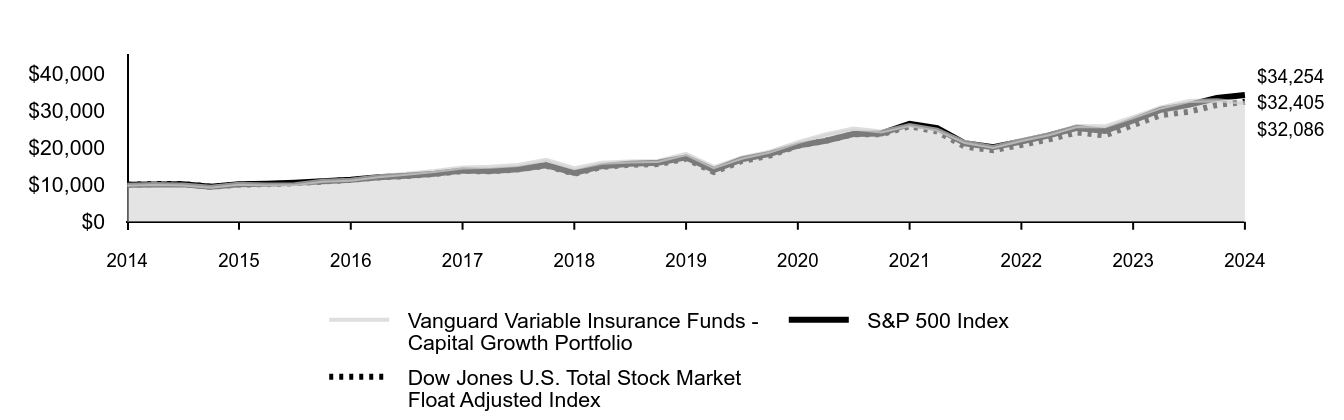
| Factors Affecting Performance [Text Block] |
How did the Fund perform during the reporting period? For the 12 months ended December 31, 2024, the Fund underperformed its benchmark, the Standard & Poor's 500 Index, by a wide margin. U.S. economic growth hovered around 3% on a year-over-year basis for much of the period, and consumer price inflation trended lower, falling below 3% in July. The Federal Reserve began cutting short-term interest rates in September, which boosted stock returns, as did the prospect of tax cuts and deregulation under the incoming administration. The Fund’s underperformance owed mainly to tepid gains in the value of its technology holdings. They returned 7%, on average—roughly one-fifth as much as the index’s tech component. Health care lagged notably, due to its significant overweight relative to the benchmark, as the sector lagged the broad market. Offsetting some of those weaknesses were underweight stakes in real estate and consumer staples, which also trailed the market. Note that the Fund’s returns differ from those of variable annuity products that invest in the Fund. Annuity returns take insurance-related fees and expenses into account, and the Fund’s returns do not.
|
| Line Graph [Table Text Block] |
 | Vanguard Variable Insurance Funds - Capital Growth Portfolio | S&P 500 Index | Dow Jones U.S. Total Stock Market Float Adjusted Index |
|---|
2014 | $10,000 | $10,000 | $10,000 |
|---|
2015 | $10,201 | $10,095 | $10,180 |
|---|
2015 | $10,051 | $10,123 | $10,192 |
|---|
2015 | $9,480 | $9,471 | $9,451 |
|---|
2015 | $10,262 | $10,138 | $10,044 |
|---|
2016 | $10,092 | $10,275 | $10,136 |
|---|
2016 | $10,124 | $10,527 | $10,401 |
|---|
2016 | $11,094 | $10,933 | $10,862 |
|---|
2016 | $11,375 | $11,351 | $11,312 |
|---|
2017 | $12,297 | $12,039 | $11,967 |
|---|
2017 | $12,981 | $12,411 | $12,327 |
|---|
2017 | $13,691 | $12,967 | $12,890 |
|---|
2017 | $14,655 | $13,829 | $13,705 |
|---|
2018 | $14,893 | $13,724 | $13,623 |
|---|
2018 | $15,330 | $14,195 | $14,150 |
|---|
2018 | $16,735 | $15,290 | $15,156 |
|---|
2018 | $14,482 | $13,223 | $12,979 |
|---|
2019 | $15,938 | $15,027 | $14,802 |
|---|
2019 | $16,252 | $15,674 | $15,407 |
|---|
2019 | $16,405 | $15,940 | $15,582 |
|---|
2019 | $18,320 | $17,386 | $16,990 |
|---|
2020 | $14,756 | $13,979 | $13,429 |
|---|
2020 | $17,284 | $16,850 | $16,395 |
|---|
2020 | $18,960 | $18,355 | $17,883 |
|---|
2020 | $21,521 | $20,585 | $20,523 |
|---|
2021 | $23,628 | $21,856 | $21,846 |
|---|
2021 | $25,217 | $23,724 | $23,657 |
|---|
2021 | $24,376 | $23,863 | $23,629 |
|---|
2021 | $26,156 | $26,494 | $25,788 |
|---|
2022 | $24,897 | $25,276 | $24,396 |
|---|
2022 | $21,537 | $21,206 | $20,288 |
|---|
2022 | $20,209 | $20,170 | $19,362 |
|---|
2022 | $22,106 | $21,696 | $20,752 |
|---|
2023 | $23,625 | $23,322 | $22,255 |
|---|
2023 | $25,846 | $25,361 | $24,123 |
|---|
2023 | $25,779 | $24,531 | $23,329 |
|---|
2023 | $28,292 | $27,399 | $26,160 |
|---|
2024 | $30,883 | $30,291 | $28,788 |
|---|
2024 | $32,603 | $31,589 | $29,720 |
|---|
2024 | $32,823 | $33,448 | $31,551 |
|---|
2024 | $32,086 | $34,254 | $32,405 |
|---|
|
| Average Annual Return [Table Text Block] |
| 1 Year | 5 Years | 10 Years |
|---|
Vanguard Variable Insurance Funds - Capital Growth Portfolio | 13.41% | 11.86% | 12.37% |
|---|
S&P 500 Index | 25.02% | 14.53% | 13.10% |
|---|
Dow Jones U.S. Total Stock Market Float Adjusted Index | 23.88% | 13.78% | 12.48% |
|---|
|
| AssetsNet |
$ 1,948,000,000
|
| Holdings Count | Holding |
111
|
| Advisory Fees Paid, Amount |
$ 2,916,000
|
| InvestmentCompanyPortfolioTurnover |
5.00%
|
| Additional Fund Statistics [Text Block] |
Fund Statistics (as of December 31, 2024)Fund Net Assets (in millions) | $1,948 |
|---|
Number of Portfolio Holdings | 111 |
|---|
Portfolio Turnover Rate | 5% |
|---|
Total Investment Advisory Fees (in thousands) | $2,916 |
|---|
|
| Additional Fund Statistics Significance or Limits [Text Block] |
Where can I find additional information about the Fund?Additional information about the Fund, including its prospectus, financial information, holdings, and proxy voting information is available at https://personal1.vanguard.com/ngf-next-gen-form-webapp/fund-literature. |
| Holdings [Text Block] |
This table reflects the Fund's investments, including short-term investments and other assets and liabilities. Portfolio Composition % of Net Assets (as of December 31, 2024)Communication Services | 5.7% | | Consumer Discretionary | 11.7% | | Consumer Staples | 0.5% | | Energy | 1.9% | | Financials | 7.6% | | Health Care | 27.3% | | Industrials | 13.5% | | Information Technology | 26.8% | | Materials | 1.0% | | Other Assets and Liabilities—Net | 4.0% | |
|
| Material Fund Change [Text Block] |
|
| Updated Prospectus Web Address |
https://personal1.vanguard.com/ngf-next-gen-form-webapp/fund-literature
|
| C000012154 |
|
| Shareholder Report [Line Items] |
|
| Fund Name |
Variable Insurance Funds - Diversified Value Portfolio
|
| No Trading Symbol [Flag] |
true
|
| Annual or Semi-Annual Statement [Text Block] |
This annual shareholder report contains important information about Diversified Value Portfolio (the "Fund") for the period of January 1, 2024, to December 31, 2024.
|
| Shareholder Report Annual or Semi-Annual |
Annual Shareholder Report
|
| Additional Information [Text Block] |
You can find additional information about the Fund at https://personal1.vanguard.com/ngf-next-gen-form-webapp/fund-literature. You can also request this information by contacting us at 800-662-7447.
|
| Additional Information Phone Number |
800-662-7447
|
| Additional Information Website |
https://personal1.vanguard.com/ngf-next-gen-form-webapp/fund-literature
|
| Expenses [Text Block] |
What were the Fund costs for the last year?(based on a hypothetical $10,000 investment) Share Class Name | Costs of a $10,000 investment | Costs paid as a percentage of a $10,000 investment |
|---|
Vanguard Variable Insurance Funds - Diversified Value Portfolio | $30 | 0.28% |
|---|
|
| Expenses Paid, Amount |
$ 30
|
| Expense Ratio, Percent |
0.28%
|
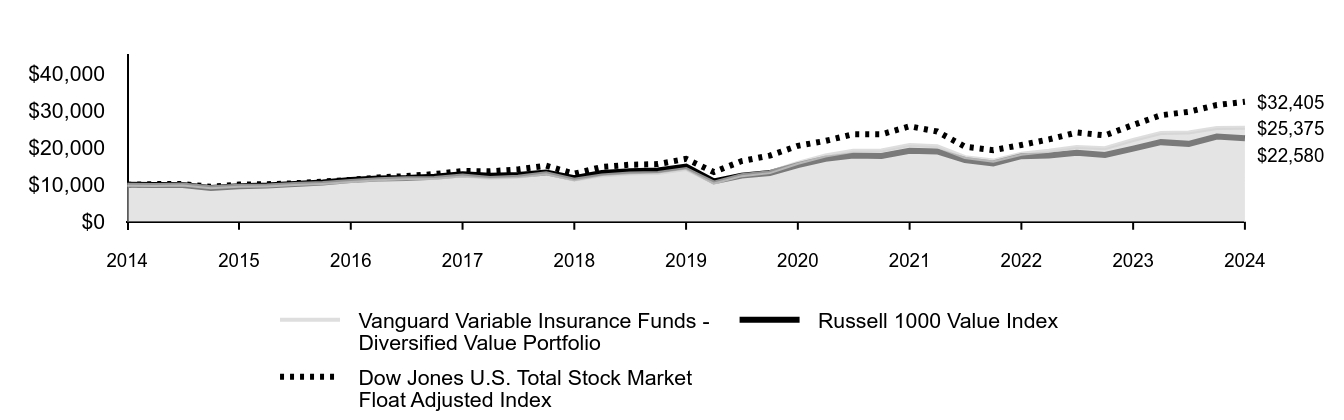
| Factors Affecting Performance [Text Block] |
How did the Fund perform during the reporting period? For the 12 months ended December 31, 2024, the Fund outperformed its benchmark, the Russell 1000 Value Index. U.S. economic growth hovered around 3% on a year-over-year basis for much of the period, and consumer price inflation trended lower, falling below 3% in July. The Federal Reserve began cutting short-term interest rates in September, which boosted stock returns, as did the prospect of tax cuts and deregulation under the incoming administration. Growth stocks outperformed value stocks by a wide margin for the 12 months. The broad U.S. stock market, as measured by the CRSP US Total Market Index, returned 23.77%. The advisor’s information technology and consumer discretionary holdings contributed the most to the Fund’s outperformance. Holdings in energy, consumer staples, and industrials detracted the most. Note that the Fund’s returns differ from those of variable annuity products that invest in the Fund. Annuity returns take insurance-related fees and expenses into account, and the Fund’s returns do not.
|
| Line Graph [Table Text Block] |
 | Vanguard Variable Insurance Funds - Diversified Value Portfolio | Russell 1000 Value Index | Dow Jones U.S. Total Stock Market Float Adjusted Index |
|---|
2014 | $10,000 | $10,000 | $10,000 |
|---|
2015 | $9,961 | $9,928 | $10,180 |
|---|
2015 | $10,079 | $9,939 | $10,192 |
|---|
2015 | $9,312 | $9,104 | $9,451 |
|---|
2015 | $9,755 | $9,617 | $10,044 |
|---|
2016 | $9,808 | $9,775 | $10,136 |
|---|
2016 | $10,188 | $10,223 | $10,401 |
|---|
2016 | $10,440 | $10,579 | $10,862 |
|---|
2016 | $11,019 | $11,285 | $11,312 |
|---|
2017 | $11,466 | $11,654 | $11,967 |
|---|
2017 | $11,766 | $11,811 | $12,327 |
|---|
2017 | $11,825 | $12,178 | $12,890 |
|---|
2017 | $12,469 | $12,827 | $13,705 |
|---|
2018 | $11,854 | $12,464 | $13,623 |
|---|
2018 | $12,147 | $12,610 | $14,150 |
|---|
2018 | $13,080 | $13,329 | $15,156 |
|---|
2018 | $11,332 | $11,767 | $12,979 |
|---|
2019 | $12,530 | $13,171 | $14,802 |
|---|
2019 | $13,023 | $13,677 | $15,407 |
|---|
2019 | $13,205 | $13,863 | $15,582 |
|---|
2019 | $14,244 | $14,890 | $16,990 |
|---|
2020 | $10,580 | $10,910 | $13,429 |
|---|
2020 | $12,596 | $12,469 | $16,395 |
|---|
2020 | $13,408 | $13,166 | $17,883 |
|---|
2020 | $15,922 | $15,306 | $20,523 |
|---|
2021 | $17,904 | $17,028 | $21,846 |
|---|
2021 | $19,178 | $17,915 | $23,657 |
|---|
2021 | $19,249 | $17,776 | $23,629 |
|---|
2021 | $20,773 | $19,157 | $25,788 |
|---|
2022 | $20,434 | $19,015 | $24,396 |
|---|
2022 | $17,468 | $16,694 | $20,288 |
|---|
2022 | $16,523 | $15,756 | $19,362 |
|---|
2022 | $18,386 | $17,713 | $20,752 |
|---|
2023 | $19,176 | $17,891 | $22,255 |
|---|
2023 | $20,222 | $18,620 | $24,123 |
|---|
2023 | $19,854 | $18,031 | $23,329 |
|---|
2023 | $22,087 | $19,743 | $26,160 |
|---|
2024 | $23,988 | $21,517 | $28,788 |
|---|
2024 | $24,125 | $21,051 | $29,720 |
|---|
2024 | $25,360 | $23,036 | $31,551 |
|---|
2024 | $25,375 | $22,580 | $32,405 |
|---|
|
| Average Annual Return [Table Text Block] |
| 1 Year | 5 Years | 10 Years |
|---|
Vanguard Variable Insurance Funds - Diversified Value Portfolio | 14.89% | 12.24% | 9.76% |
|---|
Russell 1000 Value Index | 14.37% | 8.68% | 8.49% |
|---|
Dow Jones U.S. Total Stock Market Float Adjusted Index | 23.88% | 13.78% | 12.48% |
|---|
|
| AssetsNet |
$ 1,360,000,000
|
| Holdings Count | Holding |
125
|
| Advisory Fees Paid, Amount |
$ 1,587,000
|
| InvestmentCompanyPortfolioTurnover |
35.00%
|
| Additional Fund Statistics [Text Block] |
Fund Statistics (as of December 31, 2024)Fund Net Assets (in millions) | $1,360 |
|---|
Number of Portfolio Holdings | 125 |
|---|
Portfolio Turnover Rate | 35% |
|---|
Total Investment Advisory Fees (in thousands) | $1,587 |
|---|
|
| Additional Fund Statistics Significance or Limits [Text Block] |
Where can I find additional information about the Fund?Additional information about the Fund, including its prospectus, financial information, holdings, and proxy voting information is available at https://personal1.vanguard.com/ngf-next-gen-form-webapp/fund-literature. |
| Holdings [Text Block] |
This table reflects the Fund's investments, including short-term investments, derivatives and other assets and liabilities. Portfolio Composition % of Net Assets (as of December 31, 2024)Communication Services | 5.5% | | Consumer Discretionary | 9.5% | | Consumer Staples | 4.2% | | Energy | 7.2% | | Financials | 19.5% | | Health Care | 13.4% | | Industrials | 10.5% | | Information Technology | 21.1% | | Materials | 1.0% | | Real Estate | 1.6% | | Utilities | 1.5% | | Other Assets and Liabilities—Net | 5.0% | |
|
| Material Fund Change [Text Block] |
|
| Updated Prospectus Web Address |
https://personal1.vanguard.com/ngf-next-gen-form-webapp/fund-literature
|
| C000012155 |
|
| Shareholder Report [Line Items] |
|
| Fund Name |
Variable Insurance Funds - Equity Income Portfolio
|
| No Trading Symbol [Flag] |
true
|
| Annual or Semi-Annual Statement [Text Block] |
This annual shareholder report contains important information about Equity Income Portfolio (the "Fund") for the period of January 1, 2024, to December 31, 2024.
|
| Shareholder Report Annual or Semi-Annual |
Annual Shareholder Report
|
| Additional Information [Text Block] |
You can find additional information about the Fund at https://personal1.vanguard.com/ngf-next-gen-form-webapp/fund-literature. You can also request this information by contacting us at 800-662-7447.
|
| Additional Information Phone Number |
800-662-7447
|
| Additional Information Website |
https://personal1.vanguard.com/ngf-next-gen-form-webapp/fund-literature
|
| Expenses [Text Block] |
What were the Fund costs for the last year?(based on a hypothetical $10,000 investment) Share Class Name | Costs of a $10,000 investment | Costs paid as a percentage of a $10,000 investment |
|---|
Vanguard Variable Insurance Funds - Equity Income Portfolio | $31 | 0.29% |
|---|
|
| Expenses Paid, Amount |
$ 31
|
| Expense Ratio, Percent |
0.29%
|
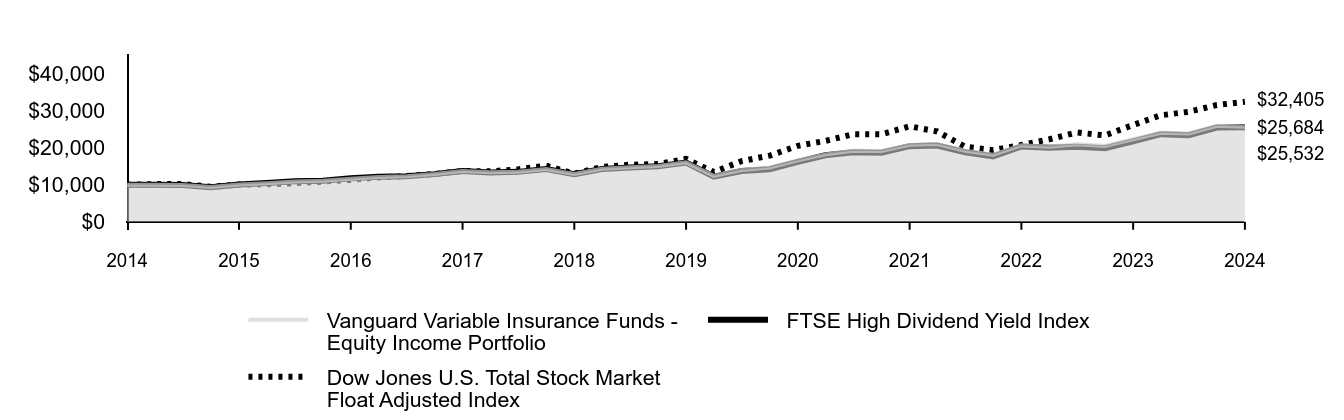
| Factors Affecting Performance [Text Block] |
How did the Fund perform during the reporting period? For the 12 months ended December 31, 2024, the Fund underperformed its benchmark, the FTSE High Dividend Yield Index. U.S. economic growth hovered around 3% on a year-over-year basis for much of the period, and consumer price inflation trended lower, falling below 3% in July. The Federal Reserve began cutting short-term interest rates in September, which boosted stock returns, as did the prospect of tax cuts and deregulation under the incoming administration. The Fund’s shortcomings were widespread; it trailed the index in seven of 11 economic sectors. The underperformance of its holdings in consumer staples and materials companies hurt the most. Modest real estate investments also weighed on its result, as the sector declined in a generally rising market. The Fund’s consumer discretionary holdings outperformed, providing the largest relative performance boost. For the decade ended December 31, 2024, the Fund performed in line with its benchmark index. Note that the Fund’s returns differ from those of variable annuity products that invest in the Fund. Annuity returns take insurance-related fees and expenses into account, and the Fund’s returns do not.
|
| Line Graph [Table Text Block] |
 | Vanguard Variable Insurance Funds - Equity Income Portfolio | FTSE High Dividend Yield Index | Dow Jones U.S. Total Stock Market Float Adjusted Index |
|---|
2014 | $10,000 | $10,000 | $10,000 |
|---|
2015 | $9,981 | $9,974 | $10,180 |
|---|
2015 | $9,957 | $9,944 | $10,192 |
|---|
2015 | $9,420 | $9,332 | $9,451 |
|---|
2015 | $10,085 | $10,039 | $10,044 |
|---|
2016 | $10,413 | $10,454 | $10,136 |
|---|
2016 | $10,859 | $10,913 | $10,401 |
|---|
2016 | $11,053 | $11,095 | $10,862 |
|---|
2016 | $11,605 | $11,742 | $11,312 |
|---|
2017 | $12,102 | $12,136 | $11,967 |
|---|
2017 | $12,324 | $12,309 | $12,327 |
|---|
2017 | $12,898 | $12,869 | $12,890 |
|---|
2017 | $13,722 | $13,681 | $13,705 |
|---|
2018 | $13,353 | $13,296 | $13,623 |
|---|
2018 | $13,536 | $13,479 | $14,150 |
|---|
2018 | $14,253 | $14,252 | $15,156 |
|---|
2018 | $12,904 | $12,880 | $12,979 |
|---|
2019 | $14,302 | $14,263 | $14,802 |
|---|
2019 | $14,747 | $14,656 | $15,407 |
|---|
2019 | $15,040 | $15,018 | $15,582 |
|---|
2019 | $16,056 | $16,002 | $16,990 |
|---|
2020 | $12,410 | $12,171 | $13,429 |
|---|
2020 | $13,962 | $13,697 | $16,395 |
|---|
2020 | $14,645 | $14,189 | $17,883 |
|---|
2020 | $16,578 | $16,187 | $20,523 |
|---|
2021 | $18,214 | $17,972 | $21,846 |
|---|
2021 | $19,162 | $18,788 | $23,657 |
|---|
2021 | $19,118 | $18,669 | $23,629 |
|---|
2021 | $20,776 | $20,426 | $25,788 |
|---|
2022 | $20,981 | $20,576 | $24,396 |
|---|
2022 | $19,192 | $18,802 | $20,288 |
|---|
2022 | $18,139 | $17,680 | $19,362 |
|---|
2022 | $20,639 | $20,360 | $20,752 |
|---|
2023 | $20,267 | $19,993 | $22,255 |
|---|
2023 | $20,910 | $20,274 | $24,123 |
|---|
2023 | $20,462 | $19,886 | $23,329 |
|---|
2023 | $22,310 | $21,701 | $26,160 |
|---|
2024 | $24,033 | $23,677 | $28,788 |
|---|
2024 | $23,880 | $23,400 | $29,720 |
|---|
2024 | $25,919 | $25,462 | $31,551 |
|---|
2024 | $25,684 | $25,532 | $32,405 |
|---|
|
| Average Annual Return [Table Text Block] |
| 1 Year | 5 Years | 10 Years |
|---|
Vanguard Variable Insurance Funds - Equity Income Portfolio | 15.12% | 9.85% | 9.89% |
|---|
FTSE High Dividend Yield Index | 17.65% | 9.79% | 9.83% |
|---|
Dow Jones U.S. Total Stock Market Float Adjusted Index | 23.88% | 13.78% | 12.48% |
|---|
|
| AssetsNet |
$ 2,139,000,000
|
| Holdings Count | Holding |
183
|
| Advisory Fees Paid, Amount |
$ 1,425,000
|
| InvestmentCompanyPortfolioTurnover |
45.00%
|
| Additional Fund Statistics [Text Block] |
Fund Statistics (as of December 31, 2024)Fund Net Assets (in millions) | $2,139 |
|---|
Number of Portfolio Holdings | 183 |
|---|
Portfolio Turnover Rate | 45% |
|---|
Total Investment Advisory Fees (in thousands) | $1,425 |
|---|
|
| Additional Fund Statistics Significance or Limits [Text Block] |
Where can I find additional information about the Fund?Additional information about the Fund, including its prospectus, financial information, holdings, and proxy voting information is available at https://personal1.vanguard.com/ngf-next-gen-form-webapp/fund-literature. |
| Holdings [Text Block] |
This table reflects the Fund's investments, including short-term investments, derivatives and other assets and liabilities. Portfolio Composition % of Net Assets (as of December 31, 2024)Communication Services | 2.5% | | Consumer Discretionary | 5.0% | | Consumer Staples | 10.2% | | Energy | 9.3% | | Financials | 20.6% | | Health Care | 13.7% | | Industrials | 11.5% | | Information Technology | 11.8% | | Materials | 2.7% | | Real Estate | 1.6% | | Utilities | 8.0% | | Other Assets and Liabilities—Net | 3.1% | |
|
| Material Fund Change [Text Block] |
|
| Updated Prospectus Web Address |
https://personal1.vanguard.com/ngf-next-gen-form-webapp/fund-literature
|
| C000012157 |
|
| Shareholder Report [Line Items] |
|
| Fund Name |
Variable Insurance Funds - Growth Portfolio
|
| No Trading Symbol [Flag] |
true
|
| Annual or Semi-Annual Statement [Text Block] |
This annual shareholder report contains important information about Growth Portfolio (the "Fund") for the period of January 1, 2024, to December 31, 2024.
|
| Shareholder Report Annual or Semi-Annual |
Annual Shareholder Report
|
| Additional Information [Text Block] |
You can find additional information about the Fund at https://personal1.vanguard.com/ngf-next-gen-form-webapp/fund-literature. You can also request this information by contacting us at 800-662-7447.
|
| Additional Information Phone Number |
800-662-7447
|
| Additional Information Website |
https://personal1.vanguard.com/ngf-next-gen-form-webapp/fund-literature
|
| Expenses [Text Block] |
What were the Fund costs for the last year?(based on a hypothetical $10,000 investment) Share Class Name | Costs of a $10,000 investment | Costs paid as a percentage of a $10,000 investment |
|---|
Vanguard Variable Insurance Funds - Growth Portfolio | $40 | 0.34% |
|---|
|
| Expenses Paid, Amount |
$ 40
|
| Expense Ratio, Percent |
0.34%
|
| Factors Affecting Performance [Text Block] |
How did the Fund perform during the reporting period? For the 12 months ended December 31, 2024, the Fund performed in line with its benchmark, the Russell 1000 Growth Index. U.S. economic growth hovered around 3% on a year-over-year basis for much of the period, and consumer price inflation trended lower, falling below 3% in July. The Federal Reserve began cutting short-term interest rates in September, which boosted stock returns, as did the prospect of tax cuts and deregulation under the incoming administration. The Fund benefited from the strong results of its stakes in consumer discretionary companies. Avoiding consumer staples companies also helped, as the sector lagged. On the downside, the Fund’s technology investments slightly underperformed, but that slight shortfall mattered because the sector accounted for nearly half of both the Fund and the index. Note that the Fund’s returns differ from those of variable annuity products that invest in the Fund. Annuity returns take insurance-related fees and expenses into account, and the Fund’s returns do not.
|
| Line Graph [Table Text Block] |
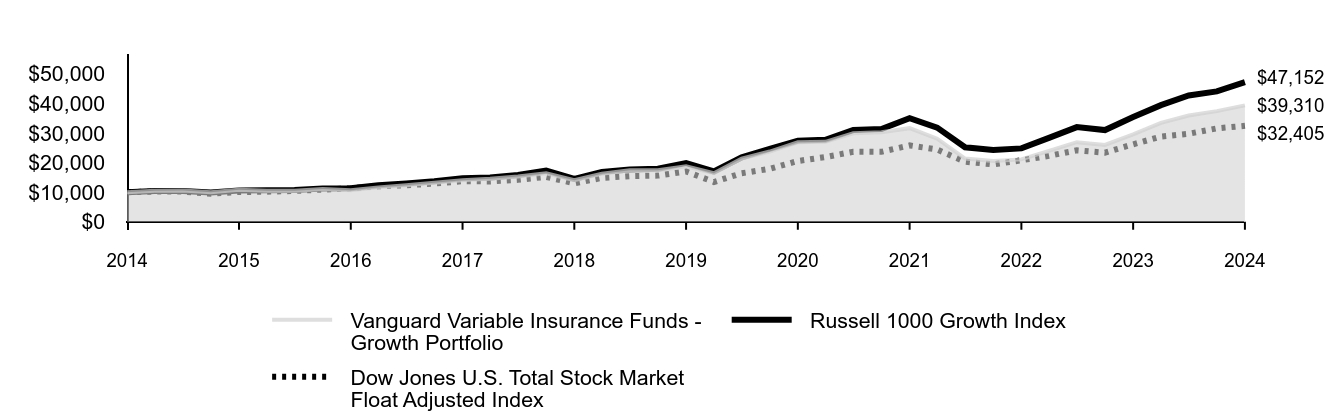 | Vanguard Variable Insurance Funds - Growth Portfolio | Russell 1000 Growth Index | Dow Jones U.S. Total Stock Market Float Adjusted Index |
|---|
2014 | $10,000 | $10,000 | $10,000 |
|---|
2015 | $10,439 | $10,384 | $10,180 |
|---|
2015 | $10,578 | $10,396 | $10,192 |
|---|
2015 | $9,989 | $9,846 | $9,451 |
|---|
2015 | $10,798 | $10,567 | $10,044 |
|---|
2016 | $10,431 | $10,645 | $10,136 |
|---|
2016 | $10,458 | $10,711 | $10,401 |
|---|
2016 | $11,055 | $11,201 | $10,862 |
|---|
2016 | $10,681 | $11,314 | $11,312 |
|---|
2017 | $11,611 | $12,322 | $11,967 |
|---|
2017 | $12,304 | $12,898 | $12,327 |
|---|
2017 | $13,173 | $13,659 | $12,890 |
|---|
2017 | $13,983 | $14,733 | $13,705 |
|---|
2018 | $14,502 | $14,941 | $13,623 |
|---|
2018 | $15,276 | $15,801 | $14,150 |
|---|
2018 | $16,399 | $17,251 | $15,156 |
|---|
2018 | $14,011 | $14,510 | $12,979 |
|---|
2019 | $16,182 | $16,846 | $14,802 |
|---|
2019 | $17,385 | $17,628 | $15,407 |
|---|
2019 | $17,413 | $17,890 | $15,582 |
|---|
2019 | $18,749 | $19,790 | $16,990 |
|---|
2020 | $16,408 | $17,000 | $13,429 |
|---|
2020 | $21,342 | $21,732 | $16,395 |
|---|
2020 | $23,716 | $24,604 | $17,883 |
|---|
2020 | $26,828 | $27,408 | $20,523 |
|---|
2021 | $27,002 | $27,666 | $21,846 |
|---|
2021 | $29,885 | $30,968 | $23,657 |
|---|
2021 | $30,249 | $31,326 | $23,629 |
|---|
2021 | $31,620 | $34,971 | $25,788 |
|---|
2022 | $28,055 | $31,809 | $24,396 |
|---|
2022 | $21,349 | $25,154 | $20,288 |
|---|
2022 | $20,559 | $24,249 | $19,362 |
|---|
2022 | $21,070 | $24,782 | $20,752 |
|---|
2023 | $23,934 | $28,342 | $22,255 |
|---|
2023 | $26,882 | $31,972 | $24,123 |
|---|
2023 | $25,949 | $30,972 | $23,329 |
|---|
2023 | $29,527 | $35,358 | $26,160 |
|---|
2024 | $33,386 | $39,394 | $28,788 |
|---|
2024 | $35,910 | $42,677 | $29,720 |
|---|
2024 | $37,370 | $44,038 | $31,551 |
|---|
2024 | $39,310 | $47,152 | $32,405 |
|---|
|
| Average Annual Return [Table Text Block] |
| 1 Year | 5 Years | 10 Years |
|---|
Vanguard Variable Insurance Funds - Growth Portfolio | 33.14% | 15.96% | 14.67% |
|---|
Russell 1000 Growth Index | 33.36% | 18.96% | 16.78% |
|---|
Dow Jones U.S. Total Stock Market Float Adjusted Index | 23.88% | 13.78% | 12.48% |
|---|
|
| AssetsNet |
$ 1,589,000,000
|
| Holdings Count | Holding |
53
|
| Advisory Fees Paid, Amount |
$ 1,288,000
|
| InvestmentCompanyPortfolioTurnover |
41.00%
|
| Additional Fund Statistics [Text Block] |
Fund Statistics (as of December 31, 2024)Fund Net Assets (in millions) | $1,589 |
|---|
Number of Portfolio Holdings | 53 |
|---|
Portfolio Turnover Rate | 41% |
|---|
Total Investment Advisory Fees (in thousands) | $1,288 |
|---|
|
| Additional Fund Statistics Significance or Limits [Text Block] |
Where can I find additional information about the Fund?Additional information about the Fund, including its prospectus, financial information, holdings, and proxy voting information is available at https://personal1.vanguard.com/ngf-next-gen-form-webapp/fund-literature. |
| Holdings [Text Block] |
This table reflects the Fund's investments, including short-term investments and other assets and liabilities. Portfolio Composition % of Net Assets (as of December 31, 2024)Communication Services | 14.5% | | Consumer Discretionary | 16.1% | | Financials | 9.6% | | Health Care | 7.2% | | Industrials | 4.1% | | Information Technology | 45.5% | | Real Estate | 2.4% | | Other Assets and Liabilities—Net | 0.6% | |
|
| Material Fund Change [Text Block] |
|
| Updated Prospectus Web Address |
https://personal1.vanguard.com/ngf-next-gen-form-webapp/fund-literature
|
| C000012158 |
|
| Shareholder Report [Line Items] |
|
| Fund Name |
Variable Insurance Funds - High Yield Bond Portfolio
|
| No Trading Symbol [Flag] |
true
|
| Annual or Semi-Annual Statement [Text Block] |
This annual shareholder report contains important information about High Yield Bond Portfolio (the "Fund") for the period of January 1, 2024, to December 31, 2024.
|
| Shareholder Report Annual or Semi-Annual |
Annual Shareholder Report
|
| Additional Information [Text Block] |
You can find additional information about the Fund at https://personal1.vanguard.com/ngf-next-gen-form-webapp/fund-literature. You can also request this information by contacting us at 800-662-7447.
|
| Additional Information Phone Number |
800-662-7447
|
| Additional Information Website |
https://personal1.vanguard.com/ngf-next-gen-form-webapp/fund-literature
|
| Expenses [Text Block] |
What were the Fund costs for the last year?(based on a hypothetical $10,000 investment) Share Class Name | Costs of a $10,000 investment | Costs paid as a percentage of a $10,000 investment |
|---|
Vanguard Variable Insurance Funds - High Yield Bond Portfolio | $25 | 0.24% |
|---|
|
| Expenses Paid, Amount |
$ 25
|
| Expense Ratio, Percent |
0.24%
|
| Factors Affecting Performance [Text Block] |
How did the Fund perform during the reporting period? For the 12 months ended December 31, 2024, the Fund underperformed its benchmark, the High-Yield Corporate Composite Index. U.S. economic growth hovered around 3% on a year-over-year basis for much of the period, and consumer price inflation trended lower, falling below 3% in July. While the Federal Reserve began cutting short-term interest rates in September, sticky inflation and solid growth reduced expectations for further rate cuts, which weighed on bond prices. The Fund’s strategy favors bonds of higher credit quality than the broader high-yield market, in the belief that lower-quality bonds do not adequately compensate investors over the long term for the increased risk. Security selection in financials, energy, and packaging detracted most. An underweight to financials was also a headwind. Selection in technology, cable and satellite, wirelines, and media and entertainment added value. Note that the Fund’s returns differ from those of variable annuity products that invest in the Fund. Annuity returns take insurance-related fees and expenses into account, and the Fund’s returns do not.
|
| Line Graph [Table Text Block] |
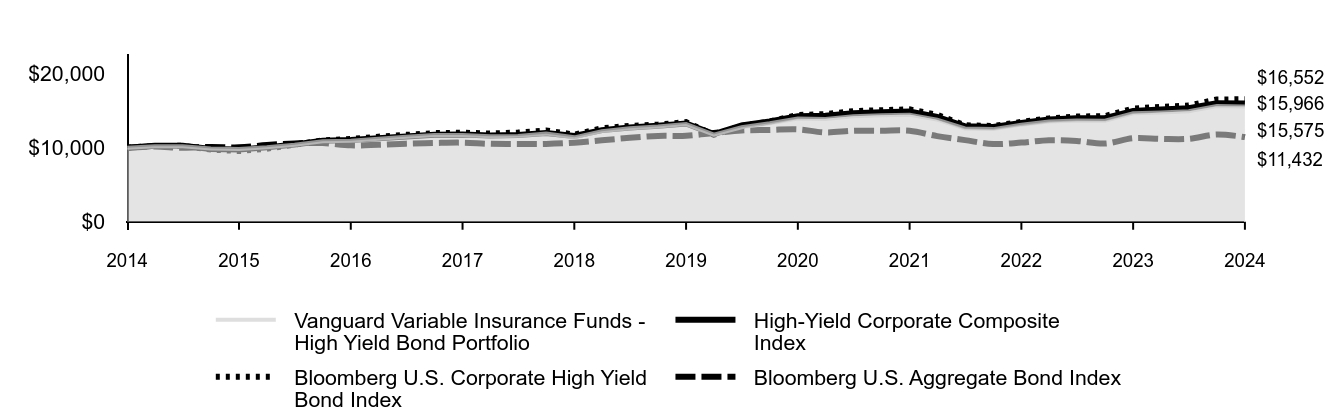 | Vanguard Variable Insurance Funds - High Yield Bond Portfolio | High-Yield Corporate Composite Index | Bloomberg U.S. Corporate High Yield Bond Index | Bloomberg U.S. Aggregate Bond Index |
|---|
2014 | $10,000 | $10,000 | $10,000 | $10,000 |
|---|
2015 | $10,205 | $10,256 | $10,252 | $10,161 |
|---|
2015 | $10,192 | $10,255 | $10,253 | $9,990 |
|---|
2015 | $9,907 | $9,844 | $9,755 | $10,113 |
|---|
2015 | $9,842 | $9,747 | $9,553 | $10,055 |
|---|
2016 | $10,082 | $10,052 | $9,874 | $10,360 |
|---|
2016 | $10,411 | $10,453 | $10,418 | $10,589 |
|---|
2016 | $10,877 | $10,943 | $10,997 | $10,638 |
|---|
2016 | $10,960 | $11,054 | $11,190 | $10,321 |
|---|
2017 | $11,208 | $11,293 | $11,492 | $10,405 |
|---|
2017 | $11,497 | $11,532 | $11,741 | $10,556 |
|---|
2017 | $11,727 | $11,740 | $11,973 | $10,645 |
|---|
2017 | $11,727 | $11,783 | $12,029 | $10,687 |
|---|
2018 | $11,559 | $11,658 | $11,926 | $10,531 |
|---|
2018 | $11,604 | $11,726 | $12,049 | $10,514 |
|---|
2018 | $11,907 | $11,982 | $12,338 | $10,516 |
|---|
2018 | $11,407 | $11,582 | $11,779 | $10,688 |
|---|
2019 | $12,245 | $12,382 | $12,634 | $11,003 |
|---|
2019 | $12,631 | $12,733 | $12,950 | $11,341 |
|---|
2019 | $12,857 | $12,961 | $13,122 | $11,599 |
|---|
2019 | $13,195 | $13,274 | $13,466 | $11,620 |
|---|
2020 | $11,780 | $11,853 | $11,757 | $11,985 |
|---|
2020 | $12,776 | $13,019 | $12,954 | $12,332 |
|---|
2020 | $13,308 | $13,539 | $13,549 | $12,409 |
|---|
2020 | $13,944 | $14,273 | $14,423 | $12,492 |
|---|
2021 | $13,900 | $14,315 | $14,546 | $12,071 |
|---|
2021 | $14,241 | $14,665 | $14,945 | $12,291 |
|---|
2021 | $14,385 | $14,793 | $15,077 | $12,298 |
|---|
2021 | $14,456 | $14,893 | $15,185 | $12,299 |
|---|
2022 | $13,800 | $14,170 | $14,450 | $11,569 |
|---|
2022 | $12,613 | $12,895 | $13,030 | $11,026 |
|---|
2022 | $12,518 | $12,797 | $12,946 | $10,502 |
|---|
2022 | $13,122 | $13,357 | $13,486 | $10,699 |
|---|
2023 | $13,540 | $13,806 | $13,967 | $11,016 |
|---|
2023 | $13,679 | $13,977 | $14,211 | $10,923 |
|---|
2023 | $13,659 | $14,000 | $14,276 | $10,570 |
|---|
2023 | $14,651 | $14,978 | $15,299 | $11,291 |
|---|
2024 | $14,775 | $15,157 | $15,524 | $11,203 |
|---|
2024 | $14,944 | $15,334 | $15,694 | $11,210 |
|---|
2024 | $15,638 | $15,996 | $16,523 | $11,793 |
|---|
2024 | $15,575 | $15,966 | $16,552 | $11,432 |
|---|
|
| Average Annual Return [Table Text Block] |
| 1 Year | 5 Years | 10 Years |
|---|
Vanguard Variable Insurance Funds - High Yield Bond Portfolio | 6.30% | 3.37% | 4.53% |
|---|
High-Yield Corporate Composite Index | 6.59% | 3.76% | 4.79% |
|---|
Bloomberg U.S. Corporate High Yield Bond Index | 8.19% | 4.21% | 5.17% |
|---|
Bloomberg U.S. Aggregate Bond IndexFootnote Reference* | 1.25% | -0.33% | 1.35% |
|---|
|
| AssetsNet |
$ 741,000,000
|
| Holdings Count | Holding |
891
|
| Advisory Fees Paid, Amount |
$ 320,000
|
| InvestmentCompanyPortfolioTurnover |
50.00%
|
| Additional Fund Statistics [Text Block] |
Fund Statistics (as of December 31, 2024)Fund Net Assets (in millions) | $741 |
|---|
Number of Portfolio Holdings | 891 |
|---|
Portfolio Turnover Rate | 50% |
|---|
Total Investment Advisory Fees (in thousands) | $320 |
|---|
|
| Additional Fund Statistics Significance or Limits [Text Block] |
Where can I find additional information about the Fund?Additional information about the Fund, including its prospectus, financial information, holdings, and proxy voting information is available at https://personal1.vanguard.com/ngf-next-gen-form-webapp/fund-literature. |
| Holdings [Text Block] |
This table reflects the Fund's investments, including short-term investments, derivatives and other assets and liabilities. Portfolio Composition % of Net Assets (as of December 31, 2024)Communications | 13.0% | | Consumer Discretionary | 15.6% | | Consumer Staples | 3.4% | | Energy | 10.8% | | Financials | 9.6% | | Health Care | 6.7% | | Industrials | 8.6% | | Materials | 9.6% | | Real Estate | 1.5% | | Technology | 6.6% | | Utilities | 1.9% | | Other | 8.8% | | Other Assets and Liabilities—NetFootnote Reference | 3.9% | |
|
| Material Fund Change [Text Block] |
|
| Updated Prospectus Web Address |
https://personal1.vanguard.com/ngf-next-gen-form-webapp/fund-literature
|
| C000012159 |
|
| Shareholder Report [Line Items] |
|
| Fund Name |
Variable Insurance Funds - International Portfolio
|
| No Trading Symbol [Flag] |
true
|
| Annual or Semi-Annual Statement [Text Block] |
This annual shareholder report contains important information about International Portfolio (the "Fund") for the period of January 1, 2024, to December 31, 2024.
|
| Shareholder Report Annual or Semi-Annual |
Annual Shareholder Report
|
| Additional Information [Text Block] |
You can find additional information about the Fund at https://personal1.vanguard.com/ngf-next-gen-form-webapp/fund-literature. You can also request this information by contacting us at 800-662-7447.
|
| Additional Information Phone Number |
800-662-7447
|
| Additional Information Website |
https://personal1.vanguard.com/ngf-next-gen-form-webapp/fund-literature
|
| Expenses [Text Block] |
What were the Fund costs for the last year?(based on a hypothetical $10,000 investment) Share Class Name | Costs of a $10,000 investment | Costs paid as a percentage of a $10,000 investment |
|---|
Vanguard Variable Insurance Funds - International Portfolio | $32 | 0.31% |
|---|
|
| Expenses Paid, Amount |
$ 32
|
| Expense Ratio, Percent |
0.31%
|
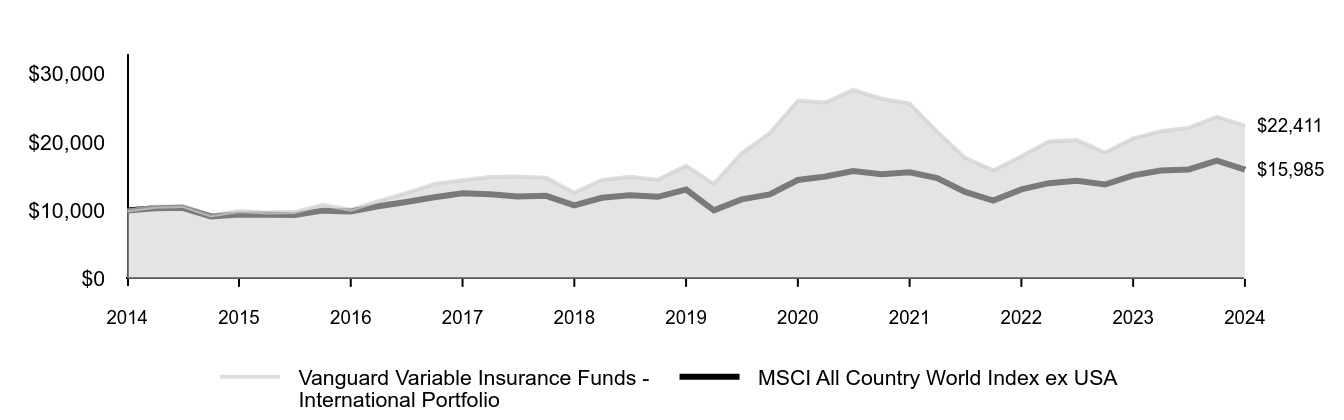
| Factors Affecting Performance [Text Block] |
How did the Fund perform during the reporting period? For the 12 months ended December 31, 2024, the Fund outperformed its benchmark, the MSCI All Country World Index ex USA. Overall, the global economy continued to expand, and consumer price inflation trended lower. That supportive backdrop set the stage for some Western central banks to begin cutting short-term interest rates this past summer. Volatility picked up toward year-end, but global stocks posted strong gains for 2024, with U.S. stocks faring even better. The Fund’s stock selection in several sectors—notably industrials, health care, financials, and consumer staples—lagged in performance relative to the benchmark index. However, this was more than offset by the Fund’s selection in information technology and communication services, which went on a tear for the 12 months. Note that the Fund’s returns differ from those of variable annuity products that invest in the Fund. Annuity returns take insurance-related fees and expenses into account, and the Fund’s returns do not.
|
| Line Graph [Table Text Block] |
| Vanguard Variable Insurance Funds - International Portfolio | MSCI All Country World Index ex USA |
|---|
2014 | $10,000 | $10,000 |
|---|
2015 | $10,545 | $10,349 |
|---|
2015 | $10,675 | $10,403 |
|---|
2015 | $9,267 | $9,137 |
|---|
2015 | $9,923 | $9,434 |
|---|
2016 | $9,695 | $9,398 |
|---|
2016 | $9,768 | $9,338 |
|---|
2016 | $10,829 | $9,983 |
|---|
2016 | $10,115 | $9,858 |
|---|
2017 | $11,385 | $10,633 |
|---|
2017 | $12,551 | $11,248 |
|---|
2017 | $13,875 | $11,941 |
|---|
2017 | $14,424 | $12,538 |
|---|
2018 | $14,897 | $12,390 |
|---|
2018 | $14,984 | $12,066 |
|---|
2018 | $14,799 | $12,151 |
|---|
2018 | $12,604 | $10,759 |
|---|
2019 | $14,469 | $11,868 |
|---|
2019 | $14,942 | $12,222 |
|---|
2019 | $14,520 | $12,002 |
|---|
2019 | $16,539 | $13,073 |
|---|
2020 | $13,883 | $10,020 |
|---|
2020 | $18,381 | $11,635 |
|---|
2020 | $21,330 | $12,362 |
|---|
2020 | $26,062 | $14,465 |
|---|
2021 | $25,802 | $14,971 |
|---|
2021 | $27,651 | $15,790 |
|---|
2021 | $26,358 | $15,319 |
|---|
2021 | $25,660 | $15,597 |
|---|
2022 | $21,538 | $14,748 |
|---|
2022 | $17,708 | $12,724 |
|---|
2022 | $15,869 | $11,464 |
|---|
2022 | $17,931 | $13,101 |
|---|
2023 | $20,098 | $14,001 |
|---|
2023 | $20,308 | $14,342 |
|---|
2023 | $18,475 | $13,801 |
|---|
2023 | $20,559 | $15,147 |
|---|
2024 | $21,606 | $15,857 |
|---|
2024 | $22,105 | $16,009 |
|---|
2024 | $23,707 | $17,300 |
|---|
2024 | $22,411 | $15,985 |
|---|
|
| Average Annual Return [Table Text Block] |
| 1 Year | 5 Years | 10 Years |
|---|
Vanguard Variable Insurance Funds - International Portfolio | 9.01% | 6.27% | 8.40% |
|---|
MSCI All Country World Index ex USA | 5.53% | 4.10% | 4.80% |
|---|
|
| AssetsNet |
$ 2,922,000,000
|
| Holdings Count | Holding |
131
|
| Advisory Fees Paid, Amount |
$ 3,680,000
|
| InvestmentCompanyPortfolioTurnover |
22.00%
|
| Additional Fund Statistics [Text Block] |
Fund Statistics (as of December 31, 2024)Fund Net Assets (in millions) | $2,922 |
|---|
Number of Portfolio Holdings | 131 |
|---|
Portfolio Turnover Rate | 22% |
|---|
Total Investment Advisory Fees (in thousands) | $3,680 |
|---|
|
| Additional Fund Statistics Significance or Limits [Text Block] |
Where can I find additional information about the Fund?Additional information about the Fund, including its prospectus, financial information, holdings, and proxy voting information is available at https://personal1.vanguard.com/ngf-next-gen-form-webapp/fund-literature. |
| Holdings [Text Block] |
This table reflects the Fund's investments, including short-term investments, derivatives and other assets and liabilities. Portfolio Composition % of Net Assets (as of December 31, 2024)Asia | 31.2% | Europe | 47.2% | North America | 14.6% | Oceania | 1.4% | South America | 1.7% | Other Assets and Liabilities—Net | 3.9% |
|
| Material Fund Change [Text Block] |
|
| Updated Prospectus Web Address |
https://personal1.vanguard.com/ngf-next-gen-form-webapp/fund-literature
|