Shareholder Report
Jun. 30, 2025
USD ($)
$ / shares
WHAT WERE THE FUND COSTS FOR THE PAST YEAR? (based on a hypothetical $10,000 investment)
|
Fund Name
|
Costs of a $10,000 investment
|
Costs paid as a percentage of a $10,000 investment
|
|
Point Bridge America First ETF
|
$77
|
0.72%
|
HOW DID THE FUND PERFORM LAST YEAR AND WHAT AFFECTED ITS PERFORMANCE?
The MAGA ETF was most heavily weighted in the industrials, financials, and energy sectors, which played significant and positive roles in the Fund’s overall performance. The financial sector performed the best, benefiting from sector-specific dynamics such as a higher interest rate environment and expected deregulation with the new administration. Utilities performed second-best, partly due to market volatility and the expectation of interest rate stabilization or cuts along with expected energy demands for new AI data centers. The industrials sector—which was the third-best performer—saw strength from ongoing infrastructure projects, defense spending, and manufacturing resilience. Materials was the largest detractor as inflation expectations continue to fall. The MAGA fund’s strategy inherently leads to a large underweight in Information Technology, where companies like Meta and Nvidia give heavily to Democrats, and their large market capitalizations cause them to disproportionately move the S&P 500’s performance both up and down.
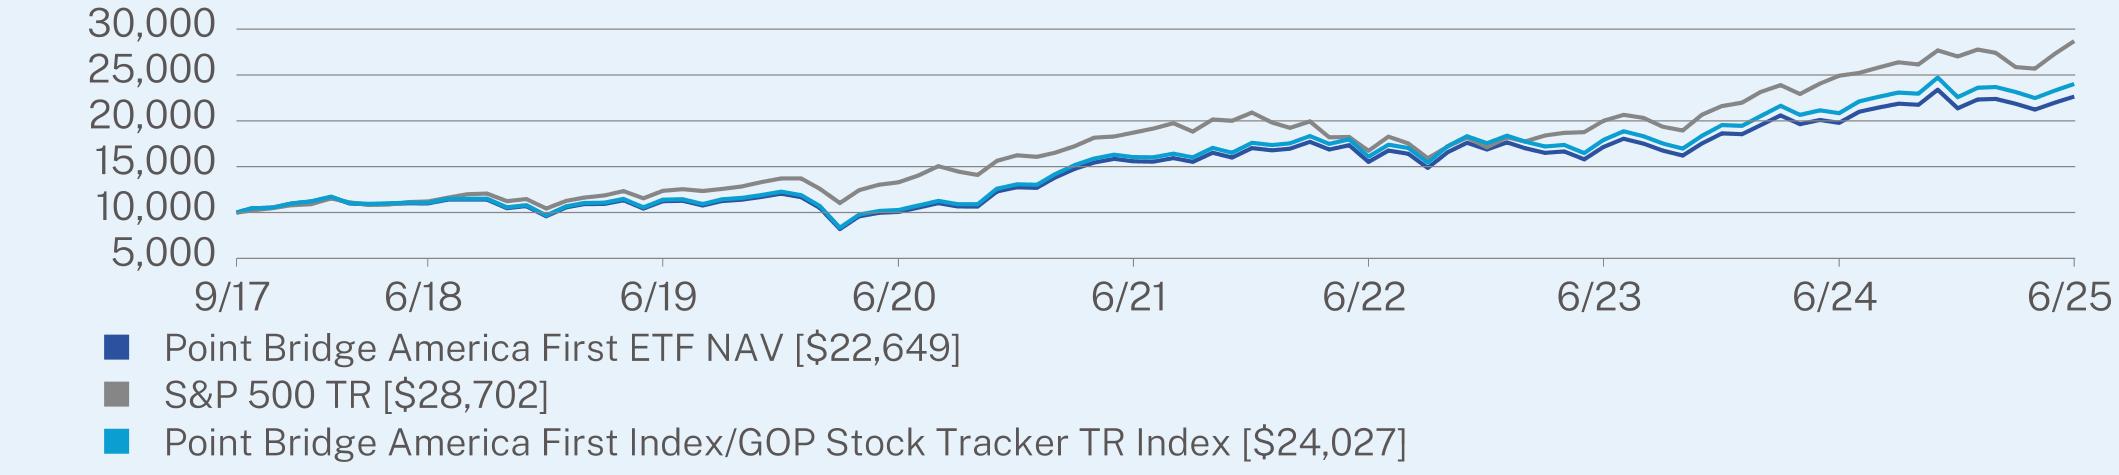
ANNUAL AVERAGE TOTAL RETURN (%)
|
|
1 Year
|
5 Year
|
Since Inception
(09/06/2017) |
|
Point Bridge America First ETF NAV
|
14.49
|
17.61
|
11.03
|
|
S&P 500 TR
|
15.16
|
16.64
|
14.45
|
|
Point Bridge America First Index/GOP Stock Tracker TR Index
|
15.33
|
18.52
|
11.87
|
Visit https://www.investpolitically.com/investor-materials/for more recent performance information.
Visit https://www.investpolitically.com/investor-materials/ for more recent performance information.
KEY FUND STATISTICS (as of June 30, 2025)
|
Net Assets
|
$31,365,308
|
|
Number of Holdings
|
151
|
|
Net Advisory Fee
|
$192,931
|
|
Portfolio Turnover
|
40%
|
|
30-Day SEC Yield
|
1.43%
|
|
30-Day SEC Yield Unsubsidized
|
1.43%
|
|
Top Sectors
|
(% of Net Assets)
|
|
Financial
|
21.6%
|
|
Industrial
|
16.8%
|
|
Consumer, Non-cyclical
|
14.5%
|
|
Consumer, Cyclical
|
14.0%
|
|
Energy
|
12.2%
|
|
Utilities
|
10.6%
|
|
Basic Materials
|
6.5%
|
|
Technology
|
2.0%
|
|
Communications
|
1.5%
|
|
Cash & Other
|
0.3%
|
|
Top 10 Issuers
|
(% of Net Assets)
|
|
HEICO Corporation
|
1.4%
|
|
Lennar Corporation
|
1.3%
|
|
Robinhood Markets, Inc.
|
0.8%
|
|
Goldman Sachs Group, Inc.
|
0.7%
|
|
EMCOR Group, Inc.
|
0.7%
|
|
United Rentals, Inc.
|
0.7%
|
|
Vistra Corporation
|
0.7%
|
|
Truist Financial Corporation
|
0.7%
|
|
Synchrony Financial
|
0.7%
|
|
Kroger Company
|
0.7%
|