Shareholder Report
|
6 Months Ended |
|
Jun. 30, 2025
USD ($)
Holding
|
|---|
| Shareholder Report [Line Items] |
|
| Document Type |
N-CSRS
|
| Amendment Flag |
false
|
| Registrant Name |
#New Age Alpha Variable Funds Trust#
|
| Entity Central Index Key |
0002013968
|
| Entity Investment Company Type |
N-1A
|
| Document Period End Date |
Jun. 30, 2025
|
| C000253501 |
|
| Shareholder Report [Line Items] |
|
| Fund Name |
NAA All Cap Value Series
|
| Trading Symbol |
ACVS
|
| Annual or Semi-Annual Statement [Text Block] |
This semi-annual shareholder report contains important information about NAA All Cap Value Series for the period of January 1, 2025 to June 30, 2025.
|
| Shareholder Report Annual or Semi-Annual |
Semi-Annual Shareholder Report
|
| Additional Information [Text Block] |
You can find additional information about the Fund at www.NAAFunds.com. You can also request this information by contacting us at 833-840-3937.
|
| Additional Information Phone Number |
833-840-3937
|
| Additional Information Website |
www.NAAFunds.com
|
| Expenses [Text Block] |
What were the Fund’s costs for the last six months?(based on a hypothetical $10,000 investment) Class Name | Costs of a $10,000 investment | Costs paid as a percentage of a $10,000 investment |
|---|
VIT | $46 | 0.91%Footnote Reference* |
|---|
|
| Expenses Paid, Amount |
$ 46
|
| Expense Ratio, Percent |
0.91%
|
| AssetsNet |
$ 85,596,825
|
| Holdings Count | Holding |
203
|
| Advisory Fees Paid, Amount |
$ 157,409
|
| InvestmentCompanyPortfolioTurnover |
70.00%
|
| Additional Fund Statistics [Text Block] |
- Net Assets$85,596,825
- Number of Portfolio Holdings203
- Advisory Fee (net of waivers)$157,409
- Portfolio Turnover70%
|
| Holdings [Text Block] |
Asset Weighting (% of total investments)Value | Value |
|---|
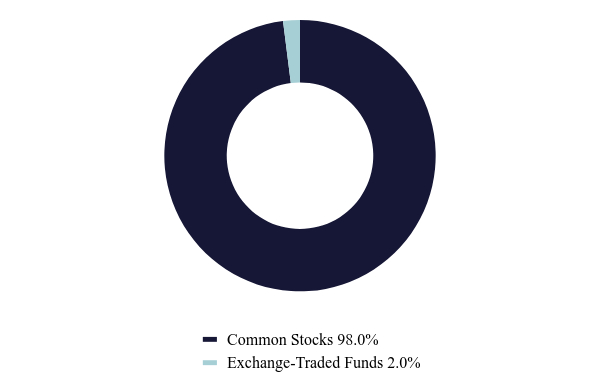
Common Stocks | 98.0% | Exchange-Traded Funds | 2.0% |
Sector Weighting (% of net assets)Value | Value |
|---|
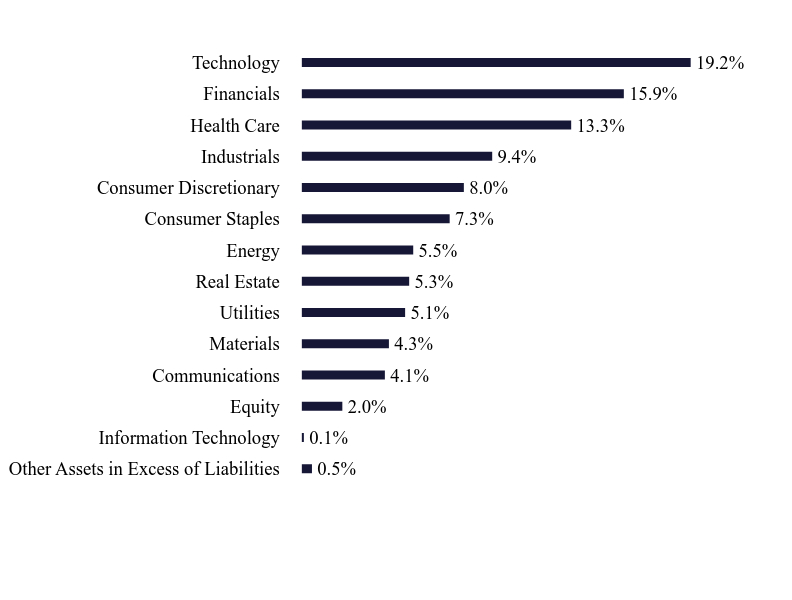
Other Assets in Excess of Liabilities | 0.5% | Information Technology | 0.1% | Equity | 2.0% | Communications | 4.1% | Materials | 4.3% | Utilities | 5.1% | Real Estate | 5.3% | Energy | 5.5% | Consumer Staples | 7.3% | Consumer Discretionary | 8.0% | Industrials | 9.4% | Health Care | 13.3% | Financials | 15.9% | Technology | 19.2% |
Industry comparisons within this Tailored Shareholder Report (TSR) are based on the Bloomberg Industry Classification Standard (BICS), which provides a hierarchical system for classifying companies by their primary source of revenue. |
| Largest Holdings [Text Block] |
Top 10 Holdings (% of net assets)Holding Name | % of Net Assets |
|---|
Microsoft Corporation | 5.7% |
|---|
Apple, Inc. | 5.3% |
|---|
Amazon.com, Inc. | 2.8% |
|---|
Exxon Mobil Corporation | 1.5% |
|---|
Berkshire Hathaway, Inc. - Class B | 1.5% |
|---|
Procter & Gamble Co. | 1.2% |
|---|
Johnson & Johnson | 1.2% |
|---|
JPMorgan Chase &
Company | 1.1% |
|---|
Bank of America Corporation | 1.0% |
|---|
iShares S&P Mid-Cap 400 Value ETF | 1.0% |
|---|
|
| Material Fund Change [Text Block] |
No material changes occurred during the period ended June 30, 2025. |
| C000253502 |
|
| Shareholder Report [Line Items] |
|
| Fund Name |
NAA Large Cap Value Series
|
| Trading Symbol |
LCVS
|
| Annual or Semi-Annual Statement [Text Block] |
This semi-annual shareholder report contains important information about NAA Large Cap Value Series for the period of January 1, 2025 to June 30, 2025.
|
| Shareholder Report Annual or Semi-Annual |
Semi-Annual Shareholder Report
|
| Additional Information [Text Block] |
You can find additional information about the Fund at www.NAAFunds.com. You can also request this information by contacting us at 833-840-3937.
|
| Additional Information Phone Number |
833-840-3937
|
| Additional Information Website |
www.NAAFunds.com
|
| Expenses [Text Block] |
What were the Fund’s costs for the last six months?(based on a hypothetical $10,000 investment) Class Name | Costs of a $10,000 investment | Costs paid as a percentage of a $10,000 investment |
|---|
VIT | $42 | 0.83%Footnote Reference* |
|---|
|
| Expenses Paid, Amount |
$ 42
|
| Expense Ratio, Percent |
0.83%
|
| AssetsNet |
$ 192,161,384
|
| Holdings Count | Holding |
102
|
| Advisory Fees Paid, Amount |
$ 336,377
|
| InvestmentCompanyPortfolioTurnover |
50.00%
|
| Additional Fund Statistics [Text Block] |
- Net Assets$192,161,384
- Number of Portfolio Holdings102
- Advisory Fee (net of waivers)$336,377
- Portfolio Turnover50%
|
| Holdings [Text Block] |
Asset Weighting (% of total investments)Value | Value |
|---|
Common Stocks | 98.0% | Exchange-Traded Funds | 2.0% |
Sector Weighting (% of net assets)Value | Value |
|---|
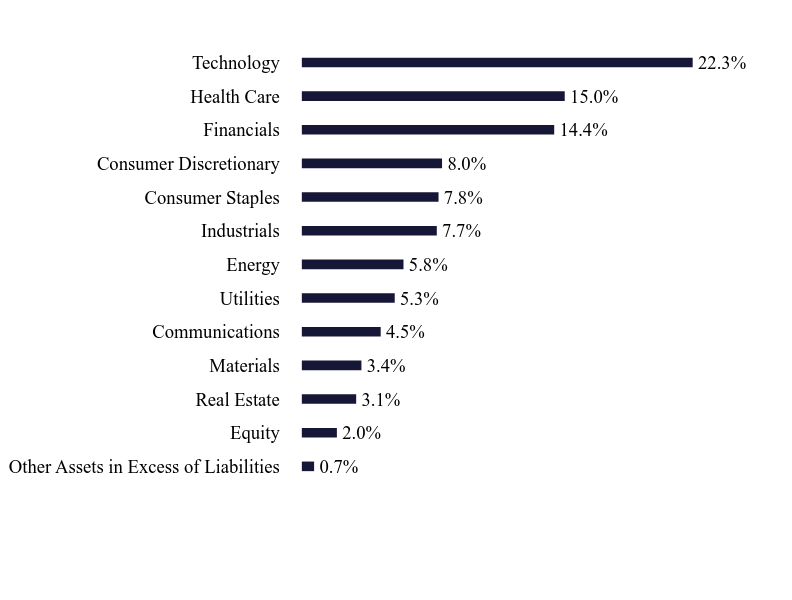
Other Assets in Excess of Liabilities | 0.7% | Equity | 2.0% | Real Estate | 3.1% | Materials | 3.4% | Communications | 4.5% | Utilities | 5.3% | Energy | 5.8% | Industrials | 7.7% | Consumer Staples | 7.8% | Consumer Discretionary | 8.0% | Financials | 14.4% | Health Care | 15.0% | Technology | 22.3% |
Industry comparisons within this Tailored Shareholder Report (TSR) are based on the Bloomberg Industry Classification Standard (BICS), which provides a hierarchical system for classifying companies by their primary source of revenue. Top 10 Holdings (% of net assets)Holding Name | % of Net Assets |
|---|
Microsoft Corporation | 7.1% |
|---|
Apple, Inc. | 6.6% |
|---|
Amazon.com, Inc. | 3.5% |
|---|
Exxon Mobil Corporation | 1.9% |
|---|
Berkshire Hathaway, Inc. - Class B | 1.8% |
|---|
Procter & Gamble Co. | 1.5% |
|---|
Johnson & Johnson | 1.5% |
|---|
JPMorgan Chase & Company | 1.4% |
|---|
Bank of America Corporation | 1.2% |
|---|
UnitedHealth Group, Inc. | 1.1% |
|---|
|
| Material Fund Change [Text Block] |
No material changes occurred during the period ended June 30, 2025. |
| C000249820 |
|
| Shareholder Report [Line Items] |
|
| Fund Name |
NAA Large Core Series
|
| Trading Symbol |
LCS
|
| Annual or Semi-Annual Statement [Text Block] |
This semi-annual shareholder report contains important information about NAA Large Core Series for the period of January 1, 2025 to June 30, 2025.
|
| Shareholder Report Annual or Semi-Annual |
Semi-Annual Shareholder Report
|
| Additional Information [Text Block] |
You can find additional information about the Fund at www.NAAFunds.com. You can also request this information by contacting us at 833-840-3937.
|
| Additional Information Phone Number |
833-840-3937
|
| Additional Information Website |
www.NAAFunds.com
|
| Expenses [Text Block] |
What were the Fund’s costs for the last six months?(based on a hypothetical $10,000 investment) Class Name | Costs of a $10,000 investment | Costs paid as a percentage of a $10,000 investment |
|---|
VIT | $46 | 0.91%Footnote Reference* |
|---|
|
| Expenses Paid, Amount |
$ 46
|
| Expense Ratio, Percent |
0.91%
|
| AssetsNet |
$ 251,565,163
|
| Holdings Count | Holding |
103
|
| Advisory Fees Paid, Amount |
$ 540,010
|
| InvestmentCompanyPortfolioTurnover |
51.00%
|
| Additional Fund Statistics [Text Block] |
- Net Assets$251,565,163
- Number of Portfolio Holdings103
- Advisory Fee (net of waivers)$540,010
- Portfolio Turnover51%
|
| Holdings [Text Block] |
Asset Weighting (% of total investments)Value | Value |
|---|
Common Stocks | 98.0% | Exchange-Traded Funds | 2.0% |
Sector Weighting (% of net assets)Value | Value |
|---|
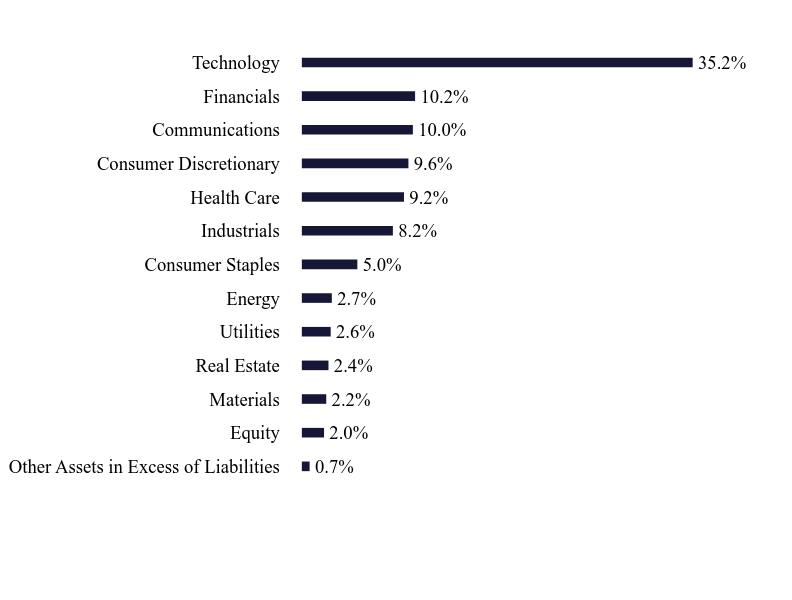
Other Assets in Excess of Liabilities | 0.7% | Equity | 2.0% | Materials | 2.2% | Real Estate | 2.4% | Utilities | 2.6% | Energy | 2.7% | Consumer Staples | 5.0% | Industrials | 8.2% | Health Care | 9.2% | Consumer Discretionary | 9.6% | Communications | 10.0% | Financials | 10.2% | Technology | 35.2% |
Industry comparisons within this Tailored Shareholder Report (TSR) are based on the Bloomberg Industry Classification Standard (BICS), which provides a hierarchical system for classifying companies by their primary source of revenue. |
| Largest Holdings [Text Block] |
Top 10 Holdings (% of net assets)Holding Name | % of Net Assets |
|---|
NVIDIA Corporation | 7.2% |
|---|
Microsoft Corporation | 6.9% |
|---|
Apple, Inc. | 5.5% |
|---|
Amazon.com, Inc. | 3.9% |
|---|
Meta Platforms, Inc. - Class A | 2.9% |
|---|
Alphabet, Inc. - Class A | 2.8% |
|---|
Broadcom, Inc. | 2.3% |
|---|
Tesla, Inc. | 1.9% |
|---|
Berkshire Hathaway, Inc. - Class B | 1.6% |
|---|
JPMorgan Chase & Company | 1.5% |
|---|
|
| Material Fund Change [Text Block] |
No material changes occurred during the period ended June 30, 2025. |
| C000253503 |
|
| Shareholder Report [Line Items] |
|
| Fund Name |
NAA Large Growth Series
|
| Trading Symbol |
LGS
|
| Annual or Semi-Annual Statement [Text Block] |
This semi-annual shareholder report contains important information about NAA Large Growth Series for the period of January 1, 2025 to June 30, 2025.
|
| Shareholder Report Annual or Semi-Annual |
Semi-Annual Shareholder Report
|
| Additional Information [Text Block] |
You can find additional information about the Fund at www.NAAFunds.com. You can also request this information by contacting us at 833-840-3937.
|
| Additional Information Phone Number |
833-840-3937
|
| Additional Information Website |
www.NAAFunds.com
|
| Expenses [Text Block] |
What were the Fund’s costs for the last six months?(based on a hypothetical $10,000 investment) Class Name | Costs of a $10,000 investment | Costs paid as a percentage of a $10,000 investment |
|---|
VIT | $48 | 0.94%Footnote Reference* |
|---|
|
| Expenses Paid, Amount |
$ 48
|
| Expense Ratio, Percent |
0.94%
|
| AssetsNet |
$ 58,827,414
|
| Holdings Count | Holding |
78
|
| Advisory Fees Paid, Amount |
$ 83,950
|
| InvestmentCompanyPortfolioTurnover |
29.00%
|
| Additional Fund Statistics [Text Block] |
- Net Assets$58,827,414
- Number of Portfolio Holdings78
- Advisory Fee (net of waivers)$83,950
- Portfolio Turnover29%
|
| Holdings [Text Block] |
Asset Weighting (% of total investments)Value | Value |
|---|
Common Stocks | 98.0% | Exchange-Traded Funds | 2.0% |
Sector Weighting (% of net assets)Value | Value |
|---|
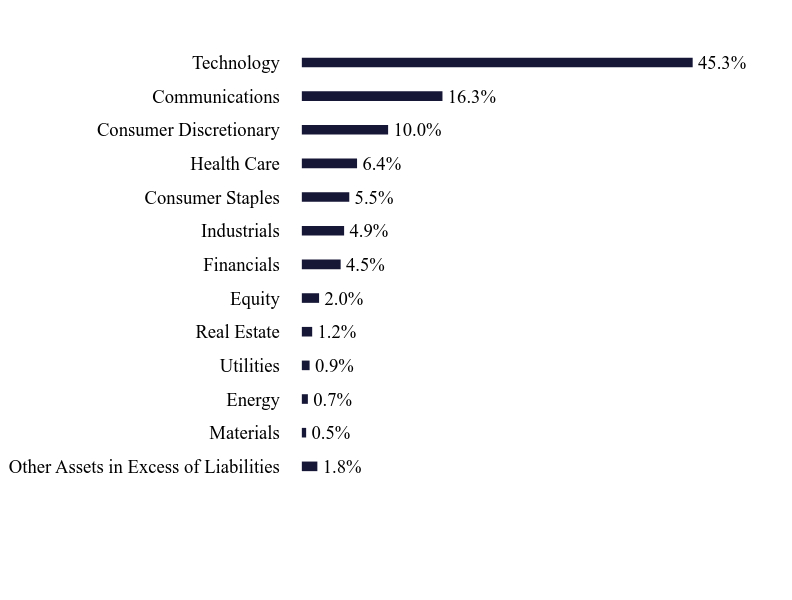
Other Assets in Excess of Liabilities | 1.8% | Materials | 0.5% | Energy | 0.7% | Utilities | 0.9% | Real Estate | 1.2% | Equity | 2.0% | Financials | 4.5% | Industrials | 4.9% | Consumer Staples | 5.5% | Health Care | 6.4% | Consumer Discretionary | 10.0% | Communications | 16.3% | Technology | 45.3% |
Industry comparisons within this Tailored Shareholder Report (TSR) are based on the Bloomberg Industry Classification Standard (BICS), which provides a hierarchical system for classifying companies by their primary source of revenue. |
| Largest Holdings [Text Block] |
Top 10 Holdings (% of net assets)Holding Name | % of Net Assets |
|---|
NVIDIA Corporation | 9.4% |
|---|
Microsoft Corporation | 8.8% |
|---|
Apple, Inc. | 7.6% |
|---|
Meta Platforms, Inc. - Class A | 5.6% |
|---|
Broadcom, Inc. | 4.9% |
|---|
Amazon.com, Inc. | 4.8% |
|---|
Alphabet, Inc. - Class A | 3.0% |
|---|
Tesla, Inc. | 3.0% |
|---|
Visa, Inc. - Class A | 2.2% |
|---|
Netflix, Inc. | 2.1% |
|---|
|
| Material Fund Change [Text Block] |
No material changes occurred during the period ended June 30, 2025. |
| C000253504 |
|
| Shareholder Report [Line Items] |
|
| Fund Name |
NAA Mid Growth Series
|
| Trading Symbol |
MGS
|
| Annual or Semi-Annual Statement [Text Block] |
This semi-annual shareholder report contains important information about NAA Mid Growth Series for the period of January 1, 2025 to June 30, 2025.
|
| Shareholder Report Annual or Semi-Annual |
Semi-Annual Shareholder Report
|
| Additional Information [Text Block] |
You can find additional information about the Fund at www.NAAFunds.com. You can also request this information by contacting us at 833-840-3937.
|
| Additional Information Phone Number |
833-840-3937
|
| Additional Information Website |
www.NAAFunds.com
|
| Expenses [Text Block] |
What were the Fund’s costs for the last six months?(based on a hypothetical $10,000 investment) Class Name | Costs of a $10,000 investment | Costs paid as a percentage of a $10,000 investment |
|---|
VIT | $48 | 0.97%Footnote Reference* |
|---|
|
| Expenses Paid, Amount |
$ 48
|
| Expense Ratio, Percent |
0.97%
|
| AssetsNet |
$ 169,992,301
|
| Holdings Count | Holding |
127
|
| Advisory Fees Paid, Amount |
$ 400,784
|
| InvestmentCompanyPortfolioTurnover |
56.00%
|
| Additional Fund Statistics [Text Block] |
- Net Assets$169,992,301
- Number of Portfolio Holdings127
- Advisory Fee (net of waivers)$400,784
- Portfolio Turnover56%
|
| Holdings [Text Block] |
Asset Weighting (% of total investments)Value | Value |
|---|
Common Stocks | 98.0% | Exchange-Traded Funds | 2.0% |
Sector Weighting (% of net assets)Value | Value |
|---|
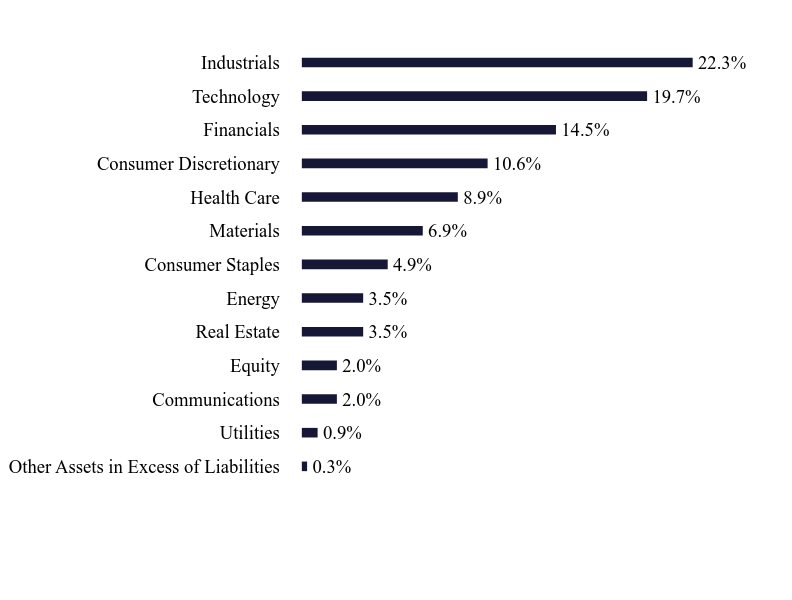
Other Assets in Excess of Liabilities | 0.3% | Utilities | 0.9% | Communications | 2.0% | Equity | 2.0% | Real Estate | 3.5% | Energy | 3.5% | Consumer Staples | 4.9% | Materials | 6.9% | Health Care | 8.9% | Consumer Discretionary | 10.6% | Financials | 14.5% | Technology | 19.7% | Industrials | 22.3% |
Industry comparisons within this Tailored Shareholder Report (TSR) are based on the Bloomberg Industry Classification Standard (BICS), which provides a hierarchical system for classifying companies by their primary source of revenue. Top 10 Holdings (% of net assets)Holding Name | % of Net Assets |
|---|
EMCOR Group, Inc. | 1.6% |
|---|
Comfort Systems USA, Inc. | 1.5% |
|---|
Equitable Holdings, Inc. | 1.5% |
|---|
Curtiss-Wright Corporation | 1.5% |
|---|
Interactive Brokers Group, Inc. - Class A | 1.5% |
|---|
Ecolab, Inc. | 1.5% |
|---|
Colgate-Palmolive Company | 1.5% |
|---|
Simon Property Group, Inc. | 1.5% |
|---|
RB Global, Inc. | 1.5% |
|---|
DocuSign, Inc. | 1.5% |
|---|
|
| Material Fund Change [Text Block] |
No material changes occurred during the period ended June 30, 2025. |
| C000253505 |
|
| Shareholder Report [Line Items] |
|
| Fund Name |
NAA Small Cap Value Series
|
| Trading Symbol |
SCVS
|
| Annual or Semi-Annual Statement [Text Block] |
This semi-annual shareholder report contains important information about NAA Small Cap Value Series for the period of January 1, 2025 to June 30, 2025.
|
| Shareholder Report Annual or Semi-Annual |
Semi-Annual Shareholder Report
|
| Additional Information [Text Block] |
You can find additional information about the Fund at www.NAAFunds.com. You can also request this information by contacting us at 833-840-3937.
|
| Additional Information Phone Number |
833-840-3937
|
| Additional Information Website |
www.NAAFunds.com
|
| Expenses [Text Block] |
What were the Fund’s costs for the last six months?(based on a hypothetical $10,000 investment) Class Name | Costs of a $10,000 investment | Costs paid as a percentage of a $10,000 investment |
|---|
VIT | $54 | 1.14%Footnote Reference* |
|---|
|
| Expenses Paid, Amount |
$ 54
|
| Expense Ratio, Percent |
1.14%
|
| AssetsNet |
$ 47,342,448
|
| Holdings Count | Holding |
127
|
| Advisory Fees Paid, Amount |
$ 128,079
|
| InvestmentCompanyPortfolioTurnover |
68.00%
|
| Additional Fund Statistics [Text Block] |
- Net Assets$47,342,448
- Number of Portfolio Holdings127
- Advisory Fee (net of waivers)$128,079
- Portfolio Turnover68%
|
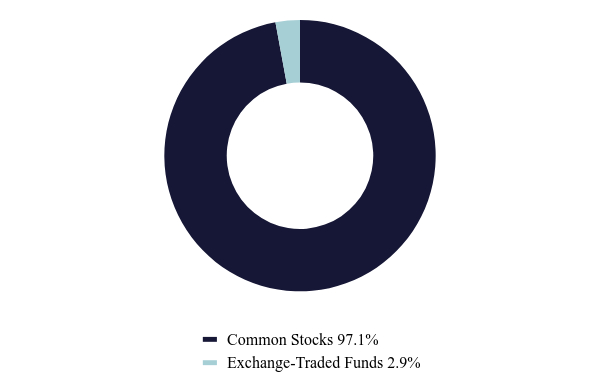
| Holdings [Text Block] |
Asset Weighting (% of total investments)Value | Value |
|---|
Common Stocks | 97.1% | Exchange-Traded Funds | 2.9% |
Sector Weighting (% of net assets)Value | Value |
|---|
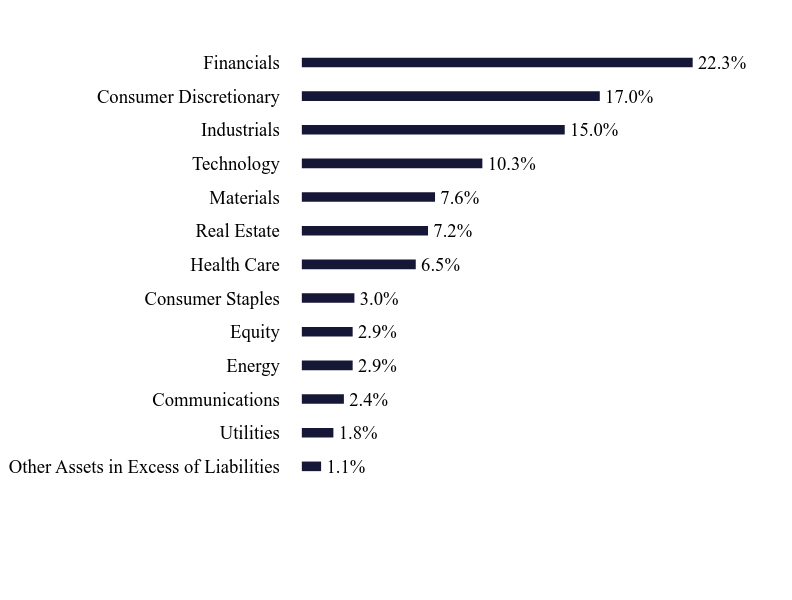
Other Assets in Excess of Liabilities | 1.1% | Utilities | 1.8% | Communications | 2.4% | Energy | 2.9% | Equity | 2.9% | Consumer Staples | 3.0% | Health Care | 6.5% | Real Estate | 7.2% | Materials | 7.6% | Technology | 10.3% | Industrials | 15.0% | Consumer Discretionary | 17.0% | Financials | 22.3% |
Industry comparisons within this Tailored Shareholder Report (TSR) are based on the Bloomberg Industry Classification Standard (BICS), which provides a hierarchical system for classifying companies by their primary source of revenue. |
| Largest Holdings [Text Block] |
Top 10 Holdings (% of net assets)Holding Name | % of Net Assets |
|---|
Comerica, Inc. | 2.4% |
|---|
Qorvo, Inc. | 2.4% |
|---|
Autoliv, Inc. | 2.2% |
|---|
BorgWarner, Inc. | 2.2% |
|---|
Celanese Corporation | 1.9% |
|---|
Air Lease Corporation | 1.8% |
|---|
Lincoln National Corporation | 1.7% |
|---|
GXO Logistics, Inc. | 1.7% |
|---|
Teleflex, Inc. | 1.6% |
|---|
Selective Insurance Group, Inc. | 1.5% |
|---|
|
| Material Fund Change [Text Block] |
No material changes occurred during the period ended June 30, 2025. |
| C000253506 |
|
| Shareholder Report [Line Items] |
|
| Fund Name |
NAA Small Growth Series
|
| Trading Symbol |
SGS
|
| Annual or Semi-Annual Statement [Text Block] |
This semi-annual shareholder report contains important information about NAA Small Growth Series for the period of January 1, 2025 to June 30, 2025.
|
| Shareholder Report Annual or Semi-Annual |
Semi-Annual Shareholder Report
|
| Additional Information [Text Block] |
You can find additional information about the Fund at www.NAAFunds.com. You can also request this information by contacting us at 833-840-3937.
|
| Additional Information Phone Number |
833-840-3937
|
| Additional Information Website |
www.NAAFunds.com
|
| Expenses [Text Block] |
What were the Fund’s costs for the last six months?(based on a hypothetical $10,000 investment) Class Name | Costs of a $10,000 investment | Costs paid as a percentage of a $10,000 investment |
|---|
VIT | $54 | 1.07%Footnote Reference* |
|---|
|
| Expenses Paid, Amount |
$ 54
|
| Expense Ratio, Percent |
1.07%
|
| AssetsNet |
$ 25,354,334
|
| Holdings Count | Holding |
128
|
| Advisory Fees Paid, Amount |
$ 15,013
|
| InvestmentCompanyPortfolioTurnover |
38.00%
|
| Additional Fund Statistics [Text Block] |
- Net Assets$25,354,334
- Number of Portfolio Holdings128
- Advisory Fee (net of waivers)$15,013
- Portfolio Turnover38%
|
| Holdings [Text Block] |
Asset Weighting (% of total investments)Value | Value |
|---|
Common Stocks | 98.0% | Exchange-Traded Funds | 2.0% |
Sector Weighting (% of net assets)Value | Value |
|---|
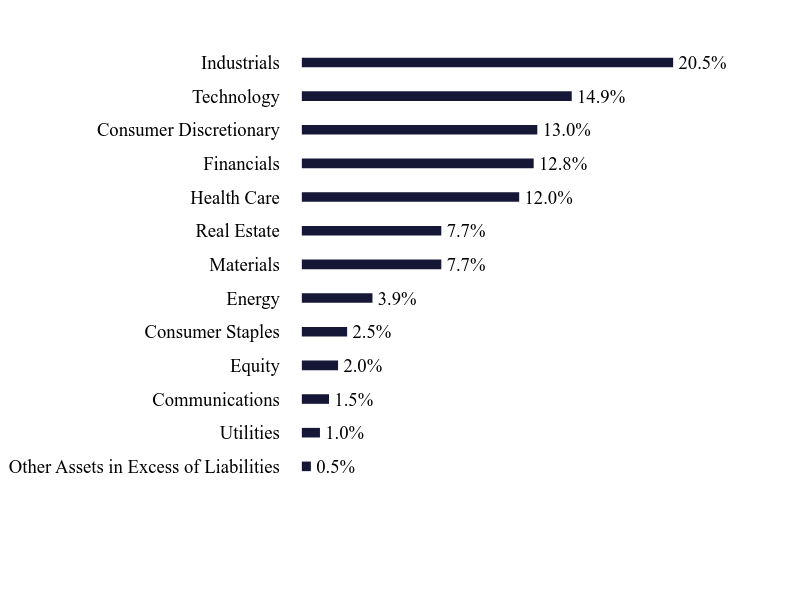
Other Assets in Excess of Liabilities | 0.5% | Utilities | 1.0% | Communications | 1.5% | Equity | 2.0% | Consumer Staples | 2.5% | Energy | 3.9% | Materials | 7.7% | Real Estate | 7.7% | Health Care | 12.0% | Financials | 12.8% | Consumer Discretionary | 13.0% | Technology | 14.9% | Industrials | 20.5% |
Industry comparisons within this Tailored Shareholder Report (TSR) are based on the Bloomberg Industry Classification Standard (BICS), which provides a hierarchical system for classifying companies by their primary source of revenue. |
| Largest Holdings [Text Block] |
Top 10 Holdings (% of net assets)Holding Name | % of Net Assets |
|---|
Dynatrace, Inc. | 3.0% |
|---|
Carpenter Technology Corporation | 2.5% |
|---|
ATI, Inc. | 2.3% |
|---|
HealthEquity, Inc. | 1.8% |
|---|
SPX Technologies, Inc. | 1.5% |
|---|
AeroVironment, Inc. | 1.5% |
|---|
CommVault Systems, Inc. | 1.5% |
|---|
Masimo Corporation | 1.5% |
|---|
Brinker International, Inc. | 1.4% |
|---|
ExlService Holdings, Inc. | 1.4% |
|---|
|
| Material Fund Change [Text Block] |
No material changes occurred during the period ended June 30, 2025. |
| C000253507 |
|
| Shareholder Report [Line Items] |
|
| Fund Name |
NAA SMid-Cap Value Series
|
| Trading Symbol |
SMID
|
| Annual or Semi-Annual Statement [Text Block] |
This semi-annual shareholder report contains important information about NAA SMid-Cap Value Series for the period of January 1, 2025 to June 30, 2025.
|
| Shareholder Report Annual or Semi-Annual |
Semi-Annual Shareholder Report
|
| Additional Information [Text Block] |
You can find additional information about the Fund at www.NAAFunds.com. You can also request this information by contacting us at 833-840-3937.
|
| Additional Information Phone Number |
833-840-3937
|
| Additional Information Website |
www.NAAFunds.com
|
| Expenses [Text Block] |
What were the Fund’s costs for the last six months?(based on a hypothetical $10,000 investment) Class Name | Costs of a $10,000 investment | Costs paid as a percentage of a $10,000 investment |
|---|
VIT | $47 | 0.94%Footnote Reference* |
|---|
|
| Expenses Paid, Amount |
$ 47
|
| Expense Ratio, Percent |
0.94%
|
| AssetsNet |
$ 133,317,636
|
| Holdings Count | Holding |
122
|
| Advisory Fees Paid, Amount |
$ 301,851
|
| InvestmentCompanyPortfolioTurnover |
61.00%
|
| Additional Fund Statistics [Text Block] |
- Net Assets$133,317,636
- Number of Portfolio Holdings122
- Advisory Fee (net of waivers)$301,851
- Portfolio Turnover61%
|
| Holdings [Text Block] |
Asset Weighting (% of total investments)Value | Value |
|---|
Common Stocks | 98.0% | Exchange-Traded Funds | 2.0% |
Sector Weighting (% of net assets)Value | Value |
|---|
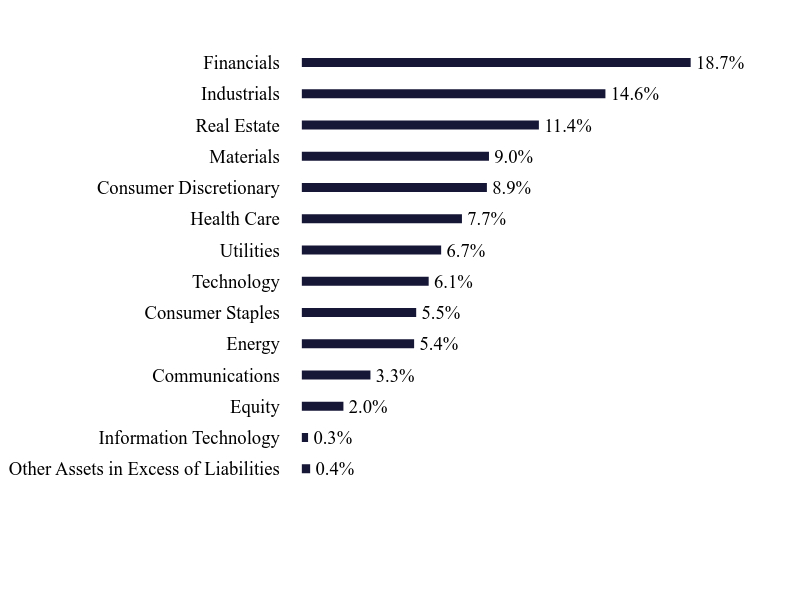
Other Assets in Excess of Liabilities | 0.4% | Information Technology | 0.3% | Equity | 2.0% | Communications | 3.3% | Energy | 5.4% | Consumer Staples | 5.5% | Technology | 6.1% | Utilities | 6.7% | Health Care | 7.7% | Consumer Discretionary | 8.9% | Materials | 9.0% | Real Estate | 11.4% | Industrials | 14.6% | Financials | 18.7% |
Industry comparisons within this Tailored Shareholder Report (TSR) are based on the Bloomberg Industry Classification Standard (BICS), which provides a hierarchical system for classifying companies by their primary source of revenue. Top 10 Holdings (% of net assets)Holding Name | % of Net Assets |
|---|
First Horizon Corporation | 1.6% |
|---|
Alcoa Corporation | 1.5% |
|---|
Ecolab, Inc. | 1.5% |
|---|
Unum Group | 1.5% |
|---|
Cardinal Health, Inc. | 1.5% |
|---|
Autoliv, Inc. | 1.5% |
|---|
Reinsurance Group of America, Inc. | 1.5% |
|---|
NNN REIT, Inc. | 1.5% |
|---|
OGE Energy Corporation | 1.5% |
|---|
Oshkosh Corporation | 1.4% |
|---|
|
| Material Fund Change [Text Block] |
No material changes occurred during the period ended June 30, 2025. |
| C000253508 |
|
| Shareholder Report [Line Items] |
|
| Fund Name |
NAA World Equity Income Series
|
| Trading Symbol |
WEI
|
| Annual or Semi-Annual Statement [Text Block] |
This semi-annual shareholder report contains important information about NAA World Equity Income Series for the period of January 1, 2025 to June 30, 2025.
|
| Shareholder Report Annual or Semi-Annual |
Semi-Annual Shareholder Report
|
| Additional Information [Text Block] |
You can find additional information about the Fund at www.NAAFunds.com. You can also request this information by contacting us at 833-840-3937.
|
| Additional Information Phone Number |
833-840-3937
|
| Additional Information Website |
www.NAAFunds.com
|
| Expenses [Text Block] |
What were the Fund’s costs for the last six months?(based on a hypothetical $10,000 investment) Class Name | Costs of a $10,000 investment | Costs paid as a percentage of a $10,000 investment |
|---|
VIT | $48 | 0.93%Footnote Reference* |
|---|
|
| Expenses Paid, Amount |
$ 48
|
| Expense Ratio, Percent |
0.93%
|
| AssetsNet |
$ 112,310,300
|
| Holdings Count | Holding |
177
|
| Advisory Fees Paid, Amount |
$ 240,942
|
| InvestmentCompanyPortfolioTurnover |
90.00%
|
| Additional Fund Statistics [Text Block] |
- Net Assets$112,310,300
- Number of Portfolio Holdings177
- Advisory Fee (net of waivers)$240,942
- Portfolio Turnover90%
|
| Holdings [Text Block] |
Asset Weighting (% of total investments)Value | Value |
|---|
Common Stocks | 98.0% | Exchange-Traded Funds | 2.0% |
Country Weighting (% of net assets)Value | Value |
|---|
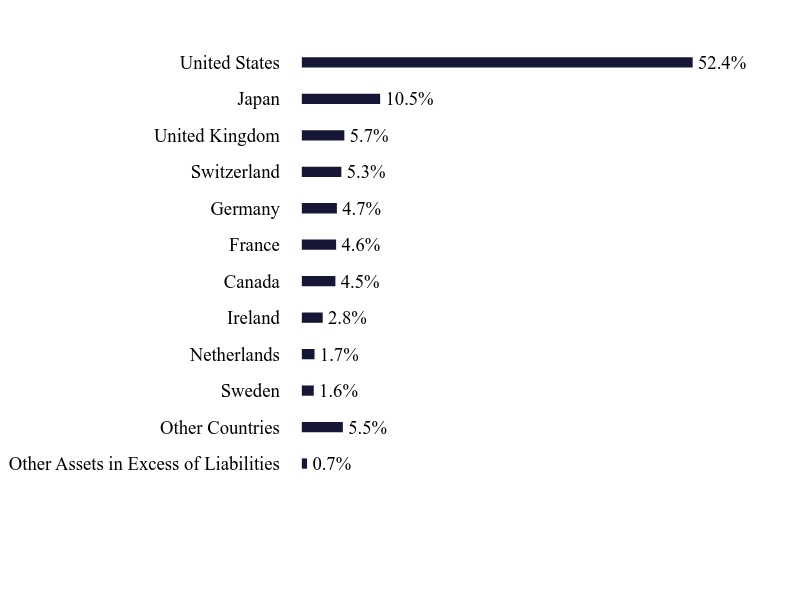
Other Assets in Excess of Liabilities | 0.7% | Other Countries | 5.5% | Sweden | 1.6% | Netherlands | 1.7% | Ireland | 2.8% | Canada | 4.5% | France | 4.6% | Germany | 4.7% | Switzerland | 5.3% | United Kingdom | 5.7% | Japan | 10.5% | United States | 52.4% |
Country weightings within this Tailored Shareholder Report (TSR) are based on the country of risk provided by ICE, the pricing vendor, at the time the security is set up |
| Largest Holdings [Text Block] |
Top 10 Holdings (% of net assets)Holding Name | % of Net Assets |
|---|
Broadcom, Inc. | 6.6% |
|---|
JPMorgan Chase & Company | 4.4% |
|---|
Siemens A.G. | 2.8% |
|---|
Exxon Mobil Corporation | 2.5% |
|---|
Walmart, Inc. | 2.4% |
|---|
Home Depot, Inc. (The) | 2.1% |
|---|
HSBC Holdings PLC | 2.1% |
|---|
Mitsubishi UFJ Financial Group, Inc. | 2.0% |
|---|
Sony Group Corporation | 1.9% |
|---|
Coca-Cola Company (The) | 1.6% |
|---|
|
| Material Fund Change [Text Block] |
No material changes occurred during the period ended June 30, 2025. |