Shareholder Report
Jun. 30, 2025
USD ($)
Holding
This report describes changes to the Fund that occurred during the reporting period.
Fund Expenses
Based on a hypothetical $10,000 investment
| Fund | Cost of $10,000 investment | Costs paid as a percentage of a $10,000 investment |
| Money Market Fund | $29 | 0.58% |
Key Fund Statistics
| Fund net assets | $126,925,595 |
| Total number of portfolio holdings | 27 |
| Total advisory fee paid | $213,096 |
Graphical Representation of Holdings
The tables below show the investment makeup of the Fund, with each category representing a percentage of the Fund's total investments.
Top 10 Holdings
| Federal National Mortgage 4.246%, 07/16/25 |
6.3% |
| Federal National Mortgage 0.450%, 08/21/25 |
4.7% |
| Federal Farm Credit Banks 4.249%, 07/09/25 |
3.9% |
| Tennessee Valley Authority 4.215%, 07/09/25 |
3.9% |
| Freddie Mac Discount Notes 4.229%, 07/11/25 |
3.9% |
| Federal Farm Credit Banks 4.257%, 07/14/25 |
3.9% |
| U.S. Treasury Bills 4.248%, 07/31/25 |
3.9% |
| Federal Farm Credit Banks 4.265%, 08/07/25 |
3.9% |
| U.S. Treasury Bills 4.321%, 08/14/25 |
3.9% |
| U.S. Treasury Bills 4.413%, 08/19/25 |
3.9% |
Material Fund Changes
There were no material changes during the reporting period.
Changes in and Disagreements with Accountants
There were no changes in or disagreements with accountants during the reporting period.
This report describes changes to the Fund that occurred during the reporting period.
Fund Expenses
Based on a hypothetical $10,000 investment
| Fund | Cost of $10,000 investment | Costs paid as a percentage of a $10,000 investment |
| Limited Maturity Bond Fund | $37 | 0.74% |
Key Fund Statistics
| Fund net assets | $70,572,588 |
| Total number of portfolio holdings | 54 |
| Total advisory fee paid (net of waivers) | $147,735 |
| Portfolio turnover rate | 8% |
| Weighted Average Maturity | 5.0 Years |
| Effective Duration | 1.7 Years |
Graphical Representation of Holdings
The tables below show the investment makeup of the Fund, with each category representing a percentage of the Fund's total investments.
Asset Class Allocation
| Corporate Bonds | 34.7% |
| Residential Mortgage Backed Securities | 28.2% |
| Asset Backed Securities | 27.1% |
| Commercial Mortgage Backed Securities | 5.0% |
| U.S. Treasury Obligations | 2.8% |
| Money Market Funds | 2.2% |
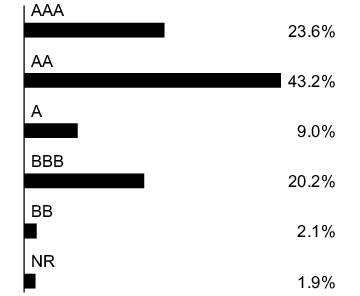
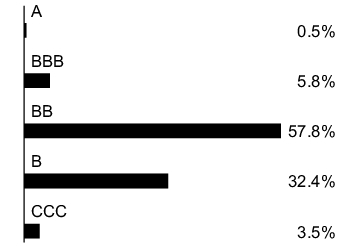
Bond Quality Allocation 1
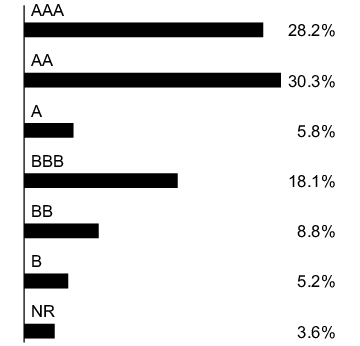
1 Source: Independent Rating Agencies such as Moody’s, S&P and Fitch.
Note: When ratings from all three agencies are available, the median rating is used. When ratings are available from two of the agencies, the lower rating is used. When one rating is available, that rating is used. "NR" is used to classify securities for which a rating is not available.
Material Fund Changes
There were no material changes during the reporting period.
Changes in and Disagreements with Accountants
There were no changes in or disagreements with accountants during the reporting period.
This report describes changes to the Fund that occurred during the reporting period.
Fund Expenses
Based on a hypothetical $10,000 investment
| Fund | Cost of $10,000 investment | Costs paid as a percentage of a $10,000 investment |
| Index 500 Fund | $17 | 0.34% |
Key Fund Statistics
| Fund net assets | $875,446,317 |
| Total number of portfolio holdings | 506 |
| Total advisory fee paid | $518,924 |
| Portfolio turnover rate | 2% |
Graphical Representation of Holdings
The tables below show the investment makeup of the Fund, with each category representing a percentage of the Fund's total investments.
Top 10 Holdings
| NVIDIA Corp. | 7.3% |
| Microsoft Corp. | 7.0% |
| Apple, Inc. | 5.8% |
| Amazon.com, Inc. | 3.9% |
| Meta Platforms, Inc., Class A | 3.0% |
| Broadcom, Inc. | 2.5% |
| Alphabet, Inc., Class A | 2.0% |
| Berkshire Hathaway, Inc., Class B | 1.7% |
| Tesla, Inc. | 1.7% |
| Alphabet, Inc., Class C | 1.6% |
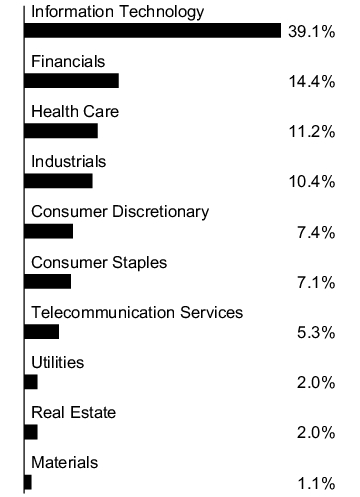
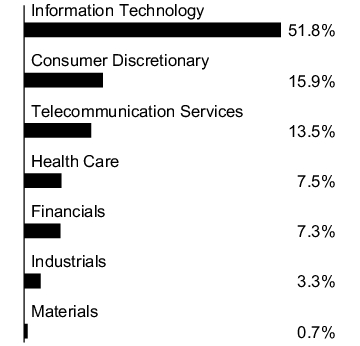
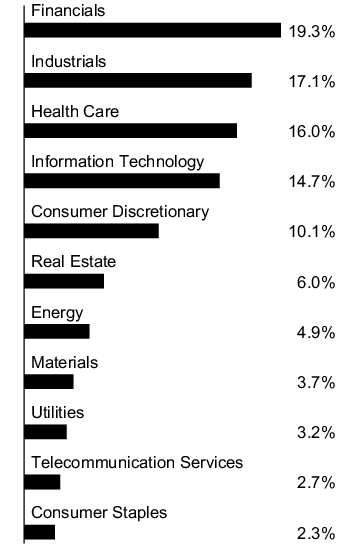
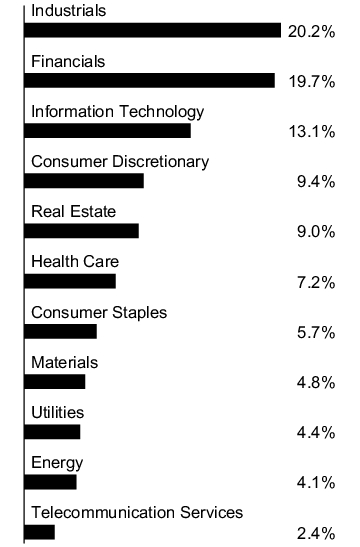
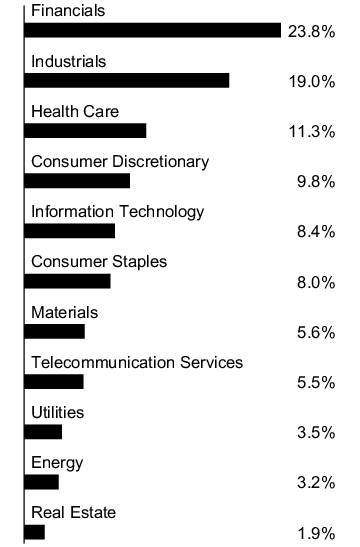
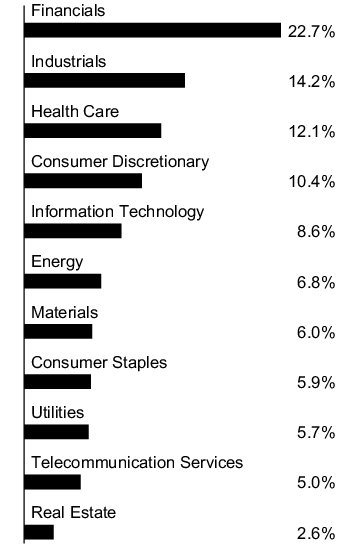
Sector Allocation 1
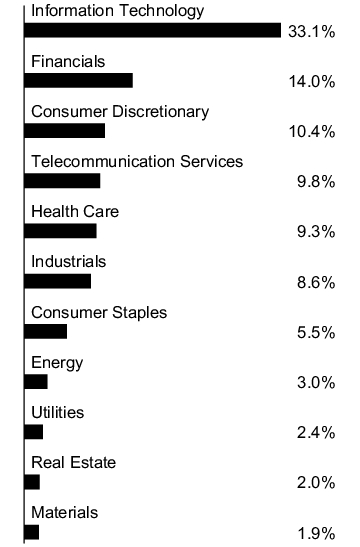
1 Sector allocation is presented as a percentage of total investments before short-term investments.
Top 10 Holdings
| NVIDIA Corp. | 7.3% |
| Microsoft Corp. | 7.0% |
| Apple, Inc. | 5.8% |
| Amazon.com, Inc. | 3.9% |
| Meta Platforms, Inc., Class A | 3.0% |
| Broadcom, Inc. | 2.5% |
| Alphabet, Inc., Class A | 2.0% |
| Berkshire Hathaway, Inc., Class B | 1.7% |
| Tesla, Inc. | 1.7% |
| Alphabet, Inc., Class C | 1.6% |
Material Fund Changes
There were no material changes during the reporting period.
Changes in and Disagreements with Accountants
There were no changes in or disagreements with accountants during the reporting period.
This report describes changes to the Fund that occurred during the reporting period.
Fund Expenses
Based on a hypothetical $10,000 investment
| Fund | Cost of $10,000 investment | Costs paid as a percentage of a $10,000 investment |
| Mid Cap Growth Fund | $49 | 0.97% |
Key Fund Statistics
| Fund net assets | $128,328,520 |
| Total number of portfolio holdings | 67 |
| Total advisory fee paid | $427,194 |
| Portfolio turnover rate | 28% |
Graphical Representation of Holdings
The tables below show the investment makeup of the Fund, with each category representing a percentage of the Fund's total investments.
Top 10 Holdings
| IDEXX Laboratories, Inc. | 3.5% |
| CoStar Group, Inc. | 3.4% |
| Royal Caribbean Cruises Ltd. | 3.1% |
| Insulet Corp. | 2.6% |
| Cloudflare, Inc., Class A | 2.6% |
| Fastenal Co. | 2.5% |
| Datadog, Inc., Class A | 2.4% |
| Howmet Aerospace, Inc. | 2.3% |
| HEICO Corp., Class A | 2.1% |
| LPL Financial Holdings, Inc. | 2.0% |
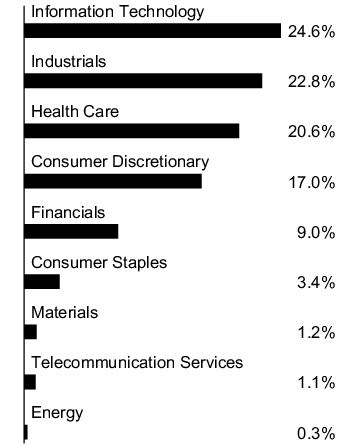
Sector Allocation 1
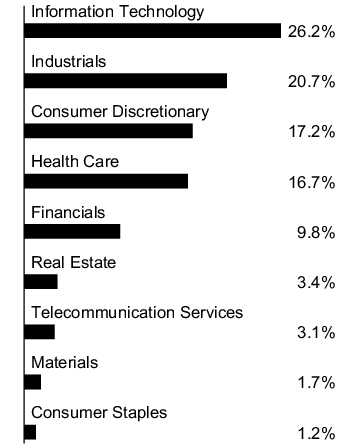
1 Sector allocation is presented as a percentage of total investments before short-term investments.
Top 10 Holdings
| IDEXX Laboratories, Inc. | 3.5% |
| CoStar Group, Inc. | 3.4% |
| Royal Caribbean Cruises Ltd. | 3.1% |
| Insulet Corp. | 2.6% |
| Cloudflare, Inc., Class A | 2.6% |
| Fastenal Co. | 2.5% |
| Datadog, Inc., Class A | 2.4% |
| Howmet Aerospace, Inc. | 2.3% |
| HEICO Corp., Class A | 2.1% |
| LPL Financial Holdings, Inc. | 2.0% |
Material Fund Changes
There were no material changes during the reporting period.
Changes in and Disagreements with Accountants
There were no changes in or disagreements with accountants during the reporting period.
This report describes changes to the Fund that occurred during the reporting period.
Fund Expenses
Based on a hypothetical $10,000 investment
| Fund | Cost of $10,000 investment | Costs paid as a percentage of a $10,000 investment |
| Mid Cap Value Fund | $41 | 0.83% |
Key Fund Statistics
| Fund net assets | $85,446,139 |
| Total number of portfolio holdings | 74 |
| Total advisory fee paid (net of waivers) | $225,922 |
| Portfolio turnover rate | 23% |
Graphical Representation of Holdings
The tables below show the investment makeup of the Fund, with each category representing a percentage of the Fund's total investments.
Top 10 Holdings
| Casey's General Stores, Inc. | 2.7% |
| Expand Energy Corp. | 2.5% |
| Freeport-McMoRan, Inc. | 2.4% |
| Alliant Energy Corp. | 2.4% |
| The Hartford Insurance Group, Inc. | 2.2% |
| BWX Technologies, Inc. | 2.2% |
| Agree Realty Corp. | 2.2% |
| Axis Capital Holdings Ltd. | 2.0% |
| TransUnion | 2.0% |
| Ally Financial, Inc. | 2.0% |
Sector Allocation 1
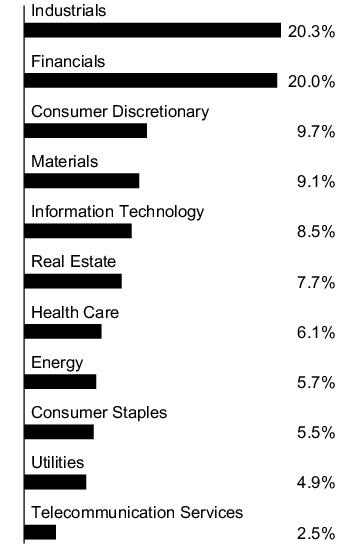
1 Sector allocation is presented as a percentage of total investments before short-term investments.
Top 10 Holdings
| Casey's General Stores, Inc. | 2.7% |
| Expand Energy Corp. | 2.5% |
| Freeport-McMoRan, Inc. | 2.4% |
| Alliant Energy Corp. | 2.4% |
| The Hartford Insurance Group, Inc. | 2.2% |
| BWX Technologies, Inc. | 2.2% |
| Agree Realty Corp. | 2.2% |
| Axis Capital Holdings Ltd. | 2.0% |
| TransUnion | 2.0% |
| Ally Financial, Inc. | 2.0% |
Material Fund Changes
There were no material changes during the reporting period.
Changes in and Disagreements with Accountants
There were no changes in or disagreements with accountants during the reporting period.
This report describes changes to the Fund that occurred during the reporting period.
Fund Expenses
Based on a hypothetical $10,000 investment
| Fund | Cost of $10,000 investment | Costs paid as a percentage of a $10,000 investment |
| Large Cap Growth Fund | $43 | 0.86% |
Key Fund Statistics
| Fund net assets | $71,178,973 |
| Total number of portfolio holdings | 57 |
| Total advisory fee paid | $180,359 |
| Portfolio turnover rate | 7% |
Graphical Representation of Holdings
The tables below show the investment makeup of the Fund, with each category representing a percentage of the Fund's total investments.
Top 10 Holdings
| Microsoft Corp. | 15.1% |
| NVIDIA Corp. | 6.4% |
| Apple, Inc. | 4.7% |
| Visa, Inc., Class A | 4.0% |
| Accenture PLC, Class A | 2.9% |
| Salesforce, Inc. | 2.3% |
| TransUnion | 2.3% |
| Alphabet, Inc., Class A | 2.3% |
| Eaton Corp. PLC | 2.3% |
| Aon PLC, Class A | 2.3% |
Sector Allocation 1
1 Sector allocation is presented as a percentage of total investments before short-term investments.
Top 10 Holdings
| Microsoft Corp. | 15.1% |
| NVIDIA Corp. | 6.4% |
| Apple, Inc. | 4.7% |
| Visa, Inc., Class A | 4.0% |
| Accenture PLC, Class A | 2.9% |
| Salesforce, Inc. | 2.3% |
| TransUnion | 2.3% |
| Alphabet, Inc., Class A | 2.3% |
| Eaton Corp. PLC | 2.3% |
| Aon PLC, Class A | 2.3% |
Material Fund Changes
There were no material changes during the reporting period.
Changes in and Disagreements with Accountants
There were no changes in or disagreements with accountants during the reporting period.
This report describes changes to the Fund that occurred during the reporting period.
Fund Expenses
Based on a hypothetical $10,000 investment
| Fund | Cost of $10,000 investment | Costs paid as a percentage of a $10,000 investment |
| Mid Core Value Fund | $53 | 1.05% |
Key Fund Statistics
| Fund net assets | $73,295,856 |
| Total number of portfolio holdings | 116 |
| Total advisory fee paid | $248,410 |
| Portfolio turnover rate | 39% |
Graphical Representation of Holdings
The tables below show the investment makeup of the Fund, with each category representing a percentage of the Fund's total investments.
Top 10 Holdings
| Zimmer Biomet Holdings, Inc. | 2.7% |
| Enterprise Products Partners LP | 2.1% |
| Henry Schein, Inc. | 2.1% |
| US Bancorp | 2.0% |
| Truist Financial Corp. | 2.0% |
| Willis Towers Watson PLC | 1.8% |
| Northern Trust Corp. | 1.8% |
| Labcorp Holdings, Inc. | 1.7% |
| Kenvue, Inc. | 1.7% |
| MSC Industrial Direct Co., Inc., Class A | 1.6% |
Sector Allocation 1
1 Sector allocation is presented as a percentage of total investments before short-term investments.
Top 10 Holdings
| Zimmer Biomet Holdings, Inc. | 2.7% |
| Enterprise Products Partners LP | 2.1% |
| Henry Schein, Inc. | 2.1% |
| US Bancorp | 2.0% |
| Truist Financial Corp. | 2.0% |
| Willis Towers Watson PLC | 1.8% |
| Northern Trust Corp. | 1.8% |
| Labcorp Holdings, Inc. | 1.7% |
| Kenvue, Inc. | 1.7% |
| MSC Industrial Direct Co., Inc., Class A | 1.6% |
Material Fund Changes
There were no material changes during the reporting period.
Changes in and Disagreements with Accountants
There were no changes in or disagreements with accountants during the reporting period.
This report describes changes to the Fund that occurred during the reporting period.
Fund Expenses
Based on a hypothetical $10,000 investment
| Fund | Cost of $10,000 investment | Costs paid as a percentage of a $10,000 investment |
| Real Estate Securities Fund | $49 | 0.98% |
Key Fund Statistics
| Fund net assets | $99,609,857 |
| Total number of portfolio holdings | 39 |
| Total advisory fee paid | $347,359 |
| Portfolio turnover rate | 12% |
Graphical Representation of Holdings
The tables below show the investment makeup of the Fund, with each category representing a percentage of the Fund's total investments.
Top 10 Holdings
| Welltower, Inc. | 10.1% |
| Digital Realty Trust, Inc. | 7.4% |
| American Tower Corp. | 6.0% |
| Crown Castle, Inc. | 5.8% |
| SBA Communications Corp. | 5.7% |
| Prologis, Inc. | 5.4% |
| Sun Communities, Inc. | 4.5% |
| Invitation Homes, Inc. | 4.1% |
| Extra Space Storage, Inc. | 3.9% |
| Equinix, Inc. | 3.8% |
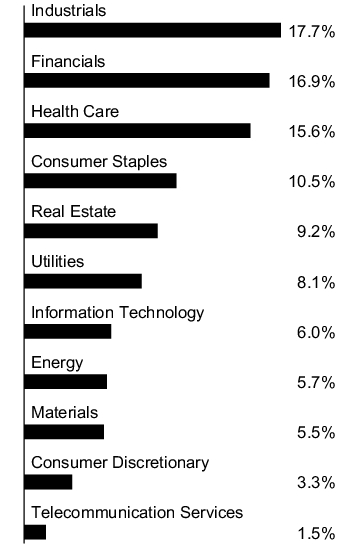
Sector Allocation 1
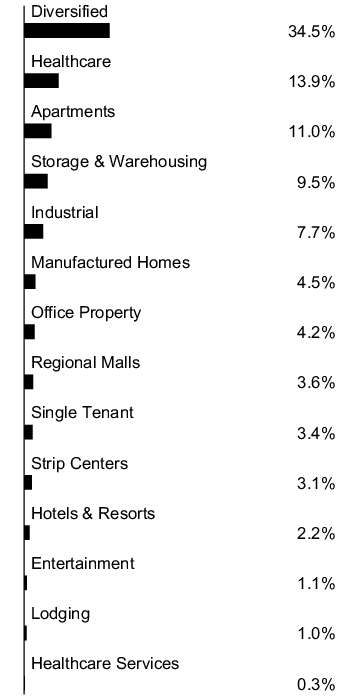
1 Sector allocation is presented as a percentage of total investments before short-term investments.
Top 10 Holdings
| Welltower, Inc. | 10.1% |
| Digital Realty Trust, Inc. | 7.4% |
| American Tower Corp. | 6.0% |
| Crown Castle, Inc. | 5.8% |
| SBA Communications Corp. | 5.7% |
| Prologis, Inc. | 5.4% |
| Sun Communities, Inc. | 4.5% |
| Invitation Homes, Inc. | 4.1% |
| Extra Space Storage, Inc. | 3.9% |
| Equinix, Inc. | 3.8% |
Material Fund Changes
There were no material changes during the reporting period.
Changes in and Disagreements with Accountants
There were no changes in or disagreements with accountants during the reporting period.
This report describes changes to the Fund that occurred during the reporting period.
Fund Expenses
Based on a hypothetical $10,000 investment
| Fund | Cost of $10,000 investment | Costs paid as a percentage of a $10,000 investment |
| Quality Bond Fund | $34 | 0.68% |
Key Fund Statistics
| Fund net assets | $350,310,194 |
| Total number of portfolio holdings | 124 |
| Total advisory fee paid | $787,888 |
| Portfolio turnover rate | 16% |
| Weighted Average Maturity | 9.9 Years |
| Effective Duration | 5.9 Years |
Graphical Representation of Holdings
The tables below show the investment makeup of the Fund, with each category representing a percentage of the Fund's total investments.
Asset Class Allocation
| Residential Mortgage Backed Securities | 45.0% |
| Corporate Bonds | 24.4% |
| Commercial Mortgage Backed Securities | 12.6% |
| U.S. Treasury Obligations | 7.8% |
| Asset Backed Securities | 7.8% |
| Money Market Funds | 1.6% |
| Municipal Bonds | 0.8% |
Bond Quality Allocation 1
1 Source: Independent Rating Agencies such as Moody’s, S&P and Fitch.
Note: When ratings from all three agencies are available, the median rating is used. When ratings are available from two of the agencies, the lower rating is used. When one rating is available, that rating is used. "NR" is used to classify securities for which a rating is not available.
Material Fund Changes
There were no material changes during the reporting period.
Changes in and Disagreements with Accountants
There were no changes in or disagreements with accountants during the reporting period.
This report describes changes to the Fund that occurred during the reporting period.
Fund Expenses
Based on a hypothetical $10,000 investment
| Fund | Cost of $10,000 investment | Costs paid as a percentage of a $10,000 investment |
| High Yield Bond Fund | $37 | 0.73% |
Key Fund Statistics
| Fund net assets | $123,125,498 |
| Total number of portfolio holdings | 91 |
| Total advisory fee paid | $280,000 |
| Portfolio turnover rate | 81% |
| Weighted Average Maturity | 2.2 Years |
| Effective Duration | 3.0 Years |
Graphical Representation of Holdings
The tables below show the investment makeup of the Fund, with each category representing a percentage of the Fund's total investments.
Asset Class Allocation
| Corporate Bonds | 93.2% |
| Loan Agreements | 5.0% |
| Money Market Funds | 1.3% |
| Asset Backed Securities | 0.5% |
Bond Quality Allocation 1
1 Source: Independent Rating Agencies such as Moody’s, S&P and Fitch.
Note: When ratings from all three agencies are available, the median rating is used. When ratings are available from two of the agencies, the lower rating is used. When one rating is available, that rating is used. "NR" is used to classify securities for which a rating is not available.
Material Fund Changes
There were no material changes during the reporting period.
Changes in and Disagreements with Accountants
There were no changes in or disagreements with accountants during the reporting period.
This report describes changes to the Fund that occurred during the reporting period.
Fund Expenses
Based on a hypothetical $10,000 investment
| Fund | Cost of $10,000 investment | Costs paid as a percentage of a $10,000 investment |
| Large Growth Stock Fund | $47 | 0.92% |
Key Fund Statistics
| Fund net assets | $369,276,717 |
| Total number of portfolio holdings | 64 |
| Total advisory fee paid | $1,167,898 |
| Portfolio turnover rate | 17% |
Graphical Representation of Holdings
The tables below show the investment makeup of the Fund, with each category representing a percentage of the Fund's total investments.
Top 10 Holdings
| Microsoft Corp. | 13.2% |
| NVIDIA Corp. | 12.5% |
| Apple, Inc. | 7.9% |
| Amazon.com, Inc. | 7.5% |
| Meta Platforms, Inc., Class A | 5.4% |
| Broadcom, Inc. | 4.7% |
| Alphabet, Inc., Class A | 3.3% |
| Netflix, Inc. | 3.3% |
| Visa, Inc., Class A | 2.9% |
| Eli Lilly & Co. | 2.4% |
Sector Allocation 1
1 Sector allocation is presented as a percentage of total investments before short-term investments.
Top 10 Holdings
| Microsoft Corp. | 13.2% |
| NVIDIA Corp. | 12.5% |
| Apple, Inc. | 7.9% |
| Amazon.com, Inc. | 7.5% |
| Meta Platforms, Inc., Class A | 5.4% |
| Broadcom, Inc. | 4.7% |
| Alphabet, Inc., Class A | 3.3% |
| Netflix, Inc. | 3.3% |
| Visa, Inc., Class A | 2.9% |
| Eli Lilly & Co. | 2.4% |
Material Fund Changes
There were no material changes during the reporting period.
Changes in and Disagreements with Accountants
There were no changes in or disagreements with accountants during the reporting period.
This report describes changes to the Fund that occurred during the reporting period.
Fund Expenses
Based on a hypothetical $10,000 investment
| Fund | Cost of $10,000 investment | Costs paid as a percentage of a $10,000 investment |
| Large Cap Value Fund | $47 | 0.93% |
Key Fund Statistics
| Fund net assets | $162,003,664 |
| Total number of portfolio holdings | 74 |
| Total advisory fee paid | $533,446 |
| Portfolio turnover rate | 30% |
Graphical Representation of Holdings
The tables below show the investment makeup of the Fund, with each category representing a percentage of the Fund's total investments.
Top 10 Holdings
| JPMorgan Chase & Co. | 4.2% |
| Berkshire Hathaway, Inc., Class B | 3.9% |
| Philip Morris International, Inc. | 3.7% |
| Johnson & Johnson | 3.6% |
| Walmart, Inc. | 3.2% |
| RTX Corp. | 3.0% |
| EOG Resources, Inc. | 2.5% |
| Texas Instruments, Inc. | 2.5% |
| S&P Global, Inc. | 2.4% |
| Elevance Health, Inc. | 2.2% |
Sector Allocation 1
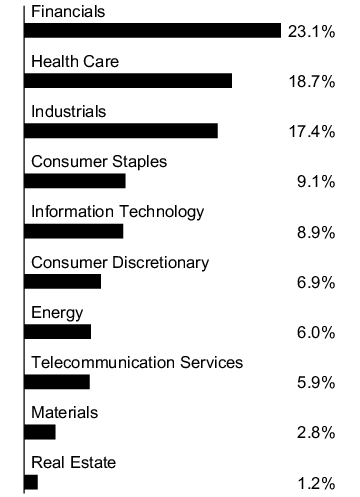
1 Sector allocation is presented as a percentage of total investments before short-term investments.
Top 10 Holdings
| JPMorgan Chase & Co. | 4.2% |
| Berkshire Hathaway, Inc., Class B | 3.9% |
| Philip Morris International, Inc. | 3.7% |
| Johnson & Johnson | 3.6% |
| Walmart, Inc. | 3.2% |
| RTX Corp. | 3.0% |
| EOG Resources, Inc. | 2.5% |
| Texas Instruments, Inc. | 2.5% |
| S&P Global, Inc. | 2.4% |
| Elevance Health, Inc. | 2.2% |
Material Fund Changes
There were no material changes during the reporting period.
Changes in and Disagreements with Accountants
There were no changes in or disagreements with accountants during the reporting period.
This report describes changes to the Fund that occurred during the reporting period.
Fund Expenses
Based on a hypothetical $10,000 investment
| Fund | Cost of $10,000 investment | Costs paid as a percentage of a $10,000 investment |
| Flexibly Managed Fund | $44 | 0.87% |
Key Fund Statistics
| Fund net assets | $5,127,362,114 |
| Total number of portfolio holdings | 245 |
| Total advisory fee paid | $17,206,136 |
| Portfolio turnover rate | 59% |
Graphical Representation of Holdings
The tables below show the investment makeup of the Fund, with each category representing a percentage of the Fund's total investments.
Top 10 Holdings
| Microsoft Corp. | 6.6% |
| U.S. Treasury Notes 4.000%, 02/28/30 |
4.3% |
| Amazon.com, Inc. | 4.2% |
| U.S. Treasury Notes 4.000%, 05/31/30 |
3.7% |
| NVIDIA Corp. | 3.5% |
| U.S. Treasury Notes 3.875%, 04/30/30 |
3.3% |
| Becton Dickinson & Co. | 2.7% |
| Roper Technologies, Inc. | 2.7% |
| U.S. Treasury Notes 4.000%, 03/31/30 |
2.5% |
| PTC, Inc. | 2.2% |
Sector Allocation 1
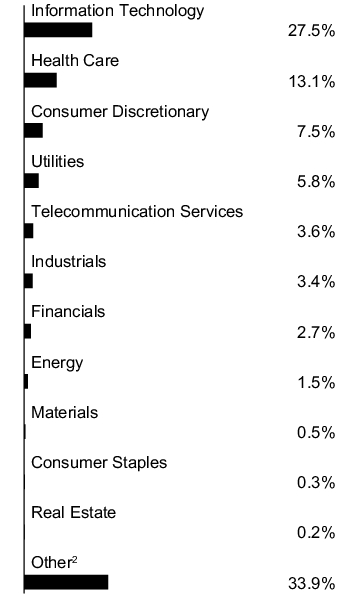
1 Sector allocation is presented as a percentage of total investments before short-term investments.
2 Includes non-equity investments.
Top 10 Holdings
| Microsoft Corp. | 6.6% |
| U.S. Treasury Notes 4.000%, 02/28/30 |
4.3% |
| Amazon.com, Inc. | 4.2% |
| U.S. Treasury Notes 4.000%, 05/31/30 |
3.7% |
| NVIDIA Corp. | 3.5% |
| U.S. Treasury Notes 3.875%, 04/30/30 |
3.3% |
| Becton Dickinson & Co. | 2.7% |
| Roper Technologies, Inc. | 2.7% |
| U.S. Treasury Notes 4.000%, 03/31/30 |
2.5% |
| PTC, Inc. | 2.2% |
Material Fund Changes
There were no material changes during the reporting period.
Changes in and Disagreements with Accountants
There were no changes in or disagreements with accountants during the reporting period.
This report describes changes to the Fund that occurred during the reporting period.
Fund Expenses
Based on a hypothetical $10,000 investment
| Fund | Cost of $10,000 investment | Costs paid as a percentage of a $10,000 investment |
| International Equity Fund | $58 | 1.07% |
Key Fund Statistics
| Fund net assets | $243,226,109 |
| Total number of portfolio holdings | 46 |
| Total advisory fee paid | $918,017 |
| Portfolio turnover rate | 118% |
Graphical Representation of Holdings
The tables below show the investment makeup of the Fund, with each category representing a percentage of the Fund's total investments.
Top 10 Holdings
| Philip Morris International, Inc. | 4.9% |
| Capcom Co., Ltd. | 4.0% |
| Rheinmetall AG | 3.9% |
| Svenska Handelsbanken AB, Class A | 3.8% |
| Galderma Group AG | 3.8% |
| Tencent Holdings Ltd. | 3.7% |
| Games Workshop Group PLC | 3.5% |
| Universal Music Group N.V. | 3.5% |
| Chocoladefabriken Lindt & Spruengli AG, Participation Certificates | 3.3% |
| SAP S.E. | 3.2% |
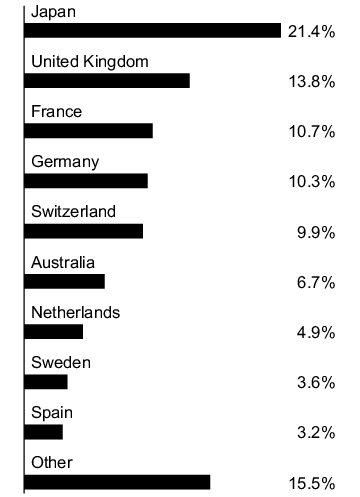
Sector Allocation 1
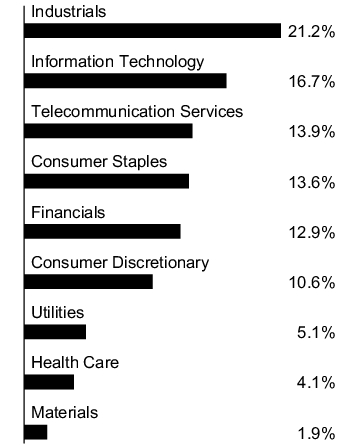
Country Allocation
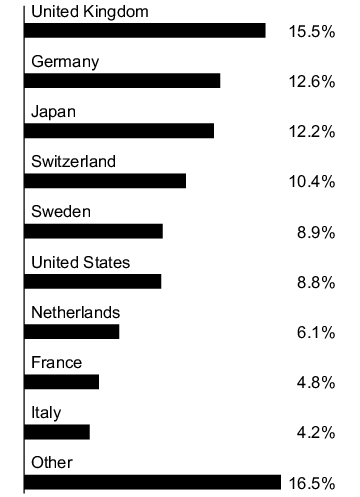
1 Sector allocation is presented as a percentage of total investments before short-term investments.
Top 10 Holdings
| Philip Morris International, Inc. | 4.9% |
| Capcom Co., Ltd. | 4.0% |
| Rheinmetall AG | 3.9% |
| Svenska Handelsbanken AB, Class A | 3.8% |
| Galderma Group AG | 3.8% |
| Tencent Holdings Ltd. | 3.7% |
| Games Workshop Group PLC | 3.5% |
| Universal Music Group N.V. | 3.5% |
| Chocoladefabriken Lindt & Spruengli AG, Participation Certificates | 3.3% |
| SAP S.E. | 3.2% |
Material Fund Changes
There were no material changes during the reporting period.
Changes in and Disagreements with Accountants
There were no changes in or disagreements with accountants during the reporting period.
This report describes changes to the Fund that occurred during the reporting period.
Fund Expenses
Based on a hypothetical $10,000 investment
| Fund | Cost of $10,000 investment | Costs paid as a percentage of a $10,000 investment |
| Small Cap Value Fund | $49 | 0.99% |
Key Fund Statistics
| Fund net assets | $138,593,512 |
| Total number of portfolio holdings | 180 |
| Total advisory fee paid | $468,647 |
| Portfolio turnover rate | 45% |
Graphical Representation of Holdings
The tables below show the investment makeup of the Fund, with each category representing a percentage of the Fund's total investments.
Top 10 Holdings
| TXNM Energy, Inc. | 1.7% |
| Ameris Bancorp | 1.5% |
| UMB Financial Corp. | 1.5% |
| Glacier Bancorp, Inc. | 1.3% |
| Renasant Corp. | 1.3% |
| Atlantic Union Bankshares Corp. | 1.2% |
| Cadence Bank | 1.2% |
| PennyMac Financial Services, Inc. | 1.2% |
| Gates Industrial Corp. PLC | 1.2% |
| Independence Realty Trust, Inc. | 1.1% |
Sector Allocation 1
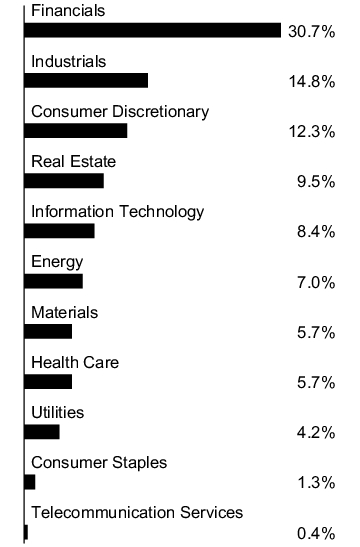
1 Sector allocation is presented as a percentage of total investments before short-term investments.
Top 10 Holdings
| TXNM Energy, Inc. | 1.7% |
| Ameris Bancorp | 1.5% |
| UMB Financial Corp. | 1.5% |
| Glacier Bancorp, Inc. | 1.3% |
| Renasant Corp. | 1.3% |
| Atlantic Union Bankshares Corp. | 1.2% |
| Cadence Bank | 1.2% |
| PennyMac Financial Services, Inc. | 1.2% |
| Gates Industrial Corp. PLC | 1.2% |
| Independence Realty Trust, Inc. | 1.1% |
Material Fund Changes
There were no material changes during the reporting period.
Changes in and Disagreements with Accountants
There were no changes in or disagreements with accountants during the reporting period.
This report describes changes to the Fund that occurred during the reporting period.
Fund Expenses
Based on a hypothetical $10,000 investment
| Fund | Cost of $10,000 investment | Costs paid as a percentage of a $10,000 investment |
| Small Cap Growth Fund | $50 | 1.00% |
Key Fund Statistics
| Fund net assets | $93,980,888 |
| Total number of portfolio holdings | 126 |
| Total advisory fee paid | $321,828 |
| Portfolio turnover rate | 13% |
Graphical Representation of Holdings
The tables below show the investment makeup of the Fund, with each category representing a percentage of the Fund's total investments.
Top 10 Holdings
| SS&C Technologies Holdings, Inc. | 2.5% |
| Stride, Inc. | 2.5% |
| Mirion Technologies, Inc. | 2.3% |
| OSI Systems, Inc. | 2.2% |
| Crown Holdings, Inc. | 2.1% |
| Sensient Technologies Corp. | 2.0% |
| LPL Financial Holdings, Inc. | 2.0% |
| The Descartes Systems Group, Inc. | 1.8% |
| Shift4 Payments, Inc., Class A | 1.7% |
| Casey's General Stores, Inc. | 1.6% |
Sector Allocation 1
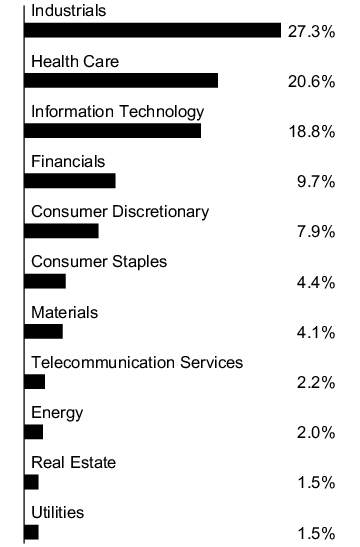
1 Sector allocation is presented as a percentage of total investments before short-term investments.
Top 10 Holdings
| SS&C Technologies Holdings, Inc. | 2.5% |
| Stride, Inc. | 2.5% |
| Mirion Technologies, Inc. | 2.3% |
| OSI Systems, Inc. | 2.2% |
| Crown Holdings, Inc. | 2.1% |
| Sensient Technologies Corp. | 2.0% |
| LPL Financial Holdings, Inc. | 2.0% |
| The Descartes Systems Group, Inc. | 1.8% |
| Shift4 Payments, Inc., Class A | 1.7% |
| Casey's General Stores, Inc. | 1.6% |
Material Fund Changes
There were no material changes during the reporting period.
Changes in and Disagreements with Accountants
There were no changes in or disagreements with accountants during the reporting period.
This report describes changes to the Fund that occurred during the reporting period.
Fund Expenses
Based on a hypothetical $10,000 investment
| Fund | Cost of $10,000 investment | Costs paid as a percentage of a $10,000 investment |
| Aggressive Allocation Fund | $17 | 0.33% |
Key Fund Statistics
| Fund net assets | $57,188,973 |
| Total number of portfolio holdings | 20 |
| Total advisory fee paid | $33,692 |
| Portfolio turnover rate | 10% |
Graphical Representation of Holdings
The tables below show the investment makeup of the Fund, with each category representing a percentage of the Fund's total investments.
Top 10 Holdings
| Penn Series Index 500 Fund | 27.2% |
| Penn Series Flexibly Managed Fund | 8.9% |
| Penn Series International Equity Fund | 8.9% |
| Penn Series Large Cap Value Fund | 5.9% |
| Penn Series Quality Bond Fund | 5.9% |
| Penn Series Large Growth Stock Fund | 5.1% |
| Penn Series Developed International Index Fund | 4.9% |
| Penn Series Mid Core Value Fund | 4.9% |
| Penn Series Real Estate Securities Fund | 4.9% |
| Penn Series Large Core Growth Fund | 4.0% |
Asset Allocation Target
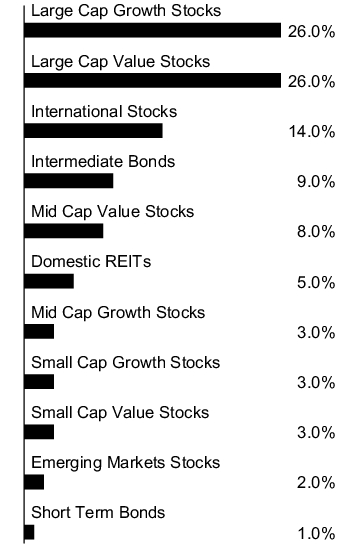
Top 10 Holdings
| Penn Series Index 500 Fund | 27.2% |
| Penn Series Flexibly Managed Fund | 8.9% |
| Penn Series International Equity Fund | 8.9% |
| Penn Series Large Cap Value Fund | 5.9% |
| Penn Series Quality Bond Fund | 5.9% |
| Penn Series Large Growth Stock Fund | 5.1% |
| Penn Series Developed International Index Fund | 4.9% |
| Penn Series Mid Core Value Fund | 4.9% |
| Penn Series Real Estate Securities Fund | 4.9% |
| Penn Series Large Core Growth Fund | 4.0% |
Material Fund Changes
There were no material changes during the reporting period.
Changes in and Disagreements with Accountants
There were no changes in or disagreements with accountants during the reporting period.
This report describes changes to the Fund that occurred during the reporting period.
Fund Expenses
Based on a hypothetical $10,000 investment
| Fund | Cost of $10,000 investment | Costs paid as a percentage of a $10,000 investment |
| Moderately Conservative Allocation Fund | $16 | 0.32% |
Key Fund Statistics
| Fund net assets | $72,150,304 |
| Total number of portfolio holdings | 15 |
| Total advisory fee paid | $43,348 |
| Portfolio turnover rate | 4% |
Graphical Representation of Holdings
The tables below show the investment makeup of the Fund, with each category representing a percentage of the Fund's total investments.
Top 10 Holdings
| Penn Series Quality Bond Fund | 44.3% |
| Penn Series Index 500 Fund | 13.1% |
| Penn Series Flexibly Managed Fund | 7.9% |
| Penn Series Limited Maturity Bond Fund | 6.9% |
| Penn Series High Yield Bond Fund | 4.9% |
| Penn Series International Equity Fund | 3.9% |
| Penn Series Real Estate Securities Fund | 3.9% |
| Penn Series Large Cap Value Fund | 3.0% |
| Penn Series Developed International Index Fund | 3.0% |
| Penn Series Mid Core Value Fund | 3.0% |
Asset Allocation Target
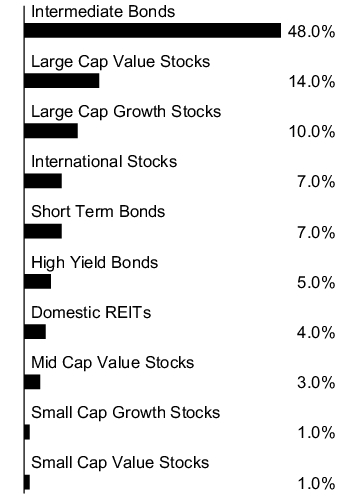
Top 10 Holdings
| Penn Series Quality Bond Fund | 44.3% |
| Penn Series Index 500 Fund | 13.1% |
| Penn Series Flexibly Managed Fund | 7.9% |
| Penn Series Limited Maturity Bond Fund | 6.9% |
| Penn Series High Yield Bond Fund | 4.9% |
| Penn Series International Equity Fund | 3.9% |
| Penn Series Real Estate Securities Fund | 3.9% |
| Penn Series Large Cap Value Fund | 3.0% |
| Penn Series Developed International Index Fund | 3.0% |
| Penn Series Mid Core Value Fund | 3.0% |
Material Fund Changes
There were no material changes during the reporting period.
Changes in and Disagreements with Accountants
There were no changes in or disagreements with accountants during the reporting period.
This report describes changes to the Fund that occurred during the reporting period.
Fund Expenses
Based on a hypothetical $10,000 investment
| Fund | Cost of $10,000 investment | Costs paid as a percentage of a $10,000 investment |
| Small Cap Index Fund | $35 | 0.72% |
Key Fund Statistics
| Fund net assets | $76,273,571 |
| Total number of portfolio holdings | 1,991 |
| Total advisory fee paid | $115,078 |
| Portfolio turnover rate | 10% |
Graphical Representation of Holdings
The tables below show the investment makeup of the Fund, with each category representing a percentage of the Fund's total investments.
Top 10 Holdings
| Credo Technology Group Holding Ltd. | 0.5% |
| Fabrinet | 0.4% |
| IonQ, Inc. | 0.4% |
| Hims & Hers Health, Inc. | 0.4% |
| HealthEquity, Inc. | 0.4% |
| The Ensign Group, Inc. | 0.3% |
| Fluor Corp. | 0.3% |
| Blueprint Medicines Corp. | 0.3% |
| AeroVironment, Inc. | 0.3% |
| Brinker International, Inc. | 0.3% |
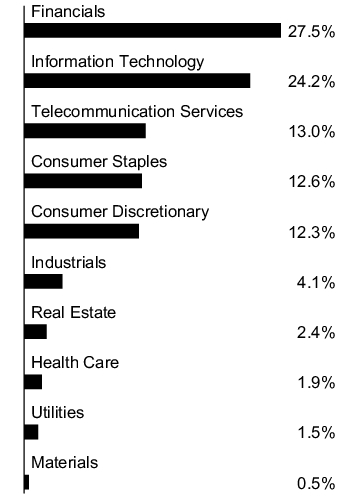
Sector Allocation 1
1 Sector allocation is presented as a percentage of total investments before short-term investments.
Top 10 Holdings
| Credo Technology Group Holding Ltd. | 0.5% |
| Fabrinet | 0.4% |
| IonQ, Inc. | 0.4% |
| Hims & Hers Health, Inc. | 0.4% |
| HealthEquity, Inc. | 0.4% |
| The Ensign Group, Inc. | 0.3% |
| Fluor Corp. | 0.3% |
| Blueprint Medicines Corp. | 0.3% |
| AeroVironment, Inc. | 0.3% |
| Brinker International, Inc. | 0.3% |
Material Fund Changes
There were no material changes during the reporting period.
Changes in and Disagreements with Accountants
There were no changes in or disagreements with accountants during the reporting period.
This report describes changes to the Fund that occurred during the reporting period.
Fund Expenses
Based on a hypothetical $10,000 investment
| Fund | Cost of $10,000 investment | Costs paid as a percentage of a $10,000 investment |
| SMID Cap Growth Fund | $51 | 1.05% |
Key Fund Statistics
| Fund net assets | $69,643,719 |
| Total number of portfolio holdings | 84 |
| Total advisory fee paid | $250,441 |
| Portfolio turnover rate | 66% |
Graphical Representation of Holdings
The tables below show the investment makeup of the Fund, with each category representing a percentage of the Fund's total investments.
Top 10 Holdings
| Toast, Inc., Class A | 2.4% |
| Natera, Inc. | 2.1% |
| Loar Holdings, Inc. | 2.0% |
| Texas Roadhouse, Inc. | 2.0% |
| Credo Technology Group Holding Ltd. | 2.0% |
| Guidewire Software, Inc. | 2.0% |
| Applied Industrial Technologies, Inc. | 1.9% |
| SharkNinja, Inc. | 1.9% |
| Shake Shack, Inc., Class A | 1.9% |
| Kinsale Capital Group, Inc. | 1.8% |
Sector Allocation 1
1 Sector allocation is presented as a percentage of total investments before short-term investments.
Top 10 Holdings
| Toast, Inc., Class A | 2.4% |
| Natera, Inc. | 2.1% |
| Loar Holdings, Inc. | 2.0% |
| Texas Roadhouse, Inc. | 2.0% |
| Credo Technology Group Holding Ltd. | 2.0% |
| Guidewire Software, Inc. | 2.0% |
| Applied Industrial Technologies, Inc. | 1.9% |
| SharkNinja, Inc. | 1.9% |
| Shake Shack, Inc., Class A | 1.9% |
| Kinsale Capital Group, Inc. | 1.8% |
Material Fund Changes
There were no material changes during the reporting period.
Changes in and Disagreements with Accountants
There were no changes in or disagreements with accountants during the reporting period.
This report describes changes to the Fund that occurred during the reporting period.
Fund Expenses
Based on a hypothetical $10,000 investment
| Fund | Cost of $10,000 investment | Costs paid as a percentage of a $10,000 investment |
| SMID Cap Value Fund | $57 | 1.17% |
Key Fund Statistics
| Fund net assets | $47,674,027 |
| Total number of portfolio holdings | 93 |
| Total advisory fee paid | $188,598 |
| Portfolio turnover rate | 37% |
Graphical Representation of Holdings
The tables below show the investment makeup of the Fund, with each category representing a percentage of the Fund's total investments.
Top 10 Holdings
| BJ's Wholesale Club Holdings, Inc. | 2.0% |
| Encompass Health Corp. | 1.8% |
| TXNM Energy, Inc. | 1.8% |
| Jones Lang LaSalle, Inc. | 1.7% |
| IDACORP, Inc. | 1.6% |
| Nexstar Media Group, Inc. | 1.6% |
| The Hanover Insurance Group, Inc. | 1.6% |
| Tenet Healthcare Corp. | 1.6% |
| Pentair PLC | 1.5% |
| RPM International, Inc. | 1.4% |
Sector Allocation 1
1 Sector allocation is presented as a percentage of total investments before short-term investments.
Top 10 Holdings
| BJ's Wholesale Club Holdings, Inc. | 2.0% |
| Encompass Health Corp. | 1.8% |
| TXNM Energy, Inc. | 1.8% |
| Jones Lang LaSalle, Inc. | 1.7% |
| IDACORP, Inc. | 1.6% |
| Nexstar Media Group, Inc. | 1.6% |
| The Hanover Insurance Group, Inc. | 1.6% |
| Tenet Healthcare Corp. | 1.6% |
| Pentair PLC | 1.5% |
| RPM International, Inc. | 1.4% |
Material Fund Changes
There were no material changes during the reporting period.
Changes in and Disagreements with Accountants
There were no changes in or disagreements with accountants during the reporting period.
This report describes changes to the Fund that occurred during the reporting period.
Fund Expenses
Based on a hypothetical $10,000 investment
| Fund | Cost of $10,000 investment | Costs paid as a percentage of a $10,000 investment |
| Balanced Fund | $10 | 0.20% |
Key Fund Statistics
| Fund net assets | $79,267,531 |
| Total number of portfolio holdings | 3 |
| Total advisory fee paid | |
| Portfolio turnover rate | 4% |
Graphical Representation of Holdings
The tables below show the investment makeup of the Fund, with each category representing a percentage of the Fund's total investments.
Top 10 Holdings
| Penn Series Index 500 Fund | 60.3% |
| Penn Series Quality Bond Fund | 39.3% |
Asset Allocation Target
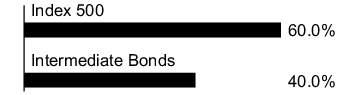
Top 10 Holdings
| Penn Series Index 500 Fund | 60.3% |
| Penn Series Quality Bond Fund | 39.3% |
Material Fund Changes
There were no material changes during the reporting period.
Changes in and Disagreements with Accountants
There were no changes in or disagreements with accountants during the reporting period.
This report describes changes to the Fund that occurred during the reporting period.
Fund Expenses
Based on a hypothetical $10,000 investment
| Fund | Cost of $10,000 investment | Costs paid as a percentage of a $10,000 investment |
| Conservative Allocation Fund | $18 | 0.35% |
Key Fund Statistics
| Fund net assets | $42,238,424 |
| Total number of portfolio holdings | 10 |
| Total advisory fee paid | $25,677 |
| Portfolio turnover rate | 10% |
Graphical Representation of Holdings
The tables below show the investment makeup of the Fund, with each category representing a percentage of the Fund's total investments.
Top 10 Holdings
| Penn Series Quality Bond Fund | 58.5% |
| Penn Series Limited Maturity Bond Fund | 11.6% |
| Penn Series Index 500 Fund | 8.0% |
| Penn Series Flexibly Managed Fund | 7.8% |
| Penn Series High Yield Bond Fund | 4.8% |
| Penn Series Developed International Index Fund | 2.0% |
| Penn Series Mid Core Value Fund | 2.0% |
| Penn Series Real Estate Securities Fund | 1.9% |
| Penn Series Large Core Value Fund | 1.0% |
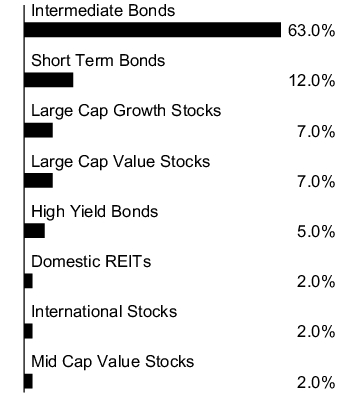
Asset Allocation Target
Top 10 Holdings
| Penn Series Quality Bond Fund | 58.5% |
| Penn Series Limited Maturity Bond Fund | 11.6% |
| Penn Series Index 500 Fund | 8.0% |
| Penn Series Flexibly Managed Fund | 7.8% |
| Penn Series High Yield Bond Fund | 4.8% |
| Penn Series Developed International Index Fund | 2.0% |
| Penn Series Mid Core Value Fund | 2.0% |
| Penn Series Real Estate Securities Fund | 1.9% |
| Penn Series Large Core Value Fund | 1.0% |
Material Fund Changes
There were no material changes during the reporting period.
Changes in and Disagreements with Accountants
There were no changes in or disagreements with accountants during the reporting period.
This report describes changes to the Fund that occurred during the reporting period.
Fund Expenses
Based on a hypothetical $10,000 investment
| Fund | Cost of $10,000 investment | Costs paid as a percentage of a $10,000 investment |
| Developed International Index Fund | $51 | 0.94% |
Key Fund Statistics
| Fund net assets | $83,512,259 |
| Total number of portfolio holdings | 705 |
| Total advisory fee paid (net of waivers) | $112,309 |
| Portfolio turnover rate | 2% |
Graphical Representation of Holdings
The tables below show the investment makeup of the Fund, with each category representing a percentage of the Fund's total investments.
Top 10 Holdings
| SAP S.E. | 1.7% |
| ASML Holding N.V. | 1.7% |
| Nestle S.A. | 1.4% |
| Novartis AG | 1.2% |
| Roche Holding AG | 1.2% |
| Novo Nordisk A/S, Class B | 1.2% |
| AstraZeneca PLC | 1.1% |
| HSBC Holdings PLC | 1.1% |
| Shell PLC | 1.1% |
| Commonwealth Bank of Australia | 1.1% |
Sector Allocation 1
Country Allocation
1 Sector allocation is presented as a percentage of total investments before short-term investments.
Top 10 Holdings
| SAP S.E. | 1.7% |
| ASML Holding N.V. | 1.7% |
| Nestle S.A. | 1.4% |
| Novartis AG | 1.2% |
| Roche Holding AG | 1.2% |
| Novo Nordisk A/S, Class B | 1.2% |
| AstraZeneca PLC | 1.1% |
| HSBC Holdings PLC | 1.1% |
| Shell PLC | 1.1% |
| Commonwealth Bank of Australia | 1.1% |
Material Fund Changes
There were no material changes during the reporting period.
Changes in and Disagreements with Accountants
There were no changes in or disagreements with accountants during the reporting period.
This report describes changes to the Fund that occurred during the reporting period.
Fund Expenses
Based on a hypothetical $10,000 investment
| Fund | Cost of $10,000 investment | Costs paid as a percentage of a $10,000 investment |
| Emerging Markets Equity Fund | $72 | 1.36% |
Key Fund Statistics
| Fund net assets | $67,655,860 |
| Total number of portfolio holdings | 51 |
| Total advisory fee paid | $288,379 |
| Portfolio turnover rate | 58% |
Graphical Representation of Holdings
The tables below show the investment makeup of the Fund, with each category representing a percentage of the Fund's total investments.
Top 10 Holdings
| Taiwan Semiconductor Manufacturing Co., Ltd. | 10.1% |
| Tencent Holdings Ltd. | 6.8% |
| AIA Group Ltd. | 3.9% |
| SK Hynix, Inc. | 3.9% |
| Eurobank Ergasias Services and Holdings S.A. | 3.1% |
| MercadoLibre, Inc. | 3.1% |
| Hong Kong Exchanges & Clearing Ltd. | 3.1% |
| Bharti Airtel Ltd. | 3.0% |
| NetEase, Inc. | 3.0% |
| Bajaj Finance Ltd. | 3.0% |
Sector Allocation 1
Country Allocation
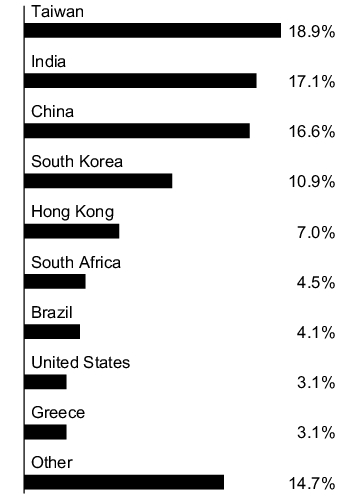
1 Sector allocation is presented as a percentage of total investments before short-term investments.
Top 10 Holdings
| Taiwan Semiconductor Manufacturing Co., Ltd. | 10.1% |
| Tencent Holdings Ltd. | 6.8% |
| AIA Group Ltd. | 3.9% |
| SK Hynix, Inc. | 3.9% |
| Eurobank Ergasias Services and Holdings S.A. | 3.1% |
| MercadoLibre, Inc. | 3.1% |
| Hong Kong Exchanges & Clearing Ltd. | 3.1% |
| Bharti Airtel Ltd. | 3.0% |
| NetEase, Inc. | 3.0% |
| Bajaj Finance Ltd. | 3.0% |
Material Fund Changes
There were no material changes during the reporting period.
Changes in and Disagreements with Accountants
There were no changes in or disagreements with accountants during the reporting period.
This report describes changes to the Fund that occurred during the reporting period.
Fund Expenses
Based on a hypothetical $10,000 investment
| Fund | Cost of $10,000 investment | Costs paid as a percentage of a $10,000 investment |
| Large Core Growth Fund | $43 | 0.85% |
Key Fund Statistics
| Fund net assets | $135,892,773 |
| Total number of portfolio holdings | 38 |
| Total advisory fee paid | $374,767 |
| Portfolio turnover rate | 11% |
Graphical Representation of Holdings
The tables below show the investment makeup of the Fund, with each category representing a percentage of the Fund's total investments.
Top 10 Holdings
| Microsoft Corp. | 13.2% |
| NVIDIA Corp. | 12.1% |
| Apple, Inc. | 5.9% |
| Alphabet, Inc., Class A | 5.9% |
| Amazon.com, Inc. | 5.1% |
| Visa, Inc., Class A | 4.7% |
| Intercontinental Exchange, Inc. | 3.7% |
| Mastercard, Inc., Class A | 3.1% |
| Intuit, Inc. | 2.9% |
| Salesforce, Inc. | 2.7% |
Sector Allocation 1
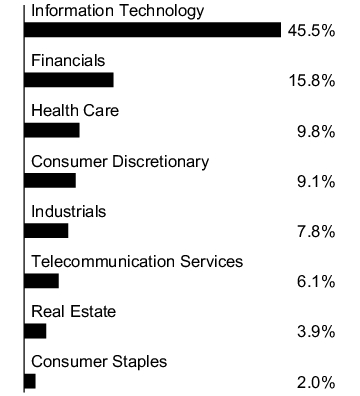
1 Sector allocation is presented as a percentage of total investments before short-term investments.
Top 10 Holdings
| Microsoft Corp. | 13.2% |
| NVIDIA Corp. | 12.1% |
| Apple, Inc. | 5.9% |
| Alphabet, Inc., Class A | 5.9% |
| Amazon.com, Inc. | 5.1% |
| Visa, Inc., Class A | 4.7% |
| Intercontinental Exchange, Inc. | 3.7% |
| Mastercard, Inc., Class A | 3.1% |
| Intuit, Inc. | 2.9% |
| Salesforce, Inc. | 2.7% |
Material Fund Changes
There were no material changes during the reporting period.
Changes in and Disagreements with Accountants
There were no changes in or disagreements with accountants during the reporting period.
This report describes changes to the Fund that occurred during the reporting period.
Fund Expenses
Based on a hypothetical $10,000 investment
| Fund | Cost of $10,000 investment | Costs paid as a percentage of a $10,000 investment |
| Large Core Value Fund | $46 | 0.91% |
Key Fund Statistics
| Fund net assets | $125,580,967 |
| Total number of portfolio holdings | 69 |
| Total advisory fee paid | $392,318 |
| Portfolio turnover rate | 34% |
Graphical Representation of Holdings
The tables below show the investment makeup of the Fund, with each category representing a percentage of the Fund's total investments.
Top 10 Holdings
| Bank of America Corp. | 3.5% |
| Amazon.com, Inc. | 3.2% |
| Wells Fargo & Co. | 3.1% |
| The Charles Schwab Corp. | 2.7% |
| American International Group, Inc. | 2.5% |
| 3M Co. | 2.4% |
| Abbott Laboratories | 2.4% |
| Reinsurance Group of America, Inc. | 2.3% |
| NextEra Energy, Inc. | 2.2% |
| Cisco Systems, Inc. | 2.2% |
Sector Allocation 1
1 Sector allocation is presented as a percentage of total investments before short-term investments.
Top 10 Holdings
| Bank of America Corp. | 3.5% |
| Amazon.com, Inc. | 3.2% |
| Wells Fargo & Co. | 3.1% |
| The Charles Schwab Corp. | 2.7% |
| American International Group, Inc. | 2.5% |
| 3M Co. | 2.4% |
| Abbott Laboratories | 2.4% |
| Reinsurance Group of America, Inc. | 2.3% |
| NextEra Energy, Inc. | 2.2% |
| Cisco Systems, Inc. | 2.2% |
Material Fund Changes
There were no material changes during the reporting period.
Changes in and Disagreements with Accountants
There were no changes in or disagreements with accountants during the reporting period.
This report describes changes to the Fund that occurred during the reporting period.
Fund Expenses
Based on a hypothetical $10,000 investment
| Fund | Cost of $10,000 investment | Costs paid as a percentage of a $10,000 investment |
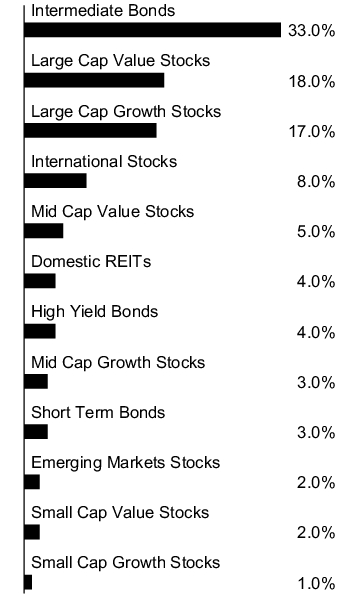
| Moderate Allocation Fund | $15 | 0.30% |
Key Fund Statistics
| Fund net assets | $193,471,534 |
| Total number of portfolio holdings | 20 |
| Total advisory fee paid | $114,800 |
| Portfolio turnover rate | 5% |
Graphical Representation of Holdings
The tables below show the investment makeup of the Fund, with each category representing a percentage of the Fund's total investments.
Top 10 Holdings
| Penn Series Quality Bond Fund | 29.6% |
| Penn Series Index 500 Fund | 20.2% |
| Penn Series Flexibly Managed Fund | 8.9% |
| Penn Series Mid Core Value Fund | 5.0% |
| Penn Series Developed International Index Fund | 4.0% |
| Penn Series International Equity Fund | 3.9% |
| Penn Series High Yield Bond Fund | 3.9% |
| Penn Series Real Estate Securities Fund | 3.9% |
| Penn Series Large Cap Value Fund | 3.0% |
| Penn Series Limited Maturity Bond Fund | 2.9% |
Asset Allocation Target
Top 10 Holdings
| Penn Series Quality Bond Fund | 29.6% |
| Penn Series Index 500 Fund | 20.2% |
| Penn Series Flexibly Managed Fund | 8.9% |
| Penn Series Mid Core Value Fund | 5.0% |
| Penn Series Developed International Index Fund | 4.0% |
| Penn Series International Equity Fund | 3.9% |
| Penn Series High Yield Bond Fund | 3.9% |
| Penn Series Real Estate Securities Fund | 3.9% |
| Penn Series Large Cap Value Fund | 3.0% |
| Penn Series Limited Maturity Bond Fund | 2.9% |
Material Fund Changes
There were no material changes during the reporting period.
Changes in and Disagreements with Accountants
There were no changes in or disagreements with accountants during the reporting period.
This report describes changes to the Fund that occurred during the reporting period.
Fund Expenses
Based on a hypothetical $10,000 investment
| Fund | Cost of $10,000 investment | Costs paid as a percentage of a $10,000 investment |
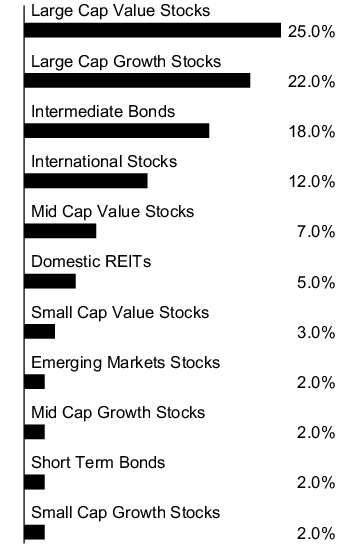
| Moderately Aggressive Allocation Fund | $15 | 0.30% |
Key Fund Statistics
| Fund net assets | $194,584,251 |
| Total number of portfolio holdings | 20 |
| Total advisory fee paid | $114,792 |
| Portfolio turnover rate | 6% |
Graphical Representation of Holdings
The tables below show the investment makeup of the Fund, with each category representing a percentage of the Fund's total investments.
Top 10 Holdings
| Penn Series Index 500 Fund | 24.2% |
| Penn Series Quality Bond Fund | 14.8% |
| Penn Series Flexibly Managed Fund | 8.9% |
| Penn Series International Equity Fund | 6.9% |
| Penn Series Large Cap Value Fund | 6.0% |
| Penn Series Developed International Index Fund | 5.0% |
| Penn Series Mid Core Value Fund | 5.0% |
| Penn Series Real Estate Securities Fund | 4.9% |
| Penn Series Large Core Value Fund | 4.0% |
| Penn Series Large Growth Stock Fund | 3.1% |
Asset Allocation Target
Top 10 Holdings
| Penn Series Index 500 Fund | 24.2% |
| Penn Series Quality Bond Fund | 14.8% |
| Penn Series Flexibly Managed Fund | 8.9% |
| Penn Series International Equity Fund | 6.9% |
| Penn Series Large Cap Value Fund | 6.0% |
| Penn Series Developed International Index Fund | 5.0% |
| Penn Series Mid Core Value Fund | 5.0% |
| Penn Series Real Estate Securities Fund | 4.9% |
| Penn Series Large Core Value Fund | 4.0% |
| Penn Series Large Growth Stock Fund | 3.1% |
Material Fund Changes
There were no material changes during the reporting period.
Changes in and Disagreements with Accountants
There were no changes in or disagreements with accountants during the reporting period.