Shareholder Report
|
6 Months Ended |
|
Jun. 30, 2025
USD ($)
Holding
|
|---|
| Shareholder Report [Line Items] |
|
| Document Type |
N-CSRS
|
| Amendment Flag |
false
|
| Registrant Name |
Segall Bryant & Hamill Trust
|
| Entity Central Index Key |
0000357204
|
| Entity Investment Company Type |
N-1A
|
| Document Period End Date |
Jun. 30, 2025
|
| C000211588 |
|
| Shareholder Report [Line Items] |
|
| Fund Name |
Segall Bryant & Hamill Small Cap Value Fund
|
| Trading Symbol |
SBRVX
|
| Annual or Semi-Annual Statement [Text Block] |
This semi-annual shareholder report contains important information about Segall Bryant & Hamill Small Cap Value Fund (the "Fund") for the period of January 1, 2025 to June 30, 2025.
|
| Shareholder Report Annual or Semi-Annual |
Semi-Annual Shareholder Report
|
| Additional Information [Text Block] |
You can find additional information about the Fund at www.cisbh.com/funds/literature. You can also request this information by contacting us at (800) 392-2673.
|
| Material Fund Change Notice [Text Block] |
This report describes changes to the Fund that occurred during the fiscal year ending December 31, 2025.
|
| Additional Information Phone Number |
(800) 392-2673
|
| Additional Information Website |
www.cisbh.com/funds/literature
|
| Expenses [Text Block] |
What were the Fund’s annualized costs for the last six months?(based on a hypothetical $10,000 investment) Class Name | Costs of a $10,000 investment | Costs paid as a percentage of a $10,000 investment |
|---|
Retail | $55 | 1.14% |
|---|
|
| Expenses Paid, Amount |
$ 55
|
| Expense Ratio, Percent |
1.14%
|
| Factors Affecting Performance [Text Block] |
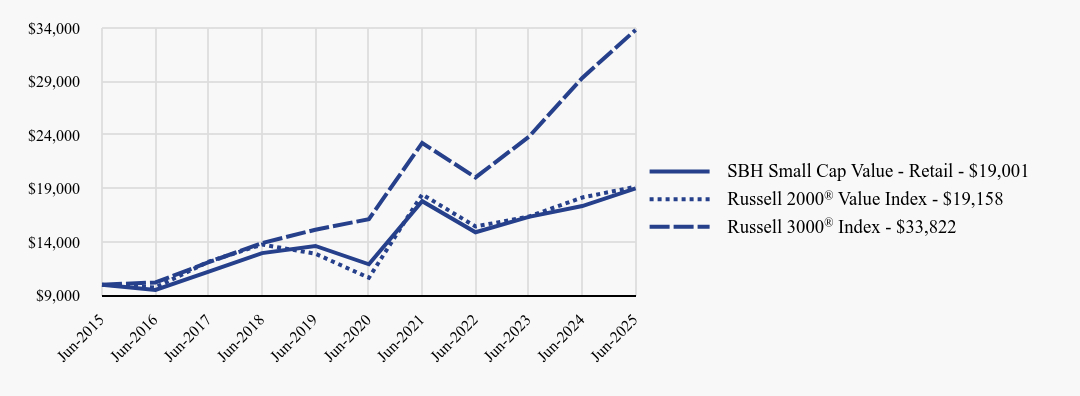
How did the Fund perform during the reporting period? Fund Performance For the first six months of 2025, the retail class of the Fund returned -2.63% against a return of -3.16% for the Russell 2000® Value Index and 5.75% for the Fund’s broad-based securities market index, the Russell 3000® Index. Contributors to Return The three sectors that contributed most to the Fund’s returns on an absolute basis were Materials, Industrials, and Information Technology. Materials benefited from strong stock selection overall. The three individual securities that contributed the most on an absolute basis were REV Group, Inc., MP Materials Corp., and Mercury Systems, Inc. Materials holding MP Materials realized significant appreciation due to concerns that China was going to cut off global supplies of rare earth minerals. MP Materials has the largest rare earth minerals mine in North America making the importance of its assets more appreciated by the market. Detractors from Return The three sectors that detracted most from the Fund’s returns on an absolute basis were Health Care, Energy, and Consumer Discretionary. Stock selection was the primary cause for underperformance in Health Care. The three individual securities that detracted the most on an absolute basis were VF Corp., QuidelOrtho Corp., and NeoGenomics, Inc. Consumer Discretionary holding VF Corp. pulled back given a delay in its Vans brand’s return to growth, which was taken negatively by the market. |
| Line Graph [Table Text Block] |
| SBH Small Cap Value - Retail | Russell 2000® Value Index | Russell 3000® Index |
|---|
Jun-2015 | $10,000 | $10,000 | $10,000 |
|---|
Jun-2016 | $9,517 | $9,742 | $10,214 |
|---|
Jun-2017 | $11,220 | $12,163 | $12,104 |
|---|
Jun-2018 | $12,955 | $13,757 | $13,893 |
|---|
Jun-2019 | $13,625 | $12,899 | $15,141 |
|---|
Jun-2020 | $11,909 | $10,645 | $16,130 |
|---|
Jun-2021 | $17,809 | $18,445 | $23,253 |
|---|
Jun-2022 | $14,907 | $15,442 | $20,029 |
|---|
Jun-2023 | $16,344 | $16,370 | $23,825 |
|---|
Jun-2024 | $17,355 | $18,153 | $29,335 |
|---|
Jun-2025 | $19,001 | $19,158 | $33,822 |
|---|
|
| Average Annual Return [Table Text Block] |
| 1 Year | 5 Years | 10 Years |
|---|
SBH Small Cap Value - Retail | 9.48% | 9.79% | 6.63% |
|---|
Russell 2000® Value Index | 5.54% | 12.47% | 6.72% |
|---|
Russell 3000® Index | 15.30% | 15.96% | 12.96% |
|---|
|
| AssetsNet |
$ 395,679,140
|
| Holdings Count | Holding |
75
|
| Advisory Fees Paid, Amount |
$ 1,715,955
|
| InvestmentCompanyPortfolioTurnover |
14.00%
|
| Additional Fund Statistics [Text Block] |
Net Assets | $395,679,140 |
|---|
Number of Portfolio Holdings | 75 |
|---|
Portfolio Turnover | 14% |
|---|
Total Advisory Fees Paid* | $1,715,955 |
|---|
Total Advisory Fees Paid %* | 0.80% |
|---|
* Net of expenses waived by investment adviser |
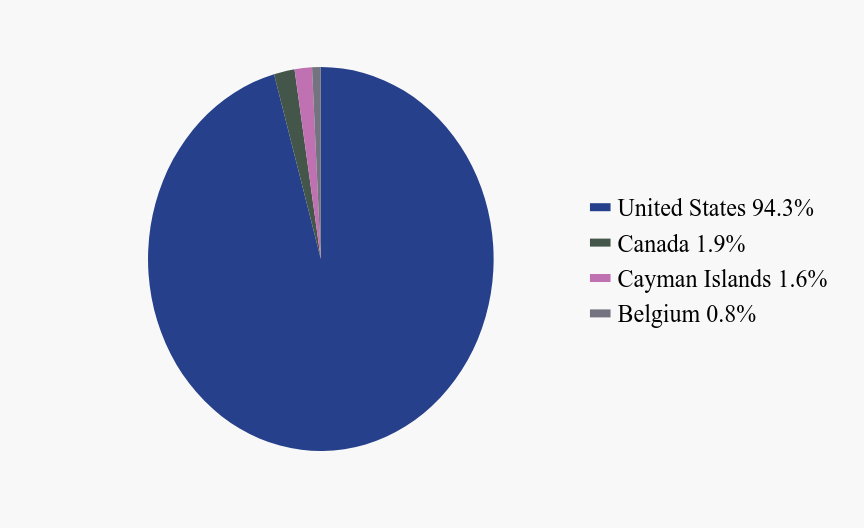
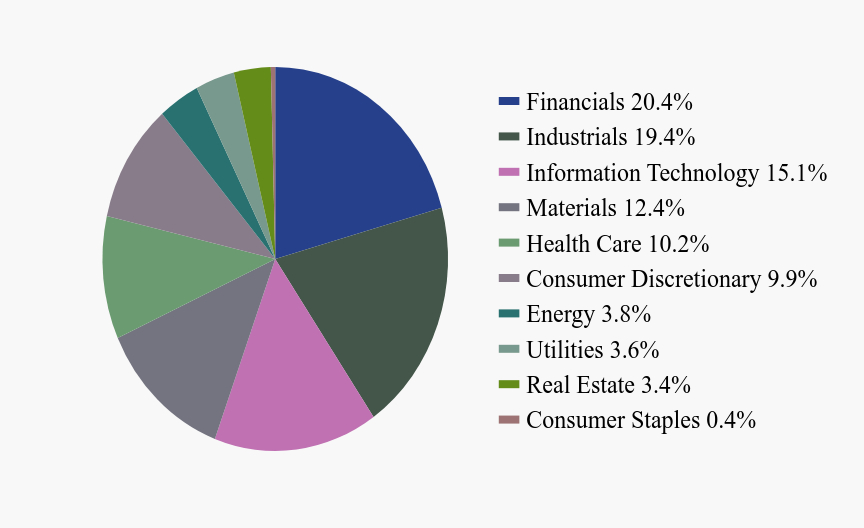
| Holdings [Text Block] |
Sector Weighting (% of net assets)Value | Value |
|---|
Financials | 20.4% | Industrials | 19.4% | Information Technology | 15.1% | Materials | 12.4% | Health Care | 10.2% | Consumer Discretionary | 9.9% | Energy | 3.8% | Utilities | 3.6% | Real Estate | 3.4% | Consumer Staples | 0.4% |
Country Weighting (% of net assets)Value | Value |
|---|
United States | 94.3% | Canada | 1.9% | Cayman Islands | 1.6% | Belgium | 0.8% |
|
| Largest Holdings [Text Block] |
Top 10 Holdings (% of net assets)Holding Name | % of Net Assets |
|---|
Valmont Industries, Inc. | 3.4% |
|---|
Mercury Systems, Inc. | 3.0% |
|---|
REV Group, Inc. | 3.0% |
|---|
AZZ, Inc. | 2.7% |
|---|
Ingevity Corp. | 2.4% |
|---|
Belden, Inc. | 2.2% |
|---|
Adapthealth Corp. | 2.2% |
|---|
O-I Glass, Inc. | 2.2% |
|---|
Progress Software Corp. | 2.0% |
|---|
Papa John's International, Inc. | 2.0% |
|---|
|
| Material Fund Change [Text Block] |
This is a summary of certain changes to the Fund since January 1, 2025. For more complete information, you may review the Fund’s current prospectus, as supplemented, at www.cisbh.com/funds or upon request at (800)392-2673. The parent company of the Fund’s adviser entered into a definitive agreement to take the parent company private, which resulted in a change of control of the adviser. There are no plans to make any changes to the Fund resulting from this transaction. |
| Updated Prospectus Web Address |
www.cisbh.com/funds/literature
|
| C000211587 |
|
| Shareholder Report [Line Items] |
|
| Fund Name |
Segall Bryant & Hamill Small Cap Value Fund
|
| Trading Symbol |
SBHVX
|
| Annual or Semi-Annual Statement [Text Block] |
This semi-annual shareholder report contains important information about Segall Bryant & Hamill Small Cap Value Fund (the "Fund") for the period of January 1, 2025 to June 30, 2025.
|
| Shareholder Report Annual or Semi-Annual |
Semi-Annual Shareholder Report
|
| Additional Information [Text Block] |
You can find additional information about the Fund at www.cisbh.com/funds/literature. You can also request this information by contacting us at (800) 392-2673.
|
| Material Fund Change Notice [Text Block] |
This report describes changes to the Fund that occurred during the fiscal year ending December 31, 2025.
|
| Additional Information Phone Number |
(800) 392-2673
|
| Additional Information Website |
www.cisbh.com/funds/literature
|
| Expenses [Text Block] |
What were the Fund’s annualized costs for the last six months?(based on a hypothetical $10,000 investment) Class Name | Costs of a $10,000 investment | Costs paid as a percentage of a $10,000 investment |
|---|
Institutional | $47 | 0.97% |
|---|
|
| Expenses Paid, Amount |
$ 47
|
| Expense Ratio, Percent |
0.97%
|
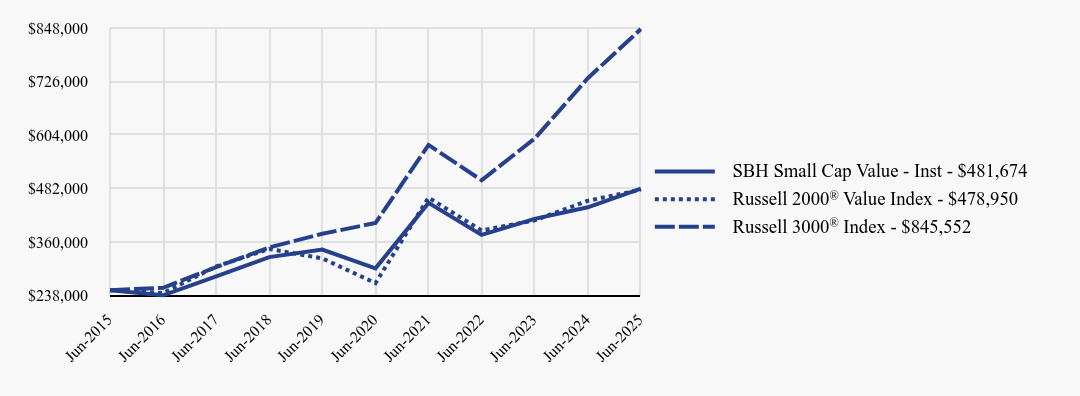
| Factors Affecting Performance [Text Block] |
How did the Fund perform during the reporting period? Fund Performance For the first six months of 2025, the institutional class of the Fund returned -2.55% against a return of -3.16% for the Russell 2000® Value Index and 5.75% for the Fund’s broad-based securities market index, the Russell 3000® Index. Contributors to Return The three sectors that contributed most to the Fund’s returns on an absolute basis were Materials, Industrials, and Information Technology. Materials benefited from strong stock selection overall. The three individual securities that contributed the most on an absolute basis were REV Group, Inc., MP Materials Corp., and Mercury Systems, Inc. Materials holding MP Materials realized significant appreciation due to concerns that China was going to cut off global supplies of rare earth minerals. MP Materials has the largest rare earth minerals mine in North America making the importance of its assets more appreciated by the market. Detractors from Return The three sectors that detracted most from the Fund’s returns on an absolute basis were Health Care, Energy, and Consumer Discretionary. Stock selection was the primary cause for underperformance in Health Care. The three individual securities that detracted the most on an absolute basis were VF Corp., QuidelOrtho Corp., and NeoGenomics, Inc. Consumer Discretionary holding VF Corp. pulled back given a delay in its Vans brand’s return to growth, which was taken negatively by the market. |
| Line Graph [Table Text Block] |
| SBH Small Cap Value - Inst | Russell 2000® Value Index | Russell 3000® Index |
|---|
Jun-2015 | $250,000 | $250,000 | $250,000 |
|---|
Jun-2016 | $238,288 | $243,545 | $255,346 |
|---|
Jun-2017 | $281,337 | $304,083 | $302,609 |
|---|
Jun-2018 | $325,323 | $343,916 | $347,329 |
|---|
Jun-2019 | $342,658 | $322,471 | $378,528 |
|---|
Jun-2020 | $299,697 | $266,113 | $403,244 |
|---|
Jun-2021 | $449,055 | $461,120 | $581,334 |
|---|
Jun-2022 | $376,023 | $386,047 | $500,729 |
|---|
Jun-2023 | $412,652 | $409,239 | $595,635 |
|---|
Jun-2024 | $438,986 | $453,829 | $733,376 |
|---|
Jun-2025 | $481,674 | $478,950 | $845,552 |
|---|
|
| Average Annual Return [Table Text Block] |
| 1 Year | 5 Years | 10 Years |
|---|
SBH Small Cap Value - Inst | 9.72% | 9.95% | 6.78% |
|---|
Russell 2000® Value Index | 5.54% | 12.47% | 6.72% |
|---|
Russell 3000® Index | 15.30% | 15.96% | 12.96% |
|---|
|
| AssetsNet |
$ 395,679,140
|
| Holdings Count | Holding |
75
|
| Advisory Fees Paid, Amount |
$ 1,715,955
|
| InvestmentCompanyPortfolioTurnover |
14.00%
|
| Additional Fund Statistics [Text Block] |
Net Assets | $395,679,140 |
|---|
Number of Portfolio Holdings | 75 |
|---|
Portfolio Turnover | 14% |
|---|
Total Advisory Fees Paid | $1,715,955 |
|---|
Total Advisory Fees Paid % | 0.80% |
|---|
|
| Holdings [Text Block] |
Sector Weighting (% of net assets)Value | Value |
|---|
Financials | 20.4% | Industrials | 19.4% | Information Technology | 15.1% | Materials | 12.4% | Health Care | 10.2% | Consumer Discretionary | 9.9% | Energy | 3.8% | Utilities | 3.6% | Real Estate | 3.4% | Consumer Staples | 0.4% |
Country Weighting (% of net assets)Value | Value |
|---|
United States | 94.3% | Canada | 1.9% | Cayman Islands | 1.6% | Belgium | 0.8% |
|
| Largest Holdings [Text Block] |
Top 10 Holdings (% of net assets)Holding Name | % of Net Assets |
|---|
Valmont Industries, Inc. | 3.4% |
|---|
Mercury Systems, Inc. | 3.0% |
|---|
REV Group, Inc. | 3.0% |
|---|
AZZ, Inc. | 2.7% |
|---|
Ingevity Corp. | 2.4% |
|---|
Belden, Inc. | 2.2% |
|---|
Adapthealth Corp. | 2.2% |
|---|
O-I Glass, Inc. | 2.2% |
|---|
Progress Software Corp. | 2.0% |
|---|
Papa John's International, Inc. | 2.0% |
|---|
|
| Material Fund Change [Text Block] |
This is a summary of certain changes to the Fund since January 1, 2025. For more complete information, you may review the Fund’s current prospectus, as supplemented, at www.cisbh.com/funds or upon request at (800)392-2673. The parent company of the Fund’s adviser entered into a definitive agreement to take the parent company private, which resulted in a change of control of the adviser. There are no plans to make any changes to the Fund resulting from this transaction. |
| Updated Prospectus Web Address |
www.cisbh.com/funds/literature
|
| C000134695 |
|
| Shareholder Report [Line Items] |
|
| Fund Name |
Segall Bryant & Hamill Small Cap Growth Fund
|
| Trading Symbol |
WTSGX
|
| Annual or Semi-Annual Statement [Text Block] |
This semi-annual shareholder report contains important information about Segall Bryant & Hamill Small Cap Growth Fund (the "Fund") for the period of January 1, 2025 to June 30, 2025.
|
| Shareholder Report Annual or Semi-Annual |
Semi-Annual Shareholder Report
|
| Additional Information [Text Block] |
You can find additional information about the Fund at www.cisbh.com/funds/literature. You can also request this information by contacting us at (800) 392-2673.
|
| Material Fund Change Notice [Text Block] |
This report describes changes to the Fund that occurred during the fiscal year ending December 31, 2025.
|
| Additional Information Phone Number |
(800) 392-2673
|
| Additional Information Website |
www.cisbh.com/funds/literature
|
| Expenses [Text Block] |
What were the Fund’s annualized costs for the last six months?(based on a hypothetical $10,000 investment) Class Name | Costs of a $10,000 investment | Costs paid as a percentage of a $10,000 investment |
|---|
Retail | $52 | 1.06% |
|---|
|
| Expenses Paid, Amount |
$ 52
|
| Expense Ratio, Percent |
1.06%
|
| Factors Affecting Performance [Text Block] |
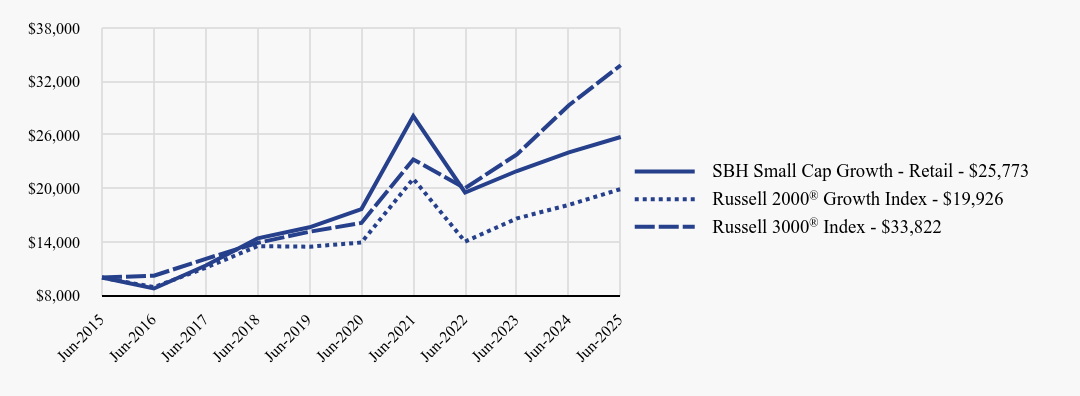
How did the Fund perform during the reporting period? Fund Performance For the first six months of 2025, the retail class of the Fund returned -2.79% against a return of -0.48% for the Russell 2000® Growth Index and 5.75% for the Fund’s broad-based securities market index, the Russell 3000® Index. Contributors to Return The one sector that contributed positively to the Fund’s returns on an absolute basis was Industrials. Industrials performance was driven by holdings with an emphasis on building solutions, infrastructure, and aerospace end markets. The three individual securities that contributed the most on an absolute basis were Limbach Holdings, Inc., Blueprint Medicines Corp., and Construction Partners, Inc. We believe Limbach, a building solutions provider for mechanical, electrical, and plumbing infrastructure, executed well on its strategic shift to deepen its relationships and work directly with building owners. Detractors from Return The three sectors that detracted most from the Fund’s returns on an absolute basis were Health Care, Consumer Discretionary, and Materials. Consumer Discretionary sector performance was driven by poor stock selection along with weaker overall demand, in part, due to tariff uncertainty. The three individual securities that detracted the most on an absolute basis were Vaxcyte, Inc., Freshpet, Inc., and Glaukos Corp. Ophthalmic medical technology company Glaukos struggled in the period amid Medicare and insurance reimbursement challenges as it transitions to a next-generation solution. |
| Line Graph [Table Text Block] |
| SBH Small Cap Growth - Retail | Russell 2000® Growth Index | Russell 3000® Index |
|---|
Jun-2015 | $10,000 | $10,000 | $10,000 |
|---|
Jun-2016 | $8,776 | $8,925 | $10,214 |
|---|
Jun-2017 | $11,359 | $11,103 | $12,104 |
|---|
Jun-2018 | $14,396 | $13,530 | $13,893 |
|---|
Jun-2019 | $15,642 | $13,464 | $15,141 |
|---|
Jun-2020 | $17,689 | $13,932 | $16,130 |
|---|
Jun-2021 | $28,121 | $21,087 | $23,253 |
|---|
Jun-2022 | $19,547 | $14,038 | $20,029 |
|---|
Jun-2023 | $21,957 | $16,639 | $23,825 |
|---|
Jun-2024 | $24,041 | $18,159 | $29,335 |
|---|
Jun-2025 | $25,773 | $19,926 | $33,822 |
|---|
|
| Average Annual Return [Table Text Block] |
| 1 Year | 5 Years | 10 Years |
|---|
SBH Small Cap Growth - Retail | 7.21% | 7.82% | 9.93% |
|---|
Russell 2000® Growth Index | 9.73% | 7.42% | 7.14% |
|---|
Russell 3000® Index | 15.30% | 15.96% | 12.96% |
|---|
|
| AssetsNet |
$ 250,321,118
|
| Holdings Count | Holding |
90
|
| Advisory Fees Paid, Amount |
$ 789,845
|
| InvestmentCompanyPortfolioTurnover |
0.00%
|
| Additional Fund Statistics [Text Block] |
Net Assets | $250,321,118 |
|---|
Number of Portfolio Holdings | 90 |
|---|
Portfolio Turnover | 0% |
|---|
Total Advisory Fees Paid | $789,845 |
|---|
Total Advisory Fees Paid % | 0.65% |
|---|
|
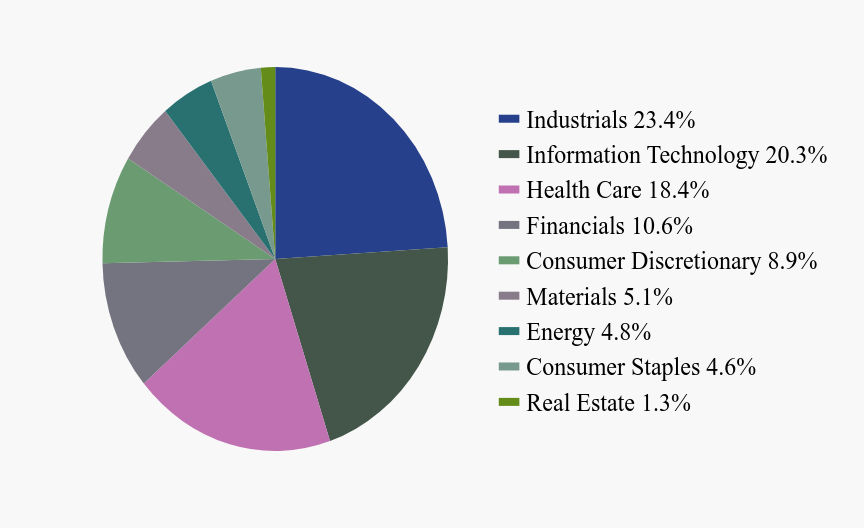
| Holdings [Text Block] |
Sector Weighting (% of net assets)Value | Value |
|---|
Industrials | 23.4% | Information Technology | 20.3% | Health Care | 18.4% | Financials | 10.6% | Consumer Discretionary | 8.9% | Materials | 5.1% | Energy | 4.8% | Consumer Staples | 4.6% | Real Estate | 1.3% |
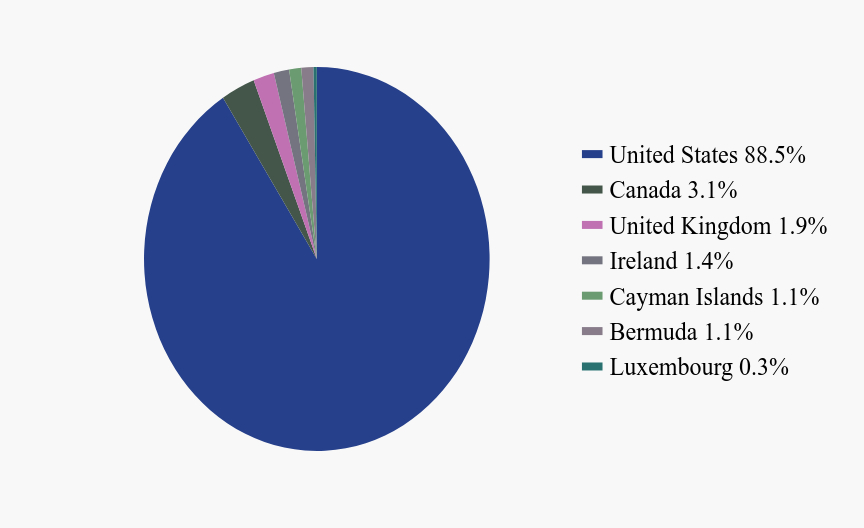
Country Weighting (% of net assets)Value | Value |
|---|
United States | 88.5% | Canada | 3.1% | United Kingdom | 1.9% | Ireland | 1.4% | Cayman Islands | 1.1% | Bermuda | 1.1% | Luxembourg | 0.3% |
|
| Largest Holdings [Text Block] |
Top 10 Holdings (% of net assets)Holding Name | % of Net Assets |
|---|
Mirion Technologies, Inc. | 2.6% |
|---|
Construction Partners, Inc. | 2.4% |
|---|
VSE Corp. | 2.3% |
|---|
Skyward Specialty Insurance Group, Inc. | 2.0% |
|---|
RadNet, Inc. | 2.0% |
|---|
Casella Waste Systems, Inc. | 2.0% |
|---|
Boot Barn Holdings, Inc. | 2.0% |
|---|
TechnipFMC PLC | 1.9% |
|---|
Box, Inc. | 1.9% |
|---|
HealthEquity, Inc. | 1.9% |
|---|
|
| Material Fund Change [Text Block] |
This is a summary of certain changes to the Fund since January 1, 2025. For more complete information, you may review the Fund’s current prospectus, as supplemented, at www.cisbh.com/funds or upon request at (800)392-2673. The parent company of the Fund’s adviser entered into a definitive agreement to take the parent company private, which resulted in a change of control of the adviser. There are no plans to make any changes to the Fund resulting from this transaction. |
| Updated Prospectus Web Address |
www.cisbh.com/funds/literature
|
| C000134696 |
|
| Shareholder Report [Line Items] |
|
| Fund Name |
Segall Bryant & Hamill Small Cap Growth Fund
|
| Trading Symbol |
WISGX
|
| Annual or Semi-Annual Statement [Text Block] |
This semi-annual shareholder report contains important information about Segall Bryant & Hamill Small Cap Growth Fund (the "Fund") for the period of January 1, 2025 to June 30, 2025.
|
| Shareholder Report Annual or Semi-Annual |
Semi-Annual Shareholder Report
|
| Additional Information [Text Block] |
You can find additional information about the Fund at www.cisbh.com/funds/literature. You can also request this information by contacting us at (800) 392-2673.
|
| Material Fund Change Notice [Text Block] |
This report describes changes to the Fund that occurred during the fiscal year ending December 31, 2025.
|
| Additional Information Phone Number |
(800) 392-2673
|
| Additional Information Website |
www.cisbh.com/funds/literature
|
| Expenses [Text Block] |
What were the Fund’s annualized costs for the last six months?(based on a hypothetical $10,000 investment) Class Name | Costs of a $10,000 investment | Costs paid as a percentage of a $10,000 investment |
|---|
Institutional | $43 | 0.87% |
|---|
|
| Expenses Paid, Amount |
$ 43
|
| Expense Ratio, Percent |
0.87%
|
| Factors Affecting Performance [Text Block] |
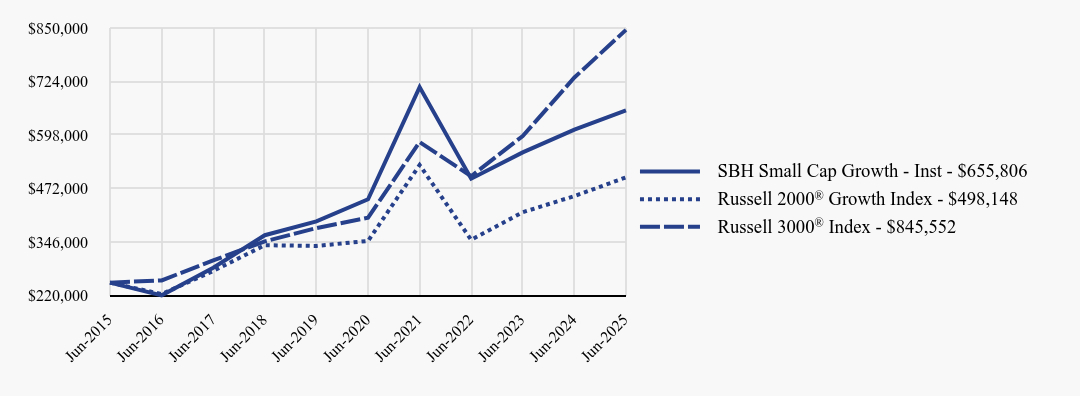
How did the Fund perform during the reporting period? Fund Performance For the first six months of 2025, the institutional class of the Fund returned -2.71% against a return of -0.48% for the Russell 2000® Growth Index and 5.75% for the Fund’s broad-based securities market index, the Russell 3000® Index. Contributors to Return The one sector that contributed positively to the Fund’s returns on an absolute basis was Industrials. Industrials performance was driven by holdings with an emphasis on building solutions, infrastructure, and aerospace end markets. The three individual securities that contributed the most on an absolute basis were Limbach Holdings, Inc., Blueprint Medicines Corp., and Construction Partners, Inc. We believe Limbach, a building solutions provider for mechanical, electrical, and plumbing infrastructure, executed well on its strategic shift to deepen its relationships and work directly with building owners. Detractors from Return The three sectors that detracted most from the Fund’s returns on an absolute basis were Health Care, Consumer Discretionary, and Materials. Consumer Discretionary sector performance was driven by poor stock selection along with weaker overall demand, in part, due to tariff uncertainty. The three individual securities that detracted the most on an absolute basis were Vaxcyte, Inc., Freshpet, Inc., and Glaukos Corp. Ophthalmic medical technology company Glaukos struggled in the period amid Medicare and insurance reimbursement challenges as it transitions to a next-generation solution. |
| Line Graph [Table Text Block] |
| SBH Small Cap Growth - Inst | Russell 2000® Growth Index | Russell 3000® Index |
|---|
Jun-2015 | $250,000 | $250,000 | $250,000 |
|---|
Jun-2016 | $220,055 | $223,121 | $255,346 |
|---|
Jun-2017 | $285,289 | $277,566 | $302,609 |
|---|
Jun-2018 | $361,806 | $338,248 | $347,329 |
|---|
Jun-2019 | $394,228 | $336,590 | $378,528 |
|---|
Jun-2020 | $446,605 | $348,299 | $403,244 |
|---|
Jun-2021 | $710,664 | $527,185 | $581,334 |
|---|
Jun-2022 | $494,954 | $350,943 | $500,729 |
|---|
Jun-2023 | $556,940 | $415,979 | $595,635 |
|---|
Jun-2024 | $610,557 | $453,985 | $733,376 |
|---|
Jun-2025 | $655,806 | $498,148 | $845,552 |
|---|
|
| Average Annual Return [Table Text Block] |
| 1 Year | 5 Years | 10 Years |
|---|
SBH Small Cap Growth - Inst | 7.41% | 7.99% | 10.12% |
|---|
Russell 2000® Growth Index | 9.73% | 7.42% | 7.14% |
|---|
Russell 3000® Index | 15.30% | 15.96% | 12.96% |
|---|
|
| AssetsNet |
$ 250,321,118
|
| Holdings Count | Holding |
90
|
| Advisory Fees Paid, Amount |
$ 789,845
|
| InvestmentCompanyPortfolioTurnover |
0.00%
|
| Additional Fund Statistics [Text Block] |
Net Assets | $250,321,118 |
|---|
Number of Portfolio Holdings | 90 |
|---|
Portfolio Turnover | 0% |
|---|
Total Advisory Fees Paid | $789,845 |
|---|
Total Advisory Fees Paid % | 0.65% |
|---|
|
| Holdings [Text Block] |
Sector Weighting (% of net assets)Value | Value |
|---|
Industrials | 23.4% | Information Technology | 20.3% | Health Care | 18.4% | Financials | 10.6% | Consumer Discretionary | 8.9% | Materials | 5.1% | Energy | 4.8% | Consumer Staples | 4.6% | Real Estate | 1.3% |
Country Weighting (% of net assets)Value | Value |
|---|
United States | 88.5% | Canada | 3.1% | United Kingdom | 1.9% | Ireland | 1.4% | Cayman Islands | 1.1% | Bermuda | 1.1% | Luxembourg | 0.3% |
|
| Largest Holdings [Text Block] |
Top 10 Holdings (% of net assets)Holding Name | % of Net Assets |
|---|
Mirion Technologies, Inc. | 2.6% |
|---|
Construction Partners, Inc. | 2.4% |
|---|
VSE Corp. | 2.3% |
|---|
Skyward Specialty Insurance Group, Inc. | 2.0% |
|---|
RadNet, Inc. | 2.0% |
|---|
Casella Waste Systems, Inc. | 2.0% |
|---|
Boot Barn Holdings, Inc. | 2.0% |
|---|
TechnipFMC PLC | 1.9% |
|---|
Box, Inc. | 1.9% |
|---|
HealthEquity, Inc. | 1.9% |
|---|
|
| Material Fund Change [Text Block] |
This is a summary of certain changes to the Fund since January 1, 2025. For more complete information, you may review the Fund’s current prospectus, as supplemented, at www.cisbh.com/funds or upon request at (800)392-2673. The parent company of the Fund’s adviser entered into a definitive agreement to take the parent company private, which resulted in a change of control of the adviser. There are no plans to make any changes to the Fund resulting from this transaction. |
| Updated Prospectus Web Address |
www.cisbh.com/funds/literature
|
| C000216810 |
|
| Shareholder Report [Line Items] |
|
| Fund Name |
Segall Bryant & Hamill Small Cap Core Fund
|
| Trading Symbol |
SBHCX
|
| Annual or Semi-Annual Statement [Text Block] |
This semi-annual shareholder report contains important information about Segall Bryant & Hamill Small Cap Core Fund (the "Fund") for the period of January 1, 2025 to June 30, 2025.
|
| Shareholder Report Annual or Semi-Annual |
Semi-Annual Shareholder Report
|
| Additional Information [Text Block] |
You can find additional information about the Fund at www.cisbh.com/funds/literature. You can also request this information by contacting us at (800) 392-2673.
|
| Material Fund Change Notice [Text Block] |
This report describes changes to the Fund that occurred during the fiscal year ending December 31, 2025.
|
| Additional Information Phone Number |
(800) 392-2673
|
| Additional Information Website |
www.cisbh.com/funds/literature
|
| Expenses [Text Block] |
What were the Fund’s annualized costs for the last six months?(based on a hypothetical $10,000 investment) Class Name | Costs of a $10,000 investment | Costs paid as a percentage of a $10,000 investment |
|---|
Retail | $53 | 1.10% |
|---|
|
| Expenses Paid, Amount |
$ 53
|
| Expense Ratio, Percent |
1.10%
|
| Factors Affecting Performance [Text Block] |
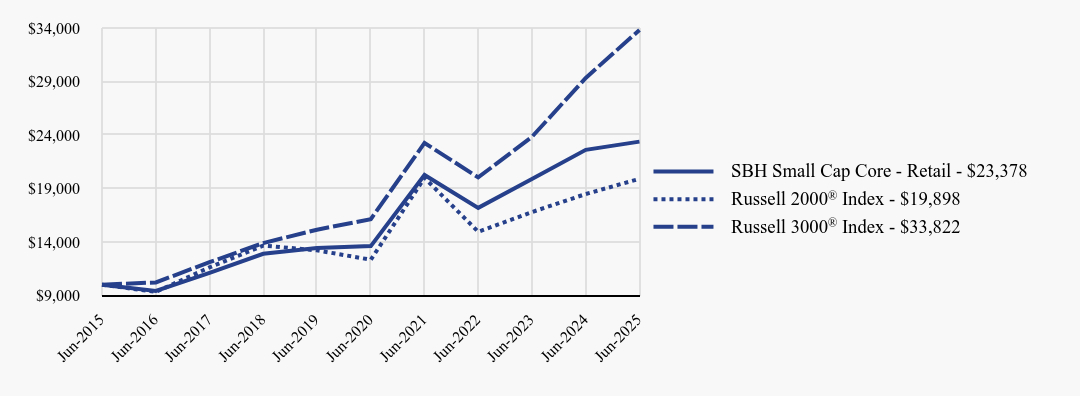
How did the Fund perform during the reporting period? Fund Performance For the first six months of 2025, the retail class of the Fund returned -2.71% against a return of -1.78% for the Russell 2000® Index and 5.75% for the Fund’s broad-based securities market index, the Russell 3000® Index. Contributors to Return The three sectors that contributed most to the Fund’s returns on an absolute basis were Industrials, Consumer Staples, and Real Estate. Industrials performance was driven by solid stock selection. The three individual securities that contributed the most on an absolute basis were REV Group, Inc., iRhythm Technologies, Inc., and RBC Bearings, Inc. REV Group posted solid top- and bottom-line results that reflected the ongoing benefits of the pricing, backlog conversion, and operational excellence programs implemented by its new management team in recent years. Detractors from Return The three sectors that detracted most from the Fund’s returns on an absolute basis were Consumer Discretionary, Health Care, and Energy. Consumer Discretionary performance was pressured by tariff announcements, which raised concerns about higher input costs and potential impacts on consumer spending. The three individual securities that detracted the most on an absolute basis were Columbus McKinnon Corp., Globant S.A., and Globus Medical, Inc. Globus reported a disappointing quarter with headwinds to several of its businesses. |
| Line Graph [Table Text Block] |
| SBH Small Cap Core - Retail | Russell 2000® Index | Russell 3000® Index |
|---|
Jun-2015 | $10,000 | $10,000 | $10,000 |
|---|
Jun-2016 | $9,420 | $9,327 | $10,214 |
|---|
Jun-2017 | $11,113 | $11,621 | $12,104 |
|---|
Jun-2018 | $12,888 | $13,663 | $13,893 |
|---|
Jun-2019 | $13,432 | $13,211 | $15,141 |
|---|
Jun-2020 | $13,609 | $12,335 | $16,130 |
|---|
Jun-2021 | $20,255 | $19,987 | $23,253 |
|---|
Jun-2022 | $17,186 | $14,951 | $20,029 |
|---|
Jun-2023 | $19,879 | $16,790 | $23,825 |
|---|
Jun-2024 | $22,608 | $18,479 | $29,335 |
|---|
Jun-2025 | $23,378 | $19,898 | $33,822 |
|---|
|
| Average Annual Return [Table Text Block] |
| 1 Year | 5 Years | 10 Years |
|---|
SBH Small Cap Core - Retail | 3.41% | 11.43% | 8.86% |
|---|
Russell 2000® Index | 7.68% | 10.04% | 7.12% |
|---|
Russell 3000® Index | 15.30% | 15.96% | 12.96% |
|---|
|
| AssetsNet |
$ 92,915,370
|
| Holdings Count | Holding |
84
|
| Advisory Fees Paid, Amount |
$ 278,887
|
| InvestmentCompanyPortfolioTurnover |
17.00%
|
| Additional Fund Statistics [Text Block] |
Net Assets | $92,915,370 |
|---|
Number of Portfolio Holdings | 84 |
|---|
Portfolio Turnover | 17% |
|---|
Total Advisory Fees Paid* | $278,887 |
|---|
Total Advisory Fees Paid %* | 0.69% |
|---|
* Net of expenses waived by investment adviser |
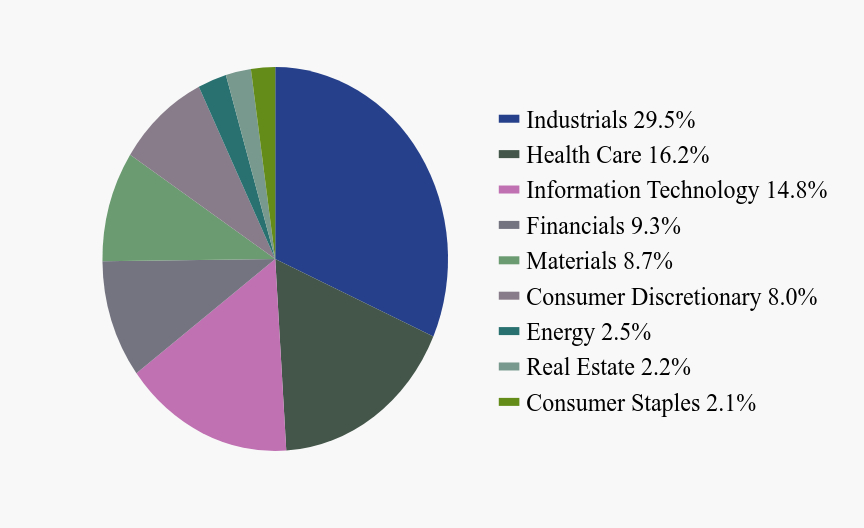
| Holdings [Text Block] |
Sector Weighting (% of net assets)Value | Value |
|---|
Industrials | 29.5% | Health Care | 16.2% | Information Technology | 14.8% | Financials | 9.3% | Materials | 8.7% | Consumer Discretionary | 8.0% | Energy | 2.5% | Real Estate | 2.2% | Consumer Staples | 2.1% |
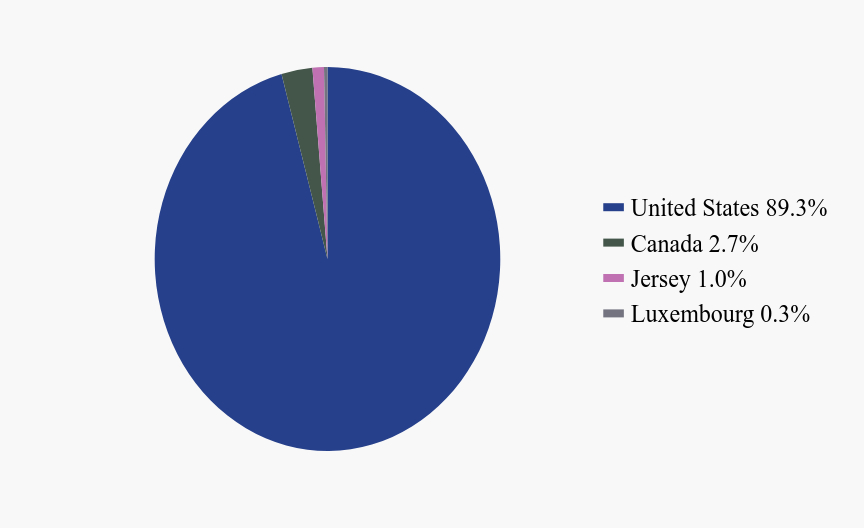
Country Weighting (% of net assets)Value | Value |
|---|
United States | 89.3% | Canada | 2.7% | Jersey | 1.0% | Luxembourg | 0.3% |
|
| Largest Holdings [Text Block] |
Top 10 Holdings (% of net assets)Holding Name | % of Net Assets |
|---|
EnPro Industries, Inc. | 2.4% |
|---|
RBC Bearings, Inc. | 2.2% |
|---|
Agilysys, Inc. | 2.0% |
|---|
Ensign Group, Inc. (The) | 2.0% |
|---|
Crane Co. | 2.0% |
|---|
Valmont Industries, Inc. | 1.9% |
|---|
Silgan Holdings, Inc. | 1.9% |
|---|
SouthState Corp. | 1.8% |
|---|
Casella Waste Systems, Inc. | 1.8% |
|---|
Element Solutions, Inc. | 1.8% |
|---|
|
| Material Fund Change [Text Block] |
This is a summary of certain changes to the Fund since January 1, 2025. For more complete information, you may review the Fund’s current prospectus, as supplemented, at www.cisbh.com/funds or upon request at (800)392-2673. The parent company of the Fund’s adviser entered into a definitive agreement to take the parent company private, which resulted in a change of control of the adviser. There are no plans to make any changes to the Fund resulting from this transaction. |
| Updated Prospectus Web Address |
www.cisbh.com/funds/literature
|
| C000216811 |
|
| Shareholder Report [Line Items] |
|
| Fund Name |
Segall Bryant & Hamill Small Cap Core Fund
|
| Trading Symbol |
SBASX
|
| Annual or Semi-Annual Statement [Text Block] |
This semi-annual shareholder report contains important information about Segall Bryant & Hamill Small Cap Core Fund (the "Fund") for the period of January 1, 2025 to June 30, 2025.
|
| Shareholder Report Annual or Semi-Annual |
Semi-Annual Shareholder Report
|
| Additional Information [Text Block] |
You can find additional information about the Fund at www.cisbh.com/funds/literature. You can also request this information by contacting us at (800) 392-2673.
|
| Material Fund Change Notice [Text Block] |
This report describes changes to the Fund that occurred during the fiscal year ending December 31, 2025.
|
| Additional Information Phone Number |
(800) 392-2673
|
| Additional Information Website |
www.cisbh.com/funds/literature
|
| Expenses [Text Block] |
What were the Fund’s annualized costs for the last six months?(based on a hypothetical $10,000 investment) Class Name | Costs of a $10,000 investment | Costs paid as a percentage of a $10,000 investment |
|---|
Institutional | $48 | 0.99% |
|---|
|
| Expenses Paid, Amount |
$ 48
|
| Expense Ratio, Percent |
0.99%
|
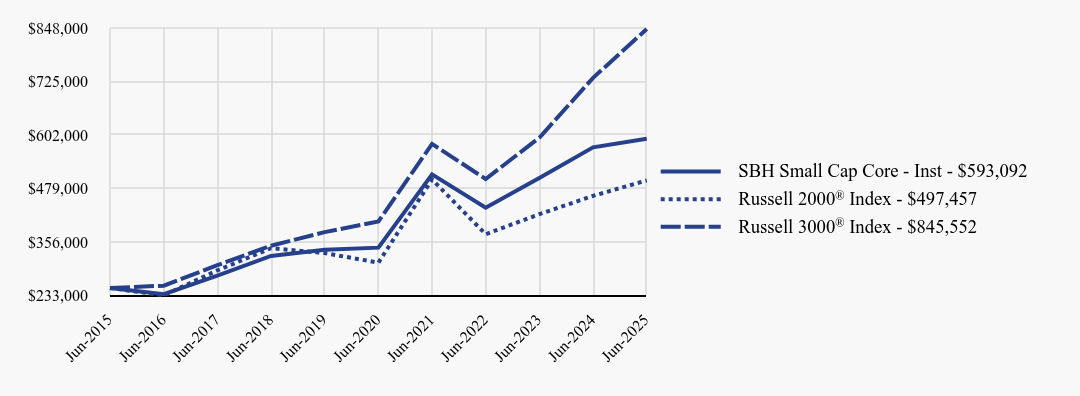
| Factors Affecting Performance [Text Block] |
How did the Fund perform during the reporting period? Fund Performance For the first six months of 2025, the institutional class of the Fund returned -2.69% against a return of -1.78% for the Russell 2000® Index and 5.75% for the Fund’s broad-based securities market index, the Russell 3000® Index. Contributors to Return The three sectors that contributed most to the Fund’s returns on an absolute basis were Industrials, Consumer Staples, and Real Estate. Industrials performance was driven by solid stock selection. The three individual securities that contributed the most on an absolute basis were REV Group, Inc., iRhythm Technologies, Inc., and RBC Bearings, Inc. REV Group posted solid top- and bottom-line results that reflected the ongoing benefits of the pricing, backlog conversion, and operational excellence programs implemented by its new management team in recent years. Detractors from Return The three sectors that detracted most from the Fund’s returns on an absolute basis were Consumer Discretionary, Health Care, and Energy. Consumer Discretionary performance was pressured by tariff announcements, which raised concerns about higher input costs and potential impacts on consumer spending. The three individual securities that detracted the most on an absolute basis were Columbus McKinnon Corp., Globant S.A., and Globus Medical, Inc. Globus reported a disappointing quarter with headwinds to several of its businesses. |
| Line Graph [Table Text Block] |
| SBH Small Cap Core - Inst | Russell 2000® Index | Russell 3000® Index |
|---|
Jun-2015 | $250,000 | $250,000 | $250,000 |
|---|
Jun-2016 | $235,849 | $233,174 | $255,346 |
|---|
Jun-2017 | $278,665 | $290,536 | $302,609 |
|---|
Jun-2018 | $323,657 | $341,571 | $347,329 |
|---|
Jun-2019 | $337,808 | $330,267 | $378,528 |
|---|
Jun-2020 | $342,888 | $308,387 | $403,244 |
|---|
Jun-2021 | $511,248 | $499,666 | $581,334 |
|---|
Jun-2022 | $434,508 | $373,763 | $500,729 |
|---|
Jun-2023 | $503,214 | $419,760 | $595,635 |
|---|
Jun-2024 | $573,572 | $461,972 | $733,376 |
|---|
Jun-2025 | $593,092 | $497,457 | $845,552 |
|---|
|
| Average Annual Return [Table Text Block] |
| 1 Year | 5 Years | 10 Years |
|---|
SBH Small Cap Core - Inst | 3.40% | 11.58% | 9.02% |
|---|
Russell 2000® Index | 7.68% | 10.04% | 7.12% |
|---|
Russell 3000® Index | 15.30% | 15.96% | 12.96% |
|---|
|
| AssetsNet |
$ 92,915,370
|
| Holdings Count | Holding |
84
|
| Advisory Fees Paid, Amount |
$ 278,887
|
| InvestmentCompanyPortfolioTurnover |
17.00%
|
| Additional Fund Statistics [Text Block] |
Net Assets | $92,915,370 |
|---|
Number of Portfolio Holdings | 84 |
|---|
Portfolio Turnover | 17% |
|---|
Total Advisory Fees Paid* | $278,887 |
|---|
Total Advisory Fees Paid %* | 0.69% |
|---|
* Net of expenses waived by investment adviser |
| Holdings [Text Block] |
Sector Weighting (% of net assets)Value | Value |
|---|
Industrials | 29.5% | Health Care | 16.2% | Information Technology | 14.8% | Financials | 9.3% | Materials | 8.7% | Consumer Discretionary | 8.0% | Energy | 2.5% | Real Estate | 2.2% | Consumer Staples | 2.1% |
Country Weighting (% of net assets)Value | Value |
|---|
United States | 89.3% | Canada | 2.7% | Jersey | 1.0% | Luxembourg | 0.3% |
|
| Largest Holdings [Text Block] |
Top 10 Holdings (% of net assets)Holding Name | % of Net Assets |
|---|
EnPro Industries, Inc. | 2.4% |
|---|
RBC Bearings, Inc. | 2.2% |
|---|
Agilysys, Inc. | 2.0% |
|---|
Ensign Group, Inc. (The) | 2.0% |
|---|
Crane Co. | 2.0% |
|---|
Valmont Industries, Inc. | 1.9% |
|---|
Silgan Holdings, Inc. | 1.9% |
|---|
SouthState Corp. | 1.8% |
|---|
Casella Waste Systems, Inc. | 1.8% |
|---|
Element Solutions, Inc. | 1.8% |
|---|
|
| Material Fund Change [Text Block] |
This is a summary of certain changes to the Fund since January 1, 2025. For more complete information, you may review the Fund’s current prospectus, as supplemented, at www.cisbh.com/funds or upon request at (800)392-2673. The parent company of the Fund’s adviser entered into a definitive agreement to take the parent company private, which resulted in a change of control of the adviser. There are no plans to make any changes to the Fund resulting from this transaction. |
| Updated Prospectus Web Address |
www.cisbh.com/funds/literature
|
| C000211581 |
|
| Shareholder Report [Line Items] |
|
| Fund Name |
Segall Bryant & Hamill All Cap Fund
|
| Trading Symbol |
SBRAX
|
| Annual or Semi-Annual Statement [Text Block] |
This semi-annual shareholder report contains important information about Segall Bryant & Hamill All Cap Fund (the "Fund") for the period of January 1, 2025 to June 30, 2025.
|
| Shareholder Report Annual or Semi-Annual |
Semi-Annual Shareholder Report
|
| Additional Information [Text Block] |
You can find additional information about the Fund at www.cisbh.com/funds/literature. You can also request this information by contacting us at (800) 392-2673.
|
| Material Fund Change Notice [Text Block] |
This report describes changes to the Fund that occurred during the fiscal year ending December 31, 2025.
|
| Additional Information Phone Number |
(800) 392-2673
|
| Additional Information Website |
www.cisbh.com/funds/literature
|
| Expenses [Text Block] |
What were the Fund’s annualized costs for the last six months?(based on a hypothetical $10,000 investment) Class Name | Costs of a $10,000 investment | Costs paid as a percentage of a $10,000 investment |
|---|
Retail | $43 | 0.86% |
|---|
|
| Expenses Paid, Amount |
$ 43
|
| Expense Ratio, Percent |
0.86%
|
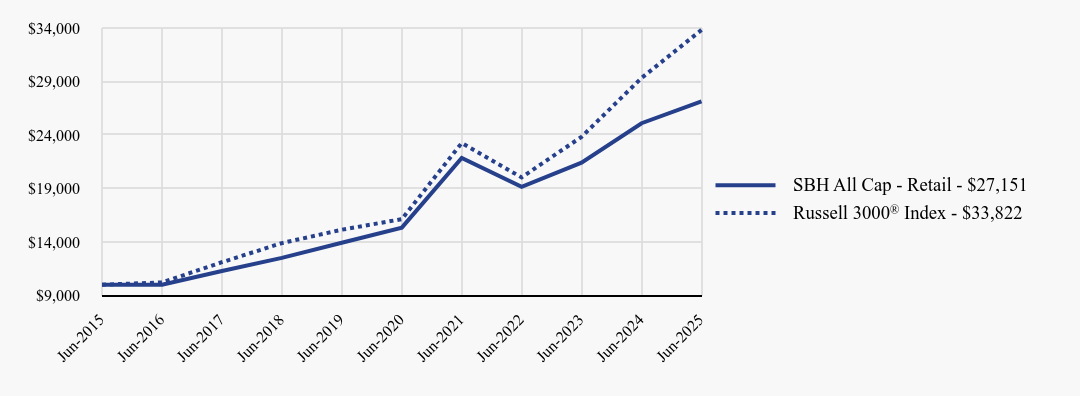
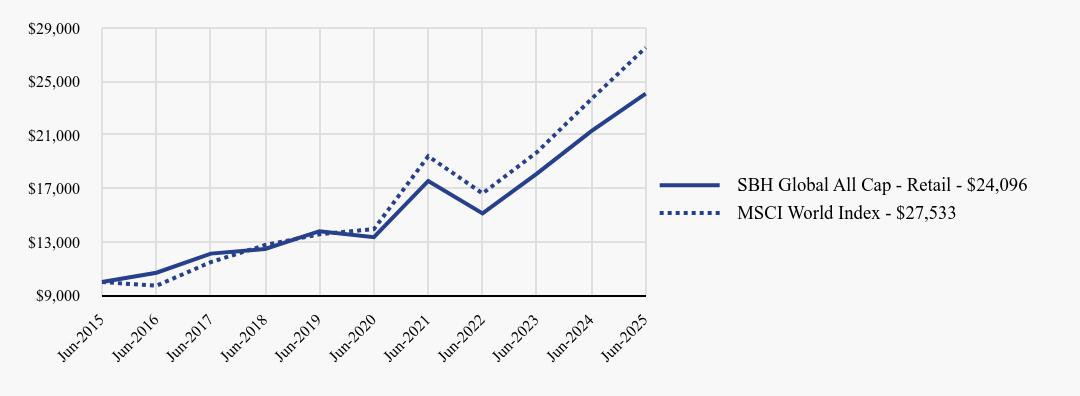
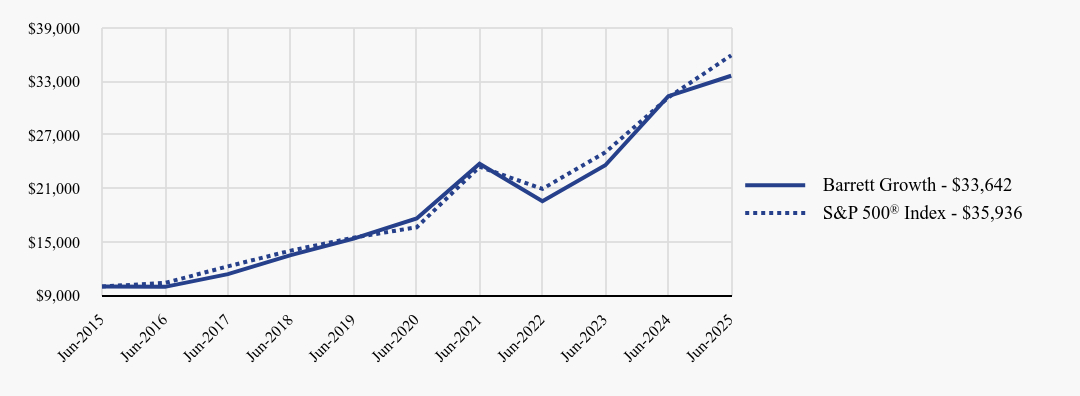
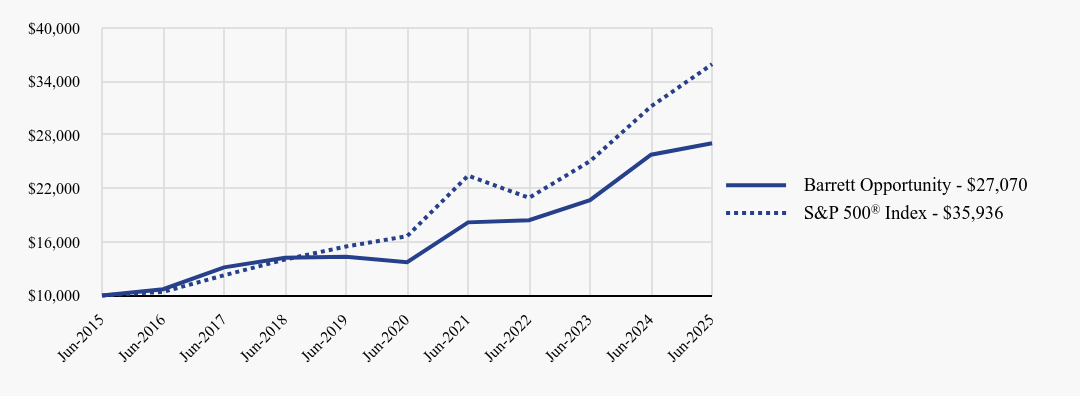
| Factors Affecting Performance [Text Block] |
How did the Fund perform during the reporting period? Fund Performance For the first six months of 2025, the retail class of the Fund returned 2.46% against a return of 5.75% for the Fund’s broad-based securities market index, the Russell 3000® Index. Contributors to Return The three sectors that contributed most to the Fund’s returns on an absolute basis were Industrials, Financials, and Information Technology. A recovery in data-center-related companies, along with continued strong performance in aerospace and defense stocks, drove Industrials sector outperformance. The three individual securities that contributed the most on an absolute basis were ATI, Inc., Microsoft Corp., and JPMorgan Chase & Co. For ATI, there has been a growing appreciation for the company’s multi-year opportunity in premium aerospace products, which drove shares to new highs during the period. Detractors from Return The three sectors that detracted most from the Fund’s returns on an absolute basis were Health Care, Consumer Discretionary, and Materials. Underperformance in Health Care was linked to regulatory uncertainties and a rotation away from defensive groups in the market. The three individual securities that detracted the most on an absolute basis were Marvell Technology, Inc., UnitedHealth Group, Inc., and Zebra Technologies Corp. For Marvell Technology, there were new concerns related to the potential share loss on a high-profile, application-specific semiconductor chip with top customer Amazon.com Inc. |
| Line Graph [Table Text Block] |
| SBH All Cap - Retail | Russell 3000® Index |
|---|
Jun-2015 | $10,000 | $10,000 |
|---|
Jun-2016 | $9,992 | $10,214 |
|---|
Jun-2017 | $11,288 | $12,104 |
|---|
Jun-2018 | $12,512 | $13,893 |
|---|
Jun-2019 | $13,927 | $15,141 |
|---|
Jun-2020 | $15,334 | $16,130 |
|---|
Jun-2021 | $21,846 | $23,253 |
|---|
Jun-2022 | $19,158 | $20,029 |
|---|
Jun-2023 | $21,415 | $23,825 |
|---|
Jun-2024 | $25,096 | $29,335 |
|---|
Jun-2025 | $27,151 | $33,822 |
|---|
|
| Average Annual Return [Table Text Block] |
| 1 Year | 5 Years | 10 Years |
|---|
SBH All Cap - Retail | 8.19% | 12.10% | 10.50% |
|---|
Russell 3000® Index | 15.30% | 15.96% | 12.96% |
|---|
|
| AssetsNet |
$ 93,732,613
|
| Holdings Count | Holding |
54
|
| Advisory Fees Paid, Amount |
$ 248,436
|
| InvestmentCompanyPortfolioTurnover |
20.00%
|
| Additional Fund Statistics [Text Block] |
Net Assets | $93,732,613 |
|---|
Number of Portfolio Holdings | 54 |
|---|
Portfolio Turnover | 20% |
|---|
Total Advisory Fees Paid* | $248,436 |
|---|
Total Advisory Fees Paid %* | 0.52% |
|---|
* Net of expenses waived by investment adviser |
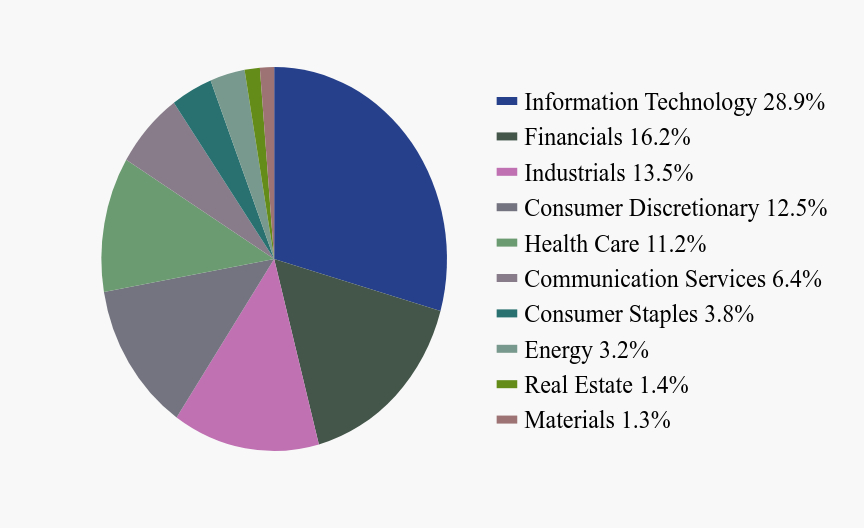
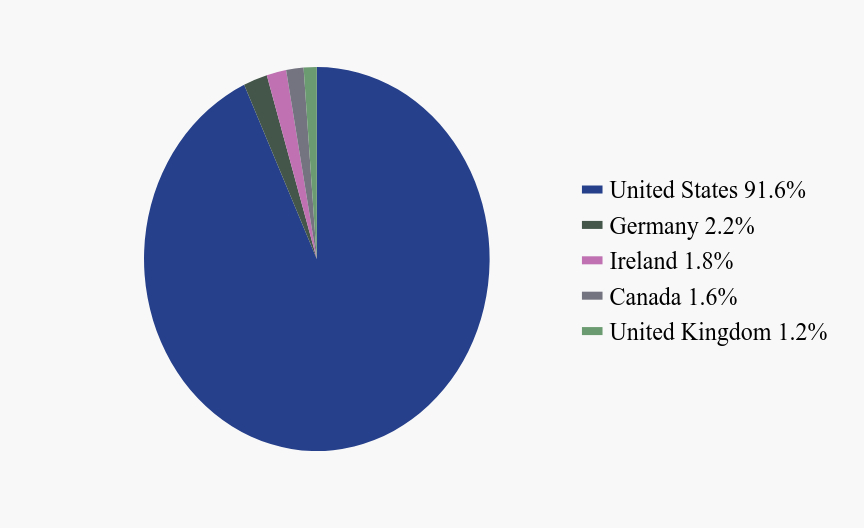
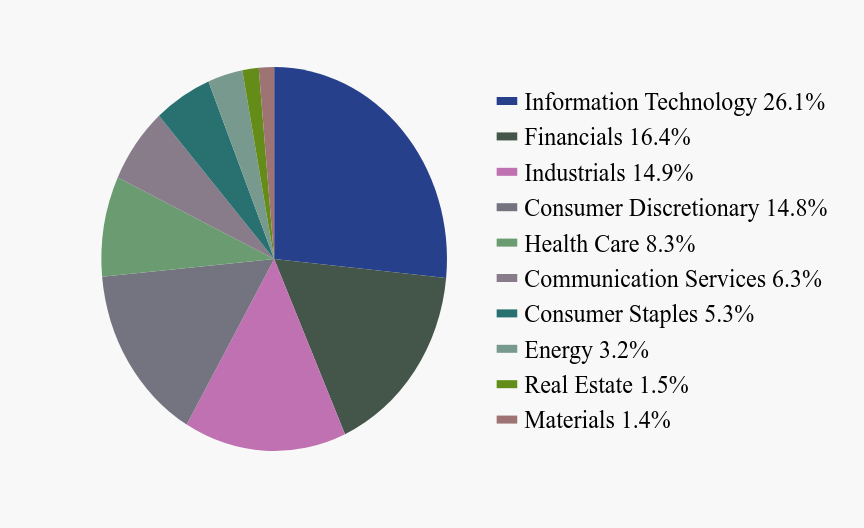
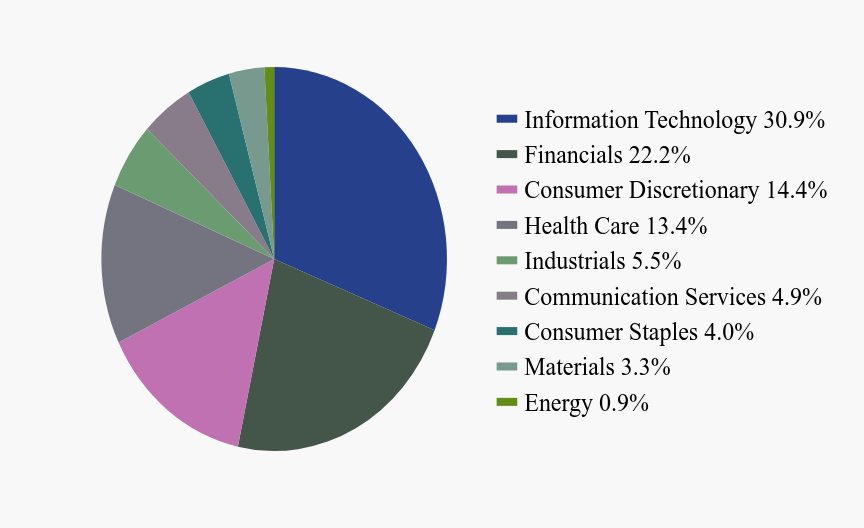
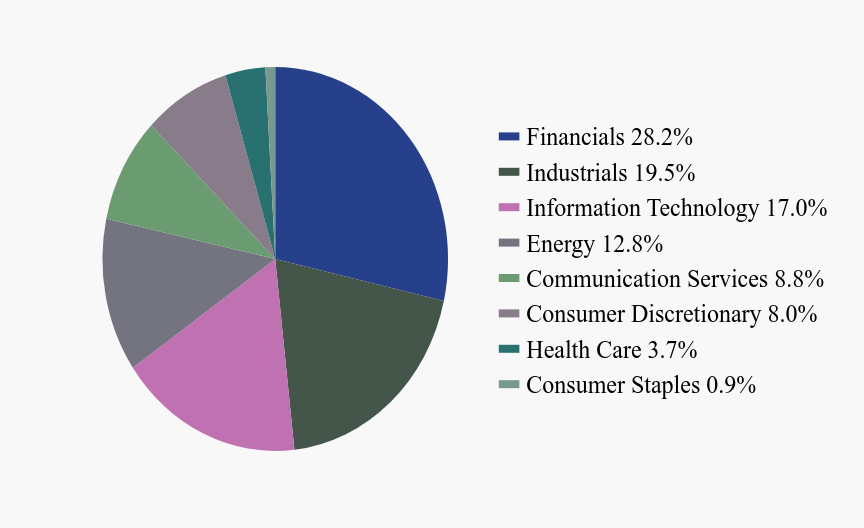
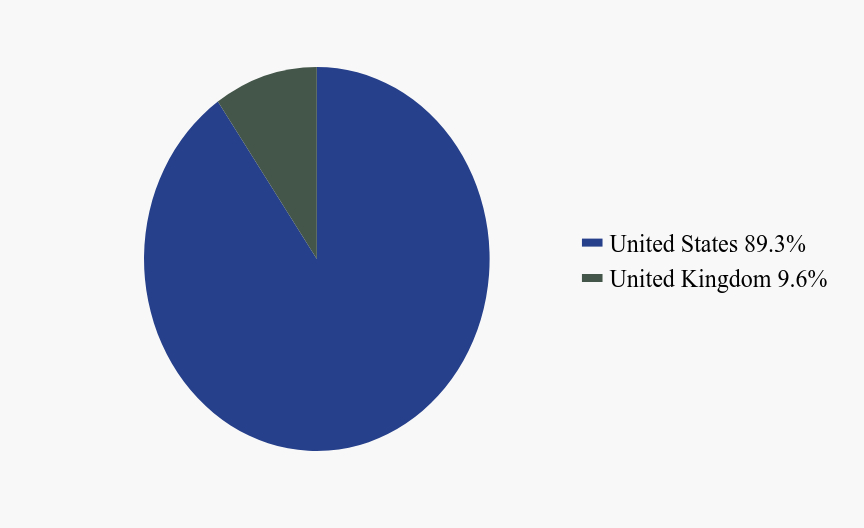
| Holdings [Text Block] |
Sector Weighting (% of net assets)Value | Value |
|---|
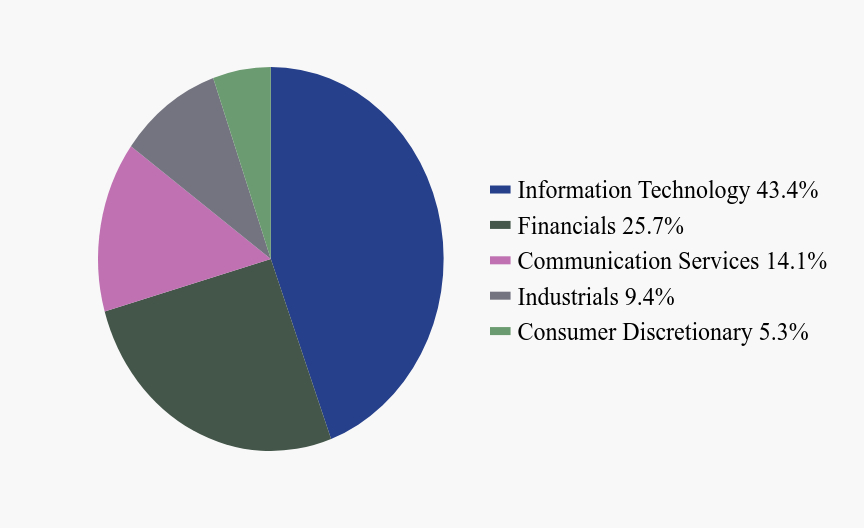
Information Technology | 28.9% | Financials | 16.2% | Industrials | 13.5% | Consumer Discretionary | 12.5% | Health Care | 11.2% | Communication Services | 6.4% | Consumer Staples | 3.8% | Energy | 3.2% | Real Estate | 1.4% | Materials | 1.3% |
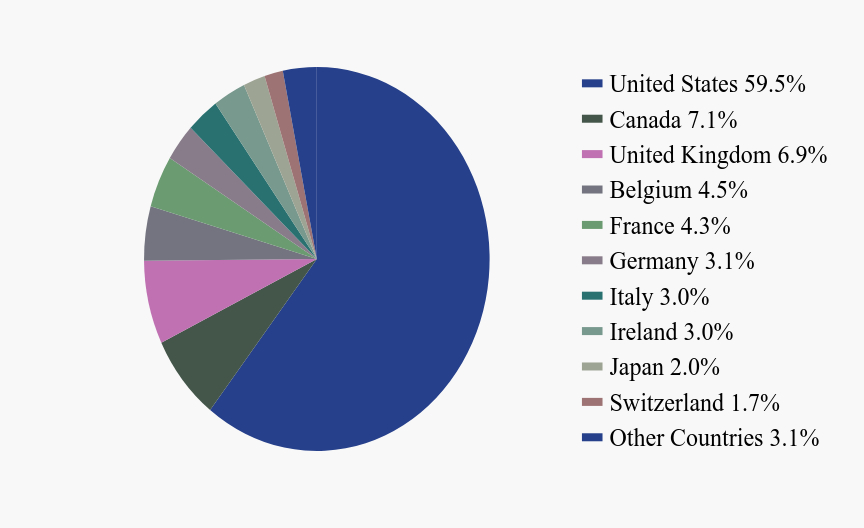
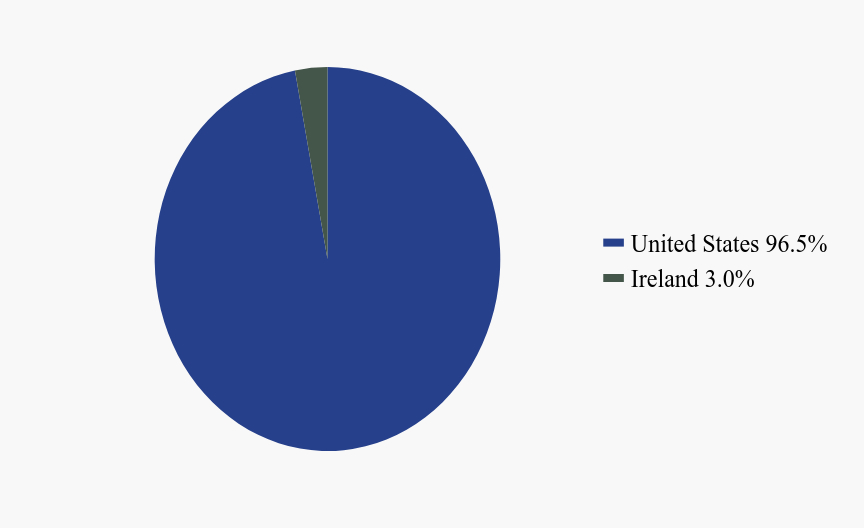
Country Weighting (% of net assets)Value | Value |
|---|
United States | 91.6% | Germany | 2.2% | Ireland | 1.8% | Canada | 1.6% | United Kingdom | 1.2% |
|
| Largest Holdings [Text Block] |
Top 10 Holdings (% of net assets)Holding Name | % of Net Assets |
|---|
Microsoft Corp. | 4.8% |
|---|
JPMorgan Chase & Co. | 3.5% |
|---|
Alphabet, Inc. | 3.3% |
|---|
Visa, Inc. | 3.2% |
|---|
Amazon.com, Inc. | 3.2% |
|---|
Meta Platforms, Inc. | 3.1% |
|---|
ServiceNow, Inc. | 2.6% |
|---|
Globe Life, Inc. | 2.5% |
|---|
Quanta Services, Inc. | 2.5% |
|---|
Reinsurance Group of America, Inc. | 2.5% |
|---|
|
| Material Fund Change [Text Block] |
This is a summary of certain changes to the Fund since January 1, 2025. For more complete information, you may review the Fund’s current prospectus, as supplemented, at www.cisbh.com/funds or upon request at (800)392-2673. The parent company of the Fund’s adviser entered into a definitive agreement to take the parent company private, which resulted in a change of control of the adviser. There are no plans to make any changes to the Fund resulting from this transaction. |
| Updated Prospectus Web Address |
www.cisbh.com/funds/literature
|
| C000211582 |
|
| Shareholder Report [Line Items] |
|
| Fund Name |
Segall Bryant & Hamill All Cap Fund
|
| Trading Symbol |
SBHAX
|
| Annual or Semi-Annual Statement [Text Block] |
This semi-annual shareholder report contains important information about Segall Bryant & Hamill All Cap Fund (the "Fund") for the period of January 1, 2025 to June 30, 2025.
|
| Shareholder Report Annual or Semi-Annual |
Semi-Annual Shareholder Report
|
| Additional Information [Text Block] |
You can find additional information about the Fund at www.cisbh.com/funds/literature. You can also request this information by contacting us at (800) 392-2673.
|
| Material Fund Change Notice [Text Block] |
This report describes changes to the Fund that occurred during the fiscal year ending December 31, 2025.
|
| Additional Information Phone Number |
(800) 392-2673
|
| Additional Information Website |
www.cisbh.com/funds/literature
|
| Expenses [Text Block] |
What were the Fund’s annualized costs for the last six months?(based on a hypothetical $10,000 investment) Class Name | Costs of a $10,000 investment | Costs paid as a percentage of a $10,000 investment |
|---|
Institutional | $42 | 0.84% |
|---|
|
| Expenses Paid, Amount |
$ 42
|
| Expense Ratio, Percent |
0.84%
|
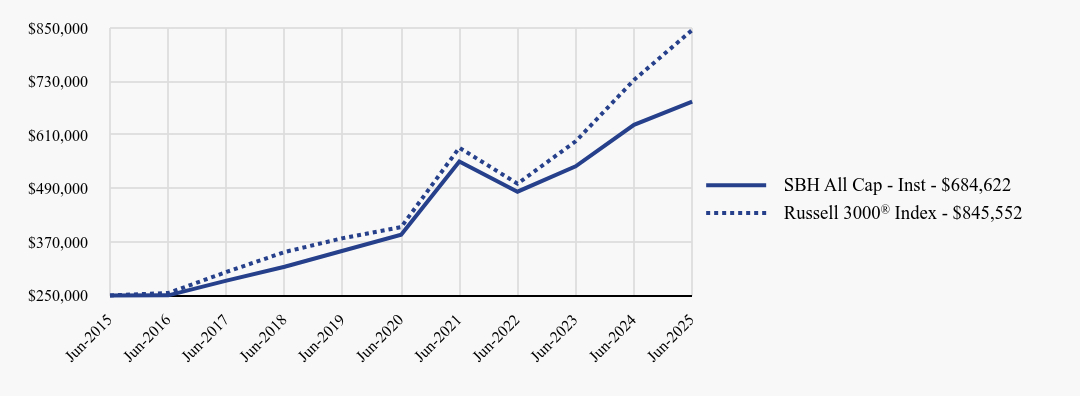
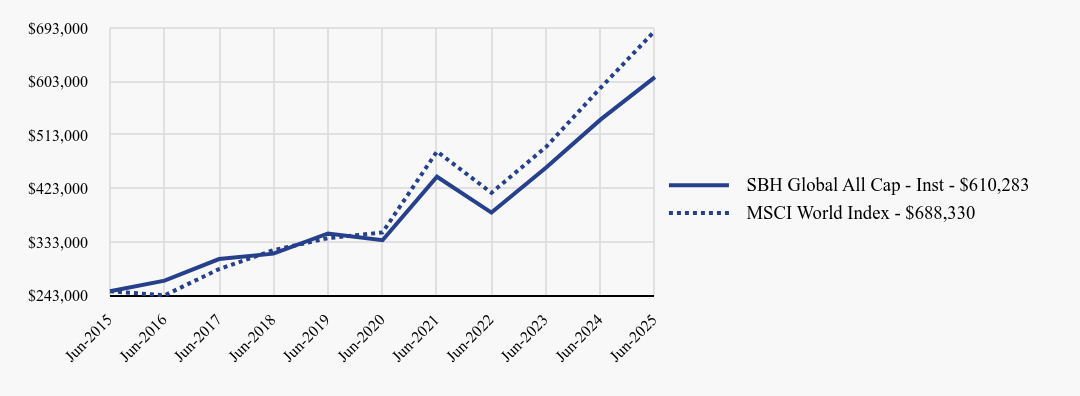
| Factors Affecting Performance [Text Block] |
How did the Fund perform during the reporting period? Fund Performance For the first six months of 2025, the institutional class of the Fund returned 2.46% against a return of 5.75% for the Fund’s broad-based securities market index, the Russell 3000® Index. Contributors to Return The three sectors that contributed most to the Fund’s returns on an absolute basis were Industrials, Financials, and Information Technology. A recovery in data-center-related companies, along with continued strong performance in aerospace and defense stocks, drove Industrials sector outperformance. The three individual securities that contributed the most on an absolute basis were ATI, Inc., Microsoft Corp., and JPMorgan Chase & Co. For ATI, there has been a growing appreciation for the company’s multi-year opportunity in premium aerospace products, which drove shares to new highs during the period. Detractors from Return The three sectors that detracted most from the Fund’s returns on an absolute basis were Health Care, Consumer Discretionary, and Materials. Underperformance in Health Care was linked to regulatory uncertainties and a rotation away from defensive groups in the market. The three individual securities that detracted the most on an absolute basis were Marvell Technology, Inc., UnitedHealth Group, Inc., and Zebra Technologies Corp. For Marvell Technology, there were new concerns related to the potential share loss on a high-profile, application-specific semiconductor chip with top customer Amazon.com Inc. |
| Line Graph [Table Text Block] |
| SBH All Cap - Inst | Russell 3000® Index |
|---|
Jun-2015 | $250,000 | $250,000 |
|---|
Jun-2016 | $250,177 | $255,346 |
|---|
Jun-2017 | $283,057 | $302,609 |
|---|
Jun-2018 | $314,217 | $347,329 |
|---|
Jun-2019 | $350,260 | $378,528 |
|---|
Jun-2020 | $386,128 | $403,244 |
|---|
Jun-2021 | $550,395 | $581,334 |
|---|
Jun-2022 | $482,716 | $500,729 |
|---|
Jun-2023 | $539,611 | $595,635 |
|---|
Jun-2024 | $632,865 | $733,376 |
|---|
Jun-2025 | $684,622 | $845,552 |
|---|
|
| Average Annual Return [Table Text Block] |
| 1 Year | 5 Years | 10 Years |
|---|
SBH All Cap - Inst | 8.18% | 12.14% | 10.60% |
|---|
Russell 3000® Index | 15.30% | 15.96% | 12.96% |
|---|
|
| AssetsNet |
$ 93,732,613
|
| Holdings Count | Holding |
54
|
| Advisory Fees Paid, Amount |
$ 248,436
|
| InvestmentCompanyPortfolioTurnover |
20.00%
|
| Additional Fund Statistics [Text Block] |
Net Assets | $93,732,613 |
|---|
Number of Portfolio Holdings | 54 |
|---|
Portfolio Turnover | 20% |
|---|
Total Advisory Fees Paid* | $248,436 |
|---|
Total Advisory Fees Paid %* | 0.52% |
|---|
* Net of expenses waived by investment adviser |
| Holdings [Text Block] |
Sector Weighting (% of net assets)Value | Value |
|---|
Information Technology | 28.9% | Financials | 16.2% | Industrials | 13.5% | Consumer Discretionary | 12.5% | Health Care | 11.2% | Communication Services | 6.4% | Consumer Staples | 3.8% | Energy | 3.2% | Real Estate | 1.4% | Materials | 1.3% |
Country Weighting (% of net assets)Value | Value |
|---|
United States | 91.6% | Germany | 2.2% | Ireland | 1.8% | Canada | 1.6% | United Kingdom | 1.2% |
|
| Largest Holdings [Text Block] |
Top 10 Holdings (% of net assets)Holding Name | % of Net Assets |
|---|
Microsoft Corp. | 4.8% |
|---|
JPMorgan Chase & Co. | 3.5% |
|---|
Alphabet, Inc. | 3.3% |
|---|
Visa, Inc. | 3.2% |
|---|
Amazon.com, Inc. | 3.2% |
|---|
Meta Platforms, Inc. | 3.1% |
|---|
ServiceNow, Inc. | 2.6% |
|---|
Globe Life, Inc. | 2.5% |
|---|
Quanta Services, Inc. | 2.5% |
|---|
Reinsurance Group of America, Inc. | 2.5% |
|---|
|
| Material Fund Change [Text Block] |
This is a summary of certain changes to the Fund since January 1, 2025. For more complete information, you may review the Fund’s current prospectus, as supplemented, at www.cisbh.com/funds or upon request at (800)392-2673. The parent company of the Fund’s adviser entered into a definitive agreement to take the parent company private, which resulted in a change of control of the adviser. There are no plans to make any changes to the Fund resulting from this transaction. |
| Updated Prospectus Web Address |
www.cisbh.com/funds/literature
|
| C000211583 |
|
| Shareholder Report [Line Items] |
|
| Fund Name |
Segall Bryant & Hamill Emerging Markets Fund
|
| Trading Symbol |
SBHEX
|
| Annual or Semi-Annual Statement [Text Block] |
This semi-annual shareholder report contains important information about Segall Bryant & Hamill Emerging Markets Fund (the "Fund") for the period of January 1, 2025 to June 30, 2025.
|
| Shareholder Report Annual or Semi-Annual |
Semi-Annual Shareholder Report
|
| Additional Information [Text Block] |
You can find additional information about the Fund at www.cisbh.com/funds/literature. You can also request this information by contacting us at (800) 392-2673.
|
| Material Fund Change Notice [Text Block] |
This report describes changes to the Fund that occurred during the fiscal year ending December 31, 2025.
|
| Additional Information Phone Number |
(800) 392-2673
|
| Additional Information Website |
www.cisbh.com/funds/literature
|
| Expenses [Text Block] |
What were the Fund’s annualized costs for the last six months?(based on a hypothetical $10,000 investment) Class Name | Costs of a $10,000 investment | Costs paid as a percentage of a $10,000 investment |
|---|
Retail | $70 | 1.30% |
|---|
|
| Expenses Paid, Amount |
$ 70
|
| Expense Ratio, Percent |
1.30%
|
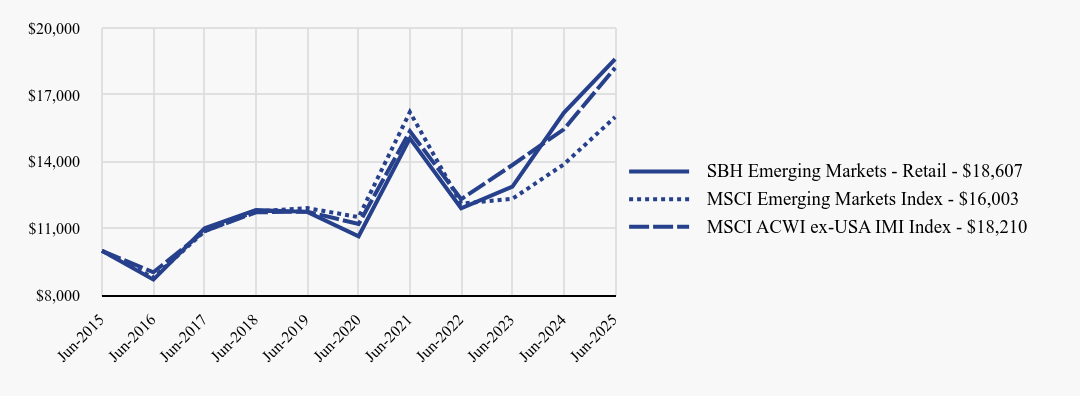
| Factors Affecting Performance [Text Block] |
How did the Fund perform during the reporting period? Fund Performance For the first six months of 2025, the retail class of the Fund returned 16.54% against a return of 15.27% for the MSCI Emerging Markets Index and 17.88% for the Fund’s broad-based securities market index, the MSCI ACWI ex-USA IMI Index. Contributors to Return The three countries that contributed most to the Fund’s returns on an absolute basis were China, South Korea, and Taiwan. China benefitted from positive news on economic data and AI model development as tensions around global trade eased. Korea advanced on hopes that the new elected president will enact capital market and corporate governance reforms. Taiwan rose on strong news for semiconductor companies. Detractors from Return The three countries that detracted most from the Fund’s returns on an absolute basis were Malaysia, Turkey, and Hungary. In Malaysia, earnings from a property development company held by the Fund disappointed. In Turkey, consumer staples had the largest negative impact. |
| Line Graph [Table Text Block] |
| SBH Emerging Markets - Retail | MSCI Emerging Markets Index | MSCI ACWI ex-USA IMI Index |
|---|
Jun-2015 | $10,000 | $10,000 | $10,000 |
|---|
Jun-2016 | $8,708 | $8,795 | $9,039 |
|---|
Jun-2017 | $11,011 | $10,883 | $10,886 |
|---|
Jun-2018 | $11,837 | $11,775 | $11,729 |
|---|
Jun-2019 | $11,749 | $11,918 | $11,759 |
|---|
Jun-2020 | $10,654 | $11,514 | $11,202 |
|---|
Jun-2021 | $15,044 | $16,224 | $15,367 |
|---|
Jun-2022 | $11,912 | $12,121 | $12,316 |
|---|
Jun-2023 | $12,883 | $12,334 | $13,852 |
|---|
Jun-2024 | $16,194 | $13,881 | $15,455 |
|---|
Jun-2025 | $18,607 | $16,003 | $18,210 |
|---|
|
| Average Annual Return [Table Text Block] |
| 1 Year | 5 Years | 10 Years |
|---|
SBH Emerging Markets - Retail | 14.90% | 11.80% | 6.41% |
|---|
MSCI Emerging Markets Index | 15.29% | 6.81% | 4.81% |
|---|
MSCI ACWI ex-USA IMI Index | 17.83% | 10.20% | 6.18% |
|---|
|
| AssetsNet |
$ 73,545,215
|
| Holdings Count | Holding |
461
|
| Advisory Fees Paid, Amount |
$ 98,979
|
| InvestmentCompanyPortfolioTurnover |
38.00%
|
| Additional Fund Statistics [Text Block] |
Net Assets | $73,545,215 |
|---|
Number of Portfolio Holdings | 461 |
|---|
Portfolio Turnover | 38% |
|---|
Total Advisory Fees Paid* | $98,979 |
|---|
Total Advisory Fees Paid %* | 0.30% |
|---|
* Net of expenses waived by investment adviser |
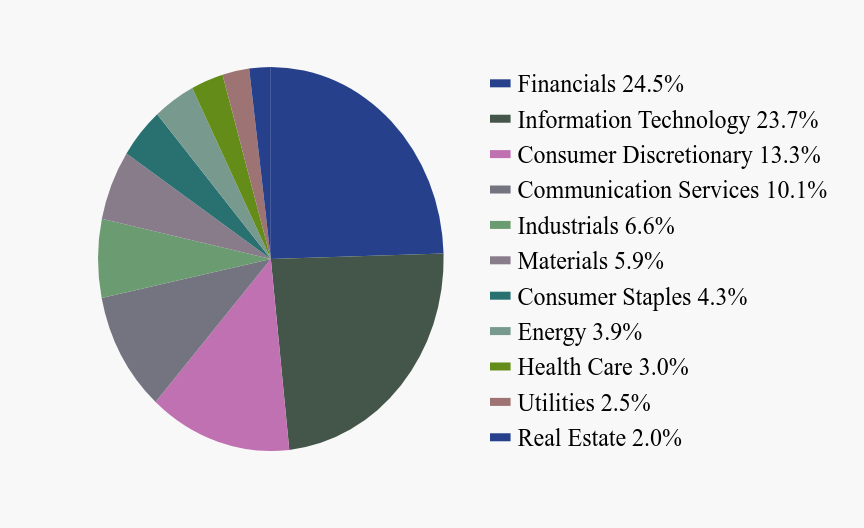
| Holdings [Text Block] |
Sector Weighting (% of net assets)Value | Value |
|---|
Financials | 24.5% | Information Technology | 23.7% | Consumer Discretionary | 13.3% | Communication Services | 10.1% | Industrials | 6.6% | Materials | 5.9% | Consumer Staples | 4.3% | Energy | 3.9% | Health Care | 3.0% | Utilities | 2.5% | Real Estate | 2.0% |
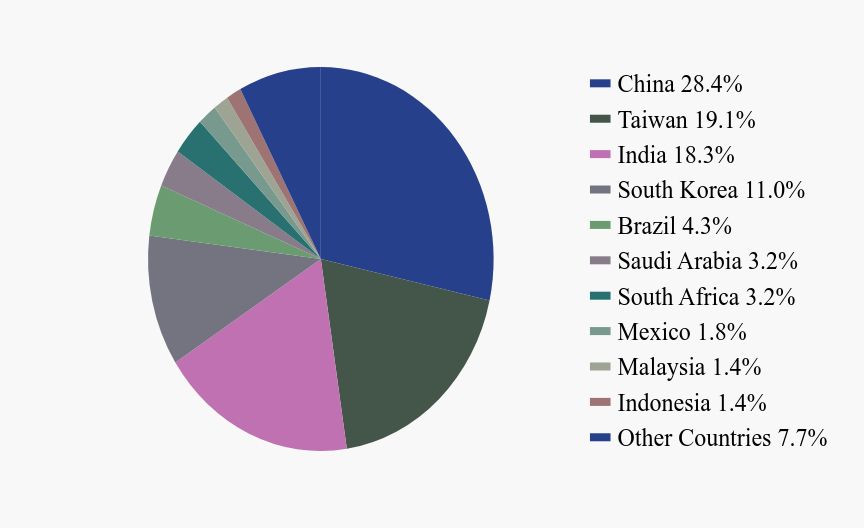
Country Weighting (% of net assets)Value | Value |
|---|
China | 28.4% | Taiwan | 19.1% | India | 18.3% | South Korea | 11.0% | Brazil | 4.3% | Saudi Arabia | 3.2% | South Africa | 3.2% | Mexico | 1.8% | Malaysia | 1.4% | Indonesia | 1.4% | Other Countries | 7.7% |
|
| Largest Holdings [Text Block] |
Top 10 Holdings (% of net assets)Holding Name | % of Net Assets |
|---|
Taiwan Semiconductor Manufacturing Co., Ltd. | 9.9% |
|---|
Tencent Holdings, Ltd. | 4.1% |
|---|
Alibaba Group Holding, Ltd. | 2.3% |
|---|
SK Hynix, Inc. | 2.2% |
|---|
Samsung Electronics Co., Ltd. | 1.4% |
|---|
Bank of China, Ltd. | 1.2% |
|---|
China Construction Bank Corp. | 1.2% |
|---|
CTBC Financial Holding Co., Ltd. | 1.2% |
|---|
Infosys, Ltd. | 1.2% |
|---|
Gree Electric Appliances, Inc. of Zhuhai | 1.0% |
|---|
|
| Material Fund Change [Text Block] |
This is a summary of certain changes to the Fund since January 1, 2025. For more complete information, you may review the Fund’s current prospectus, as supplemented, at www.cisbh.com/funds or upon request at (800)392-2673. The parent company of the Fund’s adviser entered into a definitive agreement to take the parent company private, which resulted in a change of control of the adviser. There are no plans to make any changes to the Fund resulting from this transaction. Effective May 1, 2025, the expense cap for the Retail Class of the Fund was reduced to 1.14%. |
| Updated Prospectus Web Address |
www.cisbh.com/funds/literature
|
| C000211584 |
|
| Shareholder Report [Line Items] |
|
| Fund Name |
Segall Bryant & Hamill Emerging Markets Fund
|
| Trading Symbol |
SBEMX
|
| Annual or Semi-Annual Statement [Text Block] |
This semi-annual shareholder report contains important information about Segall Bryant & Hamill Emerging Markets Fund (the "Fund") for the period of January 1, 2025 to June 30, 2025.
|
| Shareholder Report Annual or Semi-Annual |
Semi-Annual Shareholder Report
|
| Additional Information [Text Block] |
You can find additional information about the Fund at www.cisbh.com/funds/literature. You can also request this information by contacting us at (800) 392-2673.
|
| Material Fund Change Notice [Text Block] |
This report describes changes to the Fund that occurred during the fiscal year ending December 31, 2025.
|
| Additional Information Phone Number |
(800) 392-2673
|
| Additional Information Website |
www.cisbh.com/funds/literature
|
| Expenses [Text Block] |
What were the Fund’s annualized costs for the last six months?(based on a hypothetical $10,000 investment) Class Name | Costs of a $10,000 investment | Costs paid as a percentage of a $10,000 investment |
|---|
Institutional | $62 | 1.15% |
|---|
|
| Expenses Paid, Amount |
$ 62
|
| Expense Ratio, Percent |
1.15%
|
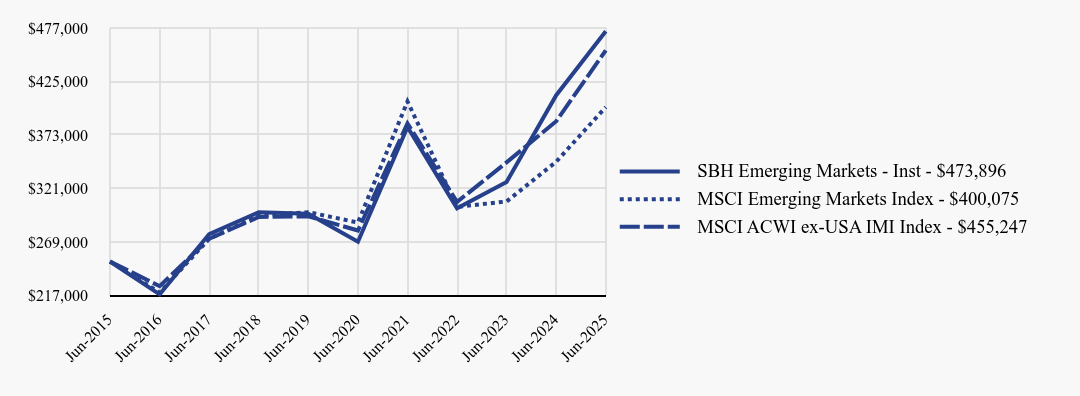
| Factors Affecting Performance [Text Block] |
How did the Fund perform during the reporting period? Fund Performance For the first six months of 2025, the institutional class of the Fund returned 16.59% against a return of 15.27% for the MSCI Emerging Markets Index and 17.88% for the Fund’s broad-based securities market index, the MSCI ACWI ex-USA IMI Index. Contributors to Return The three countries that contributed most to the Fund’s returns on an absolute basis were China, South Korea, and Taiwan. China benefitted from positive news on economic data and AI model development as tensions around global trade eased. Korea advanced on hopes that the new elected president will enact capital market and corporate governance reforms. Taiwan rose on strong news for semiconductor companies. Detractors from Return The three countries that detracted most from the Fund’s returns on an absolute basis were Malaysia, Turkey, and Hungary. In Malaysia, earnings from a property development company held by the Fund disappointed. In Turkey, consumer staples had the largest negative impact. |
| Line Graph [Table Text Block] |
| SBH Emerging Markets - Inst | MSCI Emerging Markets Index | MSCI ACWI ex-USA IMI Index |
|---|
Jun-2015 | $250,000 | $250,000 | $250,000 |
|---|
Jun-2016 | $217,981 | $219,863 | $225,968 |
|---|
Jun-2017 | $276,632 | $272,069 | $272,141 |
|---|
Jun-2018 | $297,889 | $294,386 | $293,220 |
|---|
Jun-2019 | $296,374 | $297,942 | $293,985 |
|---|
Jun-2020 | $269,178 | $287,848 | $280,062 |
|---|
Jun-2021 | $380,671 | $405,591 | $384,182 |
|---|
Jun-2022 | $301,760 | $303,035 | $307,895 |
|---|
Jun-2023 | $327,266 | $308,339 | $346,289 |
|---|
Jun-2024 | $411,667 | $347,028 | $386,372 |
|---|
Jun-2025 | $473,896 | $400,075 | $455,247 |
|---|
|
| Average Annual Return [Table Text Block] |
| 1 Year | 5 Years | 10 Years |
|---|
SBH Emerging Markets - Inst | 15.12% | 11.98% | 6.60% |
|---|
MSCI Emerging Markets Index | 15.29% | 6.81% | 4.81% |
|---|
MSCI ACWI ex-USA IMI Index | 17.83% | 10.20% | 6.18% |
|---|
|
| AssetsNet |
$ 73,545,215
|
| Holdings Count | Holding |
461
|
| Advisory Fees Paid, Amount |
$ 98,979
|
| InvestmentCompanyPortfolioTurnover |
38.00%
|
| Additional Fund Statistics [Text Block] |
Net Assets | $73,545,215 |
|---|
Number of Portfolio Holdings | 461 |
|---|
Portfolio Turnover | 38% |
|---|
Total Advisory Fees Paid* | $98,979 |
|---|
Total Advisory Fees Paid %* | 0.30% |
|---|
* Net of expenses waived by investment adviser |
| Holdings [Text Block] |
Sector Weighting (% of net assets)Value | Value |
|---|
Financials | 24.5% | Information Technology | 23.7% | Consumer Discretionary | 13.3% | Communication Services | 10.1% | Industrials | 6.6% | Materials | 5.9% | Consumer Staples | 4.3% | Energy | 3.9% | Health Care | 3.0% | Utilities | 2.5% | Real Estate | 2.0% |
Country Weighting (% of net assets)Value | Value |
|---|
China | 28.4% | Taiwan | 19.1% | India | 18.3% | South Korea | 11.0% | Brazil | 4.3% | Saudi Arabia | 3.2% | South Africa | 3.2% | Mexico | 1.8% | Malaysia | 1.4% | Indonesia | 1.4% | Other Countries | 7.7% |
|
| Largest Holdings [Text Block] |
Top 10 Holdings (% of net assets)Holding Name | % of Net Assets |
|---|
Taiwan Semiconductor Manufacturing Co., Ltd. | 9.9% |
|---|
Tencent Holdings, Ltd. | 4.1% |
|---|
Alibaba Group Holding, Ltd. | 2.3% |
|---|
SK Hynix, Inc. | 2.2% |
|---|
Samsung Electronics Co., Ltd. | 1.4% |
|---|
Bank of China, Ltd. | 1.2% |
|---|
China Construction Bank Corp. | 1.2% |
|---|
CTBC Financial Holding Co., Ltd. | 1.2% |
|---|
Infosys, Ltd. | 1.2% |
|---|
Gree Electric Appliances, Inc. of Zhuhai | 1.0% |
|---|
|
| Material Fund Change [Text Block] |
This is a summary of certain changes to the Fund since January 1, 2025. For more complete information, you may review the Fund’s current prospectus, as supplemented, at www.cisbh.com/funds or upon request at (800)392-2673. The parent company of the Fund’s adviser entered into a definitive agreement to take the parent company private, which resulted in a change of control of the adviser. There are no plans to make any changes to the Fund resulting from this transaction. Effective May 1, 2025, the expense cap for the Institutional Class of the Fund was reduced to 0.99%. |
| Updated Prospectus Web Address |
www.cisbh.com/funds/literature
|
| C000211585 |
|
| Shareholder Report [Line Items] |
|
| Fund Name |
Segall Bryant & Hamill International Small Cap Fund
|
| Trading Symbol |
SBHSX
|
| Annual or Semi-Annual Statement [Text Block] |
This semi-annual shareholder report contains important information about Segall Bryant & Hamill International Small Cap Fund (the "Fund") for the period of January 1, 2025 to June 30, 2025.
|
| Shareholder Report Annual or Semi-Annual |
Semi-Annual Shareholder Report
|
| Additional Information [Text Block] |
You can find additional information about the Fund at www.cisbh.com/funds/literature. You can also request this information by contacting us at (800) 392-2673.
|
| Material Fund Change Notice [Text Block] |
This report describes changes to the Fund that occurred during the fiscal year ending December 31, 2025.
|
| Additional Information Phone Number |
(800) 392-2673
|
| Additional Information Website |
www.cisbh.com/funds/literature
|
| Expenses [Text Block] |
What were the Fund’s annualized costs for the last six months?(based on a hypothetical $10,000 investment) Class Name | Costs of a $10,000 investment | Costs paid as a percentage of a $10,000 investment |
|---|
Retail | $66 | 1.17% |
|---|
|
| Expenses Paid, Amount |
$ 66
|
| Expense Ratio, Percent |
1.17%
|
| Factors Affecting Performance [Text Block] |
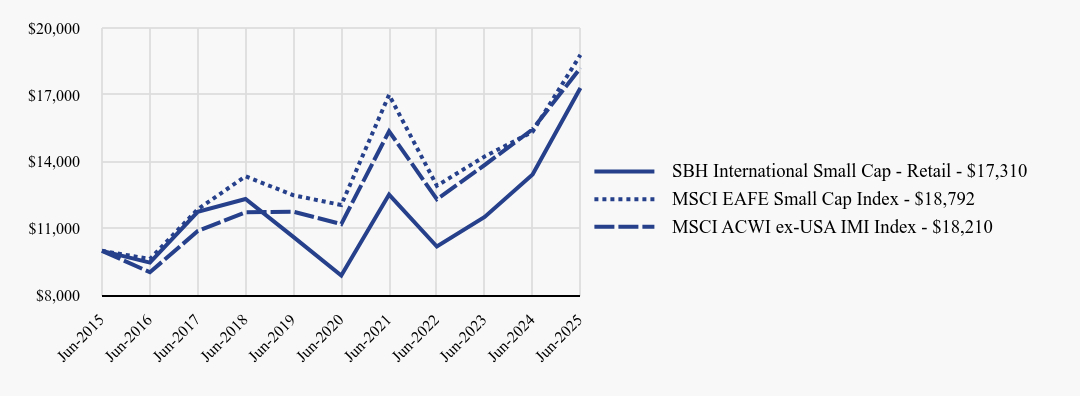
How did the Fund perform during the reporting period? Fund Performance For the first six months of 2025, the retail class of the Fund returned 27.05% against a return of 20.89% for the MSCI EAFE Small Cap Index and 17.88% for the Fund’s broad-based securities market index, the MSCI ACWI ex-USA IMI Index. Contributors to Return The three countries that contributed most to the Fund’s returns on an absolute basis were Japan, the U.K., and Germany. Japan ended the period higher as U.S.-Japan trade talks continued and investors benefitted from higher dividend payouts and share buybacks. Germany announced plans to increase defense and infrastructure spending on concerns the U.S. will withdraw support for Europe’s defenses, which benefitted local companies. The U.K. rose on the announcement of a U.S.-U.K. trade deal. Detractors from Return Hong Kong was the only country that detracted from the Fund’s returns on an absolute basis as earnings for consumer discretionary companies declined under the impact of increasing tariffs. |
| Line Graph [Table Text Block] |
| SBH International Small Cap - Retail | MSCI EAFE Small Cap Index | MSCI ACWI ex-USA IMI Index |
|---|
Jun-2015 | $10,000 | $10,000 | $10,000 |
|---|
Jun-2016 | $9,471 | $9,633 | $9,039 |
|---|
Jun-2017 | $11,747 | $11,866 | $10,886 |
|---|
Jun-2018 | $12,326 | $13,343 | $11,729 |
|---|
Jun-2019 | $10,627 | $12,496 | $11,759 |
|---|
Jun-2020 | $8,891 | $12,057 | $11,202 |
|---|
Jun-2021 | $12,524 | $16,998 | $15,367 |
|---|
Jun-2022 | $10,193 | $12,922 | $12,316 |
|---|
Jun-2023 | $11,524 | $14,237 | $13,852 |
|---|
Jun-2024 | $13,427 | $15,345 | $15,455 |
|---|
Jun-2025 | $17,310 | $18,792 | $18,210 |
|---|
|
| Average Annual Return [Table Text Block] |
| 1 Year | 5 Years | 10 Years |
|---|
SBH International Small Cap - Retail | 28.92% | 14.25% | 5.64% |
|---|
MSCI EAFE Small Cap Index | 22.46% | 9.28% | 6.51% |
|---|
MSCI ACWI ex-USA IMI Index | 17.83% | 10.20% | 6.18% |
|---|
|
| AssetsNet |
$ 85,751,608
|
| Holdings Count | Holding |
317
|
| Advisory Fees Paid, Amount |
$ 180,166
|
| InvestmentCompanyPortfolioTurnover |
53.00%
|
| Additional Fund Statistics [Text Block] |
Net Assets | $85,751,608 |
|---|
Number of Portfolio Holdings | 317 |
|---|
Portfolio Turnover | 53% |
|---|
Total Advisory Fees Paid* | $180,166 |
|---|
Total Advisory Fees Paid %* | 0.48% |
|---|
* Net of expenses waived by investment adviser |
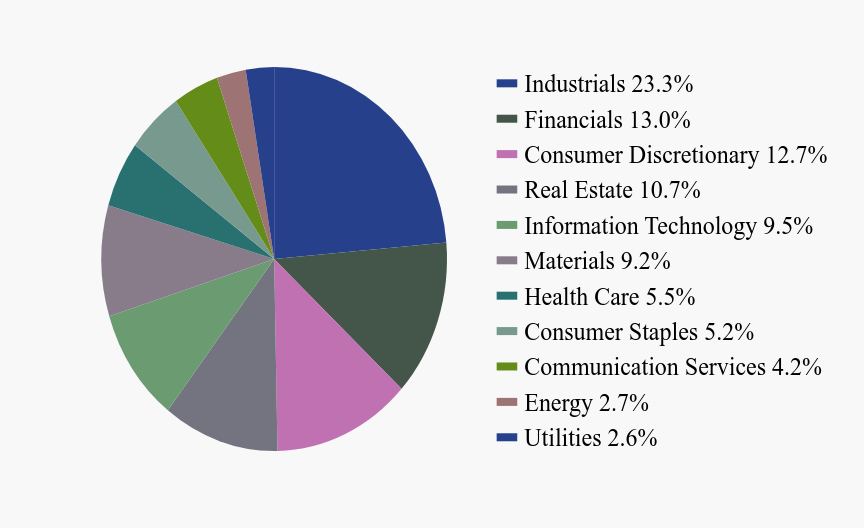
| Holdings [Text Block] |
Sector Weighting (% of net assets)Value | Value |
|---|
Industrials | 23.3% | Financials | 13.0% | Consumer Discretionary | 12.7% | Real Estate | 10.7% | Information Technology | 9.5% | Materials | 9.2% | Health Care | 5.5% | Consumer Staples | 5.2% | Communication Services | 4.2% | Energy | 2.7% | Utilities | 2.6% |
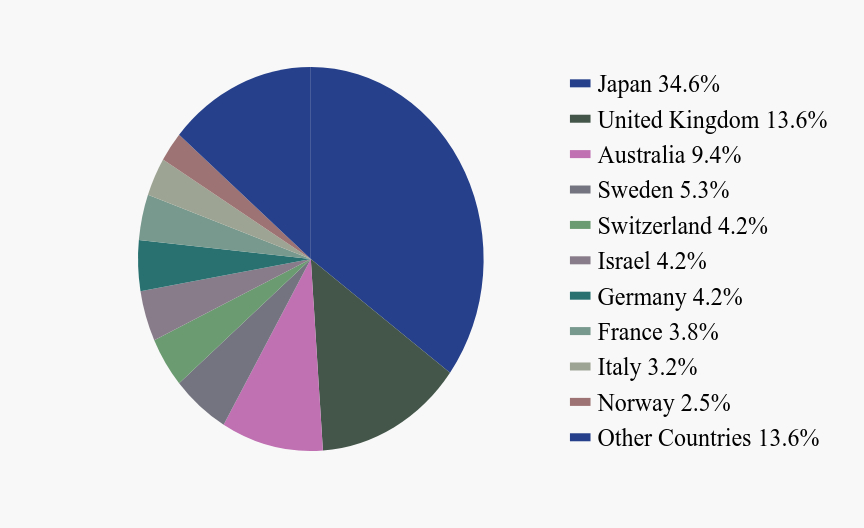
Country Weighting (% of net assets)Value | Value |
|---|
Japan | 34.6% | United Kingdom | 13.6% | Australia | 9.4% | Sweden | 5.3% | Switzerland | 4.2% | Israel | 4.2% | Germany | 4.2% | France | 3.8% | Italy | 3.2% | Norway | 2.5% | Other Countries | 13.6% |
|
| Largest Holdings [Text Block] |
Top 10 Holdings (% of net assets)Holding Name | % of Net Assets |
|---|
Bank of Georgia Group PLC | 1.2% |
|---|
Koninklijke BAM Groep N.V. | 1.2% |
|---|
Implenia A.G. | 1.2% |
|---|
SANKYO Co., Ltd. | 1.1% |
|---|
Betsson A.B. | 1.1% |
|---|
Harel Insurance Investments & Financial Services, Ltd. | 1.1% |
|---|
Currys PLC | 1.0% |
|---|
BPER Banca | 1.0% |
|---|
Kobe Steel, Ltd. | 0.9% |
|---|
Life Corp. | 0.9% |
|---|
|
| Material Fund Change [Text Block] |
This is a summary of certain changes to the Fund since January 1, 2025. For more complete information, you may review the Fund’s current prospectus, as supplemented, at www.cisbh.com/funds or upon request at (800)392-2673. The parent company of the Fund’s adviser entered into a definitive agreement to take the parent company private, which resulted in a change of control of the adviser. There are no plans to make any changes to the Fund resulting from this transaction. |
| Updated Prospectus Web Address |
www.cisbh.com/funds/literature
|
| C000211586 |
|
| Shareholder Report [Line Items] |
|
| Fund Name |
Segall Bryant & Hamill International Small Cap Fund
|
| Trading Symbol |
SBSIX
|
| Annual or Semi-Annual Statement [Text Block] |
This semi-annual shareholder report contains important information about Segall Bryant & Hamill International Small Cap Fund (the "Fund") for the period of January 1, 2025 to June 30, 2025.
|
| Shareholder Report Annual or Semi-Annual |
Semi-Annual Shareholder Report
|
| Additional Information [Text Block] |
You can find additional information about the Fund at www.cisbh.com/funds/literature. You can also request this information by contacting us at (800) 392-2673.
|
| Material Fund Change Notice [Text Block] |
This report describes changes to the Fund that occurred during the fiscal year ending December 31, 2025.
|
| Additional Information Phone Number |
(800) 392-2673
|
| Additional Information Website |
www.cisbh.com/funds/literature
|
| Expenses [Text Block] |
What were the Fund’s annualized costs for the last six months?(based on a hypothetical $10,000 investment) Class Name | Costs of a $10,000 investment | Costs paid as a percentage of a $10,000 investment |
|---|
Institutional | $59 | 1.05% |
|---|
|
| Expenses Paid, Amount |
$ 59
|
| Expense Ratio, Percent |
1.05%
|
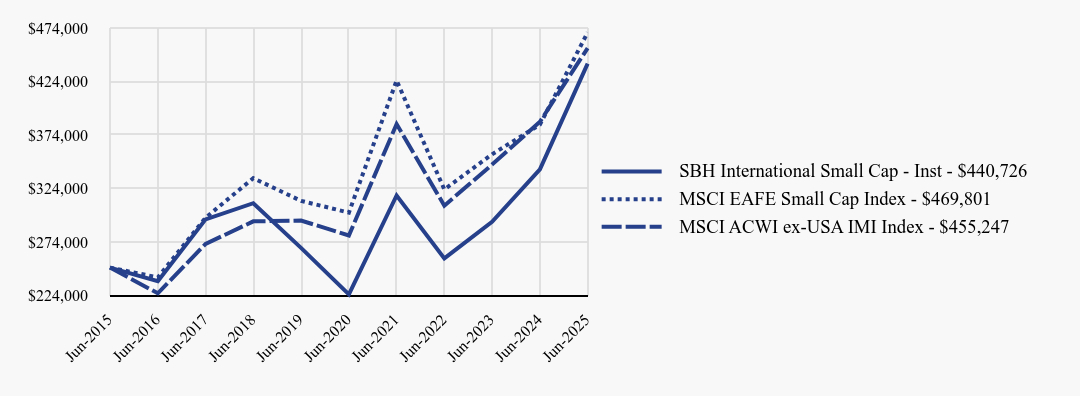
| Factors Affecting Performance [Text Block] |
How did the Fund perform during the reporting period? Fund Performance For the first six months of 2025, the institutional class of the Fund returned 27.10% against a return of 20.89% for the MSCI EAFE Small Cap Index and 17.88% for the Fund’s broad-based securities market index, the MSCI ACWI ex-USA IMI Index. Contributors to Return The three countries that contributed most to the Fund’s returns on an absolute basis were Japan, the U.K., and Germany. Japan ended the period higher as U.S.-Japan trade talks continued and investors benefitted from higher dividend payouts and share buybacks. Germany announced plans to increase defense and infrastructure spending on concerns the U.S. will withdraw support for Europe’s defenses, which benefitted local companies. The U.K. rose on the announcement of a U.S.-U.K. trade deal. Detractors from Return Hong Kong was the only country that detracted from the Fund’s returns on an absolute basis as earnings for consumer discretionary companies declined under the impact of increasing tariffs. |
| Line Graph [Table Text Block] |
| SBH International Small Cap - Inst | MSCI EAFE Small Cap Index | MSCI ACWI ex-USA IMI Index |
|---|
Jun-2015 | $250,000 | $250,000 | $250,000 |
|---|
Jun-2016 | $237,209 | $240,829 | $225,968 |
|---|
Jun-2017 | $295,061 | $296,649 | $272,141 |
|---|
Jun-2018 | $310,211 | $333,578 | $293,220 |
|---|
Jun-2019 | $268,399 | $312,409 | $293,985 |
|---|
Jun-2020 | $224,963 | $301,413 | $280,062 |
|---|
Jun-2021 | $317,445 | $424,940 | $384,182 |
|---|
Jun-2022 | $258,600 | $323,049 | $307,895 |
|---|
Jun-2023 | $292,815 | $355,920 | $346,289 |
|---|
Jun-2024 | $341,842 | $383,626 | $386,372 |
|---|
Jun-2025 | $440,726 | $469,801 | $455,247 |
|---|
|
| Average Annual Return [Table Text Block] |
| 1 Year | 5 Years | 10 Years |
|---|
SBH International Small Cap - Inst | 28.93% | 14.40% | 5.83% |
|---|
MSCI EAFE Small Cap Index | 22.46% | 9.28% | 6.51% |
|---|
MSCI ACWI ex-USA IMI Index | 17.83% | 10.20% | 6.18% |
|---|
|
| AssetsNet |
$ 85,751,608
|
| Holdings Count | Holding |
317
|
| Advisory Fees Paid, Amount |
$ 180,166
|
| InvestmentCompanyPortfolioTurnover |
53.00%
|
| Additional Fund Statistics [Text Block] |
Net Assets | $85,751,608 |
|---|
Number of Portfolio Holdings | 317 |
|---|
Portfolio Turnover | 53% |
|---|
Total Advisory Fees Paid* | $180,166 |
|---|
Total Advisory Fees Paid %* | 0.48% |
|---|
* Net of expenses waived by investment adviser |
| Holdings [Text Block] |
Sector Weighting (% of net assets)Value | Value |
|---|
Industrials | 23.3% | Financials | 13.0% | Consumer Discretionary | 12.7% | Real Estate | 10.7% | Information Technology | 9.5% | Materials | 9.2% | Health Care | 5.5% | Consumer Staples | 5.2% | Communication Services | 4.2% | Energy | 2.7% | Utilities | 2.6% |
Country Weighting (% of net assets)Value | Value |
|---|
Japan | 34.6% | United Kingdom | 13.6% | Australia | 9.4% | Sweden | 5.3% | Switzerland | 4.2% | Israel | 4.2% | Germany | 4.2% | France | 3.8% | Italy | 3.2% | Norway | 2.5% | Other Countries | 13.6% |
|
| Largest Holdings [Text Block] |
Top 10 Holdings (% of net assets)Holding Name | % of Net Assets |
|---|
Bank of Georgia Group PLC | 1.2% |
|---|
Koninklijke BAM Groep N.V. | 1.2% |
|---|
Implenia A.G. | 1.2% |
|---|
SANKYO Co., Ltd. | 1.1% |
|---|
Betsson A.B. | 1.1% |
|---|
Harel Insurance Investments & Financial Services, Ltd. | 1.1% |
|---|
Currys PLC | 1.0% |
|---|
BPER Banca | 1.0% |
|---|
Kobe Steel, Ltd. | 0.9% |
|---|
Life Corp. | 0.9% |
|---|
|
| Material Fund Change [Text Block] |
This is a summary of certain changes to the Fund since January 1, 2025. For more complete information, you may review the Fund’s current prospectus, as supplemented, at www.cisbh.com/funds or upon request at (800)392-2673. The parent company of the Fund’s adviser entered into a definitive agreement to take the parent company private, which resulted in a change of control of the adviser. There are no plans to make any changes to the Fund resulting from this transaction. |
| Updated Prospectus Web Address |
www.cisbh.com/funds/literature
|
| C000246766 |
|
| Shareholder Report [Line Items] |
|
| Fund Name |
Segall Bryant & Hamill International Equity Fund
|
| Trading Symbol |
CIQRX
|
| Annual or Semi-Annual Statement [Text Block] |
This semi-annual shareholder report contains important information about Segall Bryant & Hamill International Equity Fund (the "Fund") for the period of January 1, 2025 to June 30, 2025.
|
| Shareholder Report Annual or Semi-Annual |
Semi-Annual Shareholder Report
|
| Additional Information [Text Block] |
You can find additional information about the Fund at www.cisbh.com/funds/literature. You can also request this information by contacting us at (800) 392-2673.
|
| Material Fund Change Notice [Text Block] |
This report describes changes to the Fund that occurred during the fiscal year ending December 31, 2025.
|
| Additional Information Phone Number |
(800) 392-2673
|
| Additional Information Website |
www.cisbh.com/funds/literature
|
| Expenses [Text Block] |
What were the Fund’s annualized costs for the last six months?(based on a hypothetical $10,000 investment) Class Name | Costs of a $10,000 investment | Costs paid as a percentage of a $10,000 investment |
|---|
Retail | $61 | 1.09% |
|---|
|
| Expenses Paid, Amount |
$ 61
|
| Expense Ratio, Percent |
1.09%
|
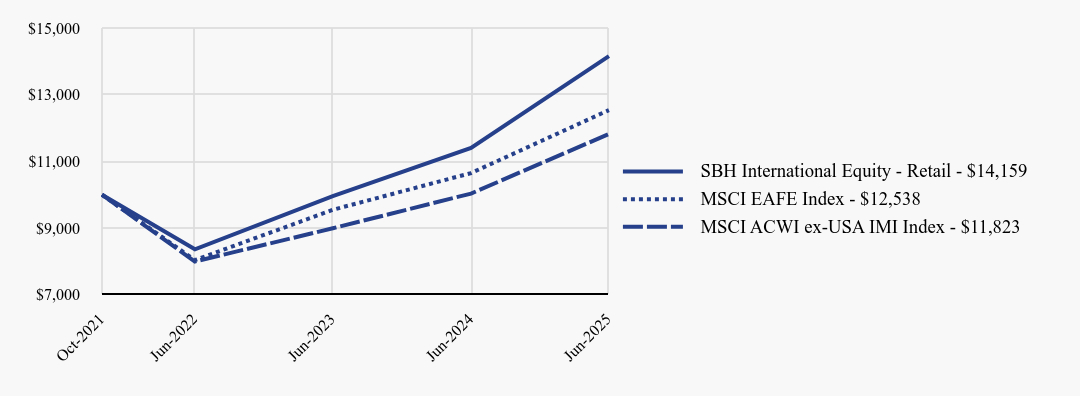
| Factors Affecting Performance [Text Block] |
How did the Fund perform during the reporting period? Fund Performance For the first six months of 2025, the retail class of the Fund returned 24.63% against a return of 19.45% for the MSCI EAFE Index and 17.88% for the Fund’s broad-based securities market index, the MSCI ACWI ex-USA IMI Index. Contributors to Return The three countries that contributed most to the Fund’s returns on an absolute basis were France, the U.K., and Germany. Concerns that the U.S. will withdraw support for Europe’s defenses convinced local governments to increase defense and infrastructure spending, which benefitted the local markets. Industrials and Materials rose in the three countries and were significant drivers of returns. The U.K. was further aided by the announcement of a trade deal with the U.S. Detractors from Return Since all countries were positive for the period, no countries contributed negatively to absolute return. |
| Line Graph [Table Text Block] |
| SBH International Equity - Retail | MSCI EAFE Index | MSCI ACWI ex-USA IMI Index |
|---|
Oct-2021 | $10,000 | $10,000 | $10,000 |
|---|
Jun-2022 | $8,364 | $8,039 | $7,997 |
|---|
Jun-2023 | $9,957 | $9,549 | $8,994 |
|---|
Jun-2024 | $11,403 | $10,650 | $10,035 |
|---|
Jun-2025 | $14,159 | $12,538 | $11,823 |
|---|
|
| Average Annual Return [Table Text Block] |
| 1 Year | Since Inception (10/27/2021) |
|---|
SBH International Equity - Retail | 24.18% | 9.93% |
|---|
MSCI EAFE Index | 17.73% | 6.35% |
|---|
MSCI ACWI ex-USA IMI Index | 17.83% | 4.66% |
|---|
|
| Performance Inception Date |
Oct. 27, 2021
|
| AssetsNet |
$ 9,576,188
|
| Holdings Count | Holding |
384
|
| Advisory Fees Paid, Amount |
$ 0
|
| InvestmentCompanyPortfolioTurnover |
43.00%
|
| Additional Fund Statistics [Text Block] |
Net Assets | $9,576,188 |
|---|
Number of Portfolio Holdings | 384 |
|---|
Portfolio Turnover | 43% |
|---|
Total Advisory Fees Paid* | $0 |
|---|
Total Advisory Fees Paid %* | 0.00% |
|---|
* Net of expenses waived by investment adviser |
| Holdings [Text Block] |
What did the Fund invest in? Sector Weighting (% of net assets)Value | Value |
|---|
Financials | 22.9% | Industrials | 18.8% | Health Care | 11.4% | Consumer Discretionary | 9.6% | Information Technology | 8.4% | Consumer Staples | 7.7% | Materials | 5.4% | Communication Services | 5.4% | Utilities | 3.8% | Energy | 2.8% | Real Estate | 2.2% |
Country Weighting (% of net assets)Value | Value |
|---|
Japan | 21.5% | United Kingdom | 14.4% | France | 11.8% | Germany | 10.4% | Switzerland | 9.0% | Australia | 6.6% | Netherlands | 4.2% | Sweden | 4.2% | Italy | 3.2% | Spain | 3.1% | Other Countries | 10.0% |
|
| Largest Holdings [Text Block] |
Top 10 Holdings (% of net assets)Holding Name | % of Net Assets |
|---|
Roche Holding A.G. | 1.7% |
|---|
Novartis A.G. | 1.7% |
|---|
GSK PLC | 1.4% |
|---|
Vinci S.A. | 1.3% |
|---|
ITOCHU Corp. | 1.3% |
|---|
Infineon Technologies A.G. | 1.3% |
|---|
NatWest Group PLC | 1.3% |
|---|
KDDI Corp. | 1.3% |
|---|
ANZ Group Holdings, Ltd. | 1.3% |
|---|
Deutsche Bank A.G. | 1.2% |
|---|
|
| Material Fund Change [Text Block] |
This is a summary of certain changes to the Fund since January 1, 2025. For more complete information, you may review the Fund’s current prospectus, as supplemented, at www.cisbh.com/funds or upon request at (800)392-2673. The parent company of the Fund’s adviser entered into a definitive agreement to take the parent company private, which resulted in a change of control of the adviser. There are no plans to make any changes to the Fund resulting from this transaction. Effective May 1, 2025, the expense cap for the Retail Class of the Fund was reduced to 0.99%. |
| Updated Prospectus Web Address |
www.cisbh.com/funds/literature
|
| C000246765 |
|
| Shareholder Report [Line Items] |
|
| Fund Name |
Segall Bryant & Hamill International Equity Fund
|
| Trading Symbol |
CIEQX
|
| Annual or Semi-Annual Statement [Text Block] |
This semi-annual shareholder report contains important information about Segall Bryant & Hamill International Equity Fund (the "Fund") for the period of January 1, 2025 to June 30, 2025.
|
| Shareholder Report Annual or Semi-Annual |
Semi-Annual Shareholder Report
|
| Additional Information [Text Block] |
You can find additional information about the Fund at www.cisbh.com/funds/literature. You can also request this information by contacting us at (800) 392-2673.
|
| Material Fund Change Notice [Text Block] |
This report describes changes to the Fund that occurred during the fiscal year ending December 31, 2025.
|
| Additional Information Phone Number |
(800) 392-2673
|
| Additional Information Website |
www.cisbh.com/funds/literature
|
| Expenses [Text Block] |
What were the Fund’s annualized costs for the last six months?(based on a hypothetical $10,000 investment) Class Name | Costs of a $10,000 investment | Costs paid as a percentage of a $10,000 investment |
|---|
Institutional | $52 | 0.93% |
|---|
|
| Expenses Paid, Amount |
$ 52
|
| Expense Ratio, Percent |
0.93%
|
| Factors Affecting Performance [Text Block] |
How did the Fund perform during the reporting period? Fund Performance For the first six months of 2025, the institutional class of the Fund returned 24.85% against a return of 19.45% for the MSCI EAFE Index and 17.88% for the Fund’s broad-based securities market index, the MSCI ACWI ex-USA IMI Index. Contributors to Return The three countries that contributed most to the Fund’s returns on an absolute basis were France, the U.K., and Germany. Concerns that the U.S. will withdraw support for Europe’s defenses convinced local governments to increase defense and infrastructure spending, which benefitted the local markets. Industrials and Materials rose in the three countries and were significant drivers of returns. The U.K. was further aided by the announcement of a trade deal with the U.S. Detractors from Return Since all countries were positive for the period, no countries contributed negatively to absolute return. |
| Line Graph [Table Text Block] |
| SBH International Equity - Inst | MSCI EAFE Index | MSCI ACWI ex-USA IMI Index |
|---|
Oct-2021 | $250,000 | $250,000 | $250,000 |
|---|
Jun-2022 | $209,297 | $200,985 | $199,913 |
|---|
Jun-2023 | $249,516 | $238,713 | $224,842 |
|---|
Jun-2024 | $286,198 | $266,253 | $250,867 |
|---|
Jun-2025 | $356,021 | $313,452 | $295,587 |
|---|
|
| Average Annual Return [Table Text Block] |
| 1 Year | Since Inception (10/27/2021) |
|---|
SBH International Equity - Inst | 24.40% | 10.10% |
|---|
MSCI EAFE Index | 17.73% | 6.35% |
|---|
MSCI ACWI ex-USA IMI Index | 17.83% | 4.66% |
|---|
|
| AssetsNet |
$ 9,576,188
|
| Holdings Count | Holding |
384
|
| Advisory Fees Paid, Amount |
$ 0
|
| InvestmentCompanyPortfolioTurnover |
43.00%
|
| Additional Fund Statistics [Text Block] |
Net Assets | $9,576,188 |
|---|
Number of Portfolio Holdings | 384 |
|---|
Portfolio Turnover | 43% |
|---|
Total Advisory Fees Paid* | $0 |
|---|
Total Advisory Fees Paid %* | 0.00% |
|---|
* Net of expenses waived by investment adviser |
| Holdings [Text Block] |
What did the Fund invest in? Sector Weighting (% of net assets)Value | Value |
|---|
Financials | 22.9% | Industrials | 18.8% | Health Care | 11.4% | Consumer Discretionary | 9.6% | Information Technology | 8.4% | Consumer Staples | 7.7% | Materials | 5.4% | Communication Services | 5.4% | Utilities | 3.8% | Energy | 2.8% | Real Estate | 2.2% |
Country Weighting (% of net assets)Value | Value |
|---|
Japan | 21.5% | United Kingdom | 14.4% | France | 11.8% | Germany | 10.4% | Switzerland | 9.0% | Australia | 6.6% | Netherlands | 4.2% | Sweden | 4.2% | Italy | 3.2% | Spain | 3.1% | Other Countries | 10.0% |
|
| Largest Holdings [Text Block] |
Top 10 Holdings (% of net assets)Holding Name | % of Net Assets |
|---|
Roche Holding A.G. | 1.7% |
|---|
Novartis A.G. | 1.7% |
|---|
GSK PLC | 1.4% |
|---|
Vinci S.A. | 1.3% |
|---|
ITOCHU Corp. | 1.3% |
|---|
Infineon Technologies A.G. | 1.3% |
|---|
NatWest Group PLC | 1.3% |
|---|
KDDI Corp. | 1.3% |
|---|
ANZ Group Holdings, Ltd. | 1.3% |
|---|
Deutsche Bank A.G. | 1.2% |
|---|
|
| Material Fund Change [Text Block] |
This is a summary of certain changes to the Fund since January 1, 2025. For more complete information, you may review the Fund’s current prospectus, as supplemented, at www.cisbh.com/funds or upon request at (800)392-2673. The parent company of the Fund’s adviser entered into a definitive agreement to take the parent company private, which resulted in a change of control of the adviser. There are no plans to make any changes to the Fund resulting from this transaction. Effective May 1, 2025, the expense cap for the Institutional Class of the Fund was reduced to 0.84%. |
| Updated Prospectus Web Address |
www.cisbh.com/funds/literature
|
| C000018316 |
|
| Shareholder Report [Line Items] |
|
| Fund Name |
Segall Bryant & Hamill Global All Cap Fund
|
| Trading Symbol |
WTMVX
|
| Annual or Semi-Annual Statement [Text Block] |
This semi-annual shareholder report contains important information about Segall Bryant & Hamill Global All Cap Fund (the "Fund") for the period of January 1, 2025 to June 30, 2025.
|
| Shareholder Report Annual or Semi-Annual |
Semi-Annual Shareholder Report
|
| Additional Information [Text Block] |
You can find additional information about the Fund at www.cisbh.com/funds/literature. You can also request this information by contacting us at (800) 392-2673.
|
| Material Fund Change Notice [Text Block] |
This report describes changes to the Fund that occurred during the fiscal year ending December 31, 2025.
|
| Additional Information Phone Number |
(800) 392-2673
|
| Additional Information Website |
www.cisbh.com/funds/literature
|
| Expenses [Text Block] |
What were the Fund’s annualized costs for the last six months?(based on a hypothetical $10,000 investment) Class Name | Costs of a $10,000 investment | Costs paid as a percentage of a $10,000 investment |
|---|
Retail | $43 | 0.84% |
|---|
|
| Expenses Paid, Amount |
$ 43
|
| Expense Ratio, Percent |
0.84%
|
| Factors Affecting Performance [Text Block] |
How did the Fund perform during the reporting period? Fund Performance For the first six months of 2025, the retail class of the Fund returned 7.39% against a return of 9.47% for the Fund’s broad-based securities market index, the MSCI World Index. Contributors to Return The three sectors that contributed most to the Fund’s returns on an absolute basis were Industrials, Financials, and Consumer Discretionary. A recovery in data-center-related companies, along with continued strong performance in aerospace and defense stocks, drove Industrials sector outperformance. The three individual securities that contributed the most on an absolute basis were Nintendo Co., Ltd., ATI, Inc., and Safran S.A. For Nintendo, outperformance was linked to the successful launch of the next-generation Switch 2 console coupled with strong previews of first-party and third-party games. Detractors from Return The three sectors that detracted most from the Fund’s returns on an absolute basis were Health Care, Consumer Staples, and Utilities. Underperformance in Health Care was linked to regulatory uncertainties and a rotation away from defensive groups in the market. The three individual securities that detracted the most on an absolute basis were Marvell Technology, Inc., UnitedHealth Group, Inc., and Apple, Inc. For Marvell Technology, there were new concerns related to the potential share loss on a high-profile, application-specific semiconductor chip with top customer Amazon.com Inc. |
| Line Graph [Table Text Block] |
| SBH Global All Cap - Retail | MSCI World Index |
|---|
Jun-2015 | $10,000 | $10,000 |
|---|
Jun-2016 | $10,698 | $9,722 |
|---|
Jun-2017 | $12,125 | $11,491 |
|---|
Jun-2018 | $12,475 | $12,765 |
|---|
Jun-2019 | $13,804 | $13,573 |
|---|
Jun-2020 | $13,352 | $13,959 |
|---|
Jun-2021 | $17,558 | $19,409 |
|---|
Jun-2022 | $15,137 | $16,626 |
|---|
Jun-2023 | $18,109 | $19,704 |
|---|
Jun-2024 | $21,281 | $23,683 |
|---|
Jun-2025 | $24,096 | $27,533 |
|---|
|
| Average Annual Return [Table Text Block] |
| 1 Year | 5 Years | 10 Years |
|---|
SBH Global All Cap - Retail | 13.23% | 12.53% | 9.19% |
|---|
MSCI World Index | 16.26% | 14.55% | 10.66% |
|---|
|
| AssetsNet |
$ 35,581,972
|
| Holdings Count | Holding |
56
|
| Advisory Fees Paid, Amount |
$ 15,835
|
| InvestmentCompanyPortfolioTurnover |
13.00%
|
| Additional Fund Statistics [Text Block] |
Net Assets | $35,581,972 |
|---|
Number of Portfolio Holdings | 56 |
|---|
Portfolio Turnover | 13% |
|---|
Total Advisory Fees Paid* | $15,835 |
|---|
Total Advisory Fees Paid %* | 0.09% |
|---|
* Net of expenses waived by investment adviser |
| Holdings [Text Block] |
Sector Weighting (% of net assets)Value | Value |
|---|
Information Technology | 26.1% | Financials | 16.4% | Industrials | 14.9% | Consumer Discretionary | 14.8% | Health Care | 8.3% | Communication Services | 6.3% | Consumer Staples | 5.3% | Energy | 3.2% | Real Estate | 1.5% | Materials | 1.4% |
Country Weighting (% of net assets)Value | Value |
|---|
United States | 59.5% | Canada | 7.1% | United Kingdom | 6.9% | Belgium | 4.5% | France | 4.3% | Germany | 3.1% | Italy | 3.0% | Ireland | 3.0% | Japan | 2.0% | Switzerland | 1.7% | Other Countries | 3.1% |
|
| Largest Holdings [Text Block] |
Top 10 Holdings (% of net assets)Holding Name | % of Net Assets |
|---|
Microsoft Corp. | 4.5% |
|---|
JPMorgan Chase & Co. | 3.3% |
|---|
Constellation Software, Inc. | 2.9% |
|---|
D'ieteren Group | 2.8% |
|---|
Visa, Inc. | 2.8% |
|---|
ServiceNow, Inc. | 2.6% |
|---|
Safran S.A. | 2.5% |
|---|
Beazley PLC | 2.5% |
|---|
Amazon.com, Inc. | 2.3% |
|---|
Meta Platforms, Inc. | 2.2% |
|---|
|
| Material Fund Change [Text Block] |
This is a summary of certain changes to the Fund since January 1, 2025. For more complete information, you may review the Fund’s current prospectus, as supplemented, at www.cisbh.com/funds or upon request at (800)392-2673. The parent company of the Fund’s adviser entered into a definitive agreement to take the parent company private, which resulted in a change of control of the adviser. There are no plans to make any changes to the Fund resulting from this transaction. |
| Updated Prospectus Web Address |
www.cisbh.com/funds/literature
|
| C000052675 |
|
| Shareholder Report [Line Items] |
|
| Fund Name |
Segall Bryant & Hamill Global All Cap Fund
|
| Trading Symbol |
WIMVX
|
| Annual or Semi-Annual Statement [Text Block] |
This semi-annual shareholder report contains important information about Segall Bryant & Hamill Global All Cap Fund (the "Fund") for the period of January 1, 2025 to June 30, 2025.
|
| Shareholder Report Annual or Semi-Annual |
Semi-Annual Shareholder Report
|
| Additional Information [Text Block] |
You can find additional information about the Fund at www.cisbh.com/funds/literature. You can also request this information by contacting us at (800) 392-2673.
|
| Material Fund Change Notice [Text Block] |
This report describes changes to the Fund that occurred during the fiscal year ending December 31, 2025.
|
| Additional Information Phone Number |
(800) 392-2673
|
| Additional Information Website |
www.cisbh.com/funds/literature
|
| Expenses [Text Block] |
What were the Fund’s annualized costs for the last six months?(based on a hypothetical $10,000 investment) Class Name | Costs of a $10,000 investment | Costs paid as a percentage of a $10,000 investment |
|---|
Institutional | $40 | 0.77% |
|---|
|
| Expenses Paid, Amount |
$ 40
|
| Expense Ratio, Percent |
0.77%
|
| Factors Affecting Performance [Text Block] |
How did the Fund perform during the reporting period? Fund Performance For the first six months of 2025, the institutional class of the Fund returned 7.42% against a return of 9.47% for the Fund’s broad-based securities market index, the MSCI World Index. Contributors to Return The three sectors that contributed most to the Fund’s returns on an absolute basis were Industrials, Financials, and Consumer Discretionary. A recovery in data-center-related companies, along with continued strong performance in aerospace and defense stocks, drove Industrials sector outperformance. The three individual securities that contributed the most on an absolute basis were Nintendo Co., Ltd., ATI, Inc., and Safran S.A. For Nintendo, outperformance was linked to the successful launch of the next-generation Switch 2 console coupled with strong previews of first-party and third-party games. Detractors from Return The three sectors that detracted most from the Fund’s returns on an absolute basis were Health Care, Consumer Staples, and Utilities. Underperformance in Health Care was linked to regulatory uncertainties and a rotation away from defensive groups in the market. The three individual securities that detracted the most on an absolute basis were Marvell Technology, Inc., UnitedHealth Group, Inc., and Apple, Inc. For Marvell Technology, there were new concerns related to the potential share loss on a high-profile, application-specific semiconductor chip with top customer Amazon.com Inc. |
| Line Graph [Table Text Block] |
| SBH Global All Cap - Inst | MSCI World Index |
|---|
Jun-2015 | $250,000 | $250,000 |
|---|
Jun-2016 | $267,843 | $243,051 |
|---|
Jun-2017 | $304,198 | $287,276 |
|---|
Jun-2018 | $313,310 | $319,127 |
|---|
Jun-2019 | $347,276 | $339,330 |
|---|
Jun-2020 | $335,920 | $348,978 |
|---|
Jun-2021 | $442,663 | $485,234 |
|---|
Jun-2022 | $382,279 | $415,662 |
|---|
Jun-2023 | $457,691 | $492,602 |
|---|
Jun-2024 | $538,786 | $592,070 |
|---|
Jun-2025 | $610,283 | $688,330 |
|---|
|
| Average Annual Return [Table Text Block] |
| 1 Year | 5 Years | 10 Years |
|---|
SBH Global All Cap - Inst | 13.27% | 12.68% | 9.34% |
|---|
MSCI World Index | 16.26% | 14.55% | 10.66% |
|---|
|
| AssetsNet |
$ 35,581,972
|
| Holdings Count | Holding |
56
|
| Advisory Fees Paid, Amount |
$ 15,835
|
| InvestmentCompanyPortfolioTurnover |
13.00%
|
| Additional Fund Statistics [Text Block] |
Net Assets | $35,581,972 |
|---|
Number of Portfolio Holdings | 56 |
|---|
Portfolio Turnover | 13% |
|---|
Total Advisory Fees Paid* | $15,835 |
|---|
Total Advisory Fees Paid %* | 0.09% |
|---|
* Net of expenses waived by investment adviser |
| Holdings [Text Block] |
Sector Weighting (% of net assets)Value | Value |
|---|
Information Technology | 26.1% | Financials | 16.4% | Industrials | 14.9% | Consumer Discretionary | 14.8% | Health Care | 8.3% | Communication Services | 6.3% | Consumer Staples | 5.3% | Energy | 3.2% | Real Estate | 1.5% | Materials | 1.4% |
Country Weighting (% of net assets)Value | Value |
|---|
United States | 59.5% | Canada | 7.1% | United Kingdom | 6.9% | Belgium | 4.5% | France | 4.3% | Germany | 3.1% | Italy | 3.0% | Ireland | 3.0% | Japan | 2.0% | Switzerland | 1.7% | Other Countries | 3.1% |
|
| Largest Holdings [Text Block] |
Top 10 Holdings (% of net assets)Holding Name | % of Net Assets |
|---|
Microsoft Corp. | 4.5% |
|---|
JPMorgan Chase & Co. | 3.3% |
|---|
Constellation Software, Inc. | 2.9% |
|---|
D'ieteren Group | 2.8% |
|---|
Visa, Inc. | 2.8% |
|---|
ServiceNow, Inc. | 2.6% |
|---|
Safran S.A. | 2.5% |
|---|
Beazley PLC | 2.5% |
|---|
Amazon.com, Inc. | 2.3% |
|---|
Meta Platforms, Inc. | 2.2% |
|---|
|
| Material Fund Change [Text Block] |
This is a summary of certain changes to the Fund since January 1, 2025. For more complete information, you may review the Fund’s current prospectus, as supplemented, at www.cisbh.com/funds or upon request at (800)392-2673. The parent company of the Fund’s adviser entered into a definitive agreement to take the parent company private, which resulted in a change of control of the adviser. There are no plans to make any changes to the Fund resulting from this transaction. |
| Updated Prospectus Web Address |
www.cisbh.com/funds/literature
|
| C000206635 |
|
| Shareholder Report [Line Items] |
|
| Fund Name |
Segall Bryant & Hamill Short Term Plus Fund
|
| Trading Symbol |
SBHPX
|
| Annual or Semi-Annual Statement [Text Block] |
This semi-annual shareholder report contains important information about Segall Bryant & Hamill Short Term Plus Fund (the "Fund") for the period of January 1, 2025 to June 30, 2025.
|
| Shareholder Report Annual or Semi-Annual |
Semi-Annual Shareholder Report
|
| Additional Information [Text Block] |
You can find additional information about the Fund at www.cisbh.com/funds/literature. You can also request this information by contacting us at (800) 392-2673.
|
| Material Fund Change Notice [Text Block] |
This report describes changes to the Fund that occurred during the fiscal year ending December 31, 2025.
|
| Additional Information Phone Number |
(800) 392-2673
|
| Additional Information Website |
www.cisbh.com/funds/literature
|
| Expenses [Text Block] |
What were the Fund’s annualized costs for the last six months?(based on a hypothetical $10,000 investment) Class Name | Costs of a $10,000 investment | Costs paid as a percentage of a $10,000 investment |
|---|
Retail | $24 | 0.48% |
|---|
|
| Expenses Paid, Amount |
$ 24
|
| Expense Ratio, Percent |
0.48%
|
| Factors Affecting Performance [Text Block] |
How did the Fund perform during the reporting period? Fund Performance For the first six months of 2025, the retail class of the Fund returned 3.06% against a return of 2.92% for the Bloomberg 1-3 Year US Government/Credit Index and 4.02% for the Fund’s broad-based securities market index, the Bloomberg U.S. Aggregate Bond Index. Factors Affecting Performance The Fund holds short maturity, 0-3 year securities. During the first half of 2025, short assets had lower returns compared to longer maturities. Longer asset performance was driven by a decline in treasury yields. This was particularly pronounced in 5-10 year securities where Treasury yields fell 58 and 34 basis points, respectively. Sector selection had a positive impact on performance. The Fund was overweight corporate securities and underweight U.S. Treasury securities. Investment-grade corporate securities had excess returns of +0.21% during the period. Security selection had a positive impact on performance. The Fund benefited from its holdings in BB-rated securities, which had an excess return of 1.36% during the period. The Fund’s underweight to financials was a detractor. Financials outperformed all other sectors. |
| Line Graph [Table Text Block] |
| SBH Short Term Plus - Retail | Bloomberg 1-3 Year US Government/Credit Index | Bloomberg U.S. Aggregate Bond Index |
|---|
Dec-2018 | $10,000 | $10,000 | $10,000 |
|---|
Jun-2019 | $10,242 | $10,324 | $10,708 |
|---|
Jun-2020 | $10,447 | $10,758 | $11,644 |
|---|
Jun-2021 | $10,617 | $10,806 | $11,605 |
|---|
Jun-2022 | $10,292 | $10,421 | $10,411 |
|---|
Jun-2023 | $10,534 | $10,475 | $10,313 |
|---|
Jun-2024 | $11,103 | $10,985 | $10,585 |
|---|
Jun-2025 | $11,788 | $11,638 | $11,228 |
|---|
|
| Average Annual Return [Table Text Block] |
| 1 Year | 5 Years | Since Inception (12/14/2018) |
|---|
SBH Short Term Plus - Retail | 6.17% | 2.45% | 2.55% |
|---|
Bloomberg 1-3 Year US Government/Credit Index | 5.94% | 1.58% | 2.35% |
|---|
Bloomberg U.S. Aggregate Bond Index | 6.08% | -0.73% | 1.79% |
|---|
|
| AssetsNet |
$ 14,852,769
|
| Holdings Count | Holding |
72
|
| Advisory Fees Paid, Amount |
$ 0
|
| InvestmentCompanyPortfolioTurnover |
19.00%
|
| Additional Fund Statistics [Text Block] |
Net Assets | $14,852,769 |
|---|
Number of Portfolio Holdings | 72 |
|---|
Portfolio Turnover | 19% |
|---|
Total Advisory Fees Paid* | $0 |
|---|
Total Advisory Fees Paid %* | 0.00% |
|---|
Average maturity (years) | 1.75 |
|---|
30-day SEC yield (with waivers) | 4.15% |
|---|
30-day SEC yield (without waivers)
| 2.61% |
|---|
* Net of expenses waived by investment adviser 30-Day SEC Yield is a standard yield calculation that allows for fairer comparisons of bond funds. |
| Holdings [Text Block] |
Sector Weighting (% of net assets)Value | Value |
|---|
Industrial | 61.5% | Utility | 16.8% | U.S. Treasury Bonds & Notes | 9.0% | Asset Backed Securities | 6.4% | Finance | 2.9% | Municipal Bonds | 0.2% |
Rating | % Portfolio |
|---|
Cash | 2.2 |
|---|
AAA | 5.3 |
|---|
AA | 11.6 |
|---|
A | 17.3 |
|---|
BBB | 51.9 |
|---|
BB | 11.7 |
|---|
Duration | % Portfolio |
|---|
0-1 yr | 32.3 |
|---|
1-2 yrs | 37.5 |
|---|
2-3 yrs | 28.7 |
|---|
3-4 yrs | 1.5 |
|---|
|
| Material Fund Change Expenses [Text Block] |
This is a summary of certain changes to the Fund since January 1, 2025. For more complete information, you may review the Fund’s current prospectus, as supplemented, at www.cisbh.com/funds or upon request at (800)392-2673. The parent company of the Fund’s adviser entered into a definitive agreement to take the parent company private, which resulted in a change of control of the adviser. There are no plans to make any changes to the Fund resulting from this transaction. |
| Updated Prospectus Web Address |
www.cisbh.com/funds/literature
|
| C000206636 |
|
| Shareholder Report [Line Items] |
|
| Fund Name |
Segall Bryant & Hamill Short Term Plus Fund
|
| Trading Symbol |
SBAPX
|
| Annual or Semi-Annual Statement [Text Block] |
This semi-annual shareholder report contains important information about Segall Bryant & Hamill Short Term Plus Fund (the "Fund") for the period of January 1, 2025 to June 30, 2025.
|
| Shareholder Report Annual or Semi-Annual |
Semi-Annual Shareholder Report
|
| Additional Information [Text Block] |
You can find additional information about the Fund at www.cisbh.com/funds/literature. You can also request this information by contacting us at (800) 392-2673.
|
| Material Fund Change Notice [Text Block] |
This report describes changes to the Fund that occurred during the fiscal year ending December 31, 2025.
|
| Additional Information Phone Number |
(800) 392-2673
|
| Additional Information Website |
www.cisbh.com/funds/literature
|
| Expenses [Text Block] |
What were the Fund’s annualized costs for the last six months?(based on a hypothetical $10,000 investment) Class Name | Costs of a $10,000 investment | Costs paid as a percentage of a $10,000 investment |
|---|
Institutional | $20 | 0.40% |
|---|
|
| Expenses Paid, Amount |
$ 20
|
| Expense Ratio, Percent |
0.40%
|
| Factors Affecting Performance [Text Block] |
How did the Fund perform during the reporting period? Fund Performance For the first six months of 2025, the institutional class of the Fund returned 3.10% against a return of 2.92% for the Bloomberg 1-3 Year US Government/Credit Index and 4.02% for the Fund’s broad-based securities market index, the Bloomberg U.S. Aggregate Bond Index. Factors Affecting Performance The Fund holds short maturity, 0-3 year securities. During the first half of 2025, short assets had lower returns compared to longer maturities. Longer asset performance was driven by a decline in treasury yields. This was particularly pronounced in 5-10 year securities where Treasury yields fell 58 and 34 basis points, respectively. Sector selection had a positive impact on performance. The Fund was overweight corporate securities and underweight U.S. Treasury securities. Investment-grade corporate securities had excess returns of +0.21% during the period. Security selection had a positive impact on performance. The Fund benefited from its holdings in BB-rated securities, which had an excess return of 1.36% during the period. The Fund’s underweight to financials was a detractor. Financials outperformed all other sectors. |
| Line Graph [Table Text Block] |
| SBH Short Term Plus - Inst | Bloomberg 1-3 Year US Government/Credit Index | Bloomberg U.S. Aggregate Bond Index |
|---|
Dec-2018 | $250,000 | $250,000 | $250,000 |
|---|
Jun-2019 | $256,131 | $258,109 | $267,709 |
|---|
Jun-2020 | $261,582 | $268,958 | $291,106 |
|---|
Jun-2021 | $266,001 | $270,147 | $290,136 |
|---|
Jun-2022 | $258,112 | $260,519 | $260,275 |
|---|
Jun-2023 | $264,676 | $261,887 | $257,834 |
|---|
Jun-2024 | $279,179 | $274,631 | $264,617 |
|---|
Jun-2025 | $296,322 | $290,941 | $280,696 |
|---|
|
| Average Annual Return [Table Text Block] |
| 1 Year | 5 Years | Since Inception (12/14/2018) |
|---|
SBH Short Term Plus - Inst | 6.14% | 2.53% | 2.63% |
|---|
Bloomberg 1-3 Year US Government/Credit Index | 5.94% | 1.58% | 2.35% |
|---|
Bloomberg U.S. Aggregate Bond Index | 6.08% | -0.73% | 1.79% |
|---|
|
| AssetsNet |
$ 14,852,769
|
| Holdings Count | Holding |
72
|
| Advisory Fees Paid, Amount |
$ 0
|
| InvestmentCompanyPortfolioTurnover |
19.00%
|
| Additional Fund Statistics [Text Block] |
Net Assets | $14,852,769 |
|---|
Number of Portfolio Holdings | 72 |
|---|
Portfolio Turnover | 19% |
|---|
Total Advisory Fees Paid* | $0 |
|---|
Total Advisory Fees Paid %* | 0.00% |
|---|
Average maturity (years) | 1.75 |
|---|
30-day SEC yield (with waivers) | 4.19% |
|---|
30-day SEC yield (without waivers) | 3.13% |
|---|
* Net of expenses waived by investment adviser 30-Day SEC Yield is a standard yield calculation that allows for fairer comparisons of bond funds. |
| Holdings [Text Block] |
Sector Weighting (% of net assets)Value | Value |
|---|
Industrial | 61.5% | Utility | 16.8% | U.S. Treasury Bonds & Notes | 9.0% | Asset Backed Securities | 6.4% | Finance | 2.9% | Municipal Bonds | 0.2% |
Rating | % Portfolio |
|---|
Cash | 2.2 |
|---|
AAA | 5.3 |
|---|
AA | 11.6 |
|---|
A | 17.3 |
|---|
BBB | 51.9 |
|---|
BB | 11.7 |
|---|
Duration | % Portfolio |
|---|
0-1 yr | 32.3 |
|---|
1-2 yrs | 37.5 |
|---|
2-3 yrs | 28.7 |
|---|
3-4 yrs | 1.5 |
|---|
|
| Material Fund Change Expenses [Text Block] |
This is a summary of certain changes to the Fund since January 1, 2025. For more complete information, you may review the Fund’s current prospectus, as supplemented, at www.cisbh.com/funds or upon request at (800)392-2673. The parent company of the Fund’s adviser entered into a definitive agreement to take the parent company private, which resulted in a change of control of the adviser. There are no plans to make any changes to the Fund resulting from this transaction. |
| Updated Prospectus Web Address |
www.cisbh.com/funds/literature
|
| C000018311 |
|
| Shareholder Report [Line Items] |
|
| Fund Name |
Segall Bryant & Hamill Plus Bond Fund
|
| Trading Symbol |
WTIBX
|
| Annual or Semi-Annual Statement [Text Block] |
This semi-annual shareholder report contains important information about Segall Bryant & Hamill Plus Bond Fund (the "Fund") for the period of January 1, 2025 to June 30, 2025.
|
| Shareholder Report Annual or Semi-Annual |
Semi-Annual Shareholder Report
|
| Additional Information [Text Block] |
You can find additional information about the Fund at www.cisbh.com/funds/literature. You can also request this information by contacting us at (800) 392-2673.
|
| Material Fund Change Notice [Text Block] |
This report describes changes to the Fund that occurred during the fiscal year ending December 31, 2025.
|
| Additional Information Phone Number |
(800) 392-2673
|
| Additional Information Website |
www.cisbh.com/funds/literature
|
| Expenses [Text Block] |
What were the Fund’s annualized costs for the last six months?(based on a hypothetical $10,000 investment) Class Name | Costs of a $10,000 investment | Costs paid as a percentage of a $10,000 investment |
|---|
Retail | $28 | 0.55% |
|---|
|
| Expenses Paid, Amount |
$ 28
|
| Expense Ratio, Percent |
0.55%
|
| Factors Affecting Performance [Text Block] |
How did the Fund perform during the reporting period? Fund Performance For the first six months of 2025, the retail class of the Fund returned 3.96% against a return of 4.02% for the Fund’s broad-based securities market index, the Bloomberg U.S. Aggregate Bond Index. Factors Affecting Performance The Fund was overweight corporate securities and mortgage-backed securities (MBS) versus the benchmark, while being underweight U.S. Treasury securities. Investment-grade corporate and MBS securities posted excess returns versus Treasuries of +0.21% and +0.10%, respectively, during the semi-annual period. The Fund’s allocation to high yield securities positively impacted performance. High yield posted +1.04% excess return versus Treasuries during the reporting period. The Fund’s duration was slightly shorter than the duration of the benchmark during the semi-annual period. Duration and yield-curve positioning had a negligible impact on performance. |
| Line Graph [Table Text Block] |
| SBH Plus Bond - Retail | Bloomberg U.S. Aggregate Bond Index |
|---|
Jun-2015 | $10,000 | $10,000 |
|---|
Jun-2016 | $10,568 | $10,600 |
|---|
Jun-2017 | $10,687 | $10,567 |
|---|
Jun-2018 | $10,734 | $10,525 |
|---|
Jun-2019 | $11,526 | $11,353 |
|---|
Jun-2020 | $12,444 | $12,345 |
|---|
Jun-2021 | $12,704 | $12,304 |
|---|
Jun-2022 | $11,299 | $11,038 |
|---|
Jun-2023 | $11,414 | $10,934 |
|---|
Jun-2024 | $11,894 | $11,222 |
|---|
Jun-2025 | $12,596 | $11,904 |
|---|
|
| Average Annual Return [Table Text Block] |
| 1 Year | 5 Years | 10 Years |
|---|
SBH Plus Bond - Retail | 5.91% | 0.24% | 2.33% |
|---|
Bloomberg U.S. Aggregate Bond Index | 6.08% | -0.73% | 1.76% |
|---|
|
| AssetsNet |
$ 711,623,137
|
| Holdings Count | Holding |
149
|
| Advisory Fees Paid, Amount |
$ 801,559
|
| InvestmentCompanyPortfolioTurnover |
21.00%
|
| Additional Fund Statistics [Text Block] |
Net Assets | $711,623,137 |
|---|
Number of Portfolio Holdings | 149 |
|---|
Portfolio Turnover | 21% |
|---|
Total Advisory Fees Paid* | $801,559 |
|---|
Total Advisory Fees Paid %* | 0.22% |
|---|
Average maturity (years) | 8.00 |
|---|
30-day SEC yield (with waivers) | 4.30% |
|---|
30-day SEC yield (without waivers)
| 4.17% |
|---|
* Net of expenses waived by investment adviser 30-Day SEC Yield is a standard yield calculation that allows for fairer comparisons of bond funds. |
| Holdings [Text Block] |
Sector Weighting (% of net assets)Value | Value |
|---|
Mortgage-Backed Securities Passthrough | 32.2% | Industrial | 22.2% | U.S. Treasury Bonds & Notes | 19.6% | Finance | 9.8% | Utility | 8.2% | Asset Backed Securities | 2.7% | Municipal Bonds | 2.0% | Residential Mortgage-Backed Securities | 0.0% |
Rating | % Portfolio |
|---|
Cash | 2.4 |
|---|
AAA | 1.5 |
|---|
AA | 54.1 |
|---|
A | 12.2 |
|---|
BBB | 17.2 |
|---|
BB | 8.8 |
|---|
B & Below | 2.2 |
|---|
Not Rated | 1.6 |
|---|
|
| Exposure Basis Explanation [Text Block] |
Duration | % Portfolio |
|---|
0-1 yr | 6.1 |
|---|
1-3 yrs | 19.4 |
|---|
3-4 yrs | 8.1 |
|---|
4-6 yrs | 23.2 |
|---|
6-8 yrs | 29.8 |
|---|
8+ yrs | 13.4 |
|---|
|
| Material Fund Change [Text Block] |
This is a summary of certain changes to the Fund since January 1, 2025. For more complete information, you may review the Fund’s current prospectus, as supplemented, at www.cisbh.com/funds or upon request at (800)392-2673. The parent company of the Fund’s adviser entered into a definitive agreement to take the parent company private, which resulted in a change of control of the adviser. There are no plans to make any changes to the Fund resulting from this transaction. |
| Updated Prospectus Web Address |
www.cisbh.com/funds/literature
|
| C000052673 |
|
| Shareholder Report [Line Items] |
|
| Fund Name |
Segall Bryant & Hamill Plus Bond Fund
|
| Trading Symbol |
WIIBX
|
| Annual or Semi-Annual Statement [Text Block] |
This semi-annual shareholder report contains important information about Segall Bryant & Hamill Plus Bond Fund (the "Fund") for the period of January 1, 2025 to June 30, 2025.
|
| Shareholder Report Annual or Semi-Annual |
Semi-Annual Shareholder Report
|
| Additional Information [Text Block] |
You can find additional information about the Fund at www.cisbh.com/funds/literature. You can also request this information by contacting us at (800) 392-2673.
|
| Material Fund Change Notice [Text Block] |
This report describes changes to the Fund that occurred during the fiscal year ending December 31, 2025.
|
| Additional Information Phone Number |
(800) 392-2673
|
| Additional Information Website |
www.cisbh.com/funds/literature
|
| Expenses [Text Block] |
What were the Fund’s annualized costs for the last six months?(based on a hypothetical $10,000 investment) Class Name | Costs of a $10,000 investment | Costs paid as a percentage of a $10,000 investment |
|---|
Institutional | $20 | 0.40% |
|---|
|
| Expenses Paid, Amount |
$ 20
|
| Expense Ratio, Percent |
0.40%
|
| Factors Affecting Performance [Text Block] |
How did the Fund perform during the reporting period? Fund Performance For the first six months of 2025, the institutional class of the Fund returned 3.97% against a return of 4.02% for the Fund’s broad-based securities market index, the Bloomberg U.S. Aggregate Bond Index. Factors Affecting Performance The Fund was overweight corporate securities and mortgage-backed securities (MBS) versus the benchmark, while being underweight U.S. Treasury securities. Investment-grade corporate and MBS securities posted excess returns versus Treasuries of +0.21% and +0.10%, respectively, during the semi-annual period. The Fund’s allocation to high yield securities positively impacted performance. High yield posted +1.04% excess return versus Treasuries during the reporting period. The Fund’s duration was slightly shorter than the duration of the benchmark during the semi-annual period. Duration and yield-curve positioning had a negligible impact on performance. |
| Line Graph [Table Text Block] |
| SBH Plus Bond - Inst | Bloomberg U.S. Aggregate Bond Index |
|---|
Jun-2015 | $250,000 | $250,000 |
|---|
Jun-2016 | $264,485 | $265,003 |
|---|
Jun-2017 | $267,902 | $264,170 |
|---|
Jun-2018 | $269,490 | $263,120 |
|---|
Jun-2019 | $290,031 | $283,826 |
|---|
Jun-2020 | $313,308 | $308,631 |
|---|
Jun-2021 | $320,391 | $307,603 |
|---|
Jun-2022 | $285,310 | $275,944 |
|---|
Jun-2023 | $289,016 | $273,356 |
|---|
Jun-2024 | $301,405 | $280,548 |
|---|
Jun-2025 | $319,528 | $297,594 |
|---|
|
| Average Annual Return [Table Text Block] |
| 1 Year | 5 Years | 10 Years |
|---|
SBH Plus Bond - Inst | 6.01% | 0.39% | 2.48% |
|---|
Bloomberg U.S. Aggregate Bond Index | 6.08% | -0.73% | 1.76% |
|---|
|
| AssetsNet |
$ 711,623,137
|
| Holdings Count | Holding |
149
|
| Advisory Fees Paid, Amount |
$ 801,559
|
| InvestmentCompanyPortfolioTurnover |
21.00%
|
| Additional Fund Statistics [Text Block] |
Net Assets | $711,623,137 |
|---|
Number of Portfolio Holdings | 149 |
|---|
Portfolio Turnover | 21% |
|---|
Total Advisory Fees Paid* | $801,559 |
|---|
Total Advisory Fees Paid %* | 0.22% |
|---|
Average maturity (years) | 8.00 |
|---|
30-day SEC yield (with waivers) | 4.45% |
|---|
30-day SEC yield (without waivers) | 4.30% |
|---|
* Net of expenses waived by investment adviser 30-Day SEC Yield is a standard yield calculation that allows for fairer comparisons of bond funds. |
| Holdings [Text Block] |
Sector Weighting (% of net assets)Value | Value |
|---|
Mortgage-Backed Securities Passthrough | 32.2% | Industrial | 22.2% | U.S. Treasury Bonds & Notes | 19.6% | Finance | 9.8% | Utility | 8.2% | Asset Backed Securities | 2.7% | Municipal Bonds | 2.0% | Residential Mortgage-Backed Securities | 0.0% |
Rating | % Portfolio |
|---|
Cash | 2.4 |
|---|
AAA | 1.5 |
|---|
AA | 54.1 |
|---|
A | 12.2 |
|---|
BBB | 17.2 |
|---|
BB | 8.8 |
|---|
B & Below | 2.2 |
|---|
Not Rated | 1.6 |
|---|
|
| Exposure Basis Explanation [Text Block] |
Duration | % Portfolio |
|---|
0-1 yr | 6.1 |
|---|
1-3 yrs | 19.4 |
|---|
3-4 yrs | 8.1 |
|---|
4-6 yrs | 23.2 |
|---|
6-8 yrs | 29.8 |
|---|
8+ yrs | 13.4 |
|---|
|
| Material Fund Change [Text Block] |
This is a summary of certain changes to the Fund since January 1, 2025. For more complete information, you may review the Fund’s current prospectus, as supplemented, at www.cisbh.com/funds or upon request at (800)392-2673. The parent company of the Fund’s adviser entered into a definitive agreement to take the parent company private, which resulted in a change of control of the adviser. There are no plans to make any changes to the Fund resulting from this transaction. |
| Updated Prospectus Web Address |
www.cisbh.com/funds/literature
|
| C000018320 |
|
| Shareholder Report [Line Items] |
|
| Fund Name |
Segall Bryant & Hamill Quality High Yield Fund
|
| Trading Symbol |
WTLTX
|
| Annual or Semi-Annual Statement [Text Block] |
This semi-annual shareholder report contains important information about Segall Bryant & Hamill Quality High Yield Fund (the "Fund") for the period of January 1, 2025 to June 30, 2025.
|
| Shareholder Report Annual or Semi-Annual |
Semi-Annual Shareholder Report
|
| Additional Information [Text Block] |
You can find additional information about the Fund at www.cisbh.com/funds/literature. You can also request this information by contacting us at (800) 392-2673.
|
| Material Fund Change Notice [Text Block] |
This report describes changes to the Fund that occurred during the fiscal year ending December 31, 2025.
|
| Additional Information Phone Number |
(800) 392-2673
|
| Additional Information Website |
www.cisbh.com/funds/literature
|
| Expenses [Text Block] |
What were the Fund’s annualized costs for the last six months?(based on a hypothetical $10,000 investment) Class Name | Costs of a $10,000 investment | Costs paid as a percentage of a $10,000 investment |
|---|
Retail | $43 | 0.85% |
|---|
|
| Expenses Paid, Amount |
$ 43
|
| Expense Ratio, Percent |
0.85%
|
| Factors Affecting Performance [Text Block] |
How did the Fund perform during the reporting period? Fund Performance For the first six months of 2025, the retail class of the Fund returned 4.34% against a return of 4.57% for the Bloomberg U.S. High Yield - 2% Issuer Cap Index and 4.02% for the Fund’s broad-based securities market index, the Bloomberg U.S. Aggregate Bond Index. Factors Affecting Performance The Fund has a high-quality bias and was underweight CCC-rated securities and overweight BBB-rated securities versus its benchmark, the Bloomberg U.S. High Yield -2% issuer Cap Index. CCC-rated securities returned 3.55% during the semi-annual period vs. 4.50% for Intermediate BBB-rated securities, 4.98% for BB-rated securities, and 4.38% for B-rated securities. Security selection positively impacted returns during the reporting period as credit enhancing events for certain issuers outweighed underperforming issues. The Fund’s duration was shorter than its benchmark and regulatory broad-based securities market index, which detracted from performance. |
| Line Graph [Table Text Block] |
| SBH Quality High Yield - Retail | Bloomberg U.S. High Yield - 2% Issuer Capped Index | Bloomberg U.S. Aggregate Bond Index |
|---|
Jun-2015 | $10,000 | $10,000 | $10,000 |
|---|
Jun-2016 | $10,426 | $10,165 | $10,600 |
|---|
Jun-2017 | $11,339 | $11,456 | $10,567 |
|---|
Jun-2018 | $11,445 | $11,756 | $10,525 |
|---|
Jun-2019 | $12,283 | $12,635 | $11,353 |
|---|
Jun-2020 | $12,546 | $12,634 | $12,345 |
|---|
Jun-2021 | $13,877 | $14,572 | $12,304 |
|---|
Jun-2022 | $12,345 | $12,704 | $11,038 |
|---|
Jun-2023 | $13,284 | $13,856 | $10,934 |
|---|
Jun-2024 | $14,502 | $15,302 | $11,222 |
|---|
Jun-2025 | $15,658 | $16,875 | $11,904 |
|---|
|
| Average Annual Return [Table Text Block] |
| 1 Year | 5 Years | 10 Years |
|---|
SBH Quality High Yield - Retail | 7.97% | 4.53% | 4.59% |
|---|
Bloomberg U.S. High Yield - 2% Issuer Capped Index | 10.28% | 5.96% | 5.37% |
|---|
Bloomberg U.S. Aggregate Bond Index | 6.08% | -0.73% | 1.76% |
|---|
|
| AssetsNet |
$ 64,094,643
|
| Holdings Count | Holding |
61
|
| Advisory Fees Paid, Amount |
$ 97,583
|
| InvestmentCompanyPortfolioTurnover |
19.00%
|
| Additional Fund Statistics [Text Block] |
Net Assets | $64,094,643 |
|---|
Number of Portfolio Holdings | 61 |
|---|
Portfolio Turnover | 19% |
|---|
Total Advisory Fees Paid* | $97,583 |
|---|
Total Advisory Fees Paid %* | 0.30% |
|---|
Average maturity (years) | 3.62 |
|---|
30-day SEC yield (with waivers) | 5.06% |
|---|
30-day SEC yield (without waivers)
| 4.91% |
|---|
* Net of expenses waived by investment adviser 30-Day SEC Yield is a standard yield calculation that allows for fairer comparisons of bond funds. |
| Holdings [Text Block] |
Sector Weighting (% of net assets)Value | Value |
|---|
Industrial | 78.7% | Finance | 11.1% | Utility | 7.2% |
Rating | % Portfolio |
|---|
Cash | 1.6 |
|---|
BBB | 8.2 |
|---|
BB | 70.1 |
|---|
B & Below | 17.2 |
|---|
Not Rated | 3.0 |
|---|
Duration | % Portfolio |
|---|
0-1 yr | 15.6 |
|---|
1-3 yrs | 56.8 |
|---|
3-4 yrs | 10.5 |
|---|
4-6 yrs | 13.6 |
|---|
6-8 yrs | 2.2 |
|---|
8+ yrs | 1.3 |
|---|
|
| Material Fund Change [Text Block] |
This is a summary of certain changes to the Fund since January 1, 2025. For more complete information, you may review the Fund’s current prospectus, as supplemented, at www.cisbh.com/funds or upon request at (800)392-2673. The parent company of the Fund’s adviser entered into a definitive agreement to take the parent company private, which resulted in a change of control of the adviser. There are no plans to make any changes to the Fund resulting from this transaction. |
| Updated Prospectus Web Address |
www.cisbh.com/funds/literature
|
| C000052678 |
|
| Shareholder Report [Line Items] |
|
| Fund Name |
Segall Bryant & Hamill Quality High Yield Fund
|
| Trading Symbol |
WILTX
|
| Annual or Semi-Annual Statement [Text Block] |
This semi-annual shareholder report contains important information about Segall Bryant & Hamill Quality High Yield Fund (the "Fund") for the period of January 1, 2025 to June 30, 2025.
|
| Shareholder Report Annual or Semi-Annual |
Semi-Annual Shareholder Report
|
| Additional Information [Text Block] |
You can find additional information about the Fund at www.cisbh.com/funds/literature. You can also request this information by contacting us at (800) 392-2673.
|
| Material Fund Change Notice [Text Block] |
This report describes changes to the Fund that occurred during the fiscal year ending December 31, 2025.
|
| Additional Information Phone Number |
(800) 392-2673
|
| Additional Information Website |
www.cisbh.com/funds/literature
|
| Expenses [Text Block] |
What were the Fund’s annualized costs for the last six months?(based on a hypothetical $10,000 investment) Class Name | Costs of a $10,000 investment | Costs paid as a percentage of a $10,000 investment |
|---|
Institutional | $35 | 0.70% |
|---|
|
| Expenses Paid, Amount |
$ 35
|
| Expense Ratio, Percent |
0.70%
|
| Factors Affecting Performance [Text Block] |
How did the Fund perform during the reporting period? Fund Performance For the first six months of 2025, the institutional class of the Fund returned 4.35% against a return of 4.57% for the Bloomberg U.S. High Yield - 2% Issuer Cap Index and 4.02% for the Fund’s broad-based securities market index, the Bloomberg U.S. Aggregate Bond Index. Factors Affecting Performance The Fund has a high-quality bias and was underweight CCC-rated securities and overweight BBB-rated securities versus its benchmark, the Bloomberg U.S. High Yield -2% issuer Cap Index. CCC-rated securities returned 3.55% during the semi-annual period vs. 4.50% for Intermediate BBB-rated securities, 4.98% for BB-rated securities, and 4.38% for B-rated securities. Security selection positively impacted returns during the reporting period as credit enhancing events for certain issuers outweighed underperforming issues. The Fund’s duration was shorter than its benchmark and regulatory broad-based securities market index, which detracted from performance. |
| Line Graph [Table Text Block] |
| SBH Quality High Yield - Inst | Bloomberg U.S. High Yield - 2% Issuer Capped Index | Bloomberg U.S. Aggregate Bond Index |
|---|
Jun-2015 | $250,000 | $250,000 | $250,000 |
|---|
Jun-2016 | $260,750 | $254,137 | $265,003 |
|---|
Jun-2017 | $284,620 | $286,388 | $264,170 |
|---|
Jun-2018 | $287,863 | $293,892 | $263,120 |
|---|
Jun-2019 | $309,062 | $315,863 | $283,826 |
|---|
Jun-2020 | $316,507 | $315,854 | $308,631 |
|---|
Jun-2021 | $350,169 | $364,303 | $307,603 |
|---|
Jun-2022 | $311,897 | $317,589 | $275,944 |
|---|
Jun-2023 | $336,418 | $346,397 | $273,356 |
|---|
Jun-2024 | $367,770 | $382,538 | $280,548 |
|---|
Jun-2025 | $397,628 | $421,878 | $297,594 |
|---|
|
| Average Annual Return [Table Text Block] |
| 1 Year | 5 Years | 10 Years |
|---|
SBH Quality High Yield - Inst | 8.12% | 4.67% | 4.75% |
|---|
Bloomberg U.S. High Yield - 2% Issuer Capped Index | 10.28% | 5.96% | 5.37% |
|---|
Bloomberg U.S. Aggregate Bond Index | 6.08% | -0.73% | 1.76% |
|---|
|
| AssetsNet |
$ 64,094,643
|
| Holdings Count | Holding |
61
|
| Advisory Fees Paid, Amount |
$ 97,583
|
| InvestmentCompanyPortfolioTurnover |
19.00%
|
| Additional Fund Statistics [Text Block] |
Net Assets | $64,094,643 |
|---|
Number of Portfolio Holdings | 61 |
|---|
Portfolio Turnover | 19% |
|---|
Total Advisory Fees Paid* | $97,583 |
|---|
Total Advisory Fees Paid %* | 0.30% |
|---|
Average maturity (years) | 3.62 |
|---|
30-day SEC yield (with waivers) | 5.22% |
|---|
30-day SEC yield (without waivers) | 5.12% |
|---|
* Net of expenses waived by investment adviser 30-Day SEC Yield is a standard yield calculation that allows for fairer comparisons of bond funds. |
| Holdings [Text Block] |
Sector Weighting (% of net assets)Value | Value |
|---|
Industrial | 78.7% | Finance | 11.1% | Utility | 7.2% |
Rating | % Portfolio |
|---|
Cash | 1.6 |
|---|
BBB | 8.2 |
|---|
BB | 70.1 |
|---|
B & Below | 17.2 |
|---|
Not Rated | 3.0 |
|---|
Duration | % Portfolio |
|---|
0-1 yr | 15.6 |
|---|
1-3 yrs | 56.8 |
|---|
3-4 yrs | 10.5 |
|---|
4-6 yrs | 13.6 |
|---|
6-8 yrs | 2.2 |
|---|
8+ yrs | 1.3 |
|---|
|
| Material Fund Change [Text Block] |
This is a summary of certain changes to the Fund since January 1, 2025. For more complete information, you may review the Fund’s current prospectus, as supplemented, at www.cisbh.com/funds or upon request at (800)392-2673. The parent company of the Fund’s adviser entered into a definitive agreement to take the parent company private, which resulted in a change of control of the adviser. There are no plans to make any changes to the Fund resulting from this transaction. |
| Updated Prospectus Web Address |
www.cisbh.com/funds/literature
|
| C000176020 |
|
| Shareholder Report [Line Items] |
|
| Fund Name |
Segall Bryant & Hamill Municipal Opportunities Fund
|
| Trading Symbol |
WTTAX
|
| Annual or Semi-Annual Statement [Text Block] |
This semi-annual shareholder report contains important information about Segall Bryant & Hamill Municipal Opportunities Fund (the "Fund") for the period of January 1, 2025 to June 30, 2025.
|
| Shareholder Report Annual or Semi-Annual |
Semi-Annual Shareholder Report
|
| Additional Information [Text Block] |
You can find additional information about the Fund at www.cisbh.com/funds/literature. You can also request this information by contacting us at (800) 392-2673.
|
| Material Fund Change Notice [Text Block] |
This report describes changes to the Fund that occurred during the fiscal year ending December 31, 2025.
|
| Additional Information Phone Number |
(800) 392-2673
|
| Additional Information Website |
www.cisbh.com/funds/literature
|
| Expenses [Text Block] |
What were the Fund’s annualized costs for the last six months?(based on a hypothetical $10,000 investment) Class Name | Costs of a $10,000 investment | Costs paid as a percentage of a $10,000 investment |
|---|
Retail | $32 | 0.65% |
|---|
|
| Expenses Paid, Amount |
$ 32
|
| Expense Ratio, Percent |
0.65%
|
| Factors Affecting Performance [Text Block] |
How did the Fund perform during the reporting period? Fund Performance For the first six months of 2025, the retail class of the Fund returned 1.35% against a return of 1.09% for the Bloomberg 1-15 Year Municipal Blend Index and -0.35% for the Fund’s broad-based securities market index, the Bloomberg Municipal Bond Index. Factors Affecting Performance Municipal bonds experienced a volatile first half of 2025. Yields increased sharply early in the second quarter following tariff-related announcements but quickly reversed, which led to a modest rally before moving lower. Our strategy of investing in short- and long-term bonds was challenged by the Fund’s yield curve (yields across different maturities of bonds) positioning, but the Fund’s higher average yield helped offset the impact. We also had a material bond repricing in one of the Fund’s top ten largest positions, as the bond was priced at a significant discount and partially called at par. At the end of the period, we believe our tactical positioning across different maturities will continue to contribute to Fund’s performance. |
| Average Annual Return [Table Text Block] |
| 1 Year | 5 Years | Since Inception (12/16/2016) |
|---|
SBH Municipal Opportunities - Retail | 3.57% | 0.82% | 2.88% |
|---|
Bloomberg 1-15 Year Municipal Blend Index | 2.63% | 0.86% | 2.27% |
|---|
Bloomberg Municipal Bond Index | 1.11% | 0.51% | 2.29% |
|---|
|
| AssetsNet |
$ 186,318,454
|
| Holdings Count | Holding |
159
|
| Advisory Fees Paid, Amount |
$ 214,989
|
| InvestmentCompanyPortfolioTurnover |
44.00%
|
| Additional Fund Statistics [Text Block] |
Net Assets | $186,318,454 |
|---|
Number of Portfolio Holdings | 159 |
|---|
Portfolio Turnover | 44% |
|---|
Total Advisory Fees Paid* | $214,989 |
|---|
Total Advisory Fees Paid %* | 0.24% |
|---|
Average maturity (years) | 7.84 |
|---|
30-day SEC yield (with waivers) | 3.24% |
|---|
30-day SEC yield (without waivers)
| 3.06% |
|---|
* Net of expenses waived by investment adviser 30-Day SEC Yield is a standard yield calculation that allows for fairer comparisons of bond funds. |
| Holdings [Text Block] |
Sector Weighting (% of net assets)Value | Value |
|---|
Revenue | 58.5% | General Obligation | 15.6% | U.S. Treasury Bonds & Notes | 10.3% | Variable Rate Demand Note | 4.7% | Industrial | 4.4% | Local Authority | 4.2% | CMBS | 1.1% |
Rating | % Portfolio |
|---|
AAA | 11.9 |
|---|
AA | 51.1 |
|---|
A | 19.8 |
|---|
BBB | 4.0 |
|---|
BB | 3.1 |
|---|
B | 4.4 |
|---|
Not Rated | 5.8 |
|---|
Duration | % Portfolio |
|---|
0-1 yr | 25.2 |
|---|
1-3 yrs | 19.1 |
|---|
3-4 yrs | 10.2 |
|---|
4-6 yrs | 8.6 |
|---|
6-8 yrs | 2.7 |
|---|
8+ yrs | 34.3 |
|---|
|
| Material Fund Change [Text Block] |
This is a summary of certain changes to the Fund since January 1, 2025. For more complete information, you may review the Fund’s current prospectus, as supplemented, at www.cisbh.com/funds or upon request at (800)392-2673. The parent company of the Fund’s adviser entered into a definitive agreement to take the parent company private, which resulted in a change of control of the adviser. There are no plans to make any changes to the Fund resulting from this transaction. |
| Updated Prospectus Web Address |
www.cisbh.com/funds/literature
|
| C000176021 |
|
| Shareholder Report [Line Items] |
|
| Fund Name |
Segall Bryant & Hamill Municipal Opportunities Fund
|
| Trading Symbol |
WITAX
|
| Annual or Semi-Annual Statement [Text Block] |
This semi-annual shareholder report contains important information about Segall Bryant & Hamill Municipal Opportunities Fund (the "Fund") for the period of January 1, 2025 to June 30, 2025.
|
| Shareholder Report Annual or Semi-Annual |
Semi-Annual Shareholder Report
|
| Additional Information [Text Block] |
You can find additional information about the Fund at www.cisbh.com/funds/literature. You can also request this information by contacting us at (800) 392-2673.
|
| Material Fund Change Notice [Text Block] |
This report describes changes to the Fund that occurred during the fiscal year ending December 31, 2025.
|
| Additional Information Phone Number |
(800) 392-2673
|
| Additional Information Website |
www.cisbh.com/funds/literature
|
| Expenses [Text Block] |
What were the Fund’s annualized costs for the last six months?(based on a hypothetical $10,000 investment) Class Name | Costs of a $10,000 investment | Costs paid as a percentage of a $10,000 investment |
|---|
Institutional | $25 | 0.50% |
|---|
|
| Expenses Paid, Amount |
$ 25
|
| Expense Ratio, Percent |
0.50%
|
| Factors Affecting Performance [Text Block] |
How did the Fund perform during the reporting period? Fund Performance For the first six months of 2025, the institutional class of the Fund returned 1.42% against a return of 1.09% for the Bloomberg 1-15 Year Municipal Blend Index and -0.35% for the Fund’s broad-based securities market index, the Bloomberg Municipal Bond Index. Factors Affecting Performance Municipal bonds experienced a volatile first half of 2025. Yields increased sharply early in the second quarter following tariff-related announcements but quickly reversed, which led to a modest rally before moving lower. Our strategy of investing in short- and long-term bonds was challenged by the Fund’s yield curve (yields across different maturities of bonds) positioning, but the Fund’s higher average yield helped offset the impact. We also had a material bond repricing in one of the Fund’s top ten largest positions, as the bond was priced at a significant discount and partially called at par. At the end of the period, we believe our tactical positioning across different maturities will continue to contribute to Fund’s performance. |
| Average Annual Return [Table Text Block] |
| 1 Year | 5 Years | Since Inception (12/16/2016) |
|---|
SBH Municipal Opportunities - Inst | 3.72% | 0.95% | 3.03% |
|---|
Bloomberg 1-15 Year Municipal Blend Index | 2.63% | 0.86% | 2.27% |
|---|
Bloomberg Municipal Bond Index | 1.11% | 0.51% | 2.29% |
|---|
|
| AssetsNet |
$ 186,318,454
|
| Holdings Count | Holding |
159
|
| Advisory Fees Paid, Amount |
$ 214,989
|
| InvestmentCompanyPortfolioTurnover |
44.00%
|
| Additional Fund Statistics [Text Block] |
Net Assets | $186,318,454 |
|---|
Number of Portfolio Holdings | 159 |
|---|
Portfolio Turnover | 44% |
|---|
Total Advisory Fees Paid* | $214,989 |
|---|
Total Advisory Fees Paid %* | 0.24% |
|---|
Average maturity (years) | 7.84 |
|---|
30-day SEC yield (with waivers) | 3.39% |
|---|
30-day SEC yield (without waivers) | 3.28% |
|---|
* Net of expenses waived by investment adviser 30-Day SEC Yield is a standard yield calculation that allows for fairer comparisons of bond funds. |
| Holdings [Text Block] |
Sector Weighting (% of net assets)Value | Value |
|---|
Revenue | 58.5% | General Obligation | 15.6% | U.S. Treasury Bonds & Notes | 10.3% | Variable Rate Demand Note | 4.7% | Industrial | 4.4% | Local Authority | 4.2% | CMBS | 1.1% |
Rating | % Portfolio |
|---|
AAA | 11.9 |
|---|
AA | 51.1 |
|---|
A | 19.8 |
|---|
BBB | 4.0 |
|---|
BB | 3.1 |
|---|
B | 4.4 |
|---|
Not Rated | 5.8 |
|---|
Duration | % Portfolio |
|---|
0-1 yr | 25.2 |
|---|
1-3 yrs | 19.1 |
|---|
3-4 yrs | 10.2 |
|---|
4-6 yrs | 8.6 |
|---|
6-8 yrs | 2.7 |
|---|
8+ yrs | 34.3 |
|---|
|
| Material Fund Change [Text Block] |
This is a summary of certain changes to the Fund since January 1, 2025. For more complete information, you may review the Fund’s current prospectus, as supplemented, at www.cisbh.com/funds or upon request at (800)392-2673. The parent company of the Fund’s adviser entered into a definitive agreement to take the parent company private, which resulted in a change of control of the adviser. There are no plans to make any changes to the Fund resulting from this transaction. |
| Updated Prospectus Web Address |
www.cisbh.com/funds/literature
|
| C000018312 |
|
| Shareholder Report [Line Items] |
|
| Fund Name |
Segall Bryant & Hamill Colorado Tax-Free Fund
|
| Trading Symbol |
WTCOX
|
| Annual or Semi-Annual Statement [Text Block] |
This semi-annual shareholder report contains important information about Segall Bryant & Hamill Colorado Tax-Free Fund (the "Fund") for the period of January 1, 2025 to June 30, 2025.
|
| Shareholder Report Annual or Semi-Annual |
Semi-Annual Shareholder Report
|
| Additional Information [Text Block] |
You can find additional information about the Fund at www.cisbh.com/funds/literature. You can also request this information by contacting us at (800) 392-2673.
|
| Material Fund Change Notice [Text Block] |
This report describes changes to the Fund that occurred during the fiscal year ending December 31, 2025.
|
| Additional Information Phone Number |
(800) 392-2673
|
| Additional Information Website |
www.cisbh.com/funds/literature
|
| Expenses [Text Block] |
What were the Fund’s annualized costs for the last six months?(based on a hypothetical $10,000 investment) Class Name | Costs of a $10,000 investment | Costs paid as a percentage of a $10,000 investment |
|---|
Retail | $32 | 0.64% |
|---|
|
| Expenses Paid, Amount |
$ 32
|
| Expense Ratio, Percent |
0.64%
|
| Factors Affecting Performance [Text Block] |
How did the Fund perform during the reporting period? Fund Performance For the first six months of 2025, the retail class of the Fund returned 0.12% against a return of 1.09% for the Bloomberg 1-15 Year Municipal Blend Index and -0.35% for the Fund’s broad-based securities market index, the Bloomberg Municipal Bond Index. Factors Affecting Performance The Colorado municipal bond market remained fundamentally sound in the first half of 2025, supported by strong state reserves and moderate debt levels. The Fund’s strategy of investing in short- and long-term bonds was challenged by a steepening yield curve (a growing difference in short- and long-term interest rates) in bonds with maturities of over 10 years. One of our higher education credit holdings was downgraded, which negatively impacted its price, and detracted from the Fund’s performance. The combination of medium-term bonds rallying and relative yield curve positioning led to underperformance. |
| Line Graph [Table Text Block] |
| SBH Colorado Tax Free - Retail | Bloomberg 1-15 Year Municipal Blend Index | Bloomberg Municipal Bond Index |
|---|
Jun-2015 | $10,000 | $10,000 | $10,000 |
|---|
Jun-2016 | $10,658 | $10,613 | $10,765 |
|---|
Jun-2017 | $10,586 | $10,596 | $10,713 |
|---|
Jun-2018 | $10,759 | $10,703 | $10,880 |
|---|
Jun-2019 | $11,368 | $11,359 | $11,610 |
|---|
Jun-2020 | $11,808 | $11,833 | $12,126 |
|---|
Jun-2021 | $12,350 | $12,198 | $12,632 |
|---|
Jun-2022 | $11,359 | $11,401 | $11,549 |
|---|
Jun-2023 | $11,280 | $11,718 | $11,917 |
|---|
Jun-2024 | $11,754 | $12,034 | $12,300 |
|---|
Jun-2025 | $11,940 | $12,351 | $12,437 |
|---|
|
| Average Annual Return [Table Text Block] |
| 1 Year | 5 Years | 10 Years |
|---|
SBH Colorado Tax Free - Retail | 1.58% | 0.22% | 1.79% |
|---|
Bloomberg 1-15 Year Municipal Blend Index | 2.63% | 0.86% | 2.13% |
|---|
Bloomberg Municipal Bond Index | 1.11% | 0.51% | 2.20% |
|---|
|
| AssetsNet |
$ 310,296,923
|
| Holdings Count | Holding |
145
|
| Advisory Fees Paid, Amount |
$ 463,045
|
| InvestmentCompanyPortfolioTurnover |
49.00%
|
| Additional Fund Statistics [Text Block] |
Net Assets | $310,296,923 |
|---|
Number of Portfolio Holdings | 145 |
|---|
Portfolio Turnover | 49% |
|---|
Total Advisory Fees Paid* | $463,045 |
|---|
Total Advisory Fees Paid %* | 0.29% |
|---|
Average maturity (years) | 8.28 |
|---|
30-day SEC yield (with waivers) | 3.27% |
|---|
30-day SEC yield (without waivers)
| 3.25% |
|---|
* Net of expenses waived by investment adviser 30-Day SEC Yield is a standard yield calculation that allows for fairer comparisons of bond funds. |
| Holdings [Text Block] |
Sector Weighting (% of net assets)Value | Value |
|---|
Revenue | 50.6% | General Obligation | 14.4% | Variable Rate Demand Note | 13.1% | Certificate Participation | 7.7% | Local Authority | 4.4% | U.S. Treasury Bonds & Notes | 4.2% |
Rating | % Portfolio |
|---|
Cash | 5.0 |
|---|
AAA | 30.7 |
|---|
AA | 48.0 |
|---|
A | 7.3 |
|---|
BBB | 3.8 |
|---|
BB | 0.7 |
|---|
Not Rated | 4.5 |
|---|
Duration | % Portfolio |
|---|
0-1 yr | 36.1 |
|---|
1-3 yrs | 16.8 |
|---|
3-4 yrs | 4.3 |
|---|
4-6 yrs | 8.0 |
|---|
6-8 yrs | 5.0 |
|---|
8+ yrs | 29.8 |
|---|
|
| Material Fund Change [Text Block] |
This is a summary of certain changes to the Fund since January 1, 2025. For more complete information, you may review the Fund’s current prospectus, as supplemented, at www.cisbh.com/funds or upon request at (800)392-2673. The parent company of the Fund’s adviser entered into a definitive agreement to take the parent company private, which resulted in a change of control of the adviser. There are no plans to make any changes to the Fund resulting from this transaction. |
| Updated Prospectus Web Address |
www.cisbh.com/funds/literature
|
| C000169263 |
|
| Shareholder Report [Line Items] |
|
| Fund Name |
Segall Bryant & Hamill Colorado Tax-Free Fund
|
| Trading Symbol |
WICOX
|
| Annual or Semi-Annual Statement [Text Block] |
This semi-annual shareholder report contains important information about Segall Bryant & Hamill Colorado Tax-Free Fund (the "Fund") for the period of January 1, 2025 to June 30, 2025.
|
| Shareholder Report Annual or Semi-Annual |
Semi-Annual Shareholder Report
|
| Additional Information [Text Block] |
You can find additional information about the Fund at www.cisbh.com/funds/literature. You can also request this information by contacting us at (800) 392-2673.
|
| Material Fund Change Notice [Text Block] |
This report describes changes to the Fund that occurred during the fiscal year ending December 31, 2025.
|
| Additional Information Phone Number |
(800) 392-2673
|
| Additional Information Website |
www.cisbh.com/funds/literature
|
| Expenses [Text Block] |
What were the Fund’s annualized costs for the last six months?(based on a hypothetical $10,000 investment) Class Name | Costs of a $10,000 investment | Costs paid as a percentage of a $10,000 investment |
|---|
Institutional | $25 | 0.50% |
|---|
|
| Expenses Paid, Amount |
$ 25
|
| Expense Ratio, Percent |
0.50%
|
| Factors Affecting Performance [Text Block] |
How did the Fund perform during the reporting period? Fund Performance For the first six months of 2025, the institutional class of the Fund returned 0.18% against a return of 1.09% for the Bloomberg 1-15 Year Municipal Blend Index and -0.35% for the Fund’s broad-based securities market index, the Bloomberg Municipal Bond Index. Factors Affecting Performance The Colorado municipal bond market remained fundamentally sound in the first half of 2025, supported by strong state reserves and moderate debt levels. The Fund’s strategy of investing in short- and long-term bonds was challenged by a steepening yield curve (a growing difference in short- and long-term interest rates) in bonds with maturities of over 10 years. One of our higher education credit holdings was downgraded, which negatively impacted its price, and detracted from the Fund’s performance. The combination of medium-term bonds rallying and relative yield curve positioning led to underperformance. |
| Line Graph [Table Text Block] |
| SBH Colorado Tax Free - Inst | Bloomberg 1-15 Year Municipal Blend Index | Bloomberg Municipal Bond Index |
|---|
Jun-2015 | $250,000 | $250,000 | $250,000 |
|---|
Jun-2016 | $266,447 | $265,313 | $269,131 |
|---|
Jun-2017 | $265,042 | $264,909 | $267,819 |
|---|
Jun-2018 | $269,730 | $267,579 | $272,009 |
|---|
Jun-2019 | $285,490 | $283,973 | $290,250 |
|---|
Jun-2020 | $296,865 | $295,835 | $303,162 |
|---|
Jun-2021 | $311,146 | $304,942 | $315,791 |
|---|
Jun-2022 | $286,431 | $285,029 | $288,723 |
|---|
Jun-2023 | $284,860 | $292,960 | $297,923 |
|---|
Jun-2024 | $297,495 | $300,848 | $307,495 |
|---|
Jun-2025 | $302,306 | $308,771 | $310,916 |
|---|
|
| Average Annual Return [Table Text Block] |
| 1 Year | 5 Years | 10 Years |
|---|
SBH Colorado Tax Free - Inst | 1.62% | 0.36% | 1.92% |
|---|
Bloomberg 1-15 Year Municipal Blend Index | 2.63% | 0.86% | 2.13% |
|---|
Bloomberg Municipal Bond Index | 1.11% | 0.51% | 2.20% |
|---|
|
| AssetsNet |
$ 310,296,923
|
| Holdings Count | Holding |
145
|
| Advisory Fees Paid, Amount |
$ 463,045
|
| InvestmentCompanyPortfolioTurnover |
49.00%
|
| Additional Fund Statistics [Text Block] |
Net Assets | $310,296,923 |
|---|
Number of Portfolio Holdings | 145 |
|---|
Portfolio Turnover | 49% |
|---|
Total Advisory Fees Paid* | $463,045 |
|---|
Total Advisory Fees Paid %* | 0.29% |
|---|
Average maturity (years) | 8.28 |
|---|
30-day SEC yield (with waivers) | 3.45% |
|---|
30-day SEC yield (without waivers) | 3.37% |
|---|
* Net of expenses waived by investment adviser 30-Day SEC Yield is a standard yield calculation that allows for fairer comparisons of bond funds. |
| Holdings [Text Block] |
Sector Weighting (% of net assets)Value | Value |
|---|
Revenue | 50.6% | General Obligation | 14.4% | Variable Rate Demand Note | 13.1% | Certificate Participation | 7.7% | Local Authority | 4.4% | U.S. Treasury Bonds & Notes | 4.2% |
Rating | % Portfolio |
|---|
Cash | 5.0 |
|---|
AAA | 30.7 |
|---|
AA | 48.0 |
|---|
A | 7.3 |
|---|
BBB | 3.8 |
|---|
BB | 0.7 |
|---|
Not Rated | 4.5 |
|---|
Duration | % Portfolio |
|---|
0-1 yr | 36.1 |
|---|
1-3 yrs | 16.8 |
|---|
3-4 yrs | 4.3 |
|---|
4-6 yrs | 8.0 |
|---|
6-8 yrs | 5.0 |
|---|
8+ yrs | 29.8 |
|---|
|
| Material Fund Change [Text Block] |
This is a summary of certain changes to the Fund since January 1, 2025. For more complete information, you may review the Fund’s current prospectus, as supplemented, at www.cisbh.com/funds or upon request at (800)392-2673. The parent company of the Fund’s adviser entered into a definitive agreement to take the parent company private, which resulted in a change of control of the adviser. There are no plans to make any changes to the Fund resulting from this transaction. |
| Updated Prospectus Web Address |
www.cisbh.com/funds/literature
|
| C000244704 |
|
| Shareholder Report [Line Items] |
|
| Fund Name |
Barrett Growth Fund
|
| Trading Symbol |
BGRWX
|
| Annual or Semi-Annual Statement [Text Block] |
This semi-annual shareholder report contains important information about Barrett Growth Fund (the "Fund") for the period of January 1, 2025 to June 30, 2025.
|
| Shareholder Report Annual or Semi-Annual |
Semi-Annual Shareholder Report
|
| Additional Information [Text Block] |
You can find additional information about the Fund at www.cisbh.com/funds/literature. You can also request this information by contacting us at (800) 392-2673.
|
| Material Fund Change Notice [Text Block] |
This report describes changes to the Fund that occurred during the fiscal year ending December 31, 2025.
|
| Additional Information Phone Number |
(800) 392-2673
|
| Additional Information Website |
www.cisbh.com/funds/literature
|
| Expenses [Text Block] |
What were the Fund’s annualized costs for the last six months?(based on a hypothetical $10,000 investment) Class Name | Costs of a $10,000 investment | Costs paid as a percentage of a $10,000 investment |
|---|
Retail | $49 | 0.99% |
|---|
|
| Expenses Paid, Amount |
$ 49
|
| Expense Ratio, Percent |
0.99%
|
| Factors Affecting Performance [Text Block] |
How did the Fund perform during the reporting period? Fund Performance For the first six months of 2025, the Fund returned 0.24% against a return of 6.20% for the Fund’s broad-based securities market index, the S&P 500® Index. Contributors to Return The three sectors that contributed most to the Fund’s returns on an absolute basis were Financials, Information Technology, and Materials. Investors were concerned about tariffs, and Financials appeared less impacted relative to other sectors during the period. The three individual securities that contributed the most on an absolute basis were NVIDIA Corp., Microsoft Corp., and JPMorgan Chase & Co. Investors regained confidence in AI, which rewarded companies such as NVIDIA that investors see as a company with high growth potential in the AI space. Detractors from Return The three sectors that detracted most from the Fund’s returns on an absolute basis were Health Care, Communication Services, and Industrials. Uncertainty over final tariff rates created a difficult economic environment over capital-intensive manufacturers during the period. The three individual securities that detracted the most on an absolute basis were Apple, Inc., UnitedHealth Group, Inc., and Regeneron Pharmaceuticals, Inc. While Apple generated significant revenue, its delay incorporating AI into its products weighed on its stock. |
| Line Graph [Table Text Block] |
| Barrett Growth | S&P 500® Index |
|---|
Jun-2015 | $10,000 | $10,000 |
|---|
Jun-2016 | $9,959 | $10,399 |
|---|
Jun-2017 | $11,389 | $12,260 |
|---|
Jun-2018 | $13,521 | $14,023 |
|---|
Jun-2019 | $15,373 | $15,483 |
|---|
Jun-2020 | $17,630 | $16,645 |
|---|
Jun-2021 | $23,769 | $23,436 |
|---|
Jun-2022 | $19,576 | $20,948 |
|---|
Jun-2023 | $23,600 | $25,053 |
|---|
Jun-2024 | $31,350 | $31,204 |
|---|
Jun-2025 | $33,642 | $35,936 |
|---|
|
| Average Annual Return [Table Text Block] |
| 1 Year | 5 Years | 10 Years |
|---|
Barrett Growth | 7.31% | 13.80% | 12.90% |
|---|
S&P 500® Index | 15.16% | 16.64% | 13.65% |
|---|
|
| AssetsNet |
$ 24,759,854
|
| Holdings Count | Holding |
33
|
| Advisory Fees Paid, Amount |
$ 27,565
|
| InvestmentCompanyPortfolioTurnover |
4.00%
|
| Additional Fund Statistics [Text Block] |
Net Assets | $24,759,854 |
|---|
Number of Portfolio Holdings | 33 |
|---|
Portfolio Turnover | 4% |
|---|
Total Advisory Fees Paid* | $27,565 |
|---|
Total Advisory Fees Paid %* | 0.21% |
|---|
* Net of expenses waived by investment adviser |
| Holdings [Text Block] |
Sector Weighting (% of net assets)Value | Value |
|---|
Information Technology | 30.9% | Financials | 22.2% | Consumer Discretionary | 14.4% | Health Care | 13.4% | Industrials | 5.5% | Communication Services | 4.9% | Consumer Staples | 4.0% | Materials | 3.3% | Energy | 0.9% |
Country Weighting (% of net assets)Value | Value |
|---|
United States | 96.5% | Ireland | 3.0% |
|
| Largest Holdings [Text Block] |
Top 10 Holdings (% of net assets)Holding Name | % of Net Assets |
|---|
NVIDIA Corp. | 8.5% |
|---|
Microsoft Corp. | 7.5% |
|---|
Ares Management Corp. | 5.8% |
|---|
Amazon.com, Inc. | 5.3% |
|---|
JPMorgan Chase & Co. | 5.0% |
|---|
Visa, Inc. | 4.9% |
|---|
Alphabet, Inc. | 4.9% |
|---|
Progressive Corp. (The) | 4.8% |
|---|
Apple, Inc. | 4.7% |
|---|
TJX Cos., Inc. (The) | 4.6% |
|---|
|
| Material Fund Change [Text Block] |
This is a summary of certain changes to the Fund since January 1, 2025. For more complete information, you may review the Fund’s current prospectus, as supplemented, at www.cisbh.com/funds or upon request at (800)392-2673. The parent company of the Fund’s adviser entered into a definitive agreement to take the parent company private, which resulted in a change of control of the adviser. There are no plans to make any changes to the Fund resulting from this transaction. |
| Updated Prospectus Web Address |
www.cisbh.com/funds/literature
|
| C000244699 |
|
| Shareholder Report [Line Items] |
|
| Fund Name |
Barrett Opportunity Fund
|
| Trading Symbol |
SAOPX
|
| Annual or Semi-Annual Statement [Text Block] |
This semi-annual shareholder report contains important information about Barrett Opportunity Fund (the "Fund") for the period of January 1, 2025 to June 30, 2025.
|
| Shareholder Report Annual or Semi-Annual |
Semi-Annual Shareholder Report
|
| Additional Information [Text Block] |
You can find additional information about the Fund at www.cisbh.com/funds/literature. You can also request this information by contacting us at (800) 392-2673.
|
| Material Fund Change Notice [Text Block] |
This report describes changes to the Fund that occurred during the fiscal year ending December 31, 2025.
|
| Additional Information Phone Number |
(800) 392-2673
|
| Additional Information Website |
www.cisbh.com/funds/literature
|
| Expenses [Text Block] |
What were the Fund’s annualized costs for the last six months?(based on a hypothetical $10,000 investment) Class Name | Costs of a $10,000 investment | Costs paid as a percentage of a $10,000 investment |
|---|
Retail | $48 | 0.99% |
|---|
|
| Expenses Paid, Amount |
$ 48
|
| Expense Ratio, Percent |
0.99%
|
| Factors Affecting Performance [Text Block] |
How did the Fund perform during the reporting period? Fund Performance For the first six months of 2025, the Fund returned -3.46% against a return of 6.20% for the Fund’s broad-based securities market index, the S&P 500® Index. Contributors to Return The three sectors that contributed most to the Fund’s returns on an absolute basis were Industrials, Information Technology, and Energy. After a short pause, investors regained confidence in AI, rewarding the information technology sector. The three individual securities that contributed the most on an absolute basis were Microsoft Corp., Bank of New York Mellon Corp., and General Dynamics Corp. Microsoft continues to monetize the AI trend. Detractors from Return The three sectors that detracted most from the Fund’s returns on an absolute basis were Financials, Consumer Discretionary, and Communication Services. Investors were concerned that tariffs would negatively impact consumption trends, which weighed on the Consumer Discretionary sector during the period. The three individual securities that detracted the most on an absolute basis were Jefferies Financial Group, Inc., Murphy USA, Inc., and Apple, Inc. Prospects of a lower interest rate environment was a challenge for investment banks such as Jefferies. |
| Line Graph [Table Text Block] |
| Barrett Opportunity | S&P 500® Index |
|---|
Jun-2015 | $10,000 | $10,000 |
|---|
Jun-2016 | $10,691 | $10,399 |
|---|
Jun-2017 | $13,147 | $12,260 |
|---|
Jun-2018 | $14,235 | $14,023 |
|---|
Jun-2019 | $14,341 | $15,483 |
|---|
Jun-2020 | $13,728 | $16,645 |
|---|
Jun-2021 | $18,195 | $23,436 |
|---|
Jun-2022 | $18,438 | $20,948 |
|---|
Jun-2023 | $20,680 | $25,053 |
|---|
Jun-2024 | $25,783 | $31,204 |
|---|
Jun-2025 | $27,070 | $35,936 |
|---|
|
| Average Annual Return [Table Text Block] |
| 1 Year | 5 Years | 10 Years |
|---|
Barrett Opportunity | 4.99% | 14.54% | 10.47% |
|---|
S&P 500® Index | 15.16% | 16.64% | 13.65% |
|---|
|
| AssetsNet |
$ 22,471,683
|
| Holdings Count | Holding |
19
|
| Advisory Fees Paid, Amount |
$ 33,906
|
| InvestmentCompanyPortfolioTurnover |
2.00%
|
| Additional Fund Statistics [Text Block] |
Net Assets | $22,471,683 |
|---|
Number of Portfolio Holdings | 19 |
|---|
Portfolio Turnover | 2% |
|---|
Total Advisory Fees Paid* | $33,906 |
|---|
Total Advisory Fees Paid %* | 0.30% |
|---|
* Net of expenses waived by investment adviser |
| Holdings [Text Block] |
Sector Weighting (% of net assets)Value | Value |
|---|
Financials | 28.2% | Industrials | 19.5% | Information Technology | 17.0% | Energy | 12.8% | Communication Services | 8.8% | Consumer Discretionary | 8.0% | Health Care | 3.7% | Consumer Staples | 0.9% |
Country Weighting (% of net assets)Value | Value |
|---|
United States | 89.3% | United Kingdom | 9.6% |
|
| Largest Holdings [Text Block] |
Top 10 Holdings (% of net assets)Holding Name | % of Net Assets |
|---|
General Dynamics Corp. | 13.0% |
|---|
Jefferies Financial Group, Inc. | 11.2% |
|---|
Microsoft Corp. | 11.1% |
|---|
Bank of New York Mellon Corp. (The) | 10.8% |
|---|
Shell PLC | 9.6% |
|---|
Alphabet, Inc. | 8.8% |
|---|
Murphy USA, Inc. | 6.9% |
|---|
Apple, Inc. | 5.9% |
|---|
Automatic Data Processing, Inc. | 5.7% |
|---|
Ares Management Corp. | 3.6% |
|---|
|
| Material Fund Change [Text Block] |
This is a summary of certain changes to the Fund since January 1, 2025. For more complete information, you may review the Fund’s current prospectus, as supplemented, at www.cisbh.com/funds or upon request at (800)392-2673. The parent company of the Fund’s adviser entered into a definitive agreement to take the parent company private, which resulted in a change of control of the adviser. There are no plans to make any changes to the Fund resulting from this transaction. |
| Updated Prospectus Web Address |
www.cisbh.com/funds/literature
|
| C000243104 |
|
| Shareholder Report [Line Items] |
|
| Fund Name |
Segall Bryant & Hamill Select Equity ETF
|
| Trading Symbol |
USSE
|
| Annual or Semi-Annual Statement [Text Block] |
This semi-annual shareholder report contains important information about Segall Bryant & Hamill Select Equity ETF (the "Fund") for the period of January 1, 2025 to June 30, 2025.
|
| Shareholder Report Annual or Semi-Annual |
Semi-Annual Shareholder Report
|
| Additional Information [Text Block] |
You can find additional information about the Fund at www.cisbh.com/funds/etfs. You can also request this information by contacting us at (800) 836-4265.
|
| Material Fund Change Notice [Text Block] |
This report describes changes to the Fund that occurred during the fiscal year ending December 31, 2025.
|
| Additional Information Phone Number |
(800) 836-4265
|
| Additional Information Website |
www.cisbh.com/funds/etfs
|
| Expenses [Text Block] |
What were the Fund’s annualized costs for the last six months?(based on a hypothetical $10,000 investment) Fund Name | Costs of a $10,000 investment | Costs paid as a percentage of a $10,000 investment |
|---|
SBH Select Equity ETF | $32 | 0.65% |
|---|
|
| Expenses Paid, Amount |
$ 32
|
| Expense Ratio, Percent |
0.65%
|
| Factors Affecting Performance [Text Block] |
How did the Fund perform during the reporting period? Fund Performance For the first six months of 2025, the Fund returned -1.98% against a return of 6.12% for the Russell 1000® Index and 5.75% for the Fund's broad-based securities market index, the Russell 3000® Index. Contributors to Return The three sectors that contributed most to the Fund’s returns on an absolute basis were Financials, Industrials, and Consumer Discretionary. A recovery in data-center-related companies, along with continued strong performance in aerospace and defense stocks, drove Industrials sector outperformance. The three individual securities that contributed the most on an absolute basis were Microsoft Corp., JPMorgan Chase & Co., and Meta Platforms, Inc. For Meta Platforms, it has been an early winner in generative AI and has been gaining incremental digital advertising revenue share on the back of strong AI monetization and engagement. Detractors from Return The three sectors that detracted most from the Fund’s returns on an absolute basis were Information Technology, Energy, and Health Care. Underperformance in Health Care was linked to regulatory uncertainties and a rotation away from defensive groups in the market. The three individual securities that detracted the most on an absolute basis were Marvell Technology, Inc., Apple, Inc., and UnitedHealth Group, Inc. For Marvell Technology, there were new concerns related to the potential share loss on a high-profile, application-specific semiconductor chip with top customer Amazon.com Inc. |
| Line Graph [Table Text Block] |
| SBH Select Equity ETF - NAV | Russell 1000® Index | Russell 3000® Index |
|---|
08/29/23 | $10,000 | $10,000 | $10,000 |
|---|
06/30/24 | $11,911 | $12,230 | $12,160 |
|---|
06/30/25 | $12,886 | $14,146 | $14,021 |
|---|
|
| Average Annual Return [Table Text Block] |
| 1 Year | Since Inception (08/29/2023) |
|---|
SBH Select Equity ETF - NAV | 8.19% | 14.79% |
|---|
Russell 1000® Index | 15.66% | 20.76% |
|---|
Russell 3000® Index | 15.30% | 20.18% |
|---|
|
| Performance Inception Date |
Aug. 29, 2023
|
| AssetsNet |
$ 263,584,087
|
| Holdings Count | Holding |
20
|
| Advisory Fees Paid, Amount |
$ 650,177
|
| InvestmentCompanyPortfolioTurnover |
72.00%
|
| Additional Fund Statistics [Text Block] |
Net Assets | $263,584,087 |
|---|
Number of Portfolio Holdings | 20 |
|---|
Portfolio Turnover | 72% |
|---|
Total Advisory Fees Paid* | $650,177 |
|---|
Total Advisory Fees Paid %* | 0.53% |
|---|
* Net of expenses waived by investment adviser |
| Holdings [Text Block] |
Sector Weighting (% of net assets)Value | Value |
|---|
Information Technology | 43.4% | Financials | 25.7% | Communication Services | 14.1% | Industrials | 9.4% | Consumer Discretionary | 5.3% |
Country Weighting (% of net assets)Value | Value |
|---|
United States | 94.8% | Germany | 3.1% |
|
| Largest Holdings [Text Block] |
Top 10 Holdings (% of net assets)Holding Name | % of Net Assets |
|---|
Microsoft Corp. | 7.4% |
|---|
Alphabet, Inc. | 7.3% |
|---|
Meta Platforms, Inc. | 6.8% |
|---|
Visa, Inc. | 6.7% |
|---|
Apple, Inc. | 5.5% |
|---|
Amazon.com, Inc. | 5.3% |
|---|
Globe Life, Inc. | 5.2% |
|---|
Reinsurance Group of America, Inc. | 5.0% |
|---|
JPMorgan Chase & Co. | 4.9% |
|---|
Marvell Technology, Inc. | 4.8% |
|---|
|
| Material Fund Change [Text Block] |
This is a summary of certain changes to the Fund since January 1, 2025. For more complete information, you may review the Fund’s current prospectus, as supplemented, at www.cisbh.com/funds or upon request at (800)392-2673. The parent company of the Fund’s adviser entered into a definitive agreement to take the parent company private, which resulted in a change of control of the adviser. There are no plans to make any changes to the Fund resulting from this transaction. |
| Updated Prospectus Web Address |
www.cisbh.com/funds/etfs
|