Shareholder Report
Jun. 30, 2025
USD ($)
$ / shares
WHAT WERE THE FUND COSTS FOR THE PAST YEAR? (based on a hypothetical $10,000 investment)
|
Class Name
|
Costs of a $10,000 investment
|
Costs paid as a percentage of a $10,000 investment
|
|
Institutional Shares
|
$76
|
0.71%
|
HOW DID THE FUND PERFORM LAST YEAR AND WHAT AFFECTED ITS PERFORMANCE?
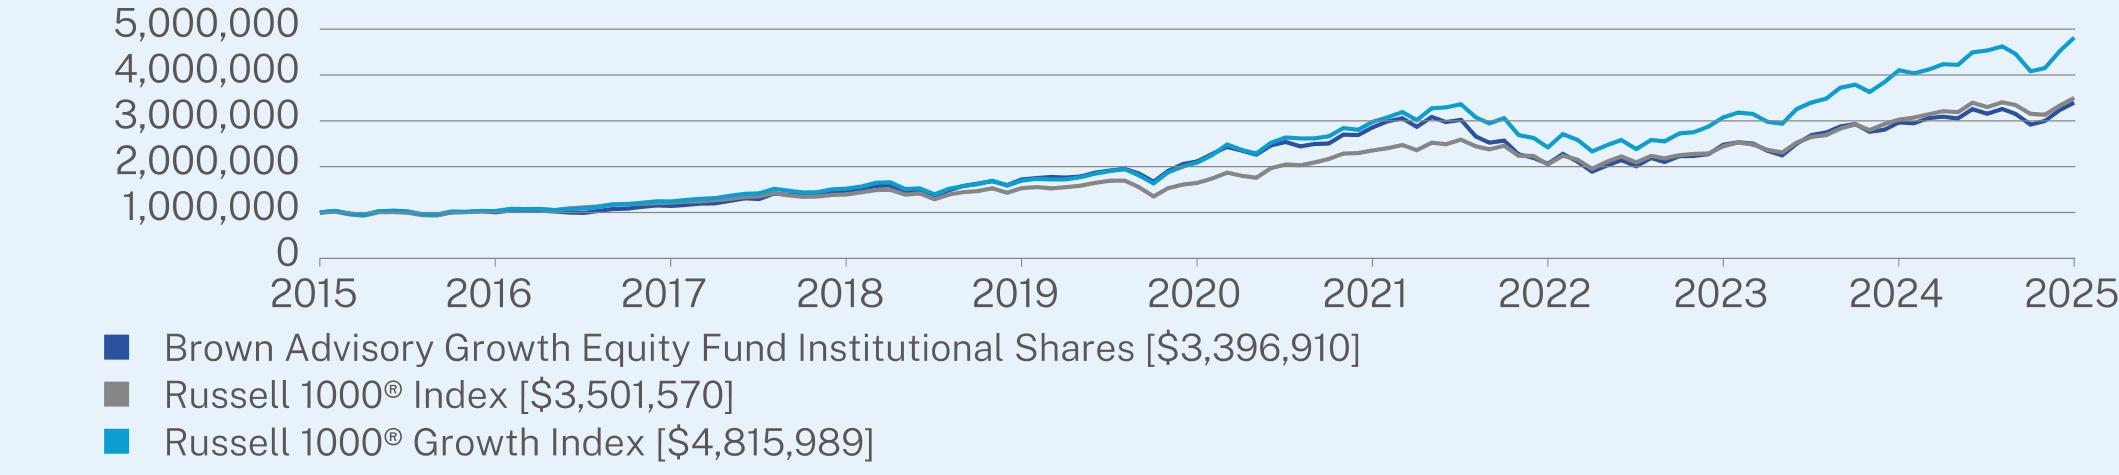
For the 12-month period ended June 30, 2025, the Fund underperformed its benchmark, the Russell 1000® Index.
WHAT FACTORS INFLUENCED PERFORMANCE
The Fund’s underperformance was driven primarily by the Information Technology sector, mainly due to not owning Broadcom. While we recognize the strength of Broadcom’s business model, we believe the company’s most compelling growth segments—such as data center optics and semi-custom data center silicon—are also core areas of expertise for Marvell, a current Fund holding. The Industrials sector was the best-performing sector both in absolute terms and relative to the benchmark, driven by Uber Technologies, a global mobility platform. The stock has traded sharply higher in 2025 as Uber continues to demonstrate strength in its core rideshare and delivery businesses.
POSITIONING
The Fund’s allocation to Communication Services shifted from an underweight to an overweight position during the period, primarily due to the addition of Meta Platforms, Trade Desk, and Netflix. The Fund’s exposure to Health Care decreased during the period as a result of exiting positions in Thermo Fisher Scientific, Edwards Lifesciences, and Align Technology. Align Technology continues to face subdued revenue growth as macroeconomic uncertainty weighs on consumers’ willingness to spend on discretionary items like teeth aligners, particularly in the adult category.
|
Top Contributors
|
|
|
↑
|
Netflix, Inc.
|
|
↑
|
NVIDIA Corporation
|
|
↑
|
ServiceNow, Inc.
|
|
↑
|
Uber Technologies, Inc.
|
|
↑
|
Progressive Corporation
|
|
Top Detractors
|
|
|
↓
|
Edwards Lifesciences Corporation
|
|
↓
|
Trade Desk, Inc. Class A
|
|
↓
|
Adobe Inc.
|
|
↓
|
Align Technology, Inc.
|
|
↓
|
West Pharmaceutical Services, Inc.
|
PERFORMANCE
The Fund delivered strong absolute performance during the period, underperforming the benchmark.
ANNUAL AVERAGE TOTAL RETURN (%)
|
|
1 Year
|
5 Year
|
10 Year
|
|
Institutional Shares
|
14.50
|
9.93
|
13.01
|
|
Russell 1000® Index
|
15.66
|
16.30
|
13.35
|
|
Russell 1000® Growth Index
|
17.32
|
18.17
|
17.02
|
Visit https://www.brownadvisory.com/mf/funds/growth-equity-fund for recent performance information.
KEY FUND STATISTICS (as of June 30, 2025)
|
Net Assets
|
$644,860,049
|
|
Number of Holdings
|
34
|
|
Net Advisory Fee
|
$5,213,858
|
|
Portfolio Turnover
|
27%
|
|
Top Sectors*
|
(%)
|
|
Information Technology
|
34.1%
|
|
Industrials
|
16.0%
|
|
Communication Services
|
13.3%
|
|
Consumer Discretionary
|
10.3%
|
|
Health Care
|
9.3%
|
|
Financials
|
8.2%
|
|
Consumer Staples
|
4.1%
|
|
Real Estate
|
2.4%
|
|
Cash & Other
|
2.3%
|
|
Top 10 Issuers
|
(%)
|
|
NVIDIA Corp.
|
5.1%
|
|
Microsoft Corp.
|
4.5%
|
|
Amazon.com, Inc.
|
4.4%
|
|
Netflix, Inc.
|
4.2%
|
|
Meta Platforms, Inc.
|
4.2%
|
|
Costco Wholesale Corp.
|
4.1%
|
|
Uber Technologies, Inc.
|
4.1%
|
|
Hilton Worldwide Holdings, Inc.
|
3.9%
|
|
Mastercard, Inc.
|
3.8%
|
|
Intuit, Inc.
|
3.7%
|
WHAT WERE THE FUND COSTS FOR THE PAST YEAR? (based on a hypothetical $10,000 investment)
|
Class Name
|
Costs of a $10,000 investment
|
Costs paid as a percentage of a $10,000 investment
|
|
Investor Shares
|
$92
|
0.86%
|
HOW DID THE FUND PERFORM LAST YEAR AND WHAT AFFECTED ITS PERFORMANCE?
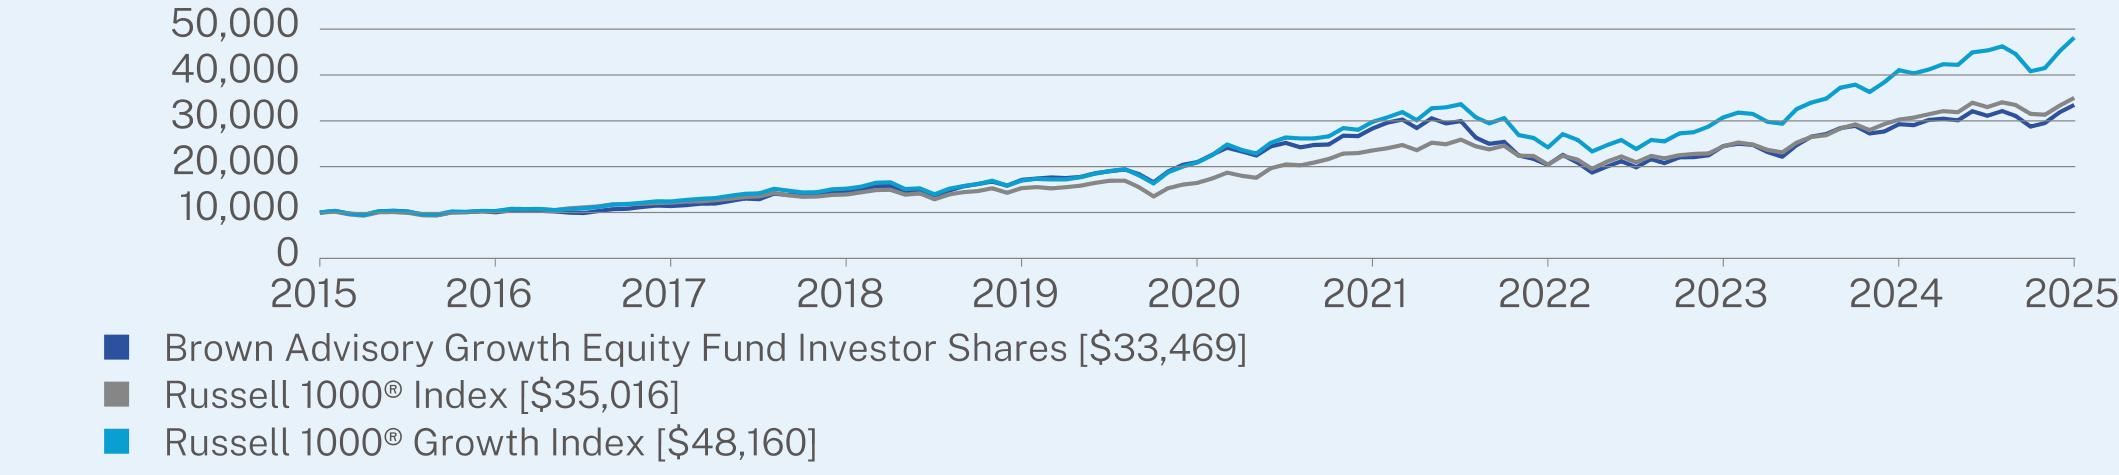
For the 12-month period ended June 30, 2025, the Fund underperformed its benchmark, the Russell 1000® Index.
WHAT FACTORS INFLUENCED PERFORMANCE
The Fund’s underperformance was driven primarily by the Information Technology sector, mainly due to not owning Broadcom. While we recognize the strength of Broadcom’s business model, we believe the company’s most compelling growth segments—such as data center optics and semi-custom data center silicon—are also core areas of expertise for Marvell, a current Fund holding. The Industrials sector was the best-performing sector both in absolute terms and relative to the benchmark, driven by Uber Technologies, a global mobility platform. The stock has traded sharply higher in 2025 as Uber continues to demonstrate strength in its core rideshare and delivery businesses.
POSITIONING
The Fund’s allocation to Communication Services shifted from an underweight to an overweight position during the period, primarily due to the addition of Meta Platforms, Trade Desk, and Netflix. The Fund’s exposure to Health Care decreased during the period as a result of exiting positions in Thermo Fisher Scientific, Edwards Lifesciences, and Align Technology. Align Technology continues to face subdued revenue growth as macroeconomic uncertainty weighs on consumers’ willingness to spend on discretionary items like teeth aligners, particularly in the adult category.
|
Top Contributors
|
|
|
↑
|
Netflix, Inc.
|
|
↑
|
NVIDIA Corporation
|
|
↑
|
ServiceNow, Inc.
|
|
↑
|
Uber Technologies, Inc.
|
|
↑
|
Progressive Corporation
|
|
Top Detractors
|
|
|
↓
|
Edwards Lifesciences Corporation
|
|
↓
|
Trade Desk, Inc. Class A
|
|
↓
|
Adobe Inc.
|
|
↓
|
Align Technology, Inc.
|
|
↓
|
West Pharmaceutical Services, Inc.
|
PERFORMANCE
The Fund delivered strong absolute performance during the period, underperforming the benchmark.
ANNUAL AVERAGE TOTAL RETURN (%)
|
|
1 Year
|
5 Year
|
10 Year
|
|
Investor Shares
|
14.34
|
9.77
|
12.84
|
|
Russell 1000® Index
|
15.66
|
16.30
|
13.35
|
|
Russell 1000® Growth Index
|
17.32
|
18.17
|
17.02
|
Visit https://www.brownadvisory.com/mf/funds/growth-equity-fund for recent performance information.
KEY FUND STATISTICS (as of June 30, 2025)
|
Net Assets
|
$644,860,049
|
|
Number of Holdings
|
34
|
|
Net Advisory Fee
|
$5,213,858
|
|
Portfolio Turnover
|
27%
|
|
Top Sectors*
|
(%)
|
|
Information Technology
|
34.1%
|
|
Industrials
|
16.0%
|
|
Communication Services
|
13.3%
|
|
Consumer Discretionary
|
10.3%
|
|
Health Care
|
9.3%
|
|
Financials
|
8.2%
|
|
Consumer Staples
|
4.1%
|
|
Real Estate
|
2.4%
|
|
Cash & Other
|
2.3%
|
|
Top 10 Issuers
|
(%)
|
|
NVIDIA Corp.
|
5.1%
|
|
Microsoft Corp.
|
4.5%
|
|
Amazon.com, Inc.
|
4.4%
|
|
Netflix, Inc.
|
4.2%
|
|
Meta Platforms, Inc.
|
4.2%
|
|
Costco Wholesale Corp.
|
4.1%
|
|
Uber Technologies, Inc.
|
4.1%
|
|
Hilton Worldwide Holdings, Inc.
|
3.9%
|
|
Mastercard, Inc.
|
3.8%
|
|
Intuit, Inc.
|
3.7%
|
WHAT WERE THE FUND COSTS FOR THE PAST YEAR? (based on a hypothetical $10,000 investment)
|
Class Name
|
Costs of a $10,000 investment
|
Costs paid as a percentage of a $10,000 investment
|
|
Advisor Shares
|
$119
|
1.11%
|
HOW DID THE FUND PERFORM LAST YEAR AND WHAT AFFECTED ITS PERFORMANCE?
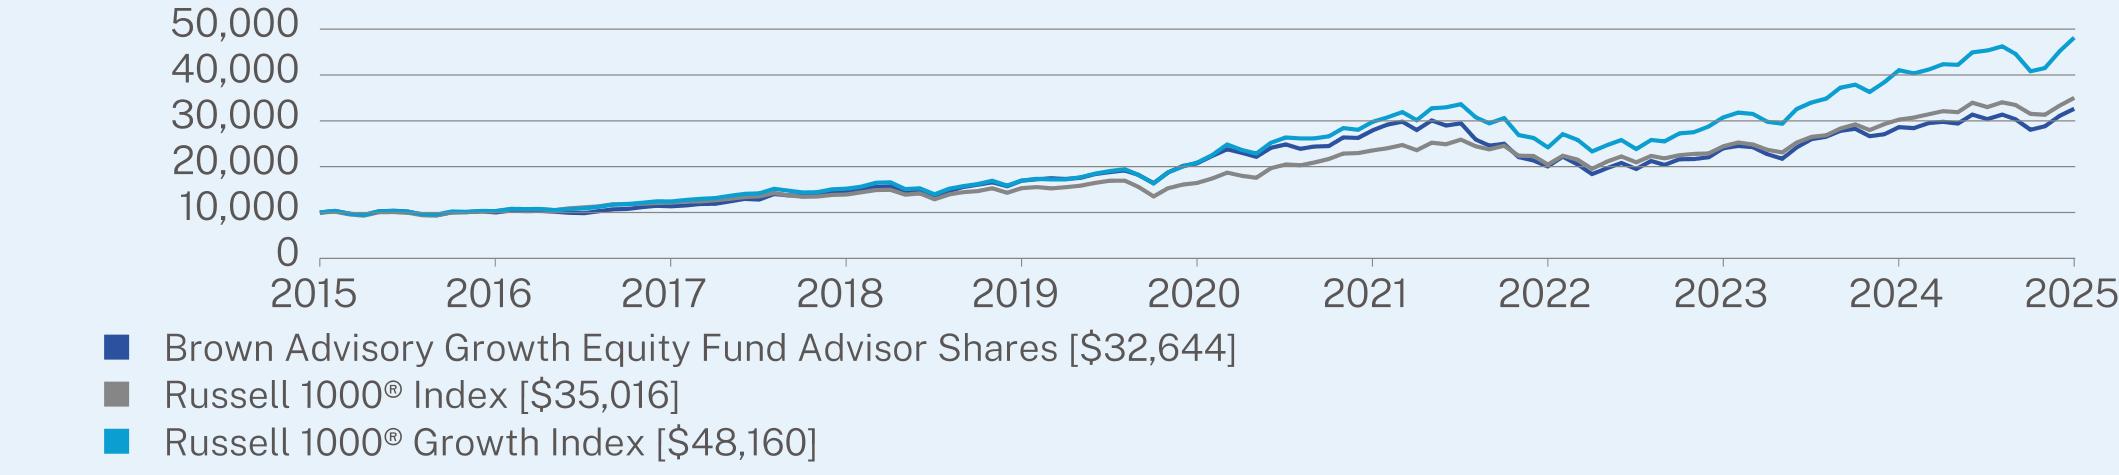
For the 12-month period ended June 30, 2025, the Fund underperformed its benchmark, the Russell 1000® Index.
WHAT FACTORS INFLUENCED PERFORMANCE
The Fund’s underperformance was driven primarily by the Information Technology sector, mainly due to not owning Broadcom. While we recognize the strength of Broadcom’s business model, we believe the company’s most compelling growth segments—such as data center optics and semi-custom data center silicon—are also core areas of expertise for Marvell, a current Fund holding. The Industrials sector was the best-performing sector both in absolute terms and relative to the benchmark, driven by Uber Technologies, a global mobility platform. The stock has traded sharply higher in 2025 as Uber continues to demonstrate strength in its core rideshare and delivery businesses.
POSITIONING
The Fund’s allocation to Communication Services shifted from an underweight to an overweight position during the period, primarily due to the addition of Meta Platforms, Trade Desk, and Netflix. The Fund’s exposure to Health Care decreased during the period as a result of exiting positions in Thermo Fisher Scientific, Edwards Lifesciences, and Align Technology. Align Technology continues to face subdued revenue growth as macroeconomic uncertainty weighs on consumers’ willingness to spend on discretionary items like teeth aligners, particularly in the adult category.
|
Top Contributors
|
|
|
↑
|
Netflix, Inc.
|
|
↑
|
NVIDIA Corporation
|
|
↑
|
ServiceNow, Inc.
|
|
↑
|
Uber Technologies, Inc.
|
|
↑
|
Progressive Corporation
|
|
Top Detractors
|
|
|
↓
|
Edwards Lifesciences Corporation
|
|
↓
|
Trade Desk, Inc. Class A
|
|
↓
|
Adobe Inc.
|
|
↓
|
Align Technology, Inc.
|
|
↓
|
West Pharmaceutical Services, Inc.
|
PERFORMANCE
The Fund delivered strong absolute performance during the period, underperforming the benchmark.
ANNUAL AVERAGE TOTAL RETURN (%)
|
|
1 Year
|
5 Year
|
10 Year
|
|
Advisor Shares
|
14.04
|
9.50
|
12.56
|
|
Russell 1000® Index
|
15.66
|
16.30
|
13.35
|
|
Russell 1000® Growth Index
|
17.32
|
18.17
|
17.02
|
Visit https://www.brownadvisory.com/mf/funds/growth-equity-fund for recent performance information.
KEY FUND STATISTICS (as of June 30, 2025)
|
Net Assets
|
$644,860,049
|
|
Number of Holdings
|
34
|
|
Net Advisory Fee
|
$5,213,858
|
|
Portfolio Turnover
|
27%
|
|
Top Sectors*
|
(%)
|
|
Information Technology
|
34.1%
|
|
Industrials
|
16.0%
|
|
Communication Services
|
13.3%
|
|
Consumer Discretionary
|
10.3%
|
|
Health Care
|
9.3%
|
|
Financials
|
8.2%
|
|
Consumer Staples
|
4.1%
|
|
Real Estate
|
2.4%
|
|
Cash & Other
|
2.3%
|
|
Top 10 Issuers
|
(%)
|
|
NVIDIA Corp.
|
5.1%
|
|
Microsoft Corp.
|
4.5%
|
|
Amazon.com, Inc.
|
4.4%
|
|
Netflix, Inc.
|
4.2%
|
|
Meta Platforms, Inc.
|
4.2%
|
|
Costco Wholesale Corp.
|
4.1%
|
|
Uber Technologies, Inc.
|
4.1%
|
|
Hilton Worldwide Holdings, Inc.
|
3.9%
|
|
Mastercard, Inc.
|
3.8%
|
|
Intuit, Inc.
|
3.7%
|
WHAT WERE THE FUND COSTS FOR THE PAST YEAR? (based on a hypothetical $10,000 investment)
|
Class Name
|
Costs of a $10,000 investment
|
Costs paid as a percentage of a $10,000 investment
|
|
Institutional Shares
|
$56
|
0.52%
|
HOW DID THE FUND PERFORM LAST YEAR AND WHAT AFFECTED ITS PERFORMANCE?
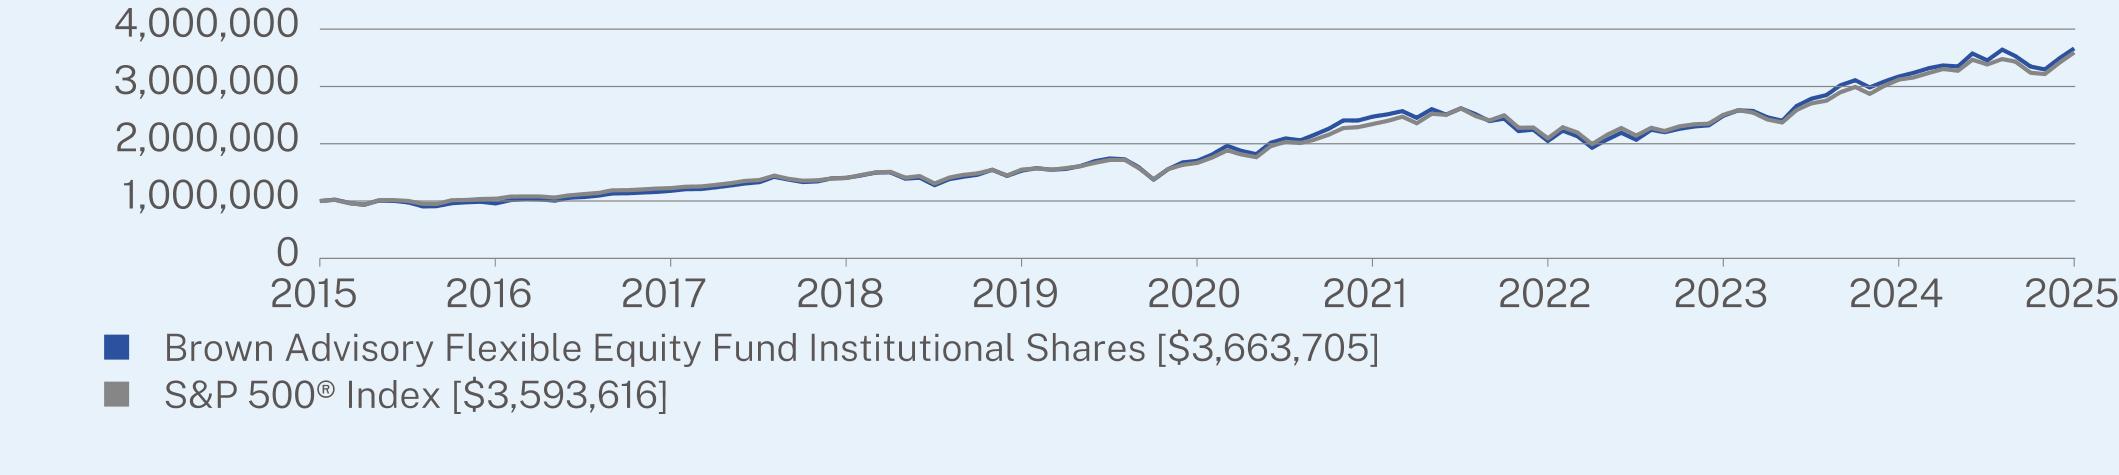
For the 12-month period ended June 30, 2025, the Fund outperformed its benchmark, the S&P 500® Index.
While the market’s finish to the year was strong, the journey from start to finish was far from smooth. The period saw a sharp 19% drawdown from its February high on April 8th, primarily driven by fears of an all-out trade war. However, the S&P 500® Index recovered from its April low and the year ended at a new high.
WHAT FACTORS INFLUENCED PERFORMANCE
Sector allocation had a larger effect on the portfolio. The performance of the Fund was driven by Consumer Discretionary, Energy and Financials sectors. Meta Platforms, Amer Sports and Visa were top contributors. The Health Care sector was the Fund’s largest detractor. Within the sector, UnitedHealth Group detracted the most from the return.
POSITIONING
The Consumer Staples sector weighting increased with the addition of Mondelez International. The Energy sector weighting fell with the sale of Baker Hughes. The Health Care weighting was lower with the decline in the sector return and the elimination of Agilent Technologies and Merck & Co. The Industrials weighting was higher with the new investment in Old Dominion Freight Line as well as additions to existing holdings. In Real Estate, we eliminated SBA Communications bringing the sector weighting down to zero.
|
Top Contributors
|
|
|
↑
|
Meta Platforms Inc Class A
|
|
↑
|
Amer Sports, Inc.
|
|
↑
|
Visa Inc. Class A
|
|
↑
|
KKR & Co Inc
|
|
↑
|
Taiwan Semiconductor Manufacturing Co., Ltd. Sponsored ADR
|
|
Top Detractors
|
|
|
↓
|
UnitedHealth Group Incorporated
|
|
↓
|
Elevance Health, Inc.
|
|
↓
|
Adobe Inc.
|
|
↓
|
Edwards Lifesciences Corporation
|
|
↓
|
Illumina, Inc.
|
PERFORMANCE
The Fund’s return exceeded the S&P 500® Index.
ANNUAL AVERAGE TOTAL RETURN (%)
|
|
1 Year
|
5 Year
|
10 Year
|
|
Institutional Shares
|
15.41
|
16.56
|
13.87
|
|
S&P 500® Index
|
15.16
|
16.64
|
13.65
|
Visit https://www.brownadvisory.com/mf/funds/flexible-equity-fund for recent performance information.
KEY FUND STATISTICS (as of June 30, 2025)
|
Net Assets
|
$1,031,226,798
|
|
Number of Holdings
|
46
|
|
Net Advisory Fee
|
$4,143,680
|
|
Portfolio Turnover
|
17%
|
|
Top Sectors*
|
(%)
|
|
Financials
|
27.1%
|
|
Information Technology
|
24.0%
|
|
Communication Services
|
12.1%
|
|
Consumer Discretionary
|
11.6%
|
|
Industrials
|
10.4%
|
|
Health Care
|
8.8%
|
|
Consumer Staples
|
2.1%
|
|
Energy
|
1.9%
|
|
Cash & Other
|
2.0%
|
|
Top 10 Issuers
|
(%)
|
|
Microsoft Corp.
|
7.3%
|
|
Meta Platforms, Inc.
|
6.1%
|
|
Alphabet, Inc.
|
4.8%
|
|
Visa, Inc.
|
4.7%
|
|
Mastercard, Inc.
|
4.4%
|
|
Taiwan Semiconductor Manufacturing Co., Ltd.
|
4.3%
|
|
Amazon.com, Inc.
|
4.3%
|
|
KKR & Co., Inc.
|
4.2%
|
|
Berkshire Hathaway, Inc.
|
3.6%
|
|
Intuit, Inc.
|
2.9%
|
WHAT WERE THE FUND COSTS FOR THE PAST YEAR? (based on a hypothetical $10,000 investment)
|
Class Name
|
Costs of a $10,000 investment
|
Costs paid as a percentage of a $10,000 investment
|
|
Investor Shares
|
$72
|
0.67%
|
HOW DID THE FUND PERFORM LAST YEAR AND WHAT AFFECTED ITS PERFORMANCE?
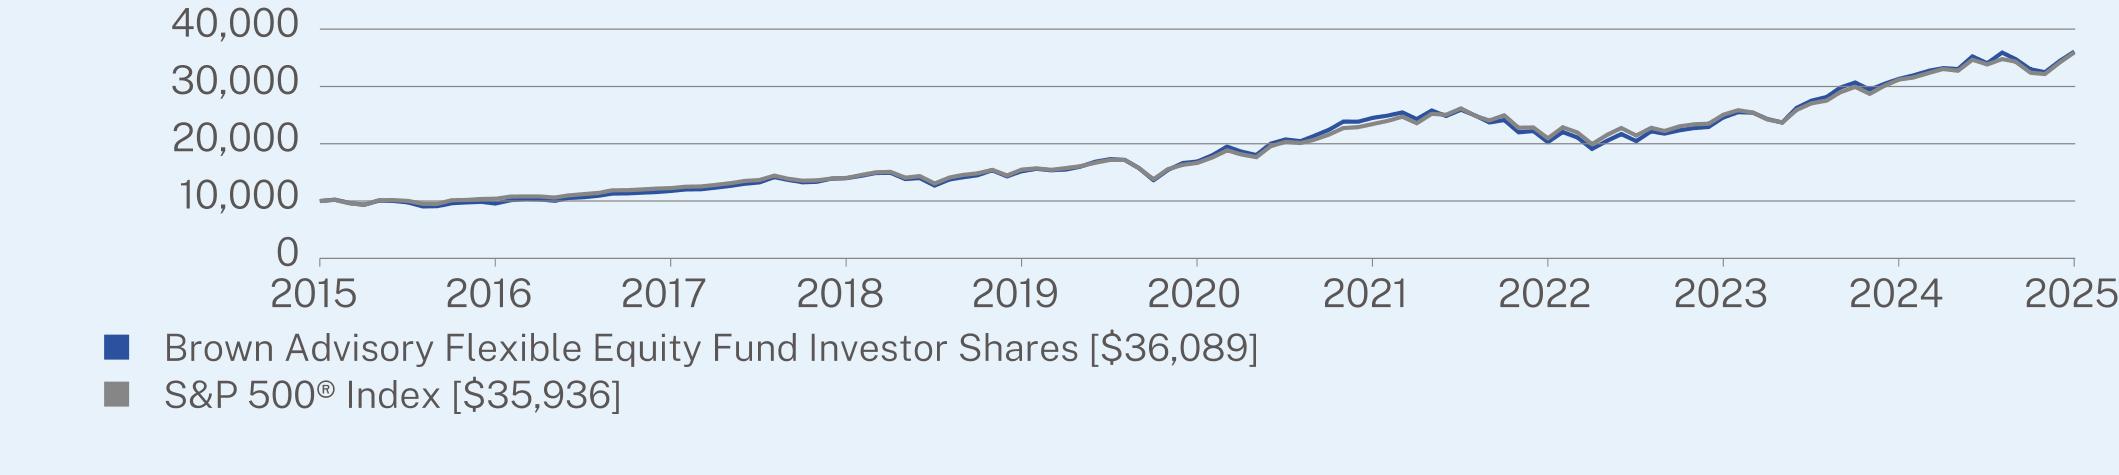
For the 12-month period ended June 30, 2025, the Fund outperformed its benchmark, the S&P 500® Index.
While the market’s finish to the year was strong, the journey from start to finish was far from smooth. The period saw a sharp 19% drawdown from its February high on April 8th, primarily driven by fears of an all-out trade war. However, the S&P 500® Index recovered from its April low and the year ended at a new high.
WHAT FACTORS INFLUENCED PERFORMANCE
Sector allocation had a larger effect on the portfolio. The performance of the Fund was driven by Consumer Discretionary, Energy and Financials sectors. Meta Platforms, Amer Sports and Visa were top contributors. The Health Care sector was the Fund’s largest detractor. Within the sector, UnitedHealth Group detracted the most from the return.
POSITIONING
The Consumer Staples sector weighting increased with the addition of Mondelez International. The Energy sector weighting fell with the sale of Baker Hughes. The Health Care weighting was lower with the decline in the sector return and the elimination of Agilent Technologies and Merck & Co. The Industrials weighting was higher with the new investment in Old Dominion Freight Line as well as additions to existing holdings. In Real Estate, we eliminated SBA Communications bringing the sector weighting down to zero.
|
Top Contributors
|
|
|
↑
|
Meta Platforms Inc Class A
|
|
↑
|
Amer Sports, Inc.
|
|
↑
|
Visa Inc. Class A
|
|
↑
|
KKR & Co Inc
|
|
↑
|
Taiwan Semiconductor Manufacturing Co., Ltd. Sponsored ADR
|
|
Top Detractors
|
|
|
↓
|
UnitedHealth Group Incorporated
|
|
↓
|
Elevance Health, Inc.
|
|
↓
|
Adobe Inc.
|
|
↓
|
Edwards Lifesciences Corporation
|
|
↓
|
Illumina, Inc.
|
PERFORMANCE
The Fund’s return exceeded the S&P 500® Index.
ANNUAL AVERAGE TOTAL RETURN (%)
|
|
1 Year
|
5 Year
|
10 Year
|
|
Investor Shares
|
15.22
|
16.39
|
13.69
|
|
S&P 500® Index
|
15.16
|
16.64
|
13.65
|
Visit https://www.brownadvisory.com/mf/funds/flexible-equity-fund for recent performance information.
KEY FUND STATISTICS (as of June 30, 2025)
|
Net Assets
|
$1,031,226,798
|
|
Number of Holdings
|
46
|
|
Net Advisory Fee
|
$4,143,680
|
|
Portfolio Turnover
|
17%
|
|
Top Sectors*
|
(%)
|
|
Financials
|
27.1%
|
|
Information Technology
|
24.0%
|
|
Communication Services
|
12.1%
|
|
Consumer Discretionary
|
11.6%
|
|
Industrials
|
10.4%
|
|
Health Care
|
8.8%
|
|
Consumer Staples
|
2.1%
|
|
Energy
|
1.9%
|
|
Cash & Other
|
2.0%
|
|
Top 10 Issuers
|
(%)
|
|
Microsoft Corp.
|
7.3%
|
|
Meta Platforms, Inc.
|
6.1%
|
|
Alphabet, Inc.
|
4.8%
|
|
Visa, Inc.
|
4.7%
|
|
Mastercard, Inc.
|
4.4%
|
|
Taiwan Semiconductor Manufacturing Co., Ltd.
|
4.3%
|
|
Amazon.com, Inc.
|
4.3%
|
|
KKR & Co., Inc.
|
4.2%
|
|
Berkshire Hathaway, Inc.
|
3.6%
|
|
Intuit, Inc.
|
2.9%
|
WHAT WERE THE FUND COSTS FOR THE PAST YEAR? (based on a hypothetical $10,000 investment)
|
Class Name
|
Costs of a $10,000 investment
|
Costs paid as a percentage of a $10,000 investment
|
|
Advisor Shares
|
$99
|
0.92%
|
HOW DID THE FUND PERFORM LAST YEAR AND WHAT AFFECTED ITS PERFORMANCE?
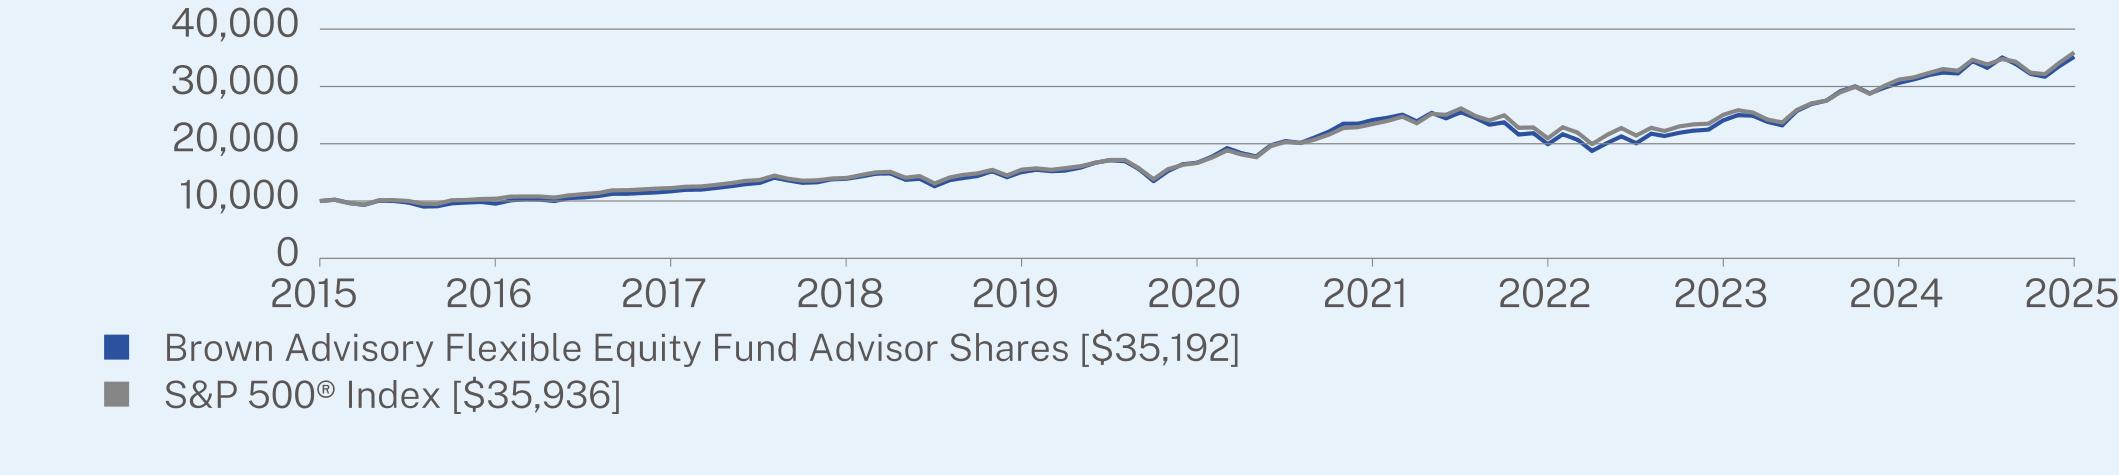
For the 12-month period ended June 30, 2025, the Fund underperformed its benchmark, the S&P 500® Index.
While the market’s finish to the year was strong, the journey from start to finish was far from smooth. The period saw a sharp 19% drawdown from its February high on April 8th, primarily driven by fears of an all-out trade war. However, the S&P 500® Index recovered from its April low and the year ended at a new high.
WHAT FACTORS INFLUENCED PERFORMANCE
Sector allocation had a larger effect on the portfolio. The performance of the Fund was driven by Consumer Discretionary, Energy and Financials sectors. Meta Platforms, Amer Sports and Visa were top contributors. The Health Care sector was the Fund’s largest detractor. Within the sector, UnitedHealth Group detracted the most from the return.
POSITIONING
The Consumer Staples sector weighting increased with the addition of Mondelez International. The Energy sector weighting fell with the sale of Baker Hughes. The Health Care weighting was lower with the decline in the sector return and the elimination of Agilent Technologies and Merck & Co. The Industrials weighting was higher with the new investment in Old Dominion Freight Line as well as additions to existing holdings. In Real Estate, we eliminated SBA Communications bringing the sector weighting down to zero.
|
Top Contributors
|
|
|
↑
|
Meta Platforms Inc Class A
|
|
↑
|
Amer Sports, Inc.
|
|
↑
|
Visa Inc. Class A
|
|
↑
|
KKR & Co Inc
|
|
↑
|
Taiwan Semiconductor Manufacturing Co., Ltd. Sponsored ADR
|
|
Top Detractors
|
|
|
↓
|
UnitedHealth Group Incorporated
|
|
↓
|
Elevance Health, Inc.
|
|
↓
|
Adobe Inc.
|
|
↓
|
Edwards Lifesciences Corporation
|
|
↓
|
Illumina, Inc.
|
PERFORMANCE
The Fund’s return was less than the S&P 500® Index.
ANNUAL AVERAGE TOTAL RETURN (%)
|
|
1 Year
|
5 Year
|
10 Year
|
|
Advisor Shares
|
14.93
|
16.09
|
13.41
|
|
S&P 500® Index
|
15.16
|
16.64
|
13.65
|
Visit https://www.brownadvisory.com/mf/funds/flexible-equity-fund for recent performance information.
KEY FUND STATISTICS (as of June 30, 2025)
|
Net Assets
|
$1,031,226,798
|
|
Number of Holdings
|
46
|
|
Net Advisory Fee
|
$4,143,680
|
|
Portfolio Turnover
|
17%
|
|
Top Sectors*
|
(%)
|
|
Financials
|
27.1%
|
|
Information Technology
|
24.0%
|
|
Communication Services
|
12.1%
|
|
Consumer Discretionary
|
11.6%
|
|
Industrials
|
10.4%
|
|
Health Care
|
8.8%
|
|
Consumer Staples
|
2.1%
|
|
Energy
|
1.9%
|
|
Cash & Other
|
2.0%
|
|
Top 10 Issuers
|
(%)
|
|
Microsoft Corp.
|
7.3%
|
|
Meta Platforms, Inc.
|
6.1%
|
|
Alphabet, Inc.
|
4.8%
|
|
Visa, Inc.
|
4.7%
|
|
Mastercard, Inc.
|
4.4%
|
|
Taiwan Semiconductor Manufacturing Co., Ltd.
|
4.3%
|
|
Amazon.com, Inc.
|
4.3%
|
|
KKR & Co., Inc.
|
4.2%
|
|
Berkshire Hathaway, Inc.
|
3.6%
|
|
Intuit, Inc.
|
2.9%
|
WHAT WERE THE FUND COSTS FOR THE PAST YEAR? (based on a hypothetical $10,000 investment)
|
Class Name
|
Costs of a $10,000 investment
|
Costs paid as a percentage of a $10,000 investment
|
|
Institutional Shares
|
$63
|
0.60%
|
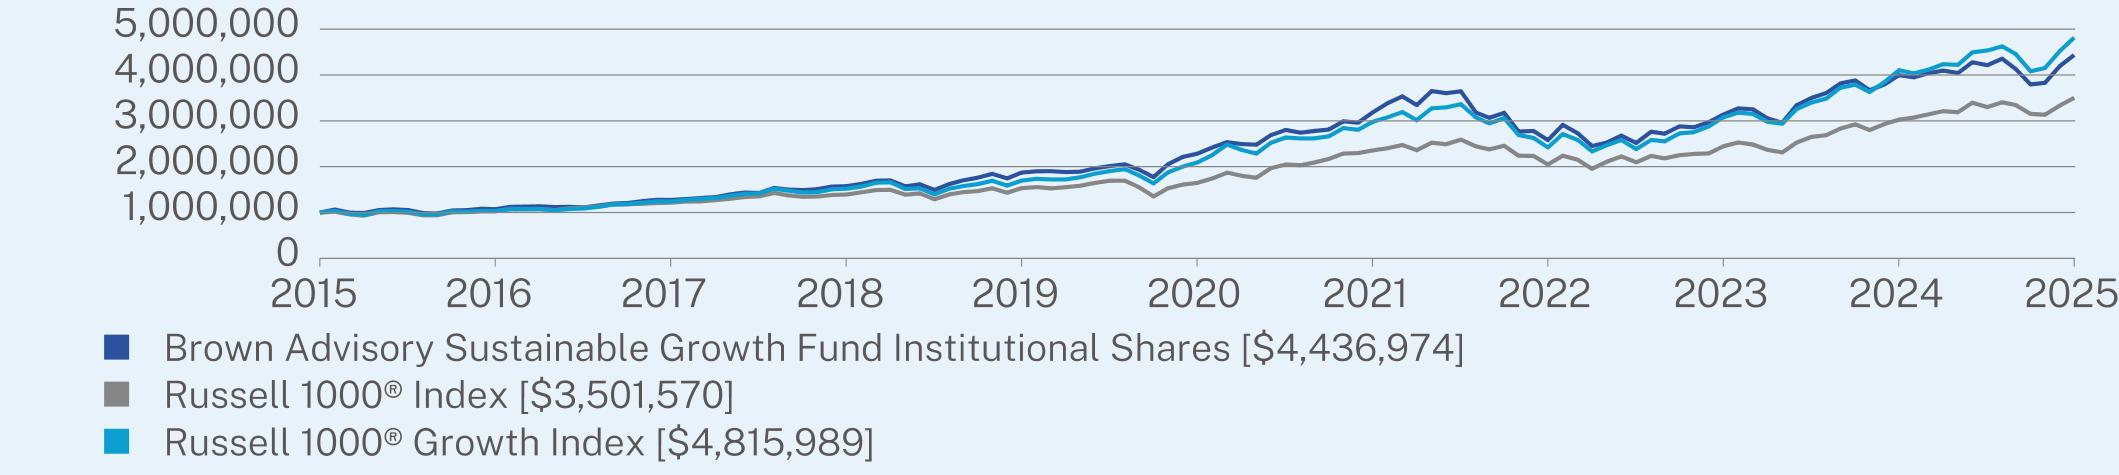
HOW DID THE FUND PERFORM LAST YEAR AND WHAT AFFECTED ITS PERFORMANCE?
For the 12-month period ended June 30, 2025, the Fund underperformed its benchmark, the Russell 1000® Index.
WHAT FACTORS INFLUENCED PERFORMANCE
During the period, sector positioning had a positive effect on relative returns against the Russell 1000® Index, while stock selection was detractive. From a sector allocation perspective, the strategy benefited from its overweight in financials and lack of exposure to energy, which outweighed the negative effects of our underweight to communication services. Inclusive of stock selection and interaction, strong performance from our financials and information technology names was not enough to overcome weakness from our health care and communication services names. Within financials, our favorable positioning and stock selection within the insurance and asset management industries were a key driver of absolute returns, with PGR, AJG, KKR and ARES all among the top performers during the period. The strategy’s sector exposures result from bottom-up stock-picking, not sector preferences or macro inputs.
POSITIONING
Consistent with the strategy’s long-standing portfolio construction philosophy, we continued to balance exposure between durable and rapid growth companies while ensuring diversification by business model, end market, and growth theme. Trading activity increased slightly, with ten name swaps and a number of strategic position re-sizing trades to optimize the ratio of upside potential to downside risk at the security and portfolio levels. We believe these trades represent upgrades to the portfolio that will better position the strategy for future success.
|
Top Contributors
|
|
|
↑
|
NVIDIA Corporation
|
|
↑
|
ServiceNow, Inc.
|
|
↑
|
Visa Inc. Class A
|
|
↑
|
Microsoft Corporation
|
|
↑
|
Progressive Corporation
|
|
Top Detractors
|
|
|
↓
|
Edwards Lifesciences Corporation
|
|
↓
|
West Pharmaceutical Services, Inc.
|
|
↓
|
Trade Desk, Inc. Class A
|
|
↓
|
Danaher Corporation
|
|
↓
|
Thermo Fisher Scientific Inc.
|
PERFORMANCE
The Fund’s underperformance was largely driven by weakness in our health care, consumer discretionary, and communication services names.
ANNUAL AVERAGE TOTAL RETURN (%)
|
|
1 Year
|
5 Year
|
10 Year
|
|
Institutional Shares
|
11.02
|
14.21
|
16.07
|
|
Russell 1000® Index
|
15.66
|
16.30
|
13.35
|
|
Russell 1000® Growth Index
|
17.32
|
18.17
|
17.02
|
Visit https://www.brownadvisory.com/mf/funds/sustainable-growth-fund for recent performance information.
KEY FUND STATISTICS (as of June 30, 2025)
|
Net Assets
|
$9,027,770,024
|
|
Number of Holdings
|
34
|
|
Net Advisory Fee
|
$47,705,230
|
|
Portfolio Turnover
|
32%
|
|
Top Sectors*
|
(%)
|
|
Information Technology
|
45.4%
|
|
Financials
|
19.1%
|
|
Consumer Discretionary
|
11.7%
|
|
Industrials
|
10.9%
|
|
Health Care
|
6.3%
|
|
Communication Services
|
2.9%
|
|
Materials
|
1.7%
|
|
Cash & Other
|
2.0%
|
|
Top 10 Issuers
|
(%)
|
|
NVIDIA Corp.
|
8.8%
|
|
Microsoft Corp.
|
8.6%
|
|
Amazon.com, Inc.
|
7.4%
|
|
Intuit, Inc.
|
4.4%
|
|
Visa, Inc.
|
4.0%
|
|
KKR & Co., Inc.
|
3.9%
|
|
Marvell Technology, Inc.
|
3.5%
|
|
Progressive Corp.
|
3.4%
|
|
ServiceNow, Inc.
|
3.1%
|
|
Arthur J Gallagher & Co.
|
2.9%
|
WHAT WERE THE FUND COSTS FOR THE PAST YEAR? (based on a hypothetical $10,000 investment)
|
Class Name
|
Costs of a $10,000 investment
|
Costs paid as a percentage of a $10,000 investment
|
|
Investor Shares
|
$79
|
0.75%
|
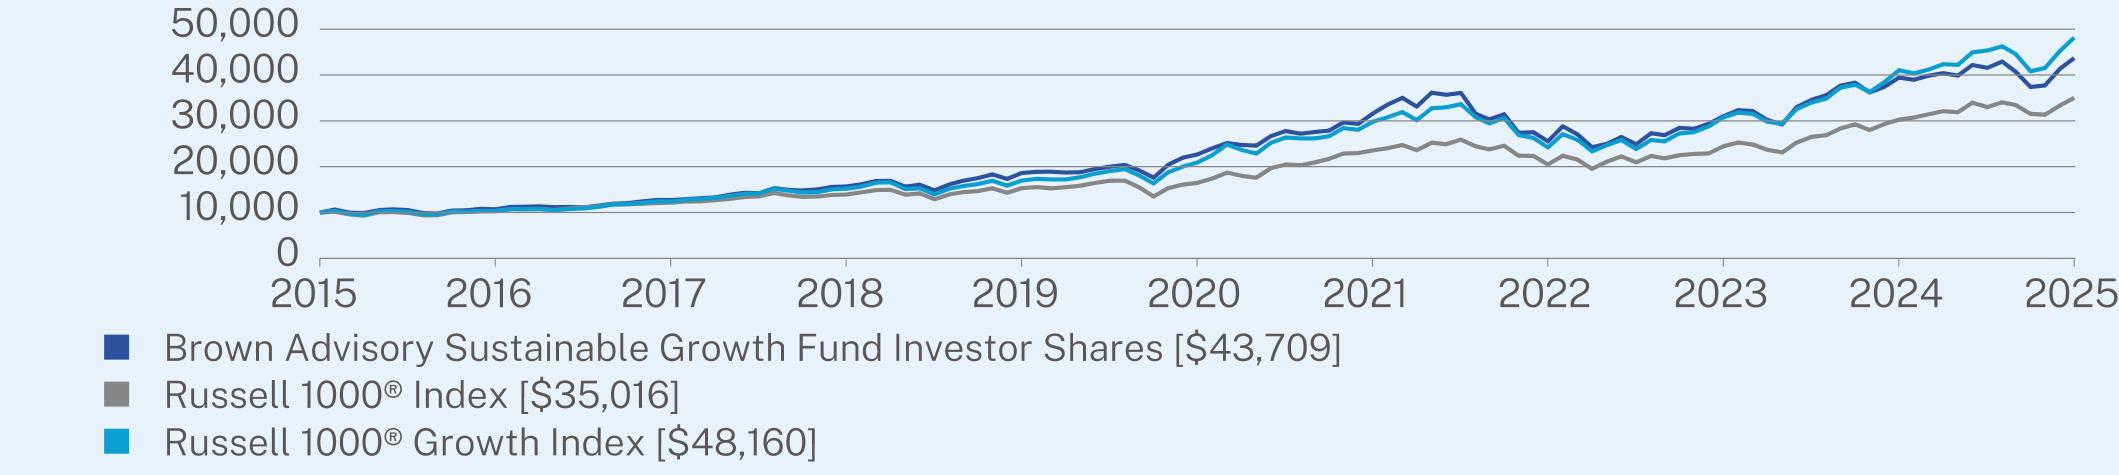
HOW DID THE FUND PERFORM LAST YEAR AND WHAT AFFECTED ITS PERFORMANCE?
For the 12-month period ended June 30, 2025, the Fund underperformed its benchmark, the Russell 1000® Index.
WHAT FACTORS INFLUENCED PERFORMANCE
During the period, sector positioning had a positive effect on relative returns against the Russell 1000® Index, while stock selection was detractive. From a sector allocation perspective, the strategy benefited from its overweight in financials and lack of exposure to energy, which outweighed the negative effects of our underweight to communication services. Inclusive of stock selection and interaction, strong performance from our financials and information technology names was not enough to overcome weakness from our health care and communication services names. Within financials, our favorable positioning and stock selection within the insurance and asset management industries were a key driver of absolute returns, with PGR, AJG, KKR and ARES all among the top performers during the period. The strategy’s sector exposures result from bottom-up stock-picking, not sector preferences or macro inputs.
POSITIONING
Consistent with the strategy’s long-standing portfolio construction philosophy, we continued to balance exposure between durable and rapid growth companies while ensuring diversification by business model, end market, and growth theme. Trading activity increased slightly, with ten name swaps and a number of strategic position re-sizing trades to optimize the ratio of upside potential to downside risk at the security and portfolio levels. We believe these trades represent upgrades to the portfolio that will better position the strategy for future success.
|
Top Contributors
|
|
|
↑
|
NVIDIA Corporation
|
|
↑
|
ServiceNow, Inc.
|
|
↑
|
Visa Inc. Class A
|
|
↑
|
Microsoft Corporation
|
|
↑
|
Progressive Corporation
|
|
Top Detractors
|
|
|
↓
|
Edwards Lifesciences Corporation
|
|
↓
|
West Pharmaceutical Services, Inc.
|
|
↓
|
Trade Desk, Inc. Class A
|
|
↓
|
Danaher Corporation
|
|
↓
|
Thermo Fisher Scientific Inc.
|
PERFORMANCE
The Fund’s underperformance was largely driven by weakness in our health care, consumer discretionary, and communication services names.
ANNUAL AVERAGE TOTAL RETURN (%)
|
|
1 Year
|
5 Year
|
10 Year
|
|
Investor Shares
|
10.84
|
14.05
|
15.89
|
|
Russell 1000® Index
|
15.66
|
16.30
|
13.35
|
|
Russell 1000® Growth Index
|
17.32
|
18.17
|
17.02
|
Visit https://www.brownadvisory.com/mf/funds/sustainable-growth-fund for recent performance information.
KEY FUND STATISTICS (as of June 30, 2025)
|
Net Assets
|
$9,027,770,024
|
|
Number of Holdings
|
34
|
|
Net Advisory Fee
|
$47,705,230
|
|
Portfolio Turnover
|
32%
|
|
Top Sectors*
|
(%)
|
|
Information Technology
|
45.4%
|
|
Financials
|
19.1%
|
|
Consumer Discretionary
|
11.7%
|
|
Industrials
|
10.9%
|
|
Health Care
|
6.3%
|
|
Communication Services
|
2.9%
|
|
Materials
|
1.7%
|
|
Cash & Other
|
2.0%
|
|
Top 10 Issuers
|
(%)
|
|
NVIDIA Corp.
|
8.8%
|
|
Microsoft Corp.
|
8.6%
|
|
Amazon.com, Inc.
|
7.4%
|
|
Intuit, Inc.
|
4.4%
|
|
Visa, Inc.
|
4.0%
|
|
KKR & Co., Inc.
|
3.9%
|
|
Marvell Technology, Inc.
|
3.5%
|
|
Progressive Corp.
|
3.4%
|
|
ServiceNow, Inc.
|
3.1%
|
|
Arthur J Gallagher & Co.
|
2.9%
|
WHAT WERE THE FUND COSTS FOR THE PAST YEAR? (based on a hypothetical $10,000 investment)
|
Class Name
|
Costs of a $10,000 investment
|
Costs paid as a percentage of a $10,000 investment
|
|
Advisor Shares
|
$105
|
1.00%
|
HOW DID THE FUND PERFORM LAST YEAR AND WHAT AFFECTED ITS PERFORMANCE?
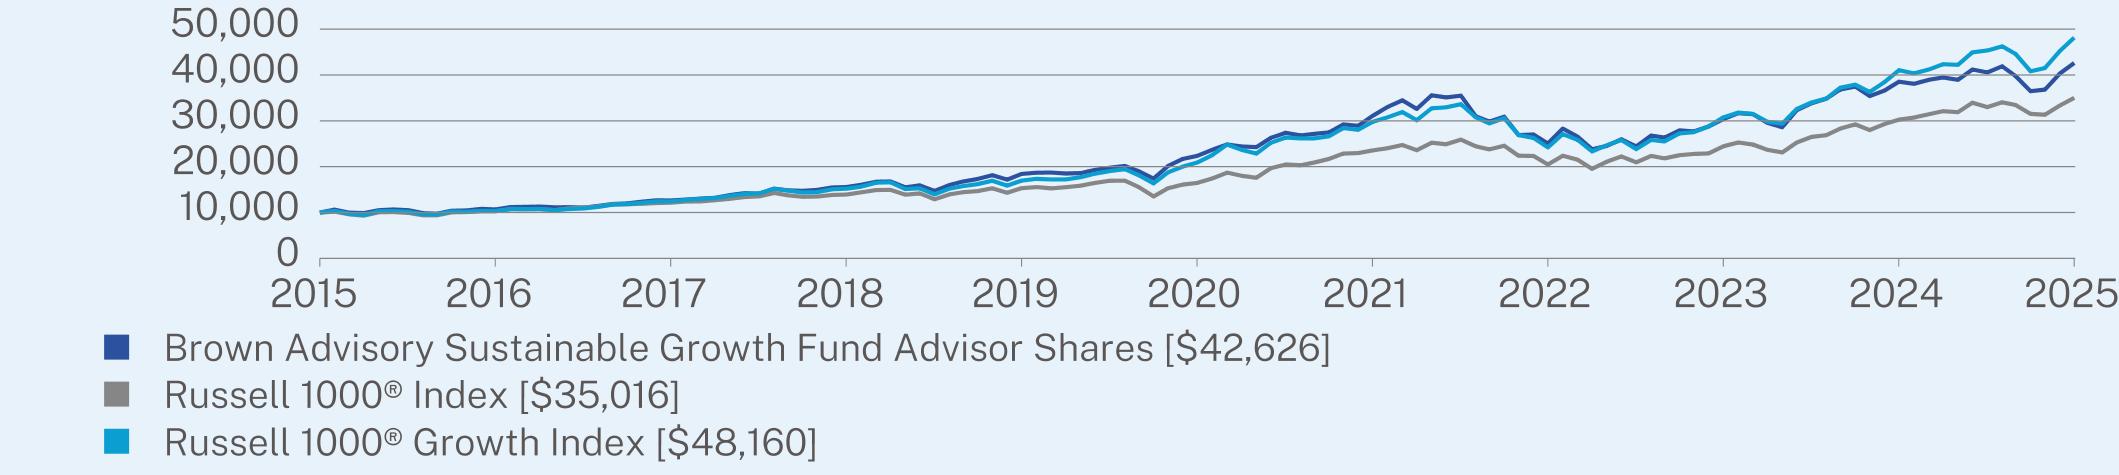
For the 12-month period ended June 30, 2025, the Fund underperformed its benchmark, the Russell 1000® Index.
WHAT FACTORS INFLUENCED PERFORMANCE
During the period, sector positioning had a positive effect on relative returns against the Russell 1000® Index, while stock selection was detractive. From a sector allocation perspective, the strategy benefited from its overweight in financials and lack of exposure to energy, which outweighed the negative effects of our underweight to communication services. Inclusive of stock selection and interaction, strong performance from our financials and information technology names was not enough to overcome weakness from our health care and communication services names. Within financials, our favorable positioning and stock selection within the insurance and asset management industries were a key driver of absolute returns, with PGR, AJG, KKR and ARES all among the top performers during the period. The strategy’s sector exposures result from bottom-up stock-picking, not sector preferences or macro inputs.
POSITIONING
Consistent with the strategy’s long-standing portfolio construction philosophy, we continued to balance exposure between durable and rapid growth companies while ensuring diversification by business model, end market, and growth theme. Trading activity increased slightly, with ten name swaps and a number of strategic position re-sizing trades to optimize the ratio of upside potential to downside risk at the security and portfolio levels. We believe these trades represent upgrades to the portfolio that will better position the strategy for future success.
|
Top Contributors
|
|
|
↑
|
NVIDIA Corporation
|
|
↑
|
ServiceNow, Inc.
|
|
↑
|
Visa Inc. Class A
|
|
↑
|
Microsoft Corporation
|
|
↑
|
Progressive Corporation
|
|
Top Detractors
|
|
|
↓
|
Edwards Lifesciences Corporation
|
|
↓
|
West Pharmaceutical Services, Inc.
|
|
↓
|
Trade Desk, Inc. Class A
|
|
↓
|
Danaher Corporation
|
|
↓
|
Thermo Fisher Scientific Inc.
|
PERFORMANCE
The Fund’s underperformance was largely driven by weakness in our health care, consumer discretionary, and communication services names.
ANNUAL AVERAGE TOTAL RETURN (%)
|
|
1 Year
|
5 Year
|
10 Year
|
|
Advisor Shares
|
10.59
|
13.76
|
15.60
|
|
Russell 1000® Index
|
15.66
|
16.30
|
13.35
|
|
Russell 1000® Growth Index
|
17.32
|
18.17
|
17.02
|
Visit https://www.brownadvisory.com/mf/funds/sustainable-growth-fund for recent performance information.
KEY FUND STATISTICS (as of June 30, 2025)
|
Net Assets
|
$9,027,770,024
|
|
Number of Holdings
|
34
|
|
Net Advisory Fee
|
$47,705,230
|
|
Portfolio Turnover
|
32%
|
|
Top Sectors*
|
(%)
|
|
Information Technology
|
45.4%
|
|
Financials
|
19.1%
|
|
Consumer Discretionary
|
11.7%
|
|
Industrials
|
10.9%
|
|
Health Care
|
6.3%
|
|
Communication Services
|
2.9%
|
|
Materials
|
1.7%
|
|
Cash & Other
|
2.0%
|
|
Top 10 Issuers
|
(%)
|
|
NVIDIA Corp.
|
8.8%
|
|
Microsoft Corp.
|
8.6%
|
|
Amazon.com, Inc.
|
7.4%
|
|
Intuit, Inc.
|
4.4%
|
|
Visa, Inc.
|
4.0%
|
|
KKR & Co., Inc.
|
3.9%
|
|
Marvell Technology, Inc.
|
3.5%
|
|
Progressive Corp.
|
3.4%
|
|
ServiceNow, Inc.
|
3.1%
|
|
Arthur J Gallagher & Co.
|
2.9%
|
WHAT WERE THE FUND COSTS FOR THE PAST YEAR? (based on a hypothetical $10,000 investment)
|
Class Name
|
Costs of a $10,000 investment
|
Costs paid as a percentage of a $10,000 investment
|
|
Institutional Shares
|
$89
|
0.82%
|
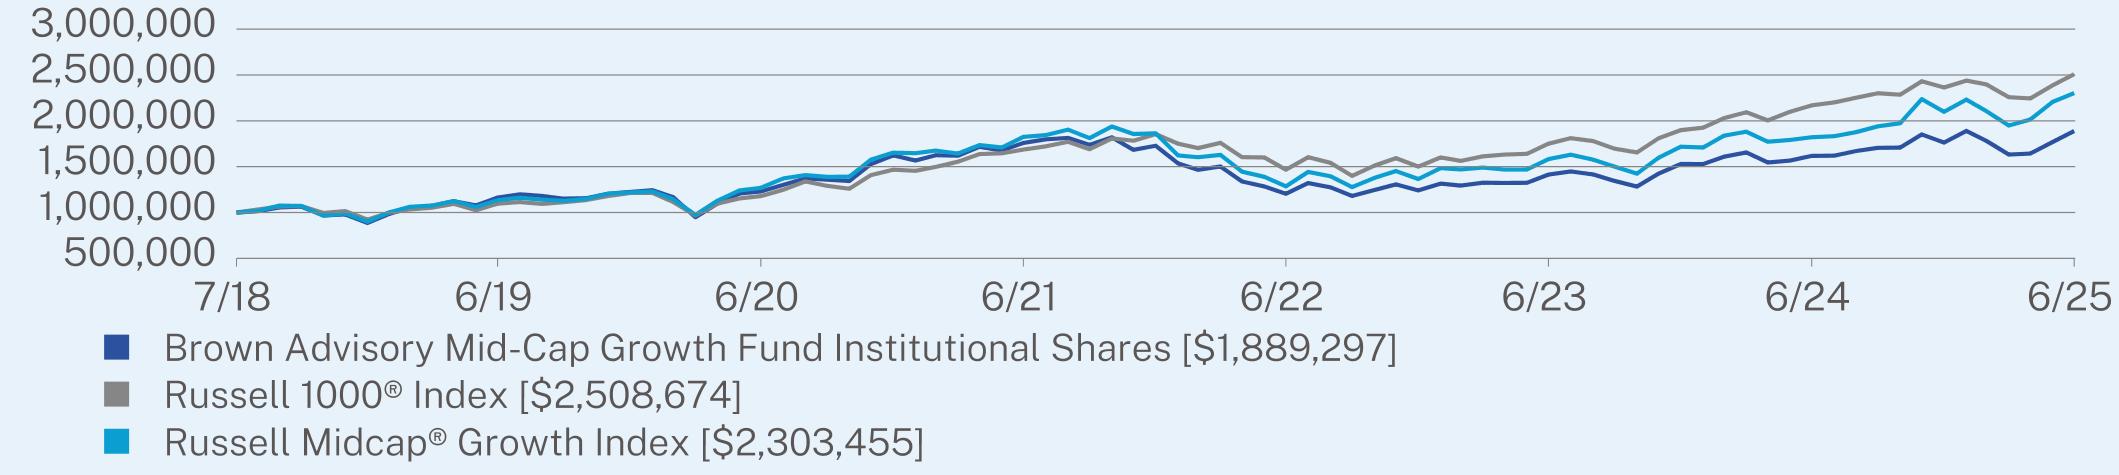
HOW DID THE FUND PERFORM LAST YEAR AND WHAT AFFECTED ITS PERFORMANCE?
For the 12-month period ended June 30, 2025, the Fund outperformed its benchmark, the Russell 1000® Index.
WHAT FACTORS INFLUENCED PERFORMANCE
The main factor influencing performance was stock selection. Our strategy invests in mid- and small-capitalization equities that have an opportunity to grow at an above average rate over the long-term. Due to our focus on smaller companies, we do not purchase large- or mega-cap stocks. Thus, we never considered some of the most impactful Russell 1000® constituents during the last year such as Nvidia, Broadcom, Meta, Tesla, or Netflix. Despite that tilt, contributions from holdings such as Roblox, DoorDash, and Vistra helped the Fund outpace the benchmark over the period.
POSITIONING
Our philosophy harnesses the power of compounding, focusing on “3G” businesses (durable Growth, sound Governance, scalable Go-to-market strategies) that have a higher than average probability of making the journey from small- or mid-cap to large-cap than most companies. Since we are more closely aligned with the mid-cap universe, we are meaningfully underweight Information Technology and Financials and considerably overweight Industrials and Healthcare when compared to the Russell 1000® Index.
|
Top Contributors
|
|
|
↑
|
Roblox Corp. Class A
|
|
↑
|
DoorDash, Inc. Class A
|
|
↑
|
Vistra Corp.
|
|
↑
|
Cheniere Energy, Inc.
|
|
↑
|
Insulet Corporation
|
|
Top Detractors
|
|
|
↓
|
DexCom, Inc.
|
|
↓
|
West Pharmaceutical Services, Inc.
|
|
↓
|
Edwards Lifesciences Corporation
|
|
↓
|
Bio-Techne Corporation
|
|
↓
|
Entegris, Inc.
|
PERFORMANCE
The Fund’s relative outperformance during the 12-month period ending June 30, 2025 was commendable considering its structural focus on mid-caps kept it out of the top-10 Russell 1000® contributors. Returns were driven by positive stock selection, mostly in the Consumer, Energy, and Utilities sectors.
ANNUAL AVERAGE TOTAL RETURN (%)
|
|
1 Year
|
5 Year
|
Since Inception
(07/02/2018) |
|
Institutional Shares
|
16.77
|
8.97
|
9.52
|
|
Russell 1000® Index
|
15.66
|
16.30
|
14.05
|
|
Russell Midcap® Growth Index
|
26.49
|
12.65
|
12.67
|
Visit https://www.brownadvisory.com/mf/funds/mid-cap-growth-fund for recent performance information.
KEY FUND STATISTICS (as of June 30, 2025)
|
Net Assets
|
$72,530,892
|
|
Number of Holdings
|
59
|
|
Net Advisory Fee
|
$511,191
|
|
Portfolio Turnover
|
73%
|
|
Top Sectors*
|
(%)
|
|
Information Technology
|
25.0%
|
|
Industrials
|
21.1%
|
|
Health Care
|
15.3%
|
|
Consumer Discretionary
|
11.6%
|
|
Financials
|
5.4%
|
|
Energy
|
4.6%
|
|
Utilities
|
3.7%
|
|
Communication Services
|
3.5%
|
|
Real Estate
|
2.7%
|
|
Cash & Other
|
7.1%
|
|
Top 10 Issuers
|
(%)
|
|
First American Government Obligations Fund
|
4.8%
|
|
Vistra Corp.
|
3.7%
|
|
Marvell Technology, Inc.
|
3.7%
|
|
West Pharmaceutical Services, Inc.
|
3.2%
|
|
Cheniere Energy, Inc.
|
3.2%
|
|
Hilton Worldwide Holdings, Inc.
|
3.0%
|
|
CoStar Group, Inc.
|
2.7%
|
|
HEICO Corp.
|
2.6%
|
|
Datadog, Inc.
|
2.6%
|
|
CCC Intelligent Solutions Holdings, Inc.
|
2.3%
|
WHAT WERE THE FUND COSTS FOR THE PAST YEAR? (based on a hypothetical $10,000 investment)
|
Class Name
|
Costs of a $10,000 investment
|
Costs paid as a percentage of a $10,000 investment
|
|
Investor Shares
|
$105
|
0.97%
|
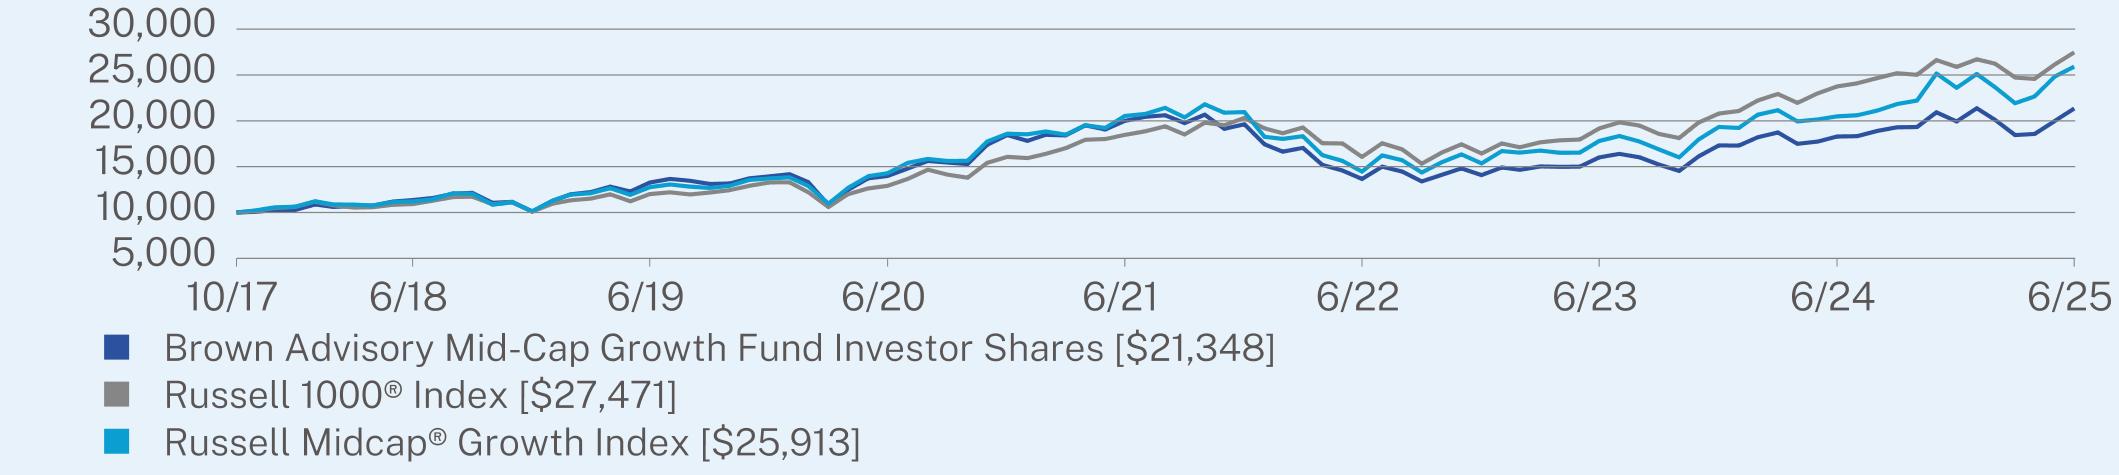
HOW DID THE FUND PERFORM LAST YEAR AND WHAT AFFECTED ITS PERFORMANCE?
For the 12-month period ended June 30, 2025, the Fund outperformed its benchmark, the Russell 1000® Index.
WHAT FACTORS INFLUENCED PERFORMANCE
The main factor influencing performance was stock selection. Our strategy invests in mid- and small-capitalization equities that have an opportunity to grow at an above average rate over the long-term. Due to our focus on smaller companies, we do not purchase large- or mega-cap stocks. Thus, we never considered some of the most impactful Russell 1000® constituents during the last year such as Nvidia, Broadcom, Meta, Tesla, or Netflix. Despite that tilt, contributions from holdings such as Roblox, DoorDash, and Vistra helped the Fund outpace the benchmark over the period.
POSITIONING
Our philosophy harnesses the power of compounding, focusing on “3G” businesses (durable Growth, sound Governance, scalable Go-to-market strategies) that have a higher than average probability of making the journey from small- or mid-cap to large-cap than most companies. Since we are more closely aligned with the mid-cap universe, we are meaningfully underweight Information Technology and Financials and considerably overweight Industrials and Healthcare when compared to the Russell 1000® Index.
|
Top Contributors
|
|
|
↑
|
Roblox Corp. Class A
|
|
↑
|
DoorDash, Inc. Class A
|
|
↑
|
Vistra Corp.
|
|
↑
|
Cheniere Energy, Inc.
|
|
↑
|
Insulet Corporation
|
|
Top Detractors
|
|
|
↓
|
DexCom, Inc.
|
|
↓
|
West Pharmaceutical Services, Inc.
|
|
↓
|
Edwards Lifesciences Corporation
|
|
↓
|
Bio-Techne Corporation
|
|
↓
|
Entegris, Inc.
|
PERFORMANCE
The Fund’s relative outperformance during the 12-month period ending June 30, 2025 was commendable considering its structural focus on mid-caps kept it out of the top-10 Russell 1000® contributors. Returns were driven by positive stock selection, mostly in the Consumer, Energy, and Utilities sectors.
ANNUAL AVERAGE TOTAL RETURN (%)
|
|
1 Year
|
5 Year
|
Since Inception
(10/02/2017) |
|
Investor Shares
|
16.70
|
8.82
|
10.29
|
|
Russell 1000® Index
|
15.66
|
16.30
|
13.94
|
|
Russell Midcap® Growth Index
|
26.49
|
12.65
|
13.09
|
Visit https://www.brownadvisory.com/mf/funds/mid-cap-growth-fund for recent performance information.
KEY FUND STATISTICS (as of June 30, 2025)
|
Net Assets
|
$72,530,892
|
|
Number of Holdings
|
59
|
|
Net Advisory Fee
|
$511,191
|
|
Portfolio Turnover
|
73%
|
|
Top Sectors*
|
(%)
|
|
Information Technology
|
25.0%
|
|
Industrials
|
21.1%
|
|
Health Care
|
15.3%
|
|
Consumer Discretionary
|
11.6%
|
|
Financials
|
5.4%
|
|
Energy
|
4.6%
|
|
Utilities
|
3.7%
|
|
Communication Services
|
3.5%
|
|
Real Estate
|
2.7%
|
|
Cash & Other
|
7.1%
|
|
Top 10 Issuers
|
(%)
|
|
First American Government Obligations Fund
|
4.8%
|
|
Vistra Corp.
|
3.7%
|
|
Marvell Technology, Inc.
|
3.7%
|
|
West Pharmaceutical Services, Inc.
|
3.2%
|
|
Cheniere Energy, Inc.
|
3.2%
|
|
Hilton Worldwide Holdings, Inc.
|
3.0%
|
|
CoStar Group, Inc.
|
2.7%
|
|
HEICO Corp.
|
2.6%
|
|
Datadog, Inc.
|
2.6%
|
|
CCC Intelligent Solutions Holdings, Inc.
|
2.3%
|
WHAT WERE THE FUND COSTS FOR THE PAST YEAR? (based on a hypothetical $10,000 investment)
|
Class Name
|
Costs of a $10,000 investment
|
Costs paid as a percentage of a $10,000 investment
|
|
Institutional Shares
|
$97
|
0.95%
|
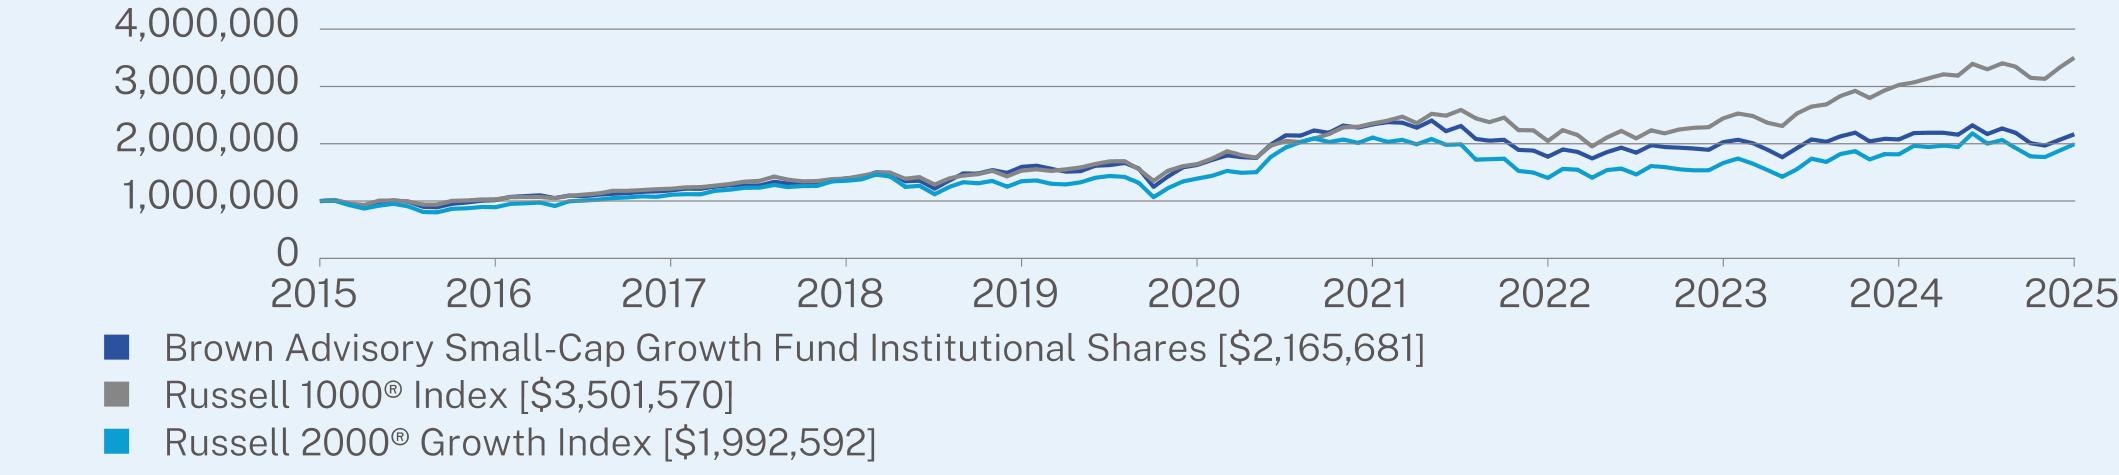
HOW DID THE FUND PERFORM LAST YEAR AND WHAT AFFECTED ITS PERFORMANCE?
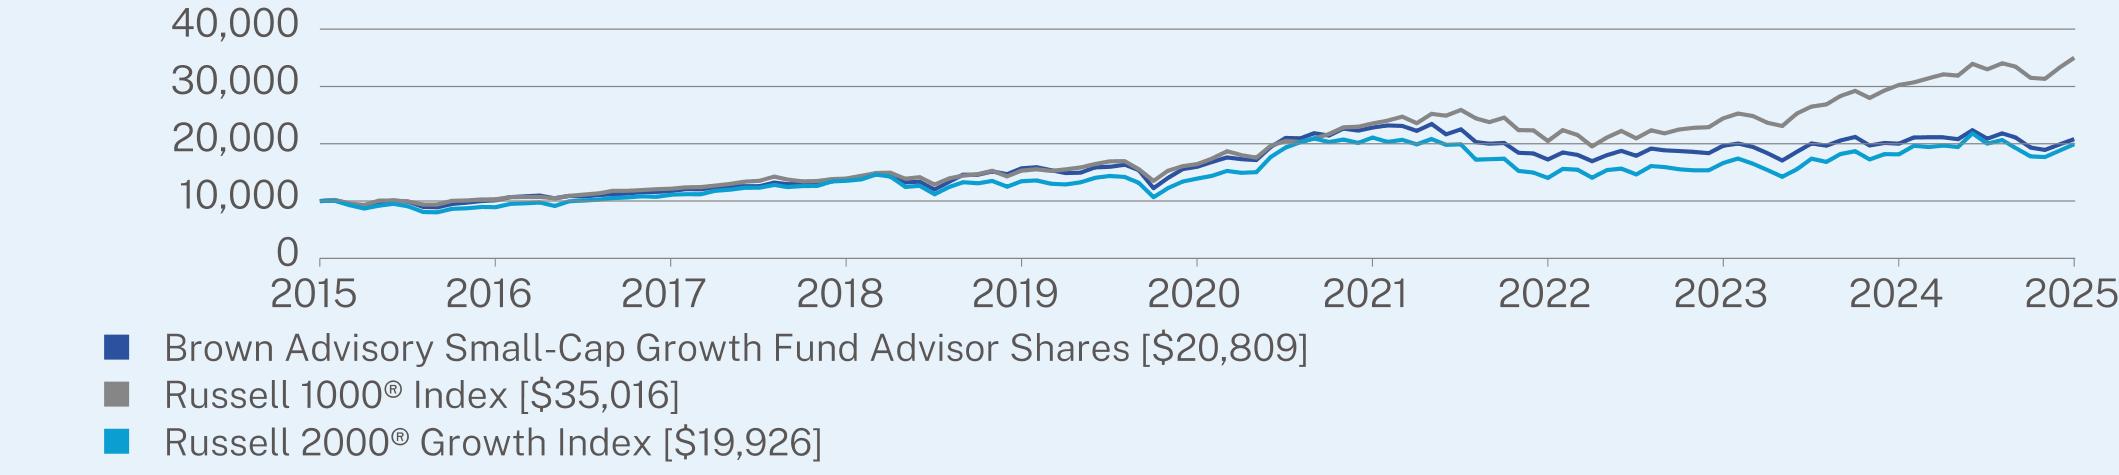
For the 12-month period ended June 30, 2025, the Fund underperformed its regulatory benchmark, the Russell 1000® Index.
WHAT FACTORS INFLUENCED PERFORMANCE
We are in a multi-year cycle where the largest companies have provided the strongest returns, and the main factor influencing performance remains our style and area of focus. Our strategy tends to look for small-capitalization equities that have an opportunity to grow at an above average rate over the long-term. Due to our focus on smaller companies, we do not purchase mid-cap or large-cap stocks. Thus, we never considered some of the most prolific contributors in the large-cap space such as Nvidia, Broadcom and other mega-cap technology names, along with a number of the best performers within the communication services and consumer discretionary sectors.
POSITIONING
Our philosophy harnesses the power of compounding, focusing on “3G” businesses (durable Growth, sound Governance, scalable Go-to-market strategies) that have a higher than average probability of making the journey from small-cap to mid-cap (and perhaps large-cap) than most companies. Since we are more closely aligned with the smaller capitalization universe, we are underweight financials and information technology and overweight industrials and health care.
|
Top Contributors
|
|
|
↑
|
Curtiss-Wright Corporation
|
|
↑
|
SiTime Corporation
|
|
↑
|
Inari Medical, Inc.
|
|
↑
|
Mirion Technologies, Inc. Class A
|
|
↑
|
Encompass Health Corporation
|
|
Top Detractors
|
|
|
↓
|
KinderCare Learning Companies Inc
|
|
↓
|
Entegris, Inc.
|
|
↓
|
Bruker Corporation
|
|
↓
|
Bio-Techne Corporation
|
|
↓
|
ChampionX Corporation
|
PERFORMANCE
The 12-month period ending June 30, 2025 was challenging due to our lack of ownership of any of the large-cap stocks that drove the Russell 1000® Index over this period.
ANNUAL AVERAGE TOTAL RETURN (%)
|
|
1 Year
|
5 Year
|
10 Year
|
|
Institutional Shares
|
4.37
|
5.83
|
8.03
|
|
Russell 1000® Index
|
15.66
|
16.30
|
13.35
|
|
Russell 2000® Growth Index
|
9.73
|
7.42
|
7.14
|
Visit https://www.brownadvisory.com/mf/funds/small-cap-growth-fund for recent performance information.
KEY FUND STATISTICS (as of June 30, 2025)
|
Net Assets
|
$932,266,930
|
|
Number of Holdings
|
75
|
|
Net Advisory Fee
|
$11,838,825
|
|
Portfolio Turnover
|
28%
|
|
Top Sectors*
|
(%)
|
|
Industrials
|
30.1%
|
|
Information Technology
|
24.6%
|
|
Health Care
|
20.6%
|
|
Consumer Discretionary
|
6.4%
|
|
Energy
|
4.7%
|
|
Financials
|
4.4%
|
|
Communication Services
|
2.4%
|
|
Consumer Staples
|
2.1%
|
|
Real Estate
|
1.9%
|
|
Cash & Other
|
2.8%
|
|
Top 10 Issuers
|
(%)
|
|
CCC Intelligent Solutions Holdings, Inc.
|
4.0%
|
|
HealthEquity, Inc.
|
3.2%
|
|
Dynatrace, Inc.
|
3.2%
|
|
Bright Horizons Family Solutions, Inc.
|
3.2%
|
|
Waste Connections, Inc.
|
3.0%
|
|
Prosperity Bancshares, Inc.
|
2.9%
|
|
Curtiss-Wright Corp.
|
2.5%
|
|
StandardAero, Inc.
|
2.5%
|
|
Mirion Technologies, Inc.
|
2.5%
|
|
Encompass Health Corp.
|
2.5%
|
WHAT WERE THE FUND COSTS FOR THE PAST YEAR? (based on a hypothetical $10,000 investment)
|
Class Name
|
Costs of a $10,000 investment
|
Costs paid as a percentage of a $10,000 investment
|
|
Investor Shares
|
$112
|
1.10%
|
HOW DID THE FUND PERFORM LAST YEAR AND WHAT AFFECTED ITS PERFORMANCE?
For the 12-month period ended June 30, 2025, the Fund underperformed its regulatory benchmark, the Russell 1000® Index.
WHAT FACTORS INFLUENCED PERFORMANCE
We are in a multi-year cycle where the largest companies have provided the strongest returns, and the main factor influencing performance remains our style and area of focus. Our strategy tends to look for small-capitalization equities that have an opportunity to grow at an above average rate over the long-term. Due to our focus on smaller companies, we do not purchase mid-cap or large-cap stocks. Thus, we never considered some of the most prolific contributors in the large-cap space such as Nvidia, Broadcom and other mega-cap technology names, along with a number of the best performers within the communication services and consumer discretionary sectors.
POSITIONING
Our philosophy harnesses the power of compounding, focusing on “3G” businesses (durable Growth, sound Governance, scalable Go-to-market strategies) that have a higher than average probability of making the journey from small-cap to mid-cap (and perhaps large-cap) than most companies. Since we are more closely aligned with the smaller capitalization universe, we are underweight financials and information technology and overweight industrials and health care.
|
Top Contributors
|
|
|
↑
|
Curtiss-Wright Corporation
|
|
↑
|
SiTime Corporation
|
|
↑
|
Inari Medical, Inc.
|
|
↑
|
Mirion Technologies, Inc. Class A
|
|
↑
|
Encompass Health Corporation
|
|
Top Detractors
|
|
|
↓
|
KinderCare Learning Companies Inc
|
|
↓
|
Entegris, Inc.
|
|
↓
|
Bruker Corporation
|
|
↓
|
Bio-Techne Corporation
|
|
↓
|
ChampionX Corporation
|
PERFORMANCE
The 12-month period ending June 30, 2025 was challenging due to our lack of ownership of any of the large-cap stocks that drove the Russell 1000® Index over this period.

ANNUAL AVERAGE TOTAL RETURN (%)
|
|
1 Year
|
5 Year
|
10 Year
|
|
Investor Shares
|
4.24
|
5.68
|
7.87
|
|
Russell 1000® Index
|
15.66
|
16.30
|
13.35
|
|
Russell 2000® Growth Index
|
9.73
|
7.42
|
7.14
|
Visit https://www.brownadvisory.com/mf/funds/small-cap-growth-fund for recent performance information.
KEY FUND STATISTICS (as of June 30, 2025)
|
Net Assets
|
$932,266,930
|
|
Number of Holdings
|
75
|
|
Net Advisory Fee
|
$11,838,825
|
|
Portfolio Turnover
|
28%
|
|
Top Sectors*
|
(%)
|
|
Industrials
|
30.1%
|
|
Information Technology
|
24.6%
|
|
Health Care
|
20.6%
|
|
Consumer Discretionary
|
6.4%
|
|
Energy
|
4.7%
|
|
Financials
|
4.4%
|
|
Communication Services
|
2.4%
|
|
Consumer Staples
|
2.1%
|
|
Real Estate
|
1.9%
|
|
Cash & Other
|
2.8%
|
|
Top 10 Issuers
|
(%)
|
|
CCC Intelligent Solutions Holdings, Inc.
|
4.0%
|
|
HealthEquity, Inc.
|
3.2%
|
|
Dynatrace, Inc.
|
3.2%
|
|
Bright Horizons Family Solutions, Inc.
|
3.2%
|
|
Waste Connections, Inc.
|
3.0%
|
|
Prosperity Bancshares, Inc.
|
2.9%
|
|
Curtiss-Wright Corp.
|
2.5%
|
|
StandardAero, Inc.
|
2.5%
|
|
Mirion Technologies, Inc.
|
2.5%
|
|
Encompass Health Corp.
|
2.5%
|
WHAT WERE THE FUND COSTS FOR THE PAST YEAR? (based on a hypothetical $10,000 investment)
|
Class Name
|
Costs of a $10,000 investment
|
Costs paid as a percentage of a $10,000 investment
|
|
Advisor Shares
|
$138
|
1.35%
|
HOW DID THE FUND PERFORM LAST YEAR AND WHAT AFFECTED ITS PERFORMANCE?
For the 12-month period ended June 30, 2025, the Fund underperformed its regulatory benchmark, the Russell 1000® Index.
WHAT FACTORS INFLUENCED PERFORMANCE
We are in a multi-year cycle where the largest companies have provided the strongest returns, and the main factor influencing performance remains our style and area of focus. Our strategy tends to look for small-capitalization equities that have an opportunity to grow at an above average rate over the long-term. Due to our focus on smaller companies, we do not purchase mid-cap or large-cap stocks. Thus, we never considered some of the most prolific contributors in the large-cap space such as Nvidia, Broadcom and other mega-cap technology names, along with a number of the best performers within the communication services and consumer discretionary sectors.
POSITIONING
Our philosophy harnesses the power of compounding, focusing on “3G” businesses (durable Growth, sound Governance, scalable Go-to-market strategies) that have a higher than average probability of making the journey from small-cap to mid-cap (and perhaps large-cap) than most companies. Since we are more closely aligned with the smaller capitalization universe, we are underweight financials and information technology and overweight industrials and health care.
|
Top Contributors
|
|
|
↑
|
Curtiss-Wright Corporation
|
|
↑
|
SiTime Corporation
|
|
↑
|
Inari Medical, Inc.
|
|
↑
|
Mirion Technologies, Inc. Class A
|
|
↑
|
Encompass Health Corporation
|
|
Top Detractors
|
|
|
↓
|
KinderCare Learning Companies Inc
|
|
↓
|
Entegris, Inc.
|
|
↓
|
Bruker Corporation
|
|
↓
|
Bio-Techne Corporation
|
|
↓
|
ChampionX Corporation
|
PERFORMANCE
The 12-month period ending June 30, 2025 was challenging due to our lack of ownership of any of the large-cap stocks that drove the Russell 1000® Index over this period.
ANNUAL AVERAGE TOTAL RETURN (%)
|
|
1 Year
|
5 Year
|
10 Year
|
|
Advisor Shares
|
3.97
|
5.41
|
7.60
|
|
Russell 1000® Index
|
15.66
|
16.30
|
13.35
|
|
Russell 2000® Growth Index
|
9.73
|
7.42
|
7.14
|
Visit https://www.brownadvisory.com/mf/funds/small-cap-growth-fund for recent performance information.
KEY FUND STATISTICS (as of June 30, 2025)
|
Net Assets
|
$932,266,930
|
|
Number of Holdings
|
75
|
|
Net Advisory Fee
|
$11,838,825
|
|
Portfolio Turnover
|
28%
|
|
Top Sectors*
|
(%)
|
|
Industrials
|
30.1%
|
|
Information Technology
|
24.6%
|
|
Health Care
|
20.6%
|
|
Consumer Discretionary
|
6.4%
|
|
Energy
|
4.7%
|
|
Financials
|
4.4%
|
|
Communication Services
|
2.4%
|
|
Consumer Staples
|
2.1%
|
|
Real Estate
|
1.9%
|
|
Cash & Other
|
2.8%
|
|
Top 10 Issuers
|
(%)
|
|
CCC Intelligent Solutions Holdings, Inc.
|
4.0%
|
|
HealthEquity, Inc.
|
3.2%
|
|
Dynatrace, Inc.
|
3.2%
|
|
Bright Horizons Family Solutions, Inc.
|
3.2%
|
|
Waste Connections, Inc.
|
3.0%
|
|
Prosperity Bancshares, Inc.
|
2.9%
|
|
Curtiss-Wright Corp.
|
2.5%
|
|
StandardAero, Inc.
|
2.5%
|
|
Mirion Technologies, Inc.
|
2.5%
|
|
Encompass Health Corp.
|
2.5%
|
WHAT WERE THE FUND COSTS FOR THE PAST YEAR? (based on a hypothetical $10,000 investment)
|
Class Name
|
Costs of a $10,000 investment
|
Costs paid as a percentage of a $10,000 investment
|
|
Institutional Shares
|
$97
|
0.95%
|
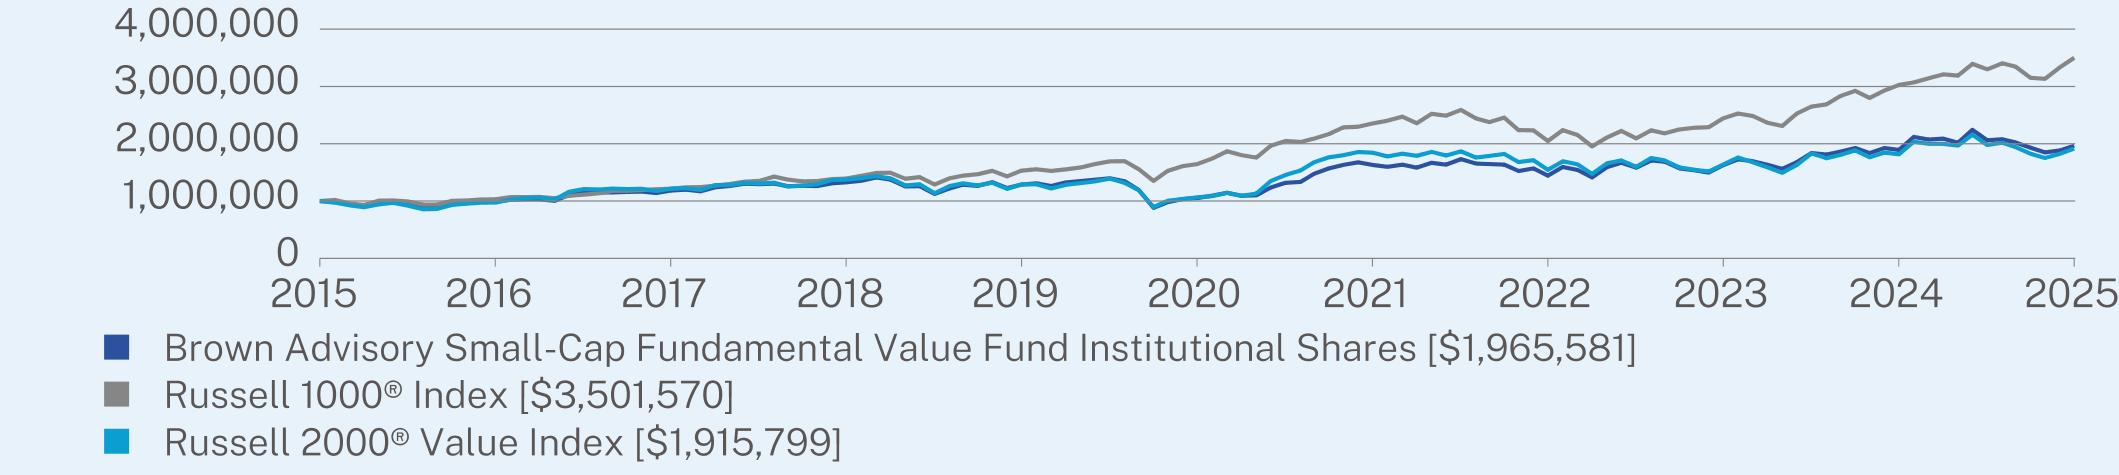
HOW DID THE FUND PERFORM LAST YEAR AND WHAT AFFECTED ITS PERFORMANCE?
For the 12-month period ended June 30, 2025, the Fund underperformed its regulatory benchmark, the Russell 1000® Index.
WHAT FACTORS INFLUENCED PERFORMANCE
Positive contribution to Fund performance was mainly driven by the financials and utilities sectors while the communication services and health care sectors were the biggest detractors. The largest individual contributor to performance was Talen Energy Corp (TLN) and the largest individual detractor to performance was Cable One, Inc. (CABO).
POSITIONING
We were active during the period and invested in fifteen new companies and exited from sixteen companies. We also had two additions and deletions during the period. The additions during the period were diversified across most economic sectors. A notable addition to the communication services sector in the second quarter of 2025 was Cars.com (CARS). CARS assists consumers navigating the new and used car market. The company’s business revenue model is based on monthly subscriptions from over 19,000 dealers along with advertising revenues from original equipment manufacturers “OEMS” and dealers. The company’s valuation is down recently due to negative sentiment in the auto sector. CARS trades at approximately 6x EBITDA and has begun to use its significant cash flow to repurchase its shares.
|
Top Contributors
|
|
|
↑
|
Talen Energy Corp
|
|
↑
|
Bancorp Inc
|
|
↑
|
OSI Systems, Inc.
|
|
↑
|
Hanover Insurance Group, Inc.
|
|
↑
|
Curtiss-Wright Corporation
|
|
Top Detractors
|
|
|
↓
|
Cable One, Inc.
|
|
↓
|
Orion S.A.
|
|
↓
|
Acadia Healthcare Company, Inc.
|
|
↓
|
Avanos Medical, Inc.
|
|
↓
|
Expro Group Holdings N.V.
|
PERFORMANCE
The Fund posted positive returns and underperformed its regulatory benchmark, Russell 1000® Index, during the period.
ANNUAL AVERAGE TOTAL RETURN (%)
|
|
1 Year
|
5 Year
|
10 Year
|
|
Institutional Shares
|
3.93
|
13.33
|
6.99
|
|
Russell 1000® Index
|
15.66
|
16.30
|
13.35
|
|
Russell 2000® Value Index
|
5.54
|
12.47
|
6.72
|
Visit https://www.brownadvisory.com/mf/funds/small-cap-fundamental-value-fund for recent performance information.
KEY FUND STATISTICS (as of June 30, 2025)
|
Net Assets
|
$1,177,998,140
|
|
Number of Holdings
|
65
|
|
Net Advisory Fee
|
$11,566,211
|
|
Portfolio Turnover
|
39%
|
|
Top Sectors*
|
(%)
|
|
Financials
|
30.6%
|
|
Consumer Discretionary
|
11.8%
|
|
Industrials
|
9.5%
|
|
Information Technology
|
8.3%
|
|
Communication Services
|
7.2%
|
|
Materials
|
7.0%
|
|
Utilities
|
6.2%
|
|
Energy
|
5.6%
|
|
Real Estate
|
4.7%
|
|
Cash & Other
|
9.1%
|
|
Top 10 Issuers
|
(%)
|
|
Talen Energy Corp.
|
4.1%
|
|
First American Government Obligations Fund
|
3.8%
|
|
Signet Jewelers Ltd.
|
3.0%
|
|
Bancorp, Inc.
|
2.9%
|
|
NCR Atleos Corp.
|
2.9%
|
|
Eastern Bankshares, Inc.
|
2.4%
|
|
Eagle Materials, Inc.
|
2.4%
|
|
John Wiley & Sons, Inc.
|
2.3%
|
|
Old National Bancorp
|
2.3%
|
|
Nomad Foods Ltd.
|
2.2%
|
WHAT WERE THE FUND COSTS FOR THE PAST YEAR? (based on a hypothetical $10,000 investment)
|
Class Name
|
Costs of a $10,000 investment
|
Costs paid as a percentage of a $10,000 investment
|
|
Investor Shares
|
$112
|
1.10%
|
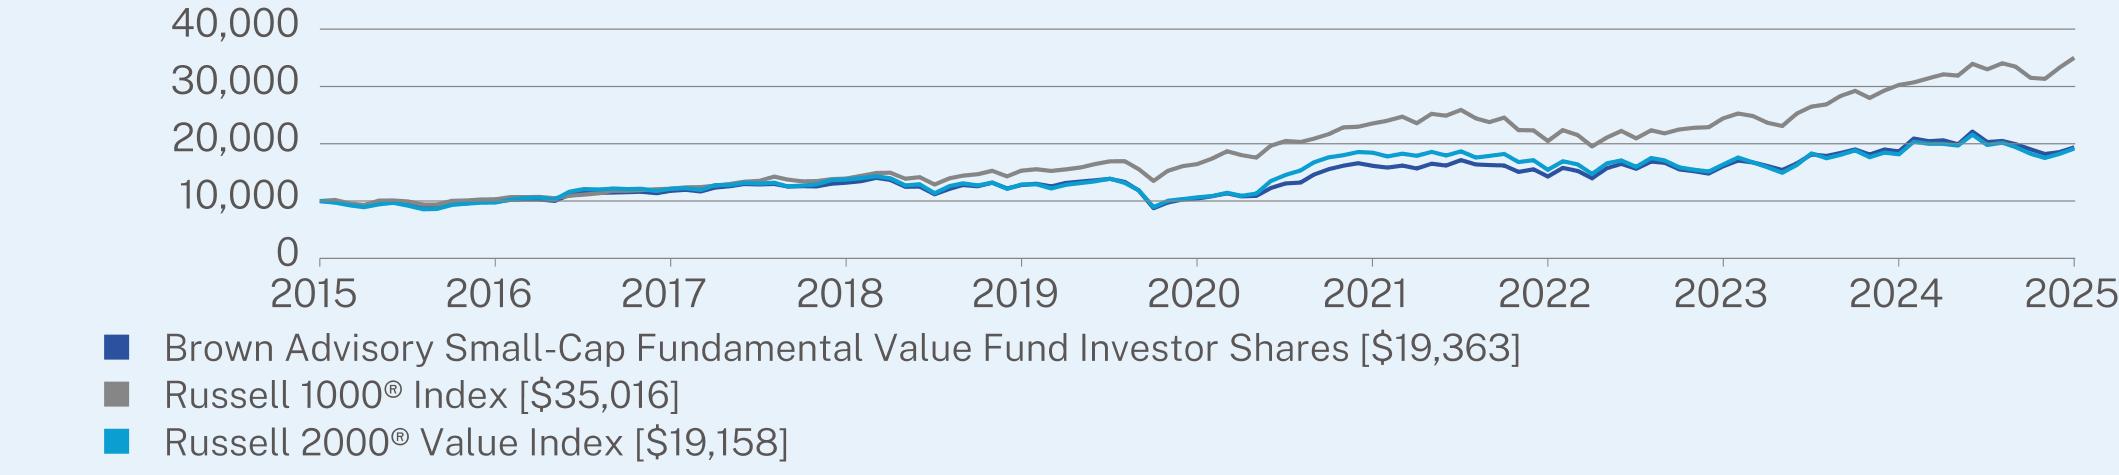
HOW DID THE FUND PERFORM LAST YEAR AND WHAT AFFECTED ITS PERFORMANCE?
For the 12-month period ended June 30, 2025, the Fund underperformed its regulatory benchmark, the Russell 1000® Index.
WHAT FACTORS INFLUENCED PERFORMANCE
Positive contribution to Fund performance was mainly driven by the financials and utilities sectors while the communication services and health care sectors were the biggest detractors. The largest individual contributor to performance was Talen Energy Corp (TLN) and the largest individual detractor to performance was Cable One, Inc. (CABO).
POSITIONING
We were active during the period and invested in fifteen new companies and exited from sixteen companies. We also had two additions and deletions during the period. The additions during the period were diversified across most economic sectors. A notable addition to the communication services sector in the second quarter of 2025 was Cars.com (CARS). CARS assists consumers navigating the new and used car market. The company’s business revenue model is based on monthly subscriptions from over 19,000 dealers along with advertising revenues from original equipment manufacturers “OEMS” and dealers. The company’s valuation is down recently due to negative sentiment in the auto sector. CARS trades at approximately 6x EBITDA and has begun to use its significant cash flow to repurchase its shares.
|
Top Contributors
|
|
|
↑
|
Talen Energy Corp
|
|
↑
|
Bancorp Inc
|
|
↑
|
OSI Systems, Inc.
|
|
↑
|
Hanover Insurance Group, Inc.
|
|
↑
|
Curtiss-Wright Corporation
|
|
Top Detractors
|
|
|
↓
|
Cable One, Inc.
|
|
↓
|
Orion S.A.
|
|
↓
|
Acadia Healthcare Company, Inc.
|
|
↓
|
Avanos Medical, Inc.
|
|
↓
|
Expro Group Holdings N.V.
|
PERFORMANCE
The Fund posted positive returns and underperformed its regulatory benchmark, Russell 1000® Index, during the period.
ANNUAL AVERAGE TOTAL RETURN (%)
|
|
1 Year
|
5 Year
|
10 Year
|
|
Investor Shares
|
3.78
|
13.16
|
6.83
|
|
Russell 1000® Index
|
15.66
|
16.30
|
13.35
|
|
Russell 2000® Value Index
|
5.54
|
12.47
|
6.72
|
Visit https://www.brownadvisory.com/mf/funds/small-cap-fundamental-value-fund for recent performance information.
KEY FUND STATISTICS (as of June 30, 2025)
|
Net Assets
|
$1,177,998,140
|
|
Number of Holdings
|
65
|
|
Net Advisory Fee
|
$11,566,211
|
|
Portfolio Turnover
|
39%
|
|
Top Sectors*
|
(%)
|
|
Financials
|
30.6%
|
|
Consumer Discretionary
|
11.8%
|
|
Industrials
|
9.5%
|
|
Information Technology
|
8.3%
|
|
Communication Services
|
7.2%
|
|
Materials
|
7.0%
|
|
Utilities
|
6.2%
|
|
Energy
|
5.6%
|
|
Real Estate
|
4.7%
|
|
Cash & Other
|
9.1%
|
|
Top 10 Issuers
|
(%)
|
|
Talen Energy Corp.
|
4.1%
|
|
First American Government Obligations Fund
|
3.8%
|
|
Signet Jewelers Ltd.
|
3.0%
|
|
Bancorp, Inc.
|
2.9%
|
|
NCR Atleos Corp.
|
2.9%
|
|
Eastern Bankshares, Inc.
|
2.4%
|
|
Eagle Materials, Inc.
|
2.4%
|
|
John Wiley & Sons, Inc.
|
2.3%
|
|
Old National Bancorp
|
2.3%
|
|
Nomad Foods Ltd.
|
2.2%
|
WHAT WERE THE FUND COSTS FOR THE PAST YEAR? (based on a hypothetical $10,000 investment)
|
Class Name
|
Costs of a $10,000 investment
|
Costs paid as a percentage of a $10,000 investment
|
|
Advisor Shares
|
$137
|
1.35%
|
HOW DID THE FUND PERFORM LAST YEAR AND WHAT AFFECTED ITS PERFORMANCE?
For the 12-month period ended June 30, 2025, the Fund underperformed its regulatory benchmark, the Russell 1000® Index.
WHAT FACTORS INFLUENCED PERFORMANCE
Positive contribution to Fund performance was mainly driven by the financials and utilities sectors while the communication services and health care sectors were the biggest detractors. The largest individual contributor to performance was Talen Energy Corp (TLN) and the largest individual detractor to performance was Cable One, Inc. (CABO).
POSITIONING
We were active during the period and invested in fifteen new companies and exited from sixteen companies. We also had two additions and deletions during the period. The additions during the period were diversified across most economic sectors. A notable addition to the communication services sector in the second quarter of 2025 was Cars.com (CARS). CARS assists consumers navigating the new and used car market. The company’s business revenue model is based on monthly subscriptions from over 19,000 dealers along with advertising revenues from original equipment manufacturers “OEMS” and dealers. The company’s valuation is down recently due to negative sentiment in the auto sector. CARS trades at approximately 6x EBITDA and has begun to use its significant cash flow to repurchase its shares.
|
Top Contributors
|
|
|
↑
|
Talen Energy Corp
|
|
↑
|
Bancorp Inc
|
|
↑
|
OSI Systems, Inc.
|
|
↑
|
Hanover Insurance Group, Inc.
|
|
↑
|
Curtiss-Wright Corporation
|
|
Top Detractors
|
|
|
↓
|
Cable One, Inc.
|
|
↓
|
Orion S.A.
|
|
↓
|
Acadia Healthcare Company, Inc.
|
|
↓
|
Avanos Medical, Inc.
|
|
↓
|
Expro Group Holdings N.V.
|
PERFORMANCE
The Fund posted positive returns and underperformed its regulatory benchmark, Russell 1000® Index, during the period.
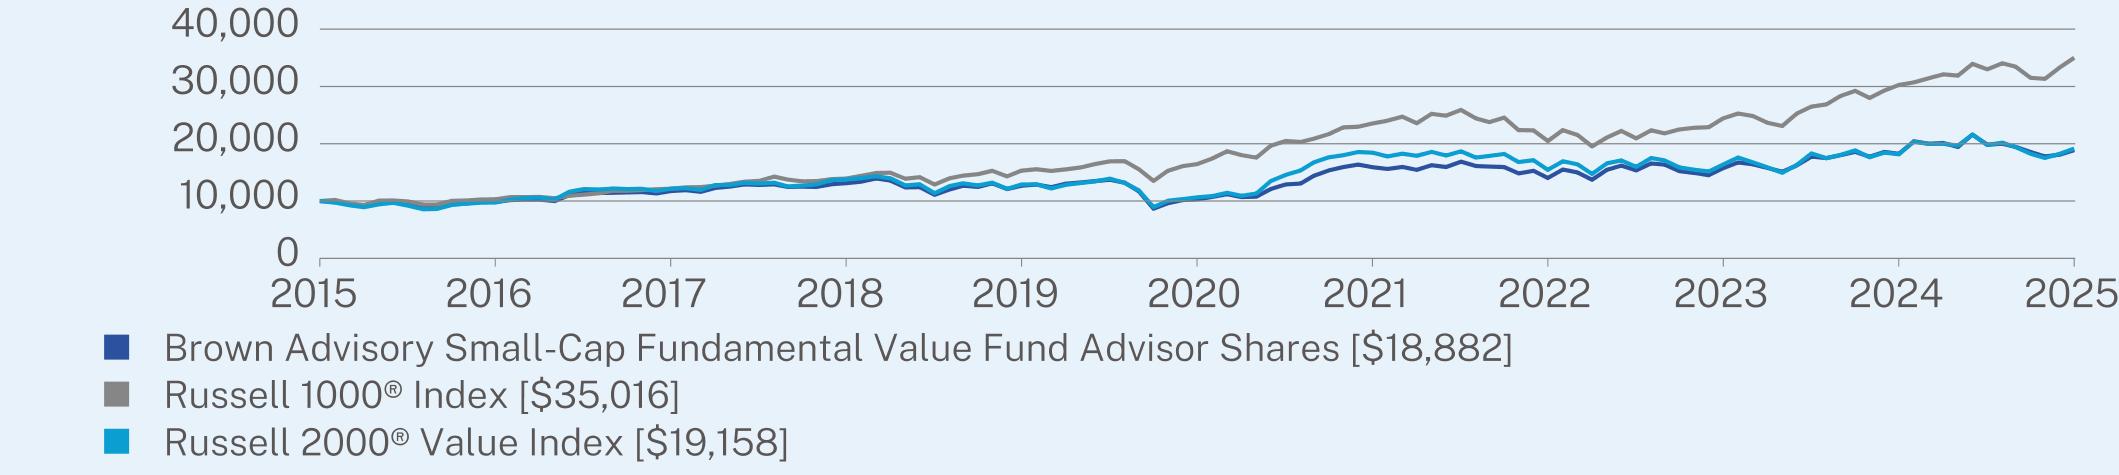
ANNUAL AVERAGE TOTAL RETURN (%)
|
|
1 Year
|
5 Year
|
10 Year
|
|
Advisor Shares
|
3.50
|
12.87
|
6.56
|
|
Russell 1000® Index
|
15.66
|
16.30
|
13.35
|
|
Russell 2000® Value Index
|
5.54
|
12.47
|
6.72
|
Visit https://www.brownadvisory.com/mf/funds/small-cap-fundamental-value-fund for recent performance information.
KEY FUND STATISTICS (as of June 30, 2025)
|
Net Assets
|
$1,177,998,140
|
|
Number of Holdings
|
65
|
|
Net Advisory Fee
|
$11,566,211
|
|
Portfolio Turnover
|
39%
|
|
Top Sectors*
|
(%)
|
|
Financials
|
30.6%
|
|
Consumer Discretionary
|
11.8%
|
|
Industrials
|
9.5%
|
|
Information Technology
|
8.3%
|
|
Communication Services
|
7.2%
|
|
Materials
|
7.0%
|
|
Utilities
|
6.2%
|
|
Energy
|
5.6%
|
|
Real Estate
|
4.7%
|
|
Cash & Other
|
9.1%
|
|
Top 10 Issuers
|
(%)
|
|
Talen Energy Corp.
|
4.1%
|
|
First American Government Obligations Fund
|
3.8%
|
|
Signet Jewelers Ltd.
|
3.0%
|
|
Bancorp, Inc.
|
2.9%
|
|
NCR Atleos Corp.
|
2.9%
|
|
Eastern Bankshares, Inc.
|
2.4%
|
|
Eagle Materials, Inc.
|
2.4%
|
|
John Wiley & Sons, Inc.
|
2.3%
|
|
Old National Bancorp
|
2.3%
|
|
Nomad Foods Ltd.
|
2.2%
|
WHAT WERE THE FUND COSTS FOR THE PAST YEAR? (based on a hypothetical $10,000 investment)
|
Class Name
|
Costs of a $10,000 investment
|
Costs paid as a percentage of a $10,000 investment
|
|
Institutional Shares
|
$96
|
0.93%
|
HOW DID THE FUND PERFORM LAST YEAR AND WHAT AFFECTED ITS PERFORMANCE?
For the 12-month period ended June 30, 2025, the Fund underperformed its regulatory benchmark, the Russell 1000® Index.
WHAT FACTORS INFLUENCED PERFORMANCE
Positive contribution to Fund performance was primarily driven by stock selection in the financials and industrials sector, while the consumer discretionary sector was the biggest detractor. The largest individual contributor to performance was Talen Energy Corp (TLN) and the largest individual detractor to performance was KinderCare Learning Companies Inc (KLC).
POSITIONING
We were active during the 12-month period and invested in 24 new companies and exited from 20 companies. Two companies were bought and sold in the quarter. Activity was broad based across sectors, but most heavily focused within the health care, industrials, and information technology sectors. A notable addition to the information technology sector during the period was Mirion Technologies. Mirion Technologies leverages their expertise in ionizing radiation technology to measure the presence of radioactive material in medical diagnostics, nuclear energy, military nuclear threat prevention settings, and deliver radiation therapies to treat cancer. Mirion has high levels of recurring revenue for their nuclear radiation detection, test, and measurement products which are required in any setting where radiation is present. They are benefitting from the growth of nuclear power globally and the increasing use of radiation therapies to treat cancer and other diseases.
|
Top Contributors
|
|
|
↑
|
Talen Energy Corp
|
|
↑
|
Bancorp Inc
|
|
↑
|
Encompass Health Corporation
|
|
↑
|
Inari Medical, Inc.
|
|
↑
|
Mirion Technologies, Inc. Class A
|
|
Top Detractors
|
|
|
↓
|
KinderCare Learning Companies Inc
|
|
↓
|
Onto Innovation, Inc.
|
|
↓
|
Vaxcyte, Inc.
|
|
↓
|
Biohaven Ltd.
|
|
↓
|
Cable One, Inc.
|
PERFORMANCE
Small cap indices continued to face unprecedented underperformance relative to large cap indices during the 12-month period, resulting in the fund underperforming compared to its regulatory benchmark.
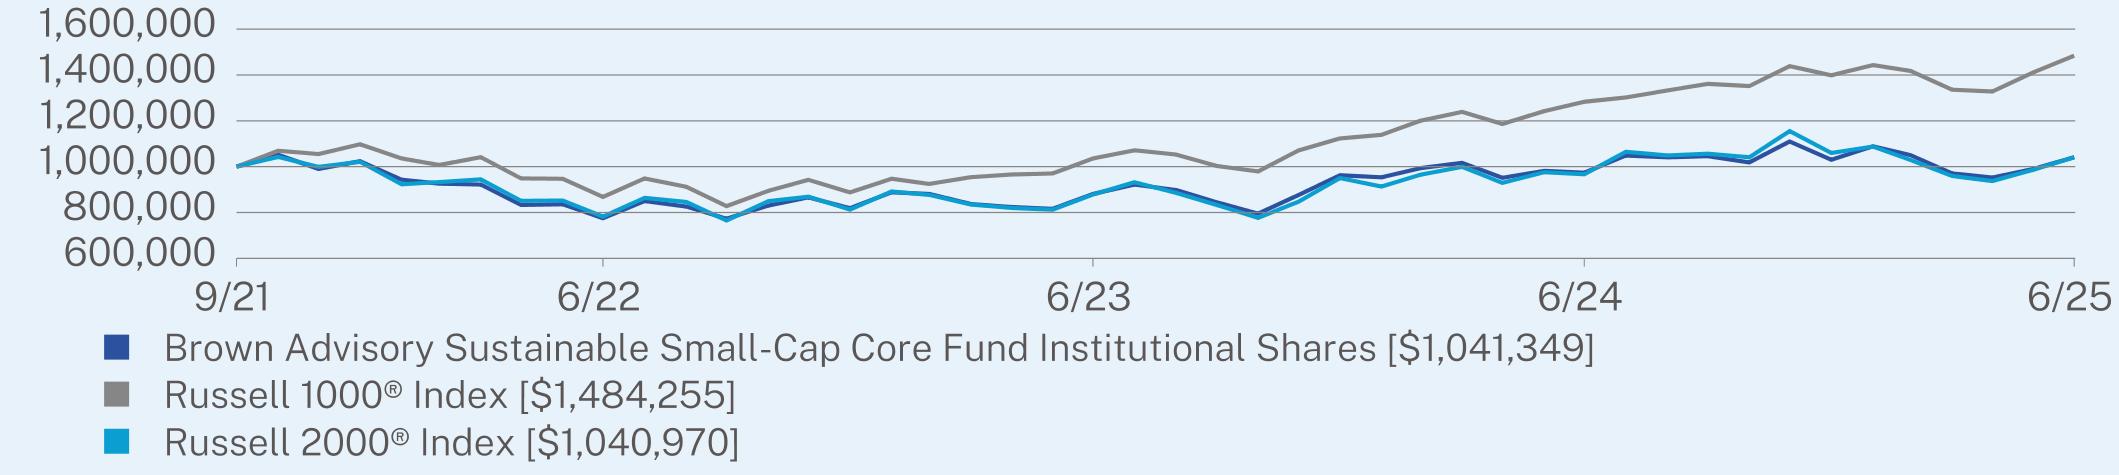
ANNUAL AVERAGE TOTAL RETURN (%)
|
|
1 Year
|
Since Inception
(09/30/2021) |
|
Institutional Shares
|
6.96
|
1.09
|
|
Russell 1000® Index
|
15.66
|
11.11
|
|
Russell 2000® Index
|
7.68
|
1.08
|
Visit https://www.brownadvisory.com/mf/funds/sustainable-small-cap-core-fund for recent performance information.
KEY FUND STATISTICS (as of June 30, 2025)
|
Net Assets
|
$99,422,927
|
|
Number of Holdings
|
74
|
|
Net Advisory Fee
|
$664,803
|
|
Portfolio Turnover
|
43%
|
|
Top Sectors*
|
(%)
|
|
Industrials
|
19.8%
|
|
Financials
|
19.0%
|
|
Health Care
|
15.8%
|
|
Information Technology
|
14.5%
|
|
Consumer Discretionary
|
9.3%
|
|
Real Estate
|
5.0%
|
|
Consumer Staples
|
3.2%
|
|
Utilities
|
3.2%
|
|
Communication Services
|
3.0%
|
|
Cash & Other
|
7.2%
|
|
Top 10 Issuers
|
(%)
|
|
First American Government Obligations Fund
|
4.5%
|
|
Talen Energy Corp.
|
3.2%
|
|
Bancorp, Inc.
|
2.9%
|
|
Encompass Health Corp.
|
2.4%
|
|
SPX Technologies, Inc.
|
2.3%
|
|
Eastern Bankshares, Inc.
|
2.2%
|
|
Old National Bancorp
|
2.0%
|
|
Valmont Industries, Inc.
|
2.0%
|
|
EnPro, Inc.
|
1.9%
|
|
Bright Horizons Family Solutions, Inc.
|
1.9%
|
WHAT WERE THE FUND COSTS FOR THE PAST YEAR? (based on a hypothetical $10,000 investment)
|
Class Name
|
Costs of a $10,000 investment
|
Costs paid as a percentage of a $10,000 investment
|
|
Investor Shares
|
$112
|
1.08%
|
HOW DID THE FUND PERFORM LAST YEAR AND WHAT AFFECTED ITS PERFORMANCE?
For the 12-month period ended June 30, 2025, the Fund underperformed its regulatory benchmark, the Russell 1000® Index.
WHAT FACTORS INFLUENCED PERFORMANCE
Positive contribution to Fund performance was primarily driven by stock selection in the financials and industrials sector, while the consumer discretionary sector was the biggest detractor. The largest individual contributor to performance was Talen Energy Corp (TLN) and the largest individual detractor to performance was KinderCare Learning Companies Inc (KLC).
POSITIONING
We were active during the 12-month period and invested in 24 new companies and exited from 20 companies. Two companies were bought and sold in the quarter. Activity was broad based across sectors, but most heavily focused within the health care, industrials, and information technology sectors. A notable addition to the information technology sector during the period was Mirion Technologies. Mirion Technologies leverages their expertise in ionizing radiation technology to measure the presence of radioactive material in medical diagnostics, nuclear energy, military nuclear threat prevention settings, and deliver radiation therapies to treat cancer. Mirion has high levels of recurring revenue for their nuclear radiation detection, test, and measurement products which are required in any setting where radiation is present. They are benefitting from the growth of nuclear power globally and the increasing use of radiation therapies to treat cancer and other diseases.
|
Top Contributors
|
|
|
↑
|
Talen Energy Corp
|
|
↑
|
Bancorp Inc
|
|
↑
|
Encompass Health Corporation
|
|
↑
|
Inari Medical, Inc.
|
|
↑
|
Mirion Technologies, Inc. Class A
|
|
Top Detractors
|
|
|
↓
|
KinderCare Learning Companies Inc
|
|
↓
|
Onto Innovation, Inc.
|
|
↓
|
Vaxcyte, Inc.
|
|
↓
|
Biohaven Ltd.
|
|
↓
|
Cable One, Inc.
|
PERFORMANCE
Small cap indices continued to face unprecedented underperformance relative to large cap indices during the 12-month period, resulting in the fund underperforming compared to its regulatory benchmark.
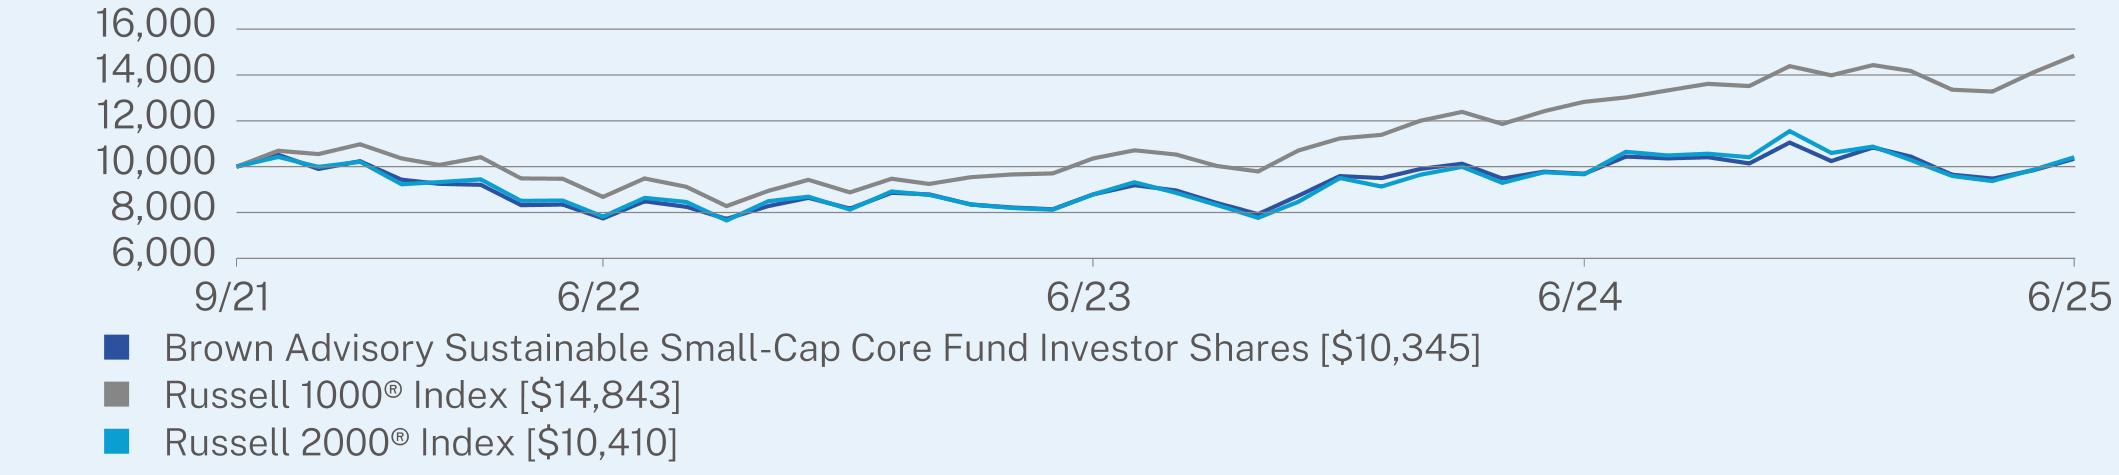
ANNUAL AVERAGE TOTAL RETURN (%)
|
|
1 Year
|
Since Inception
(09/30/2021) |
|
Investor Shares
|
6.74
|
0.91
|
|
Russell 1000® Index
|
15.66
|
11.11
|
|
Russell 2000® Index
|
7.68
|
1.08
|
Visit https://www.brownadvisory.com/mf/funds/sustainable-small-cap-core-fund for recent performance information.
KEY FUND STATISTICS (as of June 30, 2025)
|
Net Assets
|
$99,422,927
|
|
Number of Holdings
|
74
|
|
Net Advisory Fee
|
$664,803
|
|
Portfolio Turnover
|
43%
|
|
Top Sectors*
|
(%)
|
|
Industrials
|
19.8%
|
|
Financials
|
19.0%
|
|
Health Care
|
15.8%
|
|
Information Technology
|
14.5%
|
|
Consumer Discretionary
|
9.3%
|
|
Real Estate
|
5.0%
|
|
Consumer Staples
|
3.2%
|
|
Utilities
|
3.2%
|
|
Communication Services
|
3.0%
|
|
Cash & Other
|
7.2%
|
|
Top 10 Issuers
|
(%)
|
|
First American Government Obligations Fund
|
4.5%
|
|
Talen Energy Corp.
|
3.2%
|
|
Bancorp, Inc.
|
2.9%
|
|
Encompass Health Corp.
|
2.4%
|
|
SPX Technologies, Inc.
|
2.3%
|
|
Eastern Bankshares, Inc.
|
2.2%
|
|
Old National Bancorp
|
2.0%
|
|
Valmont Industries, Inc.
|
2.0%
|
|
EnPro, Inc.
|
1.9%
|
|
Bright Horizons Family Solutions, Inc.
|
1.9%
|
WHAT WERE THE FUND COSTS FOR THE PAST YEAR? (based on a hypothetical $10,000 investment)
|
Class Name
|
Costs of a $10,000 investment
|
Costs paid as a percentage of a $10,000 investment
|
|
Institutional Shares
|
$75
|
0.70%
|
HOW DID THE FUND PERFORM LAST YEAR AND WHAT AFFECTED ITS PERFORMANCE?
For the 12-month period ended June 30, 2025, the Fund underperformed its benchmark, the Russell 1000® Index.
WHAT FACTORS INFLUENCED PERFORMANCE
Health Care, Utilities, and Real Estate were the leading contributors to performance during the period. Energy, Information Technology, and Communication Services were the leading sources of underperformance. Our overweight to health care hurt as the sector lagged the benchmark returns, but this was offset by our strong stock selection. Energy was a detractor to performance during the period as our exposure to oilfield services underperformed other areas of energy such as exploration & production. We were pleased that our performance over the last year was driven by stock selection across the portfolio as opposed to sector allocation.
POSITIONING
During the period, we added five new companies and eliminated six companies. The new additions included two in Health Care, one in Financials, one in Information Technology, and one in Consumer Discretionary. The eliminations included three in Health Care, one in Financials, one in Consumer Discretionary, and one in Information Technology. We remain overweight in Health Care, Financials and Materials and are underweight Information Technology and Consumer Discretionary. We continue to look for high quality businesses that generate consistent high levels of free cash flow, possess a Sustainable Free Cash Flow Advantage, exhibit capital discipline and trade at attractive valuations.
|
Top Contributors
|
|
|
↑
|
Constellation Energy Corporation
|
|
↑
|
Cardinal Health, Inc.
|
|
↑
|
T-Mobile US, Inc.
|
|
↑
|
CRH public limited company
|
|
↑
|
Trane Technologies plc
|
|
Top Detractors
|
|
|
↓
|
Weatherford International plc
|
|
↓
|
Schlumberger Limited
|
|
↓
|
Elevance Health, Inc.
|
|
↓
|
ChampionX Corporation
|
|
↓
|
Merck & Co., Inc.
|
PERFORMANCE
The Fund posted positive returns and underperformed its regulatory benchmark during the period.
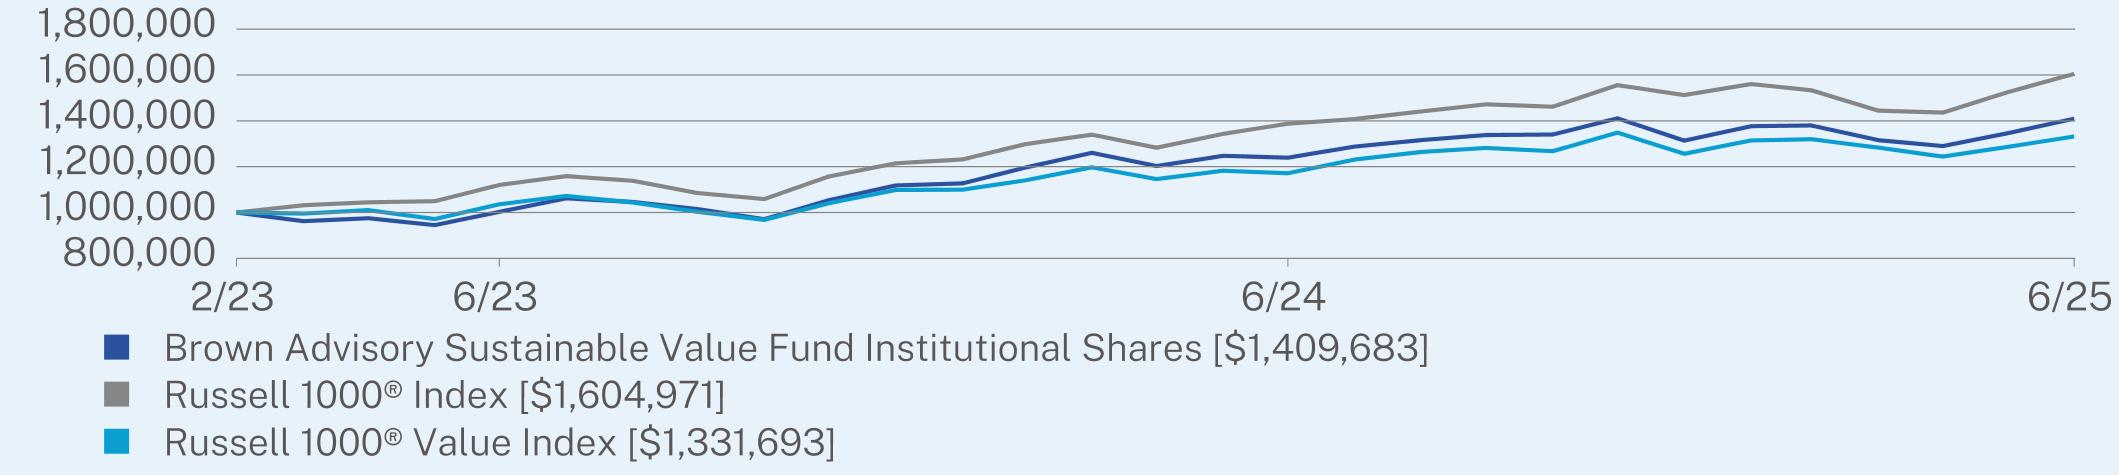
ANNUAL AVERAGE TOTAL RETURN (%)
|
|
1 Year
|
Since Inception
(02/28/2023) |
|
Institutional Shares
|
13.76
|
15.85
|
|
Russell 1000® Index
|
15.66
|
22.47
|
|
Russell 1000® Value Index
|
13.70
|
13.06
|
Visit https://www.brownadvisory.com/mf/funds/sustainable-value-fund for recent performance information.
KEY FUND STATISTICS (as of June 30, 2025)
|
Net Assets
|
$158,641,914
|
|
Number of Holdings
|
42
|
|
Net Advisory Fee
|
$717,079
|
|
Portfolio Turnover
|
29%
|
|
Top Sectors*
|
(%)
|
|
Financials
|
22.1%
|
|
Health Care
|
17.5%
|
|
Information Technology
|
12.3%
|
|
Industrials
|
11.5%
|
|
Communication Services
|
7.9%
|
|
Energy
|
4.9%
|
|
Consumer Staples
|
4.7%
|
|
Materials
|
4.5%
|
|
Consumer Discretionary
|
4.3%
|
|
Cash & Other
|
10.3%
|
|
Top 10 Issuers
|
(%)
|
|
First American Government Obligations Fund
|
5.3%
|
|
CRH PLC
|
4.5%
|
|
Ferguson Enterprises, Inc.
|
4.2%
|
|
Sanofi SA
|
4.1%
|
|
Cardinal Health, Inc.
|
4.1%
|
|
American International Group, Inc.
|
3.8%
|
|
Unilever PLC
|
3.8%
|
|
Bank of America Corp.
|
3.7%
|
|
Constellation Energy Corp.
|
3.5%
|
|
Willis Towers Watson PLC
|
3.5%
|
WHAT WERE THE FUND COSTS FOR THE PAST YEAR? (based on a hypothetical $10,000 investment)
|
Class Name
|
Costs of a $10,000 investment
|
Costs paid as a percentage of a $10,000 investment
|
|
Investor Shares
|
$91
|
0.85%
|
HOW DID THE FUND PERFORM LAST YEAR AND WHAT AFFECTED ITS PERFORMANCE?
For the 12-month period ended June 30, 2025, the Fund underperformed its benchmark, the Russell 1000® Index.
WHAT FACTORS INFLUENCED PERFORMANCE
Health Care, Utilities, and Real Estate were the leading contributors to performance during the period. Energy, Information Technology, and Communication Services were the leading sources of underperformance. Our overweight to health care hurt as the sector lagged the benchmark returns, but this was offset by our strong stock selection. Energy was a detractor to performance during the period as our exposure to oilfield services underperformed other areas of energy such as exploration & production. We were pleased that our performance over the last year was driven by stock selection across the portfolio as opposed to sector allocation.
POSITIONING
During the period, we added five new companies and eliminated six companies. The new additions included two in Health Care, one in Financials, one in Information Technology, and one in Consumer Discretionary. The eliminations included three in Health Care, one in Financials, one in Consumer Discretionary, and one in Information Technology. We remain overweight in Health Care, Financials and Materials and are underweight Information Technology and Consumer Discretionary. We continue to look for high quality businesses that generate consistent high levels of free cash flow, possess a Sustainable Free Cash Flow Advantage, exhibit capital discipline and trade at attractive valuations.
|
Top Contributors
|
|
|
↑
|
Constellation Energy Corporation
|
|
↑
|
Cardinal Health, Inc.
|
|
↑
|
T-Mobile US, Inc.
|
|
↑
|
CRH public limited company
|
|
↑
|
Trane Technologies plc
|
|
Top Detractors
|
|
|
↓
|
Weatherford International plc
|
|
↓
|
Schlumberger Limited
|
|
↓
|
Elevance Health, Inc.
|
|
↓
|
ChampionX Corporation
|
|
↓
|
Merck & Co., Inc.
|
PERFORMANCE
The Fund posted positive returns and underperformed its regulatory benchmark during the period.
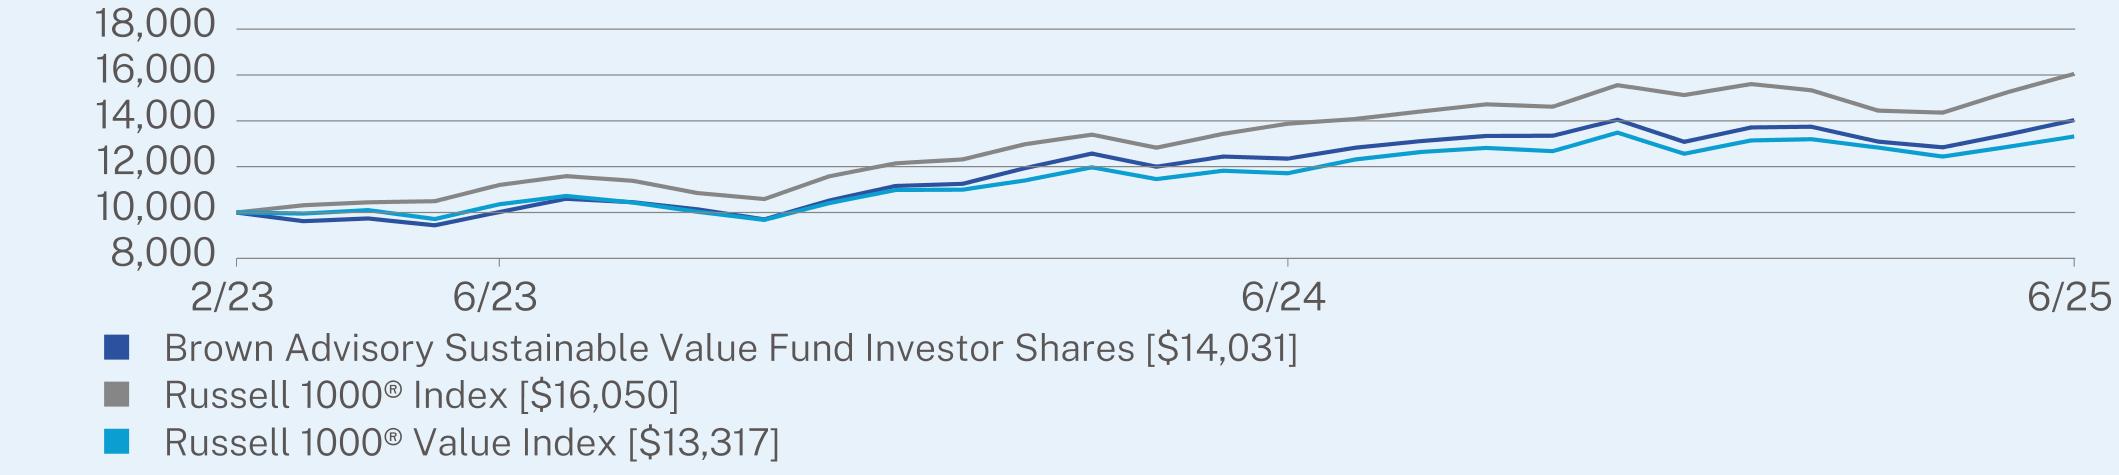
ANNUAL AVERAGE TOTAL RETURN (%)
|
|
1 Year
|
Since Inception
(02/28/2023) |
|
Investor Shares
|
13.60
|
15.61
|
|
Russell 1000® Index
|
15.66
|
22.47
|
|
Russell 1000® Value Index
|
13.70
|
13.06
|
Visit https://www.brownadvisory.com/mf/funds/sustainable-value-fund for recent performance information.
KEY FUND STATISTICS (as of June 30, 2025)
|
Net Assets
|
$158,641,914
|
|
Number of Holdings
|
42
|
|
Net Advisory Fee
|
$717,079
|
|
Portfolio Turnover
|
29%
|
|
Top Sectors*
|
(%)
|
|
Financials
|
22.1%
|
|
Health Care
|
17.5%
|
|
Information Technology
|
12.3%
|
|
Industrials
|
11.5%
|
|
Communication Services
|
7.9%
|
|
Energy
|
4.9%
|
|
Consumer Staples
|
4.7%
|
|
Materials
|
4.5%
|
|
Consumer Discretionary
|
4.3%
|
|
Cash & Other
|
10.3%
|
|
Top 10 Issuers
|
(%)
|
|
First American Government Obligations Fund
|
5.3%
|
|
CRH PLC
|
4.5%
|
|
Ferguson Enterprises, Inc.
|
4.2%
|
|
Sanofi SA
|
4.1%
|
|
Cardinal Health, Inc.
|
4.1%
|
|
American International Group, Inc.
|
3.8%
|
|
Unilever PLC
|
3.8%
|
|
Bank of America Corp.
|
3.7%
|
|
Constellation Energy Corp.
|
3.5%
|
|
Willis Towers Watson PLC
|
3.5%
|
WHAT WERE THE FUND COSTS FOR THE PAST YEAR? (based on a hypothetical $10,000 investment)
|
Class Name
|
Costs of a $10,000 investment
|
Costs paid as a percentage of a $10,000 investment
|
|
Institutional Shares
|
$81
|
0.75%
|
HOW DID THE FUND PERFORM LAST YEAR AND WHAT AFFECTED ITS PERFORMANCE?
For the 12-month period ended June 30, 2025, the Fund outperformed its benchmark, the MSCI All Country World Index (ACWI).
WHAT FACTORS INFLUENCED PERFORMANCE
Outperformance was driven primarily by financials, consumer discretionary and industrials. Financials performed strongly in the face of volatility (e.g. Deutsche Boerse, B3), delivering counter-cyclical ballast to the portfolio. Industrials contributed to relative performance, particularly through the ongoing contribution of aerospace. Health Care contributed negatively, and we have exited two health care companies during the reporting period. Technology performed strongly in absolute terms. The Fund delivered downside capture during the market weakness in early 2025. While not an explicit target, we aim to identify companies that can help insulate our investors in bad times so we can compound a smaller loss thereafter.
POSITIONING
We are looking for high-quality companies with superior customer outcomes that we believe are able to pass on prices and generate high levels of recurring revenue while requiring low leverage. Sector and country diversification is an output of investment selection and capital allocation. During the year we added Rentokil and Experian. We exited TJX Companies, Adobe and Coloplast. We initiated and exited Illumina following an unusually short holding period due to a combination of supply-side and demand-side risks impacting our thesis.
|
Top Contributors
|
|
|
↑
|
Deutsche Boerse AG
|
|
↑
|
GE Aerospace
|
|
↑
|
Safran SA
|
|
↑
|
Mastercard Incorporated Class A
|
|
↑
|
London Stock Exchange Group plc
|
|
Top Detractors
|
|
|
↓
|
Illumina, Inc.
|
|
↓
|
Adobe Inc.
|
|
↓
|
Alphabet Inc. Class C
|
|
↓
|
Edwards Lifesciences Corporation
|
|
↓
|
Zoetis, Inc. Class A
|
PERFORMANCE
The Fund delivered absolute positive performance during the reporting period, outperforming the benchmark.
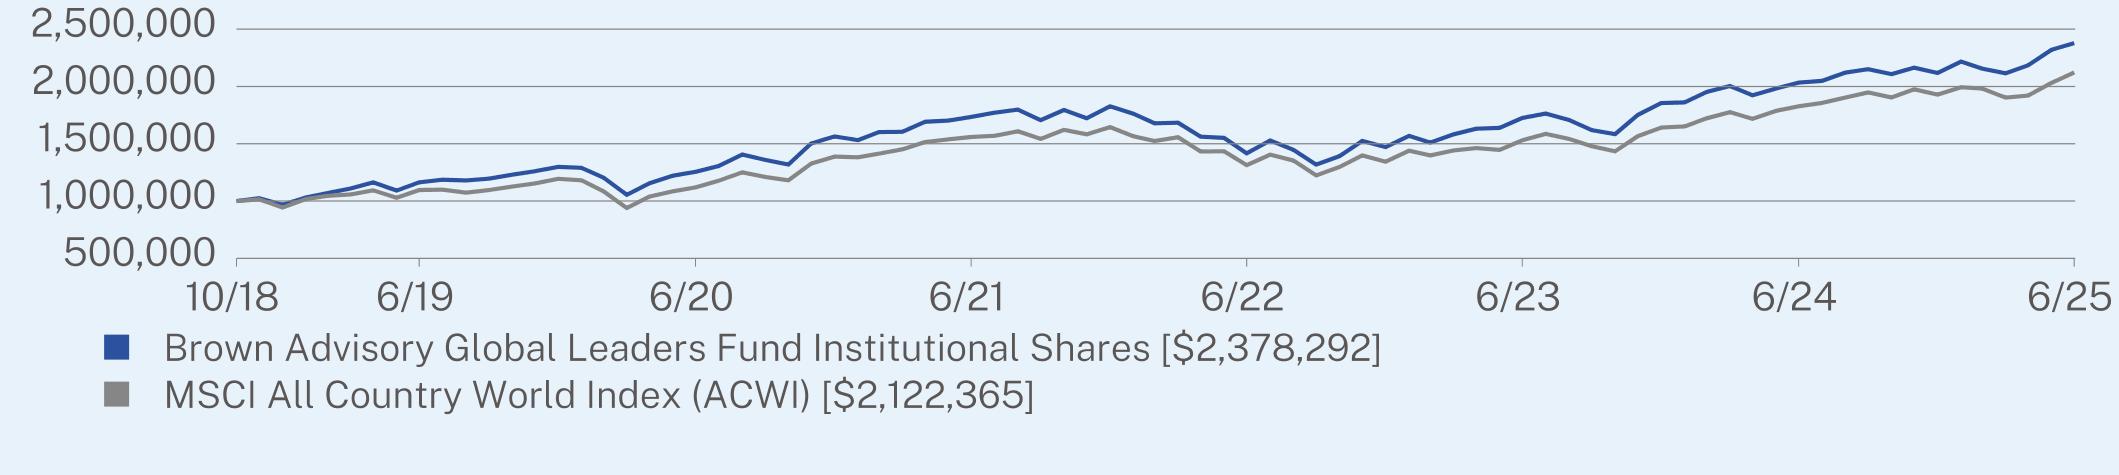
ANNUAL AVERAGE TOTAL RETURN (%)
|
|
1 Year
|
5 Year
|
Since Inception
(10/31/2018) |
|
Institutional Shares
|
16.95
|
13.64
|
13.88
|
|
MSCI All Country World Index (ACWI)
|
16.17
|
13.65
|
11.96
|
Visit https://www.brownadvisory.com/mf/funds/global-leaders-fund for recent performance information.
KEY FUND STATISTICS (as of June 30, 2025)
|
Net Assets
|
$2,417,663,440
|
|
Number of Holdings
|
34
|
|
Net Advisory Fee
|
$13,850,998
|
|
Portfolio Turnover
|
22%
|
|
Top Sectors*
|
(%)
|
|
Financials
|
32.8%
|
|
Information Technology
|
22.7%
|
|
Industrials
|
18.9%
|
|
Health Care
|
8.1%
|
|
Communication Services
|
5.4%
|
|
Consumer Discretionary
|
4.5%
|
|
Consumer Staples
|
3.9%
|
|
Materials
|
1.5%
|
|
Cash & Other
|
2.2%
|
|
Top 10 Issuers
|
(%)
|
|
Microsoft Corp.
|
9.4%
|
|
London Stock Exchange Group PLC
|
4.9%
|
|
Deutsche Boerse AG
|
4.6%
|
|
Visa, Inc.
|
4.3%
|
|
Unilever PLC
|
3.9%
|
|
Mastercard, Inc.
|
3.8%
|
|
Intuit, Inc.
|
3.8%
|
|
Safran SA
|
3.3%
|
|
Alphabet, Inc.
|
3.3%
|
|
HDFC Bank Ltd.
|
3.2%
|
|
Top 10 Countries
|
(%)
|
|
United States
|
54.2%
|
|
United Kingdom
|
12.9%
|
|
Germany
|
6.7%
|
|
Netherlands
|
4.6%
|
|
France
|
3.3%
|
|
India
|
3.2%
|
|
Switzerland
|
3.0%
|
|
China
|
2.8%
|
|
Brazil
|
2.8%
|
|
Taiwan
|
2.5%
|
WHAT WERE THE FUND COSTS FOR THE PAST YEAR? (based on a hypothetical $10,000 investment)
|
Class Name
|
Costs of a $10,000 investment
|
Costs paid as a percentage of a $10,000 investment
|
|
Investor Shares
|
$98
|
0.90%
|
HOW DID THE FUND PERFORM LAST YEAR AND WHAT AFFECTED ITS PERFORMANCE?
For the 12-month period ended June 30, 2025, the Fund outperformed its benchmark, the MSCI All Country World Index (ACWI).
WHAT FACTORS INFLUENCED PERFORMANCE
Outperformance was driven primarily by financials, consumer discretionary and industrials. Financials performed strongly in the face of volatility (e.g. Deutsche Boerse, B3), delivering counter-cyclical ballast to the portfolio. Industrials contributed to relative performance, particularly through the ongoing contribution of aerospace. Health Care contributed negatively, and we have exited two health care companies during the reporting period. Technology performed strongly in absolute terms. The Fund delivered downside capture during the market weakness in early 2025. While not an explicit target, we aim to identify companies that can help insulate our investors in bad times so we can compound a smaller loss thereafter.
POSITIONING
We are looking for high-quality companies with superior customer outcomes that we believe are able to pass on prices and generate high levels of recurring revenue while requiring low leverage. Sector and country diversification is an output of investment selection and capital allocation. During the year we added Rentokil and Experian. We exited TJX Companies, Adobe and Coloplast. We initiated and exited Illumina following an unusually short holding period due to a combination of supply-side and demand-side risks impacting our thesis.
|
Top Contributors
|
|
|
↑
|
Deutsche Boerse AG
|
|
↑
|
GE Aerospace
|
|
↑
|
Safran SA
|
|
↑
|
Mastercard Incorporated Class A
|
|
↑
|
London Stock Exchange Group plc
|
|
Top Detractors
|
|
|
↓
|
Illumina, Inc.
|
|
↓
|
Adobe Inc.
|
|
↓
|
Alphabet Inc. Class C
|
|
↓
|
Edwards Lifesciences Corporation
|
|
↓
|
Zoetis, Inc. Class A
|
PERFORMANCE
The Fund delivered absolute positive performance during the reporting period, outperforming the benchmark.
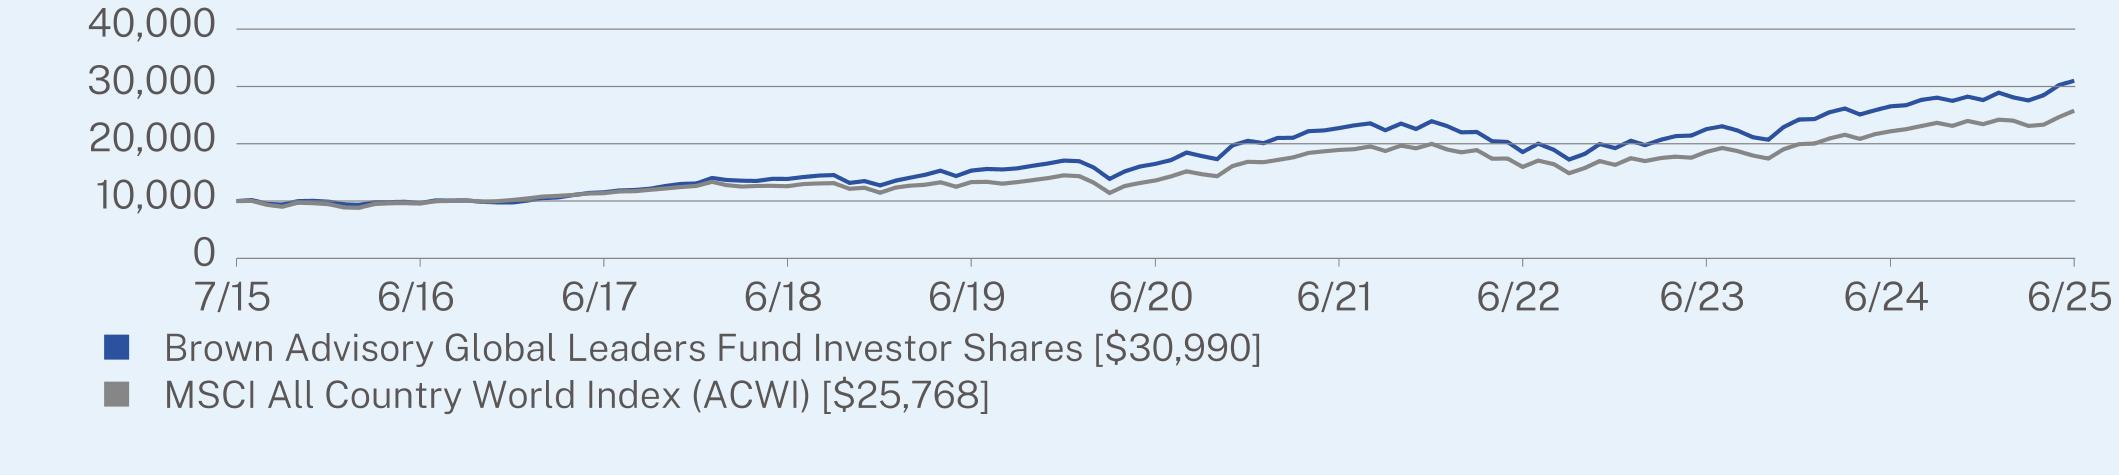
ANNUAL AVERAGE TOTAL RETURN (%)
|
|
1 Year
|
5 Year
|
Since Inception
(07/01/2015) |
|
Investor Shares
|
16.78
|
13.45
|
11.98
|
|
MSCI All Country World Index (ACWI)
|
16.17
|
13.65
|
9.93
|
Visit https://www.brownadvisory.com/mf/funds/global-leaders-fund for recent performance information.
KEY FUND STATISTICS (as of June 30, 2025)
|
Net Assets
|
$2,417,663,440
|
|
Number of Holdings
|
34
|
|
Net Advisory Fee
|
$13,850,998
|
|
Portfolio Turnover
|
22%
|
|
Top Sectors*
|
(%)
|
|
Financials
|
32.8%
|
|
Information Technology
|
22.7%
|
|
Industrials
|
18.9%
|
|
Health Care
|
8.1%
|
|
Communication Services
|
5.4%
|
|
Consumer Discretionary
|
4.5%
|
|
Consumer Staples
|
3.9%
|
|
Materials
|
1.5%
|
|
Cash & Other
|
2.2%
|
|
Top 10 Issuers
|
(%)
|
|
Microsoft Corp.
|
9.4%
|
|
London Stock Exchange Group PLC
|
4.9%
|
|
Deutsche Boerse AG
|
4.6%
|
|
Visa, Inc.
|
4.3%
|
|
Unilever PLC
|
3.9%
|
|
Mastercard, Inc.
|
3.8%
|
|
Intuit, Inc.
|
3.8%
|
|
Safran SA
|
3.3%
|
|
Alphabet, Inc.
|
3.3%
|
|
HDFC Bank Ltd.
|
3.2%
|
|
Top 10 Countries
|
(%)
|
|
United States
|
54.2%
|
|
United Kingdom
|
12.9%
|
|
Germany
|
6.7%
|
|
Netherlands
|
4.6%
|
|
France
|
3.3%
|
|
India
|
3.2%
|
|
Switzerland
|
3.0%
|
|
China
|
2.8%
|
|
Brazil
|
2.8%
|
|
Taiwan
|
2.5%
|
WHAT WERE THE FUND COSTS FOR THE PAST YEAR? (based on a hypothetical $10,000 investment)
|
Class Name
|
Costs of a $10,000 investment
|
Costs paid as a percentage of a $10,000 investment
|
|
Institutional Shares
|
$92
|
0.85%
|
HOW DID THE FUND PERFORM LAST YEAR AND WHAT AFFECTED ITS PERFORMANCE?
For the 12-month period ended June 30, 2025, the Fund underperformed its benchmark, the MSCI ACWI ex USA Index.
WHAT FACTORS INFLUENCED PERFORMANCE
Underperformance was driven primarily by Industrials and Information Technology. Within Technology it was mainly the exposure to semiconductor end markets that are still recovering from cyclical lows (eg. NXP Semiconductor; certain ASML end markets) that detracted from performance. Health Care was the largest relative, positive contributor to performance while Financials delivered the largest contribution to absolute returns. The main driver being the counter-cyclical revenue drivers of financial market infrastructure companies (eg. Deutsche Boerse, B3) that benefited from the market volatility in 2025.
POSITIONING
International equity indices outperformed both global and U.S. indices over the reporting period and especially since the beginning of 2025. The Fund benefited from its regional exposure with the largest allocation being to Europe. During the year we added Richemont, Amadeus IT, AstraZeneca, Anta Sports, SAP and Taiwan Semiconductor Manufacturing. We exited Coloplast. We look for competitively advantaged businesses that earn high returns on invested capital (ROIC), are run by capable management teams and are attractively valued, have the ability to generate attractive through-the-cycle shareholder returns. Sector and country diversification is an output of stock picking.
|
Top Contributors
|
|
|
↑
|
Deutsche Boerse AG
|
|
↑
|
Safran SA
|
|
↑
|
Airbus SE
|
|
↑
|
B3 SA - Brasil, Bolsa, Balcao
|
|
↑
|
CTS Eventim AG & Co. KGaA
|
|
Top Detractors
|
|
|
↓
|
LVMH Moet Hennessy Louis Vuitton SE
|
|
↓
|
Rentokil Initial plc
|
|
↓
|
NXP Semiconductors NV
|
|
↓
|
Diageo plc
|
|
↓
|
ASML Holding NV
|
PERFORMANCE
The Fund delivered absolute positive performance during the reporting period, underperforming the benchmark.
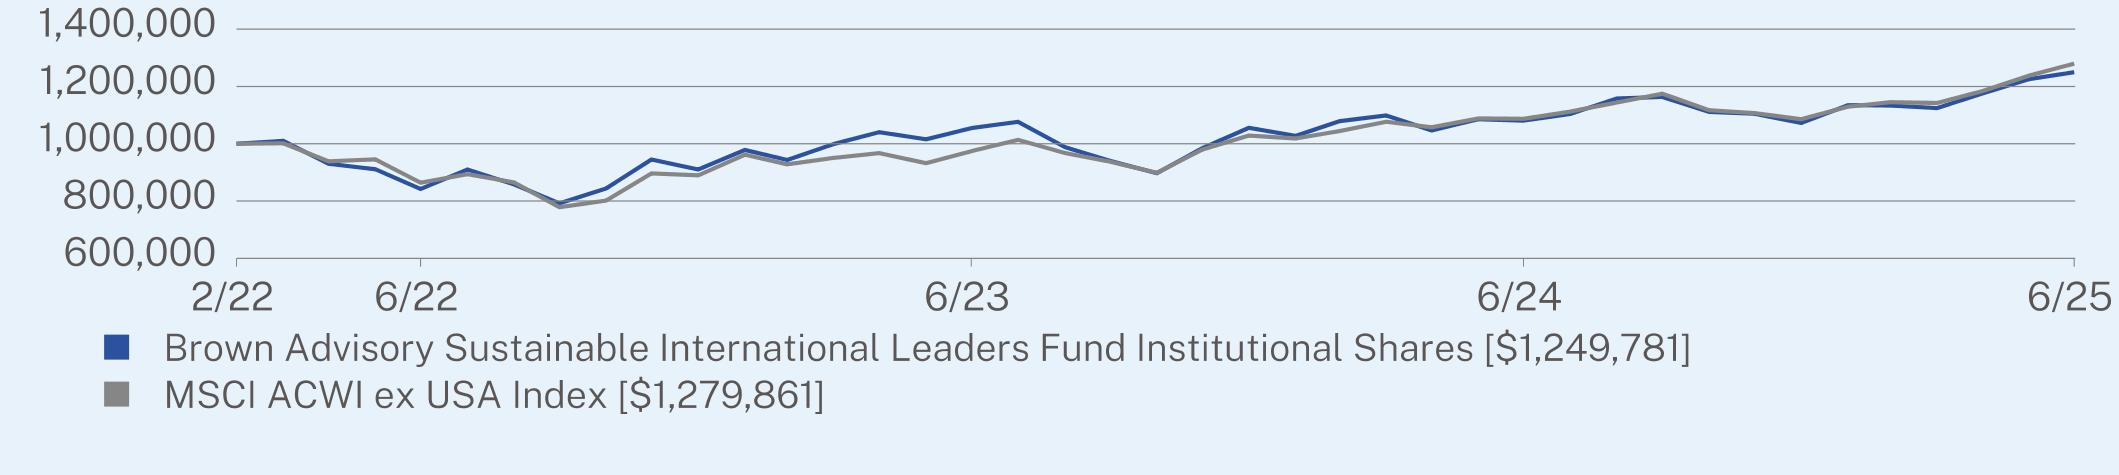
ANNUAL AVERAGE TOTAL RETURN (%)
|
|
1 Year
|
Since Inception
(02/28/2022) |
|
Institutional Shares
|
15.64
|
6.92
|
|
MSCI ACWI ex USA Index
|
17.72
|
7.68
|
Visit https://www.brownadvisory.com/mf/funds/sustainable-international-leaders-fund for recent performance information.
KEY FUND STATISTICS (as of June 30, 2025)
|
Net Assets
|
$42,021,685
|
|
Number of Holdings
|
35
|
|
Net Advisory Fee
|
$163,359
|
|
Portfolio Turnover
|
47%
|
|
Top Sectors*
|
(%)
|
|
Industrials
|
31.2%
|
|
Financials
|
24.7%
|
|
Consumer Discretionary
|
16.1%
|
|
Information Technology
|
13.2%
|
|
Health Care
|
6.5%
|
|
Communication Services
|
2.9%
|
|
Consumer Staples
|
2.6%
|
|
Cash & Other
|
2.8%
|
|
Top 10 Issuers
|
(%)
|
|
Deutsche Boerse AG
|
6.4%
|
|
London Stock Exchange Group PLC
|
5.2%
|
|
Howden Joinery Group PLC
|
4.7%
|
|
Experian PLC
|
4.3%
|
|
Airbus SE
|
4.1%
|
|
HDFC Bank Ltd.
|
3.8%
|
|
AIA Group Ltd.
|
3.8%
|
|
Wolters Kluwer NV
|
3.7%
|
|
Rentokil Initial PLC
|
3.5%
|
|
Taiwan Semiconductor Manufacturing Co., Ltd.
|
3.4%
|
|
Top 10 Countries
|
(%)
|
|
United Kingdom
|
27.4%
|
|
Germany
|
10.3%
|
|
France
|
10.2%
|
|
United States
|
8.2%
|
|
Netherlands
|
6.7%
|
|
China
|
5.1%
|
|
India
|
5.1%
|
|
Switzerland
|
3.9%
|
|
Japan
|
3.5%
|
|
Taiwan
|
3.4%
|
WHAT WERE THE FUND COSTS FOR THE PAST YEAR? (based on a hypothetical $10,000 investment)
|
Class Name
|
Costs of a $10,000 investment
|
Costs paid as a percentage of a $10,000 investment
|
|
Investor Shares
|
$108
|
1.00%
|
HOW DID THE FUND PERFORM LAST YEAR AND WHAT AFFECTED ITS PERFORMANCE?
For the 12-month period ended June 30, 2025, the Fund underperformed its benchmark, the MSCI ACWI ex USA Index.
WHAT FACTORS INFLUENCED PERFORMANCE
Underperformance was driven primarily by Industrials and Information Technology. Within Technology it was mainly the exposure to semiconductor end markets that are still recovering from cyclical lows (eg. NXP Semiconductor; certain ASML end markets) that detracted from performance. Health Care was the largest relative, positive contributor to performance while Financials delivered the largest contribution to absolute returns. The main driver being the counter-cyclical revenue drivers of financial market infrastructure companies (eg. Deutsche Boerse, B3) that benefited from the market volatility in 2025.
POSITIONING
International equity indices outperformed both global and U.S. indices over the reporting period and especially since the beginning of 2025. The Fund benefited from its regional exposure with the largest allocation being to Europe. During the year we added Richemont, Amadeus IT, AstraZeneca, Anta Sports, SAP and Taiwan Semiconductor Manufacturing. We exited Coloplast. We look for competitively advantaged businesses that earn high returns on invested capital (ROIC), are run by capable management teams and are attractively valued, have the ability to generate attractive through-the-cycle shareholder returns. Sector and country diversification is an output of stock picking.
|
Top Contributors
|
|
|
↑
|
Deutsche Boerse AG
|
|
↑
|
Safran SA
|
|
↑
|
Airbus SE
|
|
↑
|
B3 SA - Brasil, Bolsa, Balcao
|
|
↑
|
CTS Eventim AG & Co. KGaA
|
|
Top Detractors
|
|
|
↓
|
LVMH Moet Hennessy Louis Vuitton SE
|
|
↓
|
Rentokil Initial plc
|
|
↓
|
NXP Semiconductors NV
|
|
↓
|
Diageo plc
|
|
↓
|
ASML Holding NV
|
PERFORMANCE
The Fund delivered absolute positive performance during the reporting period, underperforming the benchmark.
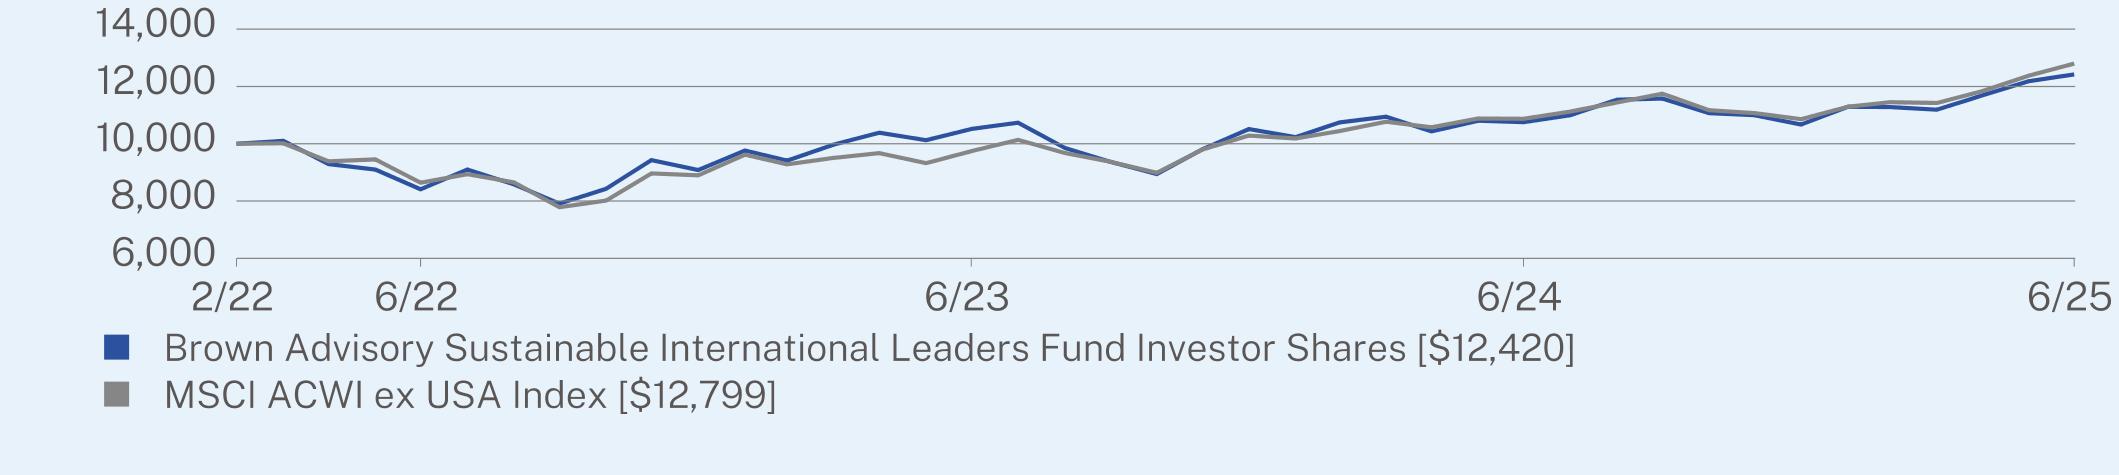
ANNUAL AVERAGE TOTAL RETURN (%)
|
|
1 Year
|
Since Inception
(02/28/2022) |
|
Investor Shares
|
15.49
|
6.71
|
|
MSCI ACWI ex USA Index
|
17.72
|
7.68
|
Visit https://www.brownadvisory.com/mf/funds/sustainable-international-leaders-fund for recent performance information.
KEY FUND STATISTICS (as of June 30, 2025)
|
Net Assets
|
$42,021,685
|
|
Number of Holdings
|
35
|
|
Net Advisory Fee
|
$163,359
|
|
Portfolio Turnover
|
47%
|
|
Top Sectors*
|
(%)
|
|
Industrials
|
31.2%
|
|
Financials
|
24.7%
|
|
Consumer Discretionary
|
16.1%
|
|
Information Technology
|
13.2%
|
|
Health Care
|
6.5%
|
|
Communication Services
|
2.9%
|
|
Consumer Staples
|
2.6%
|
|
Cash & Other
|
2.8%
|
|
Top 10 Issuers
|
(%)
|
|
Deutsche Boerse AG
|
6.4%
|
|
London Stock Exchange Group PLC
|
5.2%
|
|
Howden Joinery Group PLC
|
4.7%
|
|
Experian PLC
|
4.3%
|
|
Airbus SE
|
4.1%
|
|
HDFC Bank Ltd.
|
3.8%
|
|
AIA Group Ltd.
|
3.8%
|
|
Wolters Kluwer NV
|
3.7%
|
|
Rentokil Initial PLC
|
3.5%
|
|
Taiwan Semiconductor Manufacturing Co., Ltd.
|
3.4%
|
|
Top 10 Countries
|
(%)
|
|
United Kingdom
|
27.4%
|
|
Germany
|
10.3%
|
|
France
|
10.2%
|
|
United States
|
8.2%
|
|
Netherlands
|
6.7%
|
|
China
|
5.1%
|
|
India
|
5.1%
|
|
Switzerland
|
3.9%
|
|
Japan
|
3.5%
|
|
Taiwan
|
3.4%
|
WHAT WERE THE FUND COSTS FOR THE PAST YEAR? (based on a hypothetical $10,000 investment)
|
Class Name
|
Costs of a $10,000 investment
|
Costs paid as a percentage of a $10,000 investment
|
|
Investor Shares
|
$55
|
0.53%
|
HOW DID THE FUND PERFORM LAST YEAR AND WHAT AFFECTED ITS PERFORMANCE?
For the 12-month period ending June 30, 2025, the Fund outperformed its regulatory benchmark, the Bloomberg U.S. Aggregate Bond Index.
WHAT FACTORS INFLUENCED PERFORMANCE
Although we experienced periods of risk aversion during the period, there was a decidedly robust bid for risk assets, especially after the tariff announcement. Positive contributions to performance were led by an overweight position in corporate credit during a period of compressing spreads. Security selection within corporate bonds was additive throughout the period as well given our downside focused research efforts. Our ongoing overweight in asset-backed bonds was additive as securitized credit outperformed mortgage bonds in a volatile interest rate environment. Active yield curve management resulted in mixed performance results as our mild yield curve steepening posture detracted at times as expected policy accommodation wax and waned.
POSITIONING
We maintained a mildly overweight duration profile over the entirety of the period, adjusting as dictated by incoming economic data. The Fund added to its overweight allocation to corporate bonds, market value and spread duration, based on elevated yields and ongoing strong corporate fundamentals. We continued to maintain a mildly overweight position in agency-backed mortgage bonds due to relatively attractive spreads and overall yields.
PERFORMANCE
The Fund outperformed its regulatory benchmark for the reported period. Exposure to spread sectors were additive as the economy continued to perform. This performance was further bolstered by strong corporate bond selection as fundamentals remained strong and spreads tightened markedly, especially after a bout of weakness post-tariff announcement. The primary detractors were duration positioning and mortgage bonds in a volatile interest rate environment.
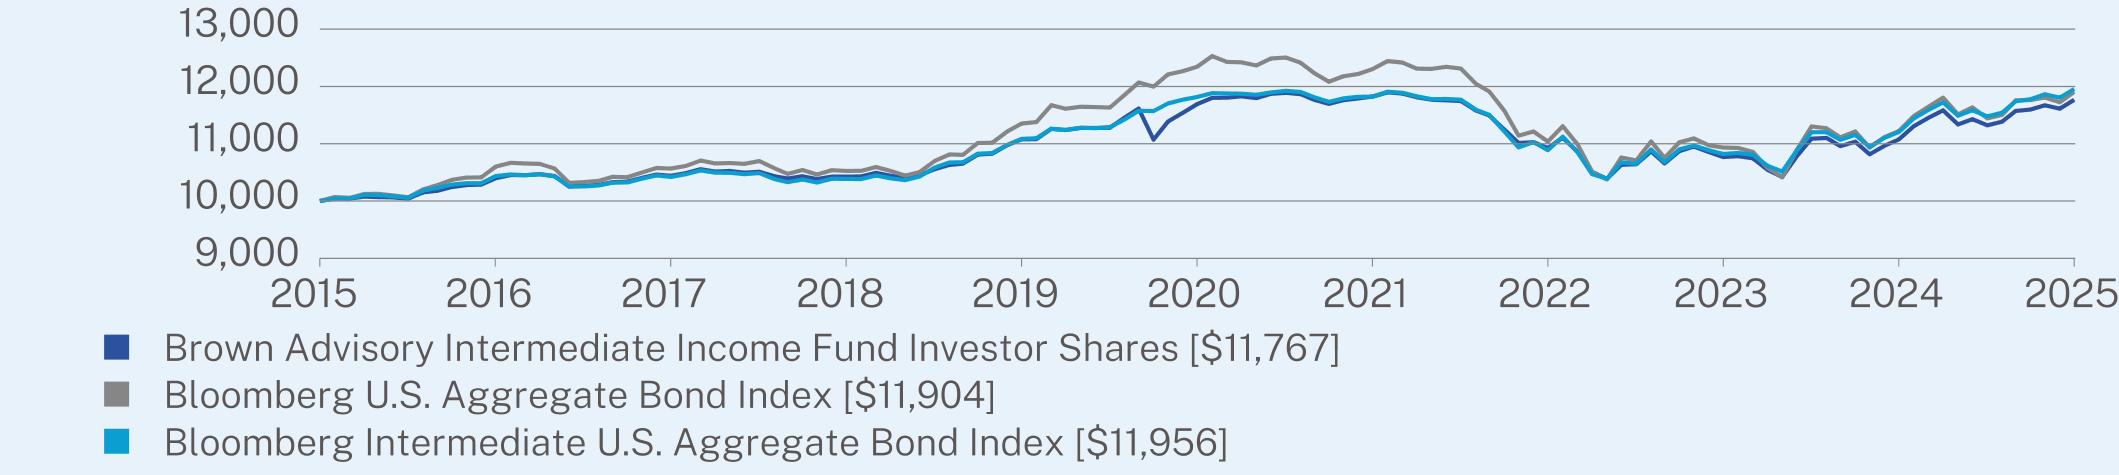
ANNUAL AVERAGE TOTAL RETURN (%)
|
|
1 Year
|
5 Year
|
10 Year
|
|
Investor Shares
|
6.24
|
0.13
|
1.64
|
|
Bloomberg U.S. Aggregate Bond Index
|
6.08
|
-0.73
|
1.76
|
|
Bloomberg Intermediate U.S. Aggregate Bond Index
|
6.69
|
0.23
|
1.80
|
Visit https://www.brownadvisory.com/mf/funds/intermediate-income-fund for recent performance information.
KEY FUND STATISTICS (as of June 30, 2025)
|
Net Assets
|
$128,582,672
|
|
Number of Holdings
|
119
|
|
Net Advisory Fee
|
$370,608
|
|
Portfolio Turnover
|
50%
|
|
Security Type
|
(%)
|
|
Agency Residential Mortgage-Backed Securities
|
32.6%
|
|
U.S. Treasury Securities
|
30.8%
|
|
Corporate Bonds
|
27.5%
|
|
Asset-Backed Securities
|
4.4%
|
|
Agency Commercial Mortgage-Backed Securities
|
1.8%
|
|
Money Market Funds
|
0.9%
|
|
Non-Agency Residential Mortgage-Backed Securities
|
0.5%
|
|
Non-Agency Commercial Mortgage-Backed Securities
|
0.5%
|
|
Futures Contracts
|
0.0%
|
|
Cash & Other
|
1.0%
|
|
Top 10 Issuers
|
(%)
|
|
United States Treasury Note
|
30.8%
|
|
Federal National Mortgage Association
|
17.8%
|
|
Federal Home Loan Mortgage Corp.
|
11.4%
|
|
Ginnie Mae II Pool
|
5.1%
|
|
Waste Connections, Inc.
|
1.5%
|
|
Verizon Master Trust
|
1.0%
|
|
AerCap Ireland Capital DAC / AerCap Global Aviation Trust
|
1.0%
|
|
Prologis LP
|
1.0%
|
|
Analog Devices, Inc.
|
1.0%
|
|
Kroger Co.
|
1.0%
|
WHAT WERE THE FUND COSTS FOR THE PAST YEAR? (based on a hypothetical $10,000 investment)
|
Class Name
|
Costs of a $10,000 investment
|
Costs paid as a percentage of a $10,000 investment
|
|
Advisor Shares
|
$80
|
0.78%
|
HOW DID THE FUND PERFORM LAST YEAR AND WHAT AFFECTED ITS PERFORMANCE?
For the 12-month period ending June 30, 2025, the Fund underperformed its regulatory benchmark, the Bloomberg U.S. Aggregate Bond Index.
WHAT FACTORS INFLUENCED PERFORMANCE
Although we experienced periods of risk aversion during the period, there was a decidedly robust bid for risk assets, especially after the tariff announcement. Positive contributions to performance were led by an overweight position in corporate credit during a period of compressing spreads. Security selection within corporate bonds was additive throughout the period as well given our downside focused research efforts. Our ongoing overweight in asset-backed bonds was additive as securitized credit outperformed mortgage bonds in a volatile interest rate environment. Active yield curve management resulted in mixed performance results as our mild yield curve steepening posture detracted at times as expected policy accommodation wax and waned.
POSITIONING
We maintained a mildly overweight duration profile over the entirety of the period, adjusting as dictated by incoming economic data. The Fund added to its overweight allocation to corporate bonds, market value and spread duration, based on elevated yields and ongoing strong corporate fundamentals. We continued to maintain a mildly overweight position in agency-backed mortgage bonds due to relatively attractive spreads and overall yields.
PERFORMANCE
The Fund underperformed its regulatory benchmark for the reported period. Exposure to spread sectors were additive as the economy continued to perform. This performance was further bolstered by strong corporate bond selection as fundamentals remained strong and spreads tightened markedly, especially after a bout of weakness post-tariff announcement. The primary detractors were duration positioning and mortgage bonds in a volatile interest rate environment.
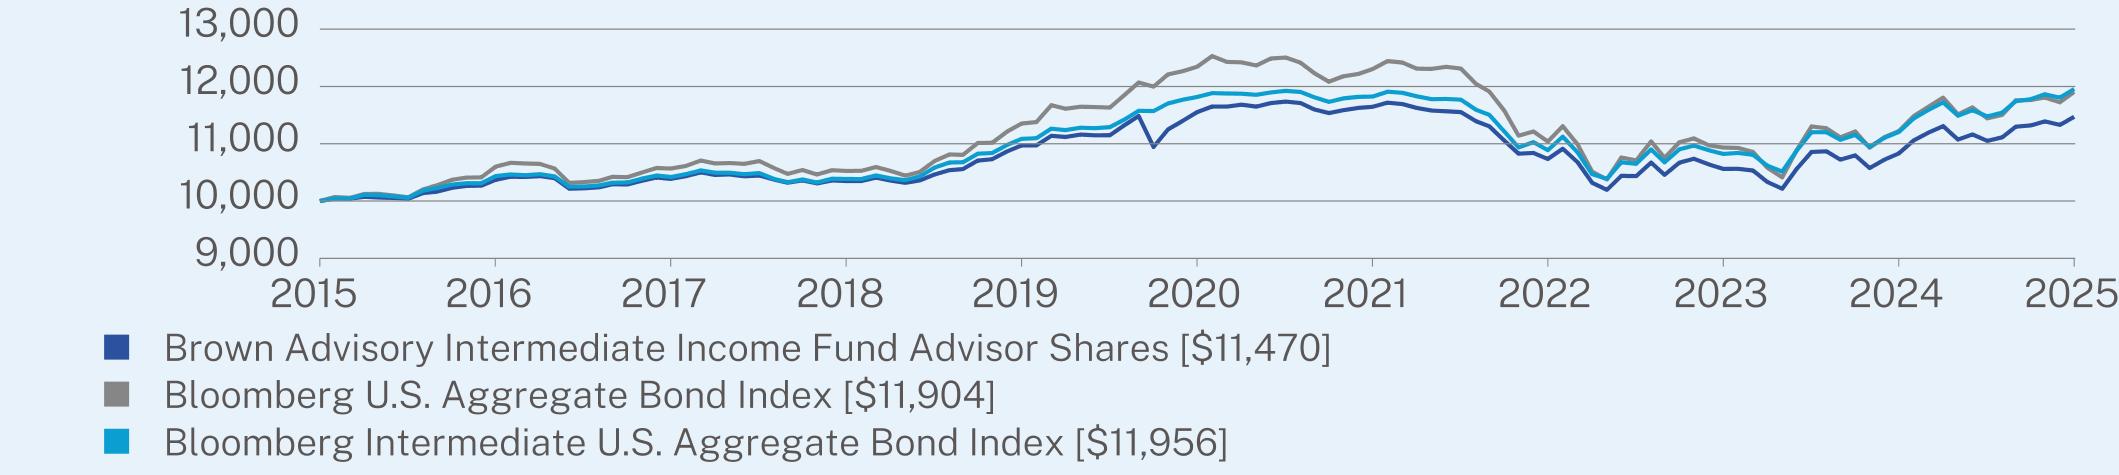
ANNUAL AVERAGE TOTAL RETURN (%)
|
|
1 Year
|
5 Year
|
10 Year
|
|
Advisor Shares
|
5.89
|
-0.14
|
1.38
|
|
Bloomberg U.S. Aggregate Bond Index
|
6.08
|
-0.73
|
1.76
|
|
Bloomberg Intermediate U.S. Aggregate Bond Index
|
6.69
|
0.23
|
1.80
|
Visit https://www.brownadvisory.com/mf/funds/intermediate-income-fund for recent performance information.
KEY FUND STATISTICS (as of June 30, 2025)
|
Net Assets
|
$128,582,672
|
|
Number of Holdings
|
119
|
|
Net Advisory Fee
|
$370,608
|
|
Portfolio Turnover
|
50%
|
|
Security Type
|
(%)
|
|
Agency Residential Mortgage-Backed Securities
|
32.6%
|
|
U.S. Treasury Securities
|
30.8%
|
|
Corporate Bonds
|
27.5%
|
|
Asset-Backed Securities
|
4.4%
|
|
Agency Commercial Mortgage-Backed Securities
|
1.8%
|
|
Money Market Funds
|
0.9%
|
|
Non-Agency Residential Mortgage-Backed Securities
|
0.5%
|
|
Non-Agency Commercial Mortgage-Backed Securities
|
0.5%
|
|
Futures Contracts
|
0.0%
|
|
Cash & Other
|
1.0%
|
|
Top 10 Issuers
|
(%)
|
|
United States Treasury Note
|
30.8%
|
|
Federal National Mortgage Association
|
17.8%
|
|
Federal Home Loan Mortgage Corp.
|
11.4%
|
|
Ginnie Mae II Pool
|
5.1%
|
|
Waste Connections, Inc.
|
1.5%
|
|
Verizon Master Trust
|
1.0%
|
|
AerCap Ireland Capital DAC / AerCap Global Aviation Trust
|
1.0%
|
|
Prologis LP
|
1.0%
|
|
Analog Devices, Inc.
|
1.0%
|
|
Kroger Co.
|
1.0%
|
WHAT WERE THE FUND COSTS FOR THE PAST YEAR? (based on a hypothetical $10,000 investment)
|
Class Name
|
Costs of a $10,000 investment
|
Costs paid as a percentage of a $10,000 investment
|
|
Institutional Shares
|
$42
|
0.41%
|
HOW DID THE FUND PERFORM LAST YEAR AND WHAT AFFECTED ITS PERFORMANCE?
For the 12-month period ended June 30, 2025, the Fund underperformed its regulatory benchmark, the Bloomberg U.S. Aggregate Bond Index.
WHAT FACTORS INFLUENCED PERFORMANCE
Although we experienced periods of risk aversion during the period, there was a decidedly robust bid for risk assets, especially after the tariff announcement. Positive contributors to performance were led by our overweight position in corporate credit and generally positive security selection. Our ongoing overweight in asset-backed bonds was also additive as securitized credit outperformed mortgage bonds in a volatile interest rate environment. Active yield curve management resulted in mixed performance results as our mild yield curve steepening posture detracted at times as expected policy accommodation wax and waned.
POSITIONING
We maintained an overweight position in corporate credit, by market value, during the period, while tactically increasing spread duration over time. Given the tumult in the mortgage bond market, we moved to an overweight position to capitalize on elevate yields and spreads from a high-quality sector. Toward the end of the period, we reduced our duration overweight which was reflective of recent sticky inflation data and continued full employment. We did maintain a yield curve steepening bias as well as an underweight to the longest key rates given the ongoing sizable deficit projections.
PERFORMANCE
The Fund underperformed its regulatory benchmark for the reported period. The primary detractors were duration positioning and mortgage bonds in a volatile interest rate environment. This was offset, partially, through an overweight in corporate credit and asset-backed bonds during a period of compressing spreads, particularly after a bout of weakness post tariff-announcement.
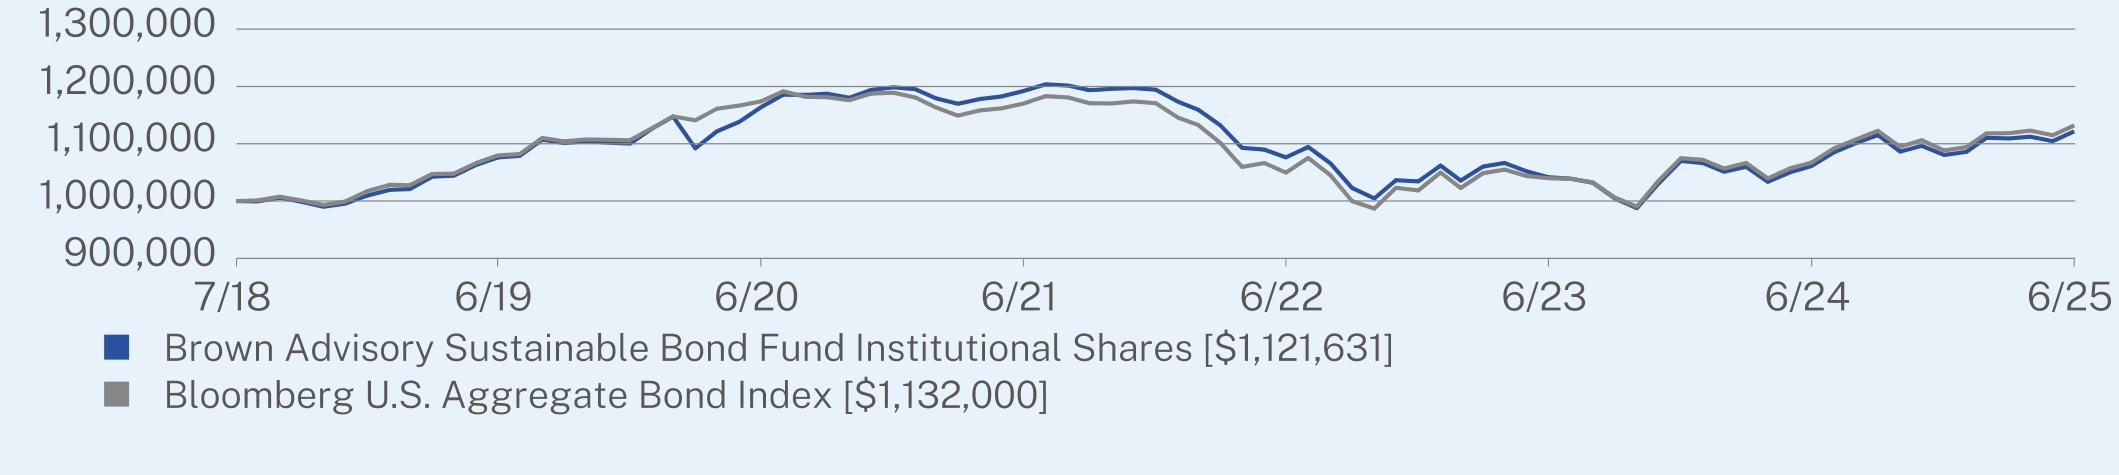
ANNUAL AVERAGE TOTAL RETURN (%)
|
|
1 Year
|
5 Year
|
Since Inception
(07/02/2018) |
|
Institutional Shares
|
5.68
|
-0.73
|
1.65
|
|
Bloomberg U.S. Aggregate Bond Index
|
6.08
|
-0.73
|
1.79
|
Visit https://www.brownadvisory.com/mf/funds/sustainable-bond-fund for recent performance information.
KEY FUND STATISTICS (as of June 30, 2025)
|
Net Assets
|
$575,811,377
|
|
Number of Holdings
|
169
|
|
Net Advisory Fee
|
$1,734,450
|
|
Portfolio Turnover
|
104%
|
|
Security Type
|
(%)
|
|
Corporate Bonds
|
37.3%
|
|
Agency Residential Mortgage-Backed Securities
|
29.4%
|
|
U.S. Treasury Securities
|
21.2%
|
|
Foreign Government Agency Issues
|
5.1%
|
|
Asset-Backed Securities
|
4.8%
|
|
Money Market Funds
|
2.1%
|
|
Non-Agency Commercial Mortgage-Backed Securities
|
1.6%
|
|
Municipal Bonds
|
0.9%
|
|
U.S. Treasury Bills
|
0.1%
|
|
Cash & Other
|
-2.5%
|
|
Top 10 Issuers
|
(%)
|
|
Federal National Mortgage Association
|
13.6%
|
|
United States Treasury Note
|
12.0%
|
|
Ginnie Mae II Pool
|
7.3%
|
|
Federal Home Loan Mortgage Corp.
|
6.8%
|
|
Kreditanstalt fuer Wiederaufbau
|
6.4%
|
|
United States Treasury Bond
|
5.1%
|
|
European Investment Bank
|
5.1%
|
|
United States Treasury STRIP
|
4.0%
|
|
First American Government Obligations Fund
|
2.1%
|
|
BX Trust
|
1.6%
|
WHAT WERE THE FUND COSTS FOR THE PAST YEAR? (based on a hypothetical $10,000 investment)
|
Class Name
|
Costs of a $10,000 investment
|
Costs paid as a percentage of a $10,000 investment
|
|
Investor Shares
|
$47
|
0.46%
|
HOW DID THE FUND PERFORM LAST YEAR AND WHAT AFFECTED ITS PERFORMANCE?
For the 12-month period ended June 30, 2025, the Fund underperformed its regulatory benchmark, the Bloomberg U.S. Aggregate Bond Index.
WHAT FACTORS INFLUENCED PERFORMANCE
Although we experienced periods of risk aversion during the period, there was a decidedly robust bid for risk assets, especially after the tariff announcement. Positive contributors to performance were led by our overweight position in corporate credit and generally positive security selection. Our ongoing overweight in asset-backed bonds was also additive as securitized credit outperformed mortgage bonds in a volatile interest rate environment. Active yield curve management resulted in mixed performance results as our mild yield curve steepening posture detracted at times as expected policy accommodation wax and waned.
POSITIONING
We maintained an overweight position in corporate credit, by market value, during the period, while tactically increasing spread duration over time. Given the tumult in the mortgage bond market, we moved to an overweight position to capitalize on elevate yields and spreads from a high-quality sector. Toward the end of the period, we reduced our duration overweight which was reflective of recent sticky inflation data and continued full employment. We did maintain a yield curve steepening bias as well as an underweight to the longest key rates given the ongoing sizable deficit projections.
PERFORMANCE
The Fund underperformed its regulatory benchmark for the reported period. The primary detractors were duration positioning and mortgage bonds in a volatile interest rate environment. This was offset, partially, through an overweight in corporate credit and asset-backed bonds during a period of compressing spreads, particularly after a bout of weakness post tariff-announcement.
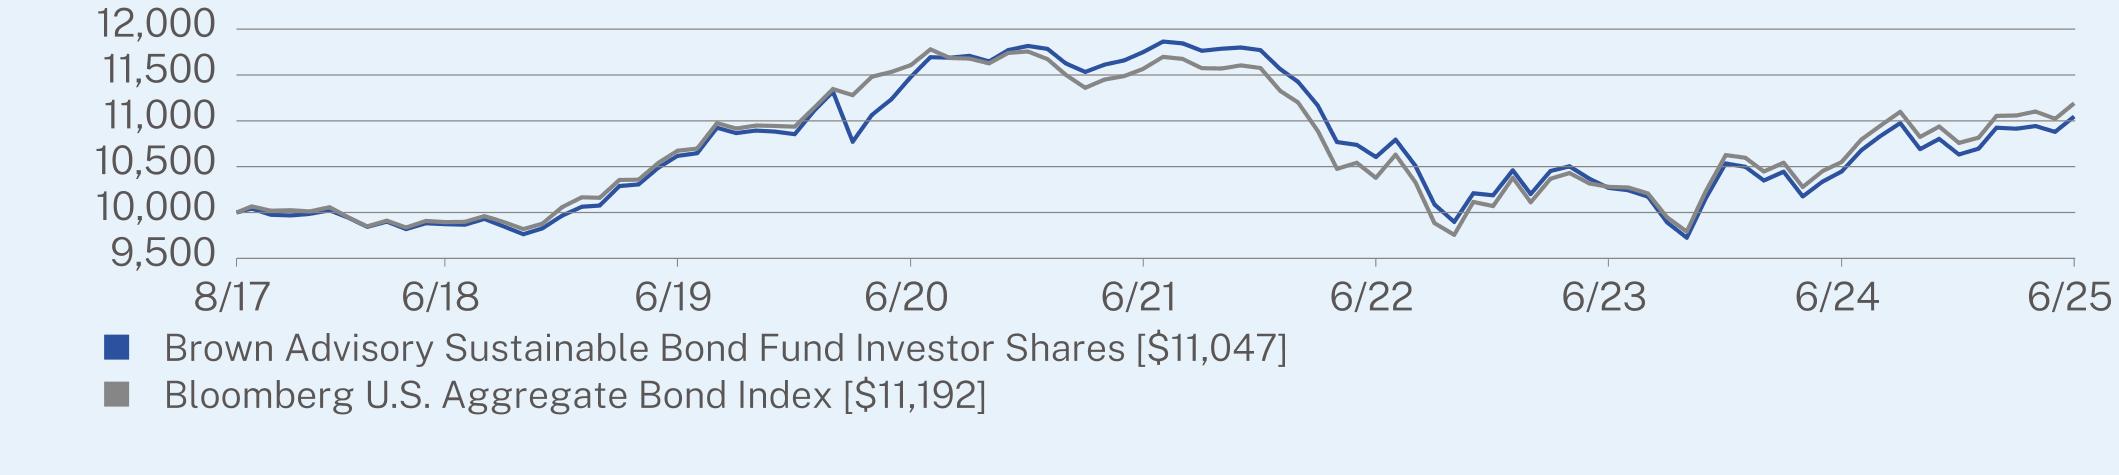
ANNUAL AVERAGE TOTAL RETURN (%)
|
|
1 Year
|
5 Year
|
Since Inception
(08/07/2017) |
|
Investor Shares
|
5.75
|
-0.76
|
1.27
|
|
Bloomberg U.S. Aggregate Bond Index
|
6.08
|
-0.73
|
1.44
|
Visit https://www.brownadvisory.com/mf/funds/sustainable-bond-fund for recent performance information.
KEY FUND STATISTICS (as of June 30, 2025)
|
Net Assets
|
$575,811,377
|
|
Number of Holdings
|
169
|
|
Net Advisory Fee
|
$1,734,450
|
|
Portfolio Turnover
|
104%
|
|
Security Type
|
(%)
|
|
Corporate Bonds
|
37.3%
|
|
Agency Residential Mortgage-Backed Securities
|
29.4%
|
|
U.S. Treasury Securities
|
21.2%
|
|
Foreign Government Agency Issues
|
5.1%
|
|
Asset-Backed Securities
|
4.8%
|
|
Money Market Funds
|
2.1%
|
|
Non-Agency Commercial Mortgage-Backed Securities
|
1.6%
|
|
Municipal Bonds
|
0.9%
|
|
U.S. Treasury Bills
|
0.1%
|
|
Cash & Other
|
-2.5%
|
|
Top 10 Issuers
|
(%)
|
|
Federal National Mortgage Association
|
13.6%
|
|
United States Treasury Note
|
12.0%
|
|
Ginnie Mae II Pool
|
7.3%
|
|
Federal Home Loan Mortgage Corp.
|
6.8%
|
|
Kreditanstalt fuer Wiederaufbau
|
6.4%
|
|
United States Treasury Bond
|
5.1%
|
|
European Investment Bank
|
5.1%
|
|
United States Treasury STRIP
|
4.0%
|
|
First American Government Obligations Fund
|
2.1%
|
|
BX Trust
|
1.6%
|
WHAT WERE THE FUND COSTS FOR THE PAST YEAR? (based on a hypothetical $10,000 investment)
|
Class Name
|
Costs of a $10,000 investment
|
Costs paid as a percentage of a $10,000 investment
|
|
Investor Shares
|
$48
|
0.48%
|
HOW DID THE FUND PERFORM LAST YEAR AND WHAT AFFECTED ITS PERFORMANCE?
For the 12-month period ended June 30, 2025, the Fund outperformed its regulatory benchmark, the Bloomberg Municipal Bond Index.
WHAT FACTORS INFLUENCED PERFORMANCE
Positive contributions to relative performance were led by active yield curve positioning and individual security selection, during a period of elevated interest rate volatility. The municipal yield curve steepened dramatically over the past year as short-term municipal bond yields fell, while longer-maturity municipal bond yields rose. The Fund’s active yield curve positioning benefitted relative and absolute returns during the period as we added exposure to longer-duration bonds as the curve steepened. The Fund also benefitted from an overweight in ultra-short duration floating-rate, and short-callable bonds which helped provide downside protection during a volatile interest rate environment. Bond selection was also additive to performance as many of our active sector and individual credit overweights outperformed the broad market.
POSITIONING
We tactically added to a duration barbell with an overweight to ultra-short duration bonds, and large weightings to longer duration bonds. We maintained an overweight in revenue-backed municipal sectors and added tactically to Local GOs, Transportation, and Housing Revenue, while trimming our positions in Higher Education and Healthcare.
PERFORMANCE
The Fund outperformed its benchmark in a volatile market. Much of our outperformance was driven by downside protection, particularly during the first half of 2025 as longer maturity municipal bond yields rose sharply. This performance was further bolstered by solid credit selection and active duration management for the entire period.
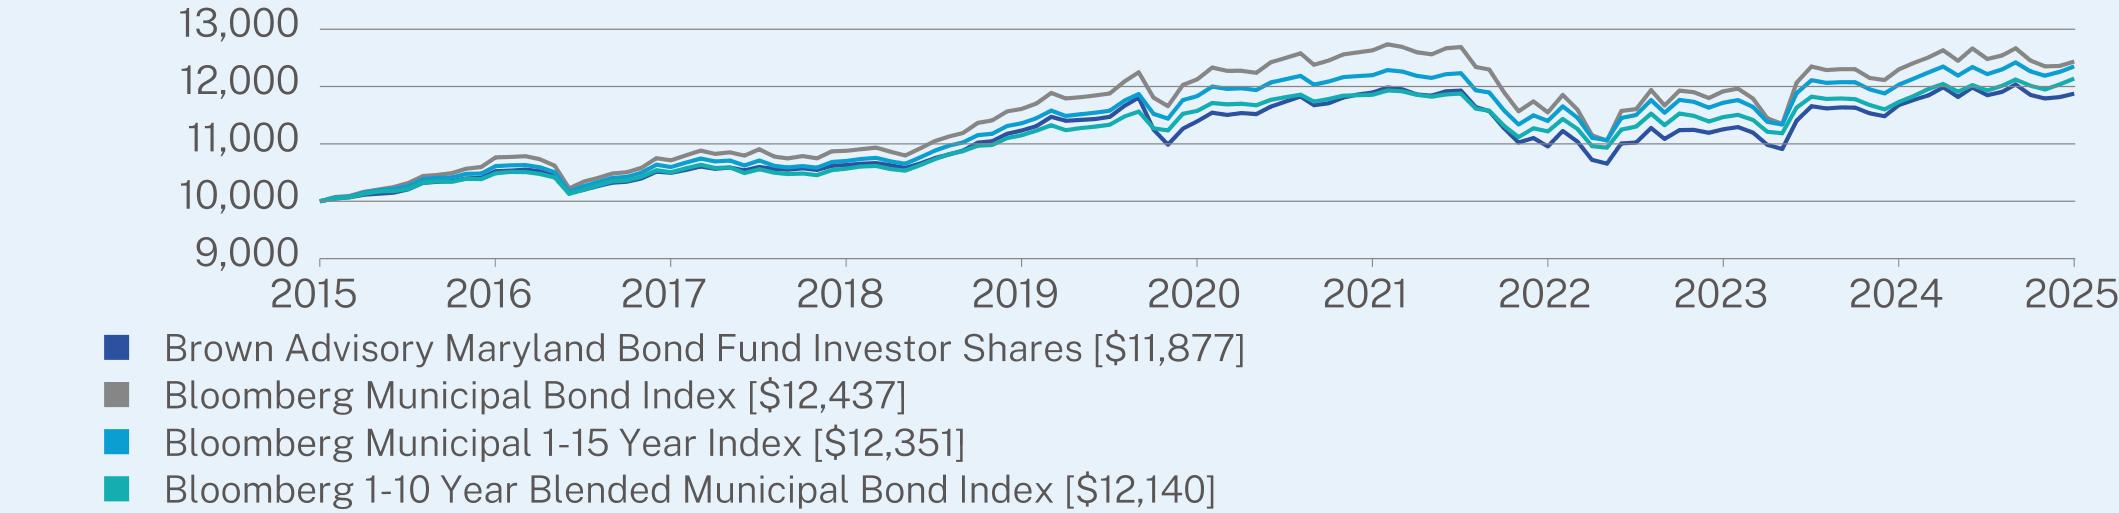
ANNUAL AVERAGE TOTAL RETURN (%)
|
|
1 Year
|
5 Year
|
10 Year
|
|
Investor Shares
|
1.70
|
0.83
|
1.74
|
|
Bloomberg Municipal Bond Index
|
1.11
|
0.51
|
2.20
|
|
Bloomberg Municipal 1-15 Year Index
|
2.63
|
0.86
|
2.13
|
|
Bloomberg 1-10 Year Blended Municipal Bond Index
|
3.47
|
0.96
|
1.96
|
Visit https://www.brownadvisory.com/mf/funds/maryland-bond-fund for recent performance information.
KEY FUND STATISTICS (as of June 30, 2025)
|
Net Assets
|
$164,283,859
|
|
Number of Holdings
|
66
|
|
Net Advisory Fee
|
$505,391
|
|
Portfolio Turnover
|
46%
|
|
Security Type
|
(%)
|
|
Municipal Bonds
|
97.3%
|
|
Money Market Funds
|
1.8%
|
|
Cash & Other
|
0.9%
|
|
Industry
|
(%)
|
|
Revenue Bonds
|
78.0%
|
|
General Obligation Bonds
|
19.3%
|
|
Cash & Other
|
2.7%
|
|
Top 10 Issuers
|
(%)
|
|
Maryland Economic Development Corporation
|
11.5%
|
|
County of Frederick MD
|
10.1%
|
|
State of Maryland Department of Transportation
|
8.0%
|
|
Maryland Stadium Authority
|
6.7%
|
|
MedStar Health
|
5.8%
|
|
University of Maryland Medical System
|
5.2%
|
|
Maryland Community Development Administration
|
4.6%
|
|
State of Maryland
|
4.5%
|
|
Main Street Natural Gas, Inc.
|
3.4%
|
|
Miami-Dade County Expressway Authority
|
3.1%
|
WHAT WERE THE FUND COSTS FOR THE PAST YEAR? (based on a hypothetical $10,000 investment)
|
Class Name
|
Costs of a $10,000 investment
|
Costs paid as a percentage of a $10,000 investment
|
|
Institutional Shares
|
$42
|
0.41%
|
HOW DID THE FUND PERFORM LAST YEAR AND WHAT AFFECTED ITS PERFORMANCE?
For the 12-month period ended June 30, 2025, the Fund outperformed its regulatory benchmark, the Bloomberg Municipal Bond Index.
WHAT FACTORS INFLUENCED PERFORMANCE
Positive contributions to relative performance were led by active yield curve positioning and individual security selection, during a period of elevated interest rate volatility. The municipal yield curve steepened dramatically over the past year as short-term municipal bond yields fell, while longer-maturity municipal bond yields rose. The Fund’s active yield curve positioning benefitted relative and absolute returns during the period as we added exposure to longer-duration bonds as the curve steepened. The Fund also benefitted from an overweight in ultra-short duration floating-rate, and short-callable bonds which helped mitigate risk during a volatile interest rate environment. Bond selection was also additive to performance as many of our active sector and individual credit overweights outperformed the broad market.
POSITIONING
We tactically added to a duration barbell with an overweight to ultra-short duration bonds, and large weightings to longer duration bonds. We maintained an overweight in revenue-backed municipal sectors and added tactically to Prepaid Gas, Airports, and Housing Revenue, while trimming our positions in Higher Education and Healthcare.
PERFORMANCE
The Fund outperformed its benchmark in a volatile market. Much of our outperformance was driven by mitigating risk, particularly during the first half of 2025 as longer maturity municipal bond yields rose sharply. This performance was further bolstered by solid credit selection and active duration management for the entire period.
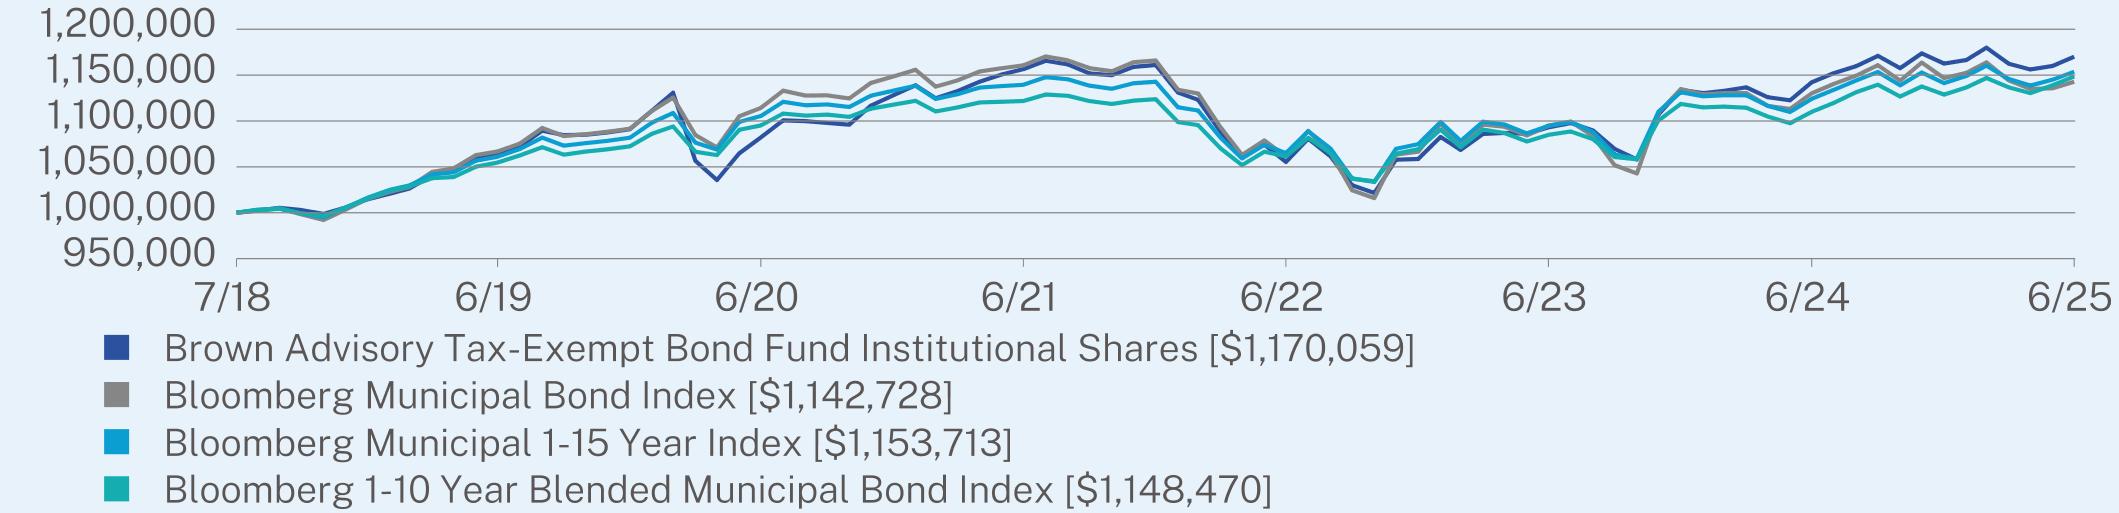
ANNUAL AVERAGE TOTAL RETURN (%)
|
|
1 Year
|
5 Year
|
Since Inception
(07/02/2018) |
|
Institutional Shares
|
2.44
|
1.58
|
2.27
|
|
Bloomberg Municipal Bond Index
|
1.11
|
0.51
|
1.93
|
|
Bloomberg Municipal 1-15 Year Index
|
2.63
|
0.86
|
2.07
|
|
Bloomberg 1-10 Year Blended Municipal Bond Index
|
3.47
|
0.96
|
2.00
|
Visit https://www.brownadvisory.com/mf/funds/tax-exempt-bond-fund for recent performance information.
KEY FUND STATISTICS (as of June 30, 2025)
|
Net Assets
|
$1,019,941,148
|
|
Number of Holdings
|
169
|
|
Net Advisory Fee
|
$3,041,771
|
|
Portfolio Turnover
|
40%
|
|
Top 10 States
|
(%)
|
|
Texas
|
11.5%
|
|
New York
|
9.9%
|
|
Alabama
|
8.5%
|
|
Florida
|
8.2%
|
|
Illinois
|
5.5%
|
|
Georgia
|
5.1%
|
|
Wisconsin
|
5.0%
|
|
California
|
4.2%
|
|
New Jersey
|
3.3%
|
|
Kentucky
|
3.1%
|
|
Top 10 Issuers
|
(%)
|
|
Black Belt Energy Gas District
|
4.7%
|
|
Public Finance Authority
|
3.5%
|
|
Miami-Dade County Florida Expressway Authority
|
3.4%
|
|
Main Street Natural Gas, Inc.
|
3.3%
|
|
Texas Municipal Gas Acquisition and Supply Corp. II
|
3.2%
|
|
Kentucky Public Energy Authority
|
3.1%
|
|
Tobacco Settlement Financing Corp.
|
2.8%
|
|
First American Government Obligations Fund
|
2.7%
|
|
Southeast Energy Authority A Cooperative District
|
2.7%
|
|
New Jersey Transportation Trust Fund Authority
|
2.4%
|
|
Security Type
|
(%)
|
|
Municipal Bonds
|
98.9%
|
|
Money Market Funds
|
2.7%
|
|
Cash & Other
|
-1.6%
|
WHAT WERE THE FUND COSTS FOR THE PAST YEAR? (based on a hypothetical $10,000 investment)
|
Class Name
|
Costs of a $10,000 investment
|
Costs paid as a percentage of a $10,000 investment
|
|
Investor Shares
|
$47
|
0.46%
|
HOW DID THE FUND PERFORM LAST YEAR AND WHAT AFFECTED ITS PERFORMANCE?
For the 12-month period ended June 30, 2025, the Fund outperformed its regulatory benchmark, the Bloomberg Municipal Bond Index.
WHAT FACTORS INFLUENCED PERFORMANCE
Positive contributions to relative performance were led by active yield curve positioning and individual security selection, during a period of elevated interest rate volatility. The municipal yield curve steepened dramatically over the past year as short-term municipal bond yields fell, while longer-maturity municipal bond yields rose. The Fund’s active yield curve positioning benefitted relative and absolute returns during the period as we added exposure to longer-duration bonds as the curve steepened. The Fund also benefitted from an overweight in ultra-short duration floating-rate, and short-callable bonds which helped mitigate risk during a volatile interest rate environment. Bond selection was also additive to performance as many of our active sector and individual credit overweights outperformed the broad market.
POSITIONING
We tactically added to a duration barbell with an overweight to ultra-short duration bonds, and large weightings to longer duration bonds. We maintained an overweight in revenue-backed municipal sectors and added tactically to Prepaid Gas, Airports, and Housing Revenue, while trimming our positions in Higher Education and Healthcare.
PERFORMANCE
The Fund outperformed its benchmark in a volatile market. Much of our outperformance was driven by mitigating risk, particularly during the first half of 2025 as longer maturity municipal bond yields rose sharply. This performance was further bolstered by solid credit selection and active duration management for the entire period.
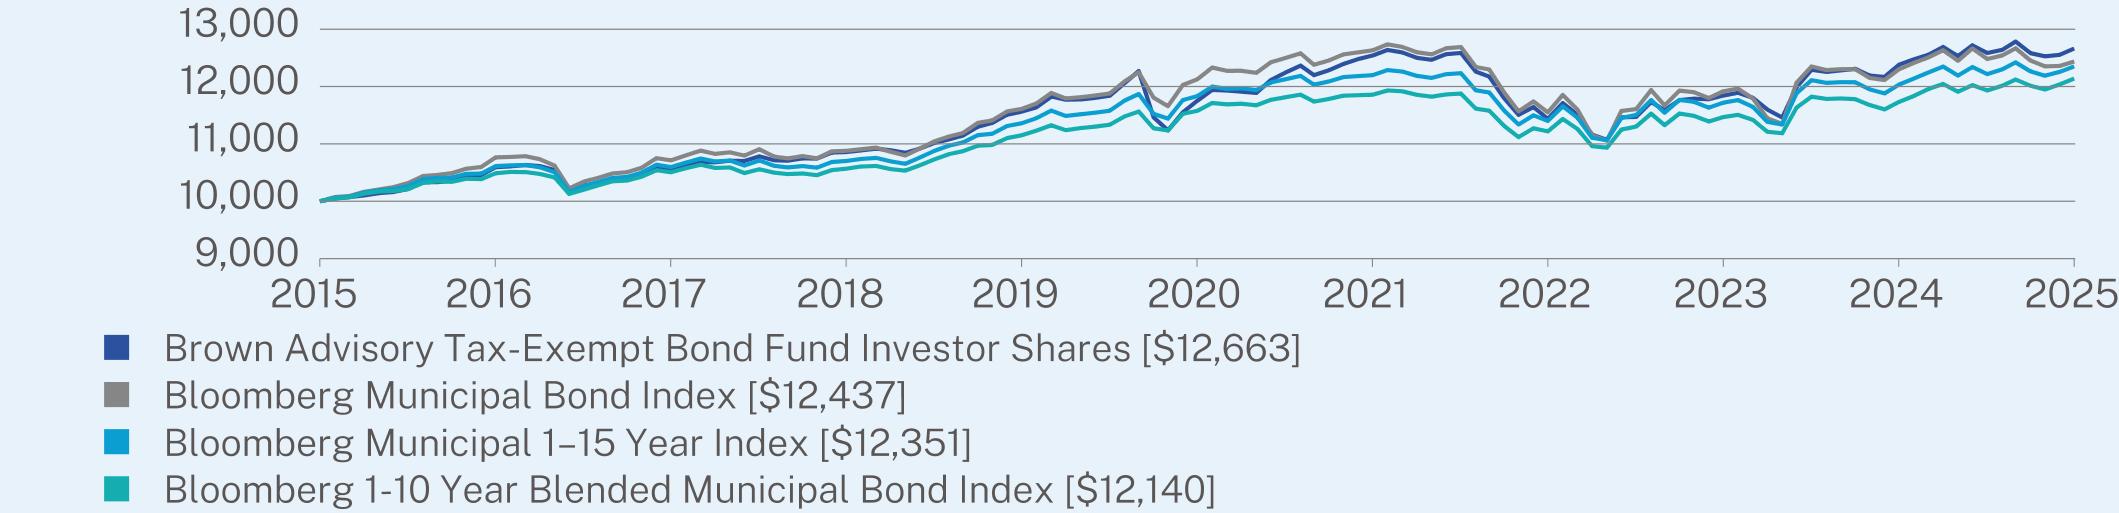
ANNUAL AVERAGE TOTAL RETURN (%)
|
|
1 Year
|
5 Year
|
10 Year
|
|
Investor Shares
|
2.28
|
1.51
|
2.39
|
|
Bloomberg Municipal Bond Index
|
1.11
|
0.51
|
2.20
|
|
Bloomberg Municipal 1–15 Year Index
|
2.63
|
0.86
|
2.13
|
|
Bloomberg 1-10 Year Blended Municipal Bond Index
|
3.47
|
0.96
|
1.96
|
Visit https://www.brownadvisory.com/mf/funds/tax-exempt-bond-fund for recent performance information.
KEY FUND STATISTICS (as of June 30, 2025)
|
Net Assets
|
$1,019,941,148
|
|
Number of Holdings
|
169
|
|
Net Advisory Fee
|
$3,041,771
|
|
Portfolio Turnover
|
40%
|
|
Top 10 States
|
(%)
|
|
Texas
|
11.5%
|
|
New York
|
9.9%
|
|
Alabama
|
8.5%
|
|
Florida
|
8.2%
|
|
Illinois
|
5.5%
|
|
Georgia
|
5.1%
|
|
Wisconsin
|
5.0%
|
|
California
|
4.2%
|
|
New Jersey
|
3.3%
|
|
Kentucky
|
3.1%
|
|
Top 10 Issuers
|
(%)
|
|
Black Belt Energy Gas District
|
4.7%
|
|
Public Finance Authority
|
3.5%
|
|
Miami-Dade County Florida Expressway Authority
|
3.4%
|
|
Main Street Natural Gas, Inc.
|
3.3%
|
|
Texas Municipal Gas Acquisition and Supply Corp. II
|
3.2%
|
|
Kentucky Public Energy Authority
|
3.1%
|
|
Tobacco Settlement Financing Corp.
|
2.8%
|
|
First American Government Obligations Fund
|
2.7%
|
|
Southeast Energy Authority A Cooperative District
|
2.7%
|
|
New Jersey Transportation Trust Fund Authority
|
2.4%
|
|
Security Type
|
(%)
|
|
Municipal Bonds
|
98.9%
|
|
Money Market Funds
|
2.7%
|
|
Cash & Other
|
-1.6%
|
WHAT WERE THE FUND COSTS FOR THE PAST YEAR? (based on a hypothetical $10,000 investment)
|
Class Name
|
Costs of a $10,000 investment
|
Costs paid as a percentage of a $10,000 investment
|
|
Investor Shares
|
$48
|
0.47%
|
HOW DID THE FUND PERFORM LAST YEAR AND WHAT AFFECTED ITS PERFORMANCE?
For the 12-month period ended June 30, 2025, the Fund outperformed its regulatory benchmark, the Bloomberg Municipal Bond Index.
WHAT FACTORS INFLUENCED PERFORMANCE
Positive contributions to relative performance were led by active yield curve positioning and individual security selection, during a period of elevated interest rate volatility. The municipal yield curve steepened dramatically over the past year as short-term municipal bond yields fell, while longer-maturity municipal bond yields rose. The Fund’s active yield curve positioning benefitted relative and absolute returns during the period as we added exposure to longer-duration bonds as the curve steepened. The Fund also benefitted from an overweight in ultra-short duration floating-rate, and short-callable bonds which helped provide risk mitigation during a volatile interest rate environment. Bond selection was also additive to performance as many of our active sector and individual credit overweights outperformed the broad market.
POSITIONING
We tactically added to a duration barbell with an overweight to ultra-short duration bonds, and large weightings to longer duration bonds. We maintained an overweight in revenue-backed municipal sectors and added tactically to Prepaid Power, Airports, and Affordable Housing, while trimming our positions in Higher Education and Healthcare.
PERFORMANCE
The Fund outperformed its benchmark in a volatile market. Much of our outperformance was driven by mitigating risk, particularly during the first half of 2025 as longer maturity municipal bond yields rose sharply. This performance was further bolstered by solid credit selection and active duration management for the entire period.
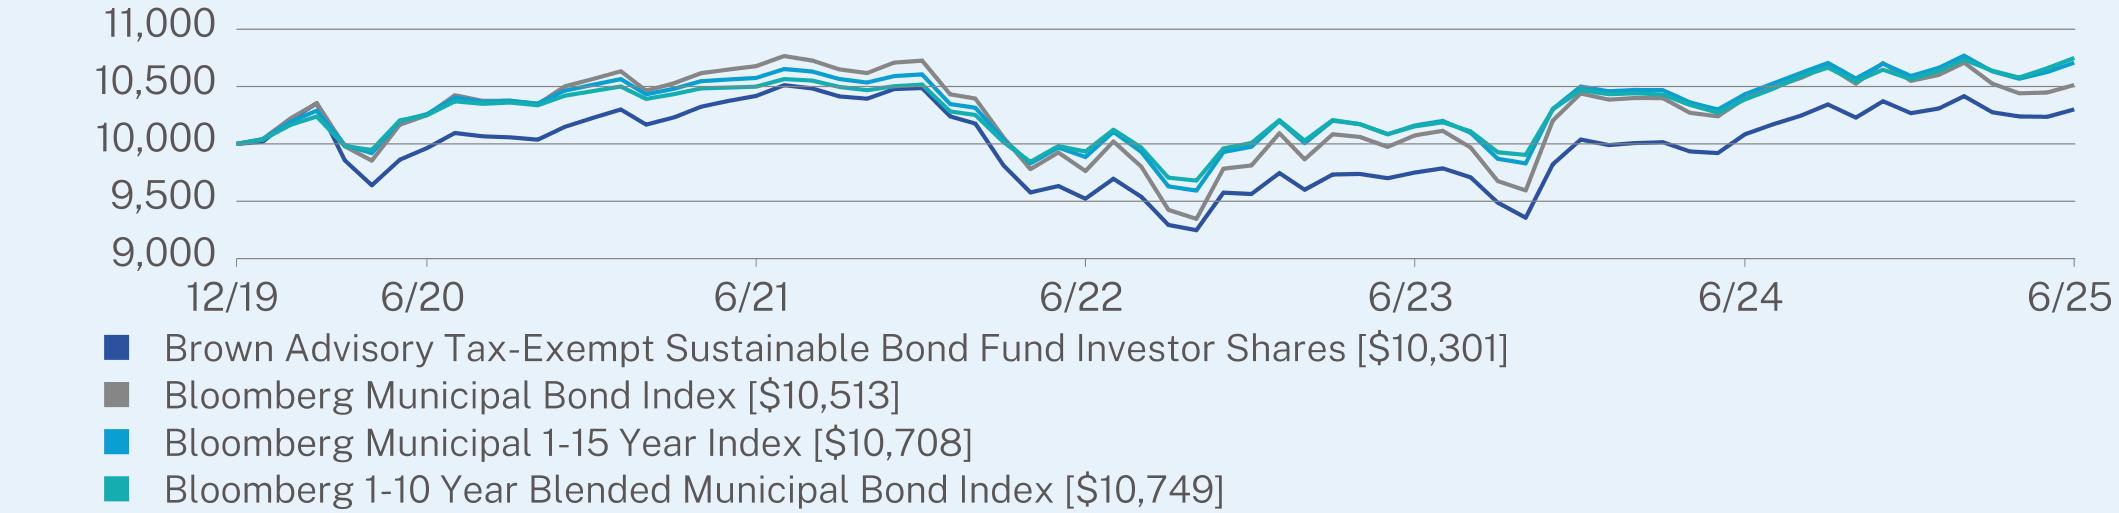
ANNUAL AVERAGE TOTAL RETURN (%)
|
|
1 Year
|
5 Year
|
Since Inception
(12/02/2019) |
|
Investor Shares
|
2.15
|
0.67
|
0.53
|
|
Bloomberg Municipal Bond Index
|
1.11
|
0.51
|
0.90
|
|
Bloomberg Municipal 1-15 Year Index
|
2.63
|
0.86
|
1.23
|
|
Bloomberg 1-10 Year Blended Municipal Bond Index
|
3.47
|
0.96
|
1.30
|
Visit https://www.brownadvisory.com/mf/funds/tax-exempt-sustainable-bond-fund for recent performance information.
KEY FUND STATISTICS (as of June 30, 2025)
|
Net Assets
|
$291,746,440
|
|
Number of Holdings
|
104
|
|
Net Advisory Fee
|
$873,602
|
|
Portfolio Turnover
|
37%
|
|
Top 10 States
|
(%)
|
|
California
|
17.0%
|
|
New York
|
10.5%
|
|
Texas
|
8.3%
|
|
Illinois
|
6.1%
|
|
Maryland
|
5.8%
|
|
Wisconsin
|
5.7%
|
|
Colorado
|
4.1%
|
|
Florida
|
3.4%
|
|
Indiana
|
3.3%
|
|
Utah
|
3.3%
|
|
Top 10 Issuers
|
(%)
|
|
California Community Choice Financing Authority
|
8.7%
|
|
California Earthquake Authority
|
5.6%
|
|
Maryland Health & Higher Educational Facilities Authority
|
4.0%
|
|
New York Transportation Development Corp.
|
3.4%
|
|
Utah Housing Corp.
|
3.3%
|
|
First American Government Obligations Fund
|
2.7%
|
|
New York Liberty Development Corp.
|
2.7%
|
|
Northside Independent School District
|
2.6%
|
|
New Jersey Economic Development Authority
|
2.4%
|
|
York County South Carolina Fort Mill School District No. 4
|
2.3%
|
|
Security Type
|
(%)
|
|
Municipal Bonds
|
97.2%
|
|
Money Market Funds
|
2.7%
|
|
Cash & Other
|
0.1%
|
WHAT WERE THE FUND COSTS FOR THE PAST YEAR? (based on a hypothetical $10,000 investment)
|
Class Name
|
Costs of a $10,000 investment
|
Costs paid as a percentage of a $10,000 investment
|
|
Institutional Shares
|
$46
|
0.45%
|
HOW DID THE FUND PERFORM LAST YEAR AND WHAT AFFECTED ITS PERFORMANCE?
For the 12-month period ended June 30, 2025, the Fund outperformed its regulatory benchmark, the Bloomberg U.S. Aggregate Bond Index.
WHAT FACTORS INFLUENCED PERFORMANCE
Despite periods of volatility, spreads on risk assets generally ended the period in a stronger position as demand for risk remained robust. Similarly, interest rate volatility managed to decline over the period and elevated interest rates constrained prepayment activity, enabling the mortgage sector to produce tighter spreads and positive excess returns relative to Treasuries and risk-free assets. Our significant allocations to agency-backed mortgage securities, in addition to asset-backed and commercial mortgage-backed credit, were key contributors to the Fund’s outperformance relative to the benchmark. Additionally, our active duration and yield curve management benefitted performance. On the other hand, our underweight to shorter term mortgages detracted from performance as these securities outperformed during the period.
POSITIONING
We continued to add to mortgage basis over the past year as we believe that agency-backed mortgages continue to offer compelling carry and relative value. We also maintain an overweight to asset-backed and commercial mortgage-backed securitized credit. We maintain a slight overall duration overweight, but remain underweight the longest points on the yield curve as inflation and longer-term deficit risks remain present.
|
Top Contributors
|
|
|
↑
|
US Duration Position, US IG Credit
|
|
Top Detractors
|
|
|
↓
|
Non-US Sovereign Debt, Agency Mortgages, Structured Products
|
PERFORMANCE
The Fund delivered positive returns and outperformed its regulatory benchmark over the reported period. Exposure to spread sectors and selection within these sectors supported performance as risk assets broadly ended the year in a better position.
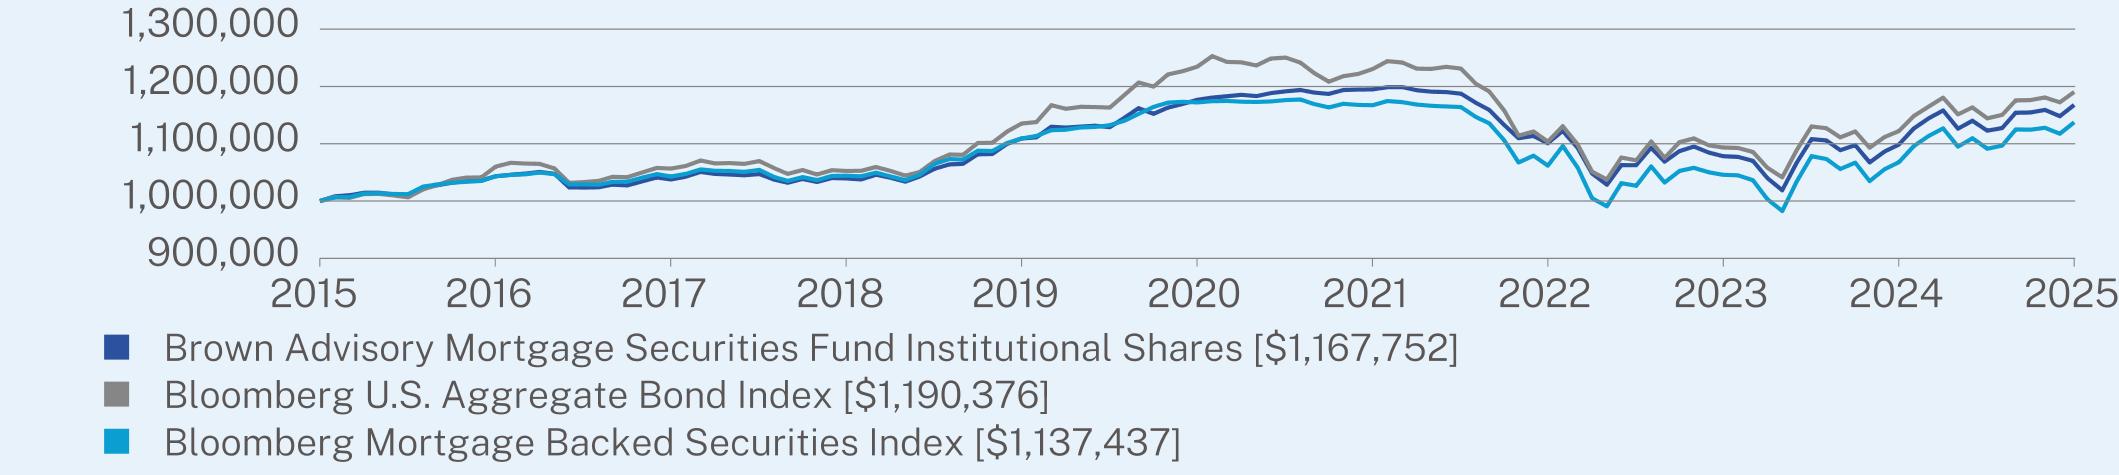
ANNUAL AVERAGE TOTAL RETURN (%)
|
|
1 Year
|
5 Year
|
10 Year
|
|
Institutional Shares
|
6.29
|
-0.15
|
1.56
|
|
Bloomberg U.S. Aggregate Bond Index
|
6.08
|
-0.73
|
1.76
|
|
Bloomberg Mortgage Backed Securities Index
|
6.52
|
-0.60
|
1.30
|
Visit https://www.brownadvisory.com/mf/funds/mortgage-securities-fund for recent performance information.
KEY FUND STATISTICS (as of June 30, 2025)
|
Net Assets
|
$289,676,716
|
|
Number of Holdings
|
340
|
|
Net Advisory Fee
|
$870,085
|
|
Portfolio Turnover
|
221%
|
|
Security Type
|
(%)
|
|
Agency Residential Mortgage-Backed Securities
|
98.2%
|
|
Money Market Funds
|
4.6%
|
|
Asset-Backed Securities
|
4.6%
|
|
Agency Commercial Mortgage-Backed Securities
|
3.6%
|
|
Non-Agency Commercial Mortgage-Backed Securities
|
1.0%
|
|
Municipal Bonds
|
0.1%
|
|
Futures Contracts
|
-0.2%
|
|
Cash & Other
|
-11.9%
|
|
Top 10 Issuers
|
(%)
|
|
Federal National Mortgage Association
|
56.4%
|
|
Federal Home Loan Mortgage Corp.
|
27.2%
|
|
Ginnie Mae II Pool
|
13.7%
|
|
First American Government Obligations Fund
|
4.6%
|
|
Government National Mortgage Association
|
3.3%
|
|
Verizon Master Trust
|
1.0%
|
|
BX Trust
|
1.0%
|
|
Toyota Auto Receivables Owner Trust
|
0.7%
|
|
Ford Credit Auto Owner Trust
|
0.7%
|
|
Fannie Mae Grantor Trust
|
0.7%
|
WHAT WERE THE FUND COSTS FOR THE PAST YEAR? (based on a hypothetical $10,000 investment)
|
Class Name
|
Costs of a $10,000 investment
|
Costs paid as a percentage of a $10,000 investment
|
|
Investor Shares
|
$52
|
0.50%
|
HOW DID THE FUND PERFORM LAST YEAR AND WHAT AFFECTED ITS PERFORMANCE?
For the 12-month period ended June 30, 2025, the Fund outperformed its regulatory benchmark, the Bloomberg U.S. Aggregate Bond Index.
WHAT FACTORS INFLUENCED PERFORMANCE
Despite periods of volatility, spreads on risk assets generally ended the period in a stronger position as demand for risk remained robust. Similarly, interest rate volatility managed to decline over the period and elevated interest rates constrained prepayment activity, enabling the mortgage sector to produce tighter spreads and positive excess returns relative to Treasuries and risk-free assets. Our significant allocations to agency-backed mortgage securities, in addition to asset-backed and commercial mortgage-backed credit, were key contributors to the Fund’s outperformance relative to the benchmark. Additionally, our active duration and yield curve management benefitted performance. On the other hand, our underweight to shorter term mortgages detracted from performance as these securities outperformed during the period.
POSITIONING
We continued to add to mortgage basis over the past year as we believe that agency-backed mortgages continue to offer compelling carry and relative value. We also maintain an overweight to asset-backed and commercial mortgage-backed securitized credit. We maintain a slight overall duration overweight, but remain underweight the longest points on the yield curve as inflation and longer-term deficit risks remain present.
PERFORMANCE
The Fund delivered positive returns and outperformed its regulatory benchmark over the reported period. Exposure to spread sectors and selection within these sectors supported performance as risk assets broadly ended the year in a better position.
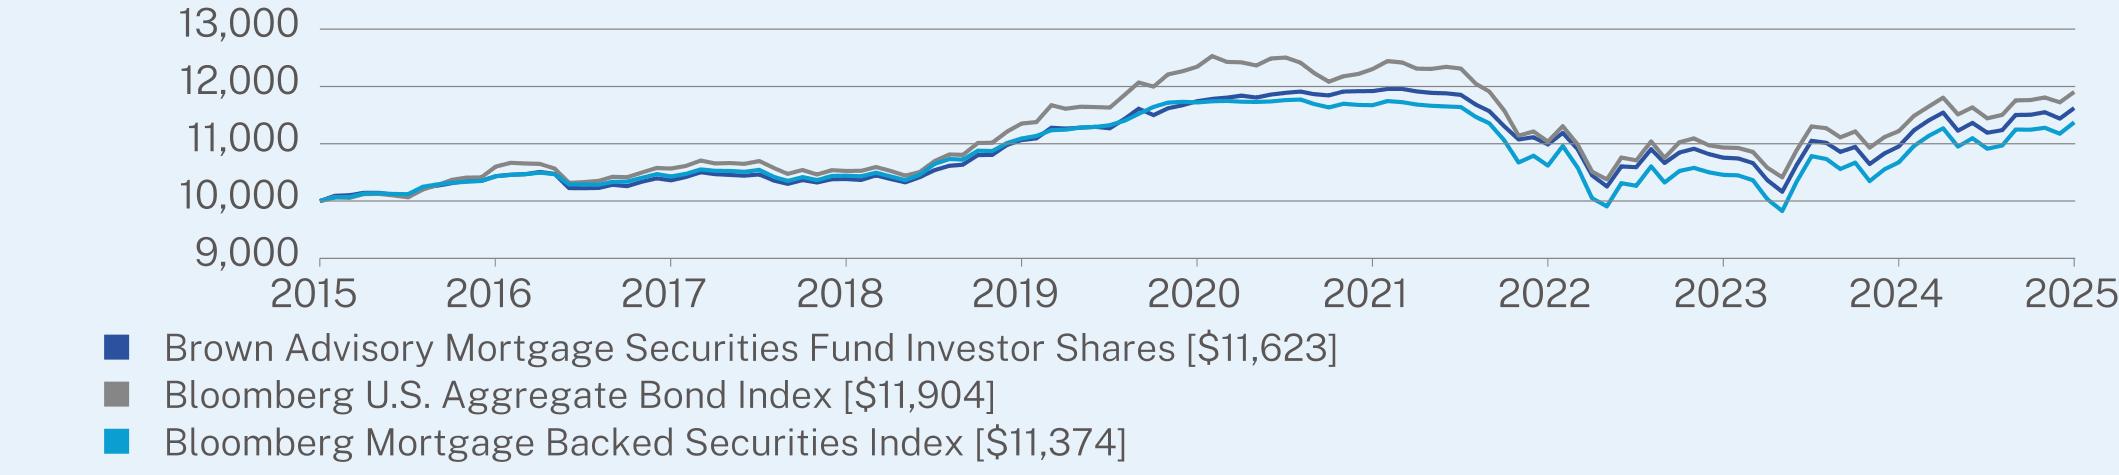
ANNUAL AVERAGE TOTAL RETURN (%)
|
|
1 Year
|
5 Year
|
10 Year
|
|
Investor Shares
|
6.10
|
-0.21
|
1.52
|
|
Bloomberg U.S. Aggregate Bond Index
|
6.08
|
-0.73
|
1.76
|
|
Bloomberg Mortgage Backed Securities Index
|
6.52
|
-0.60
|
1.30
|
Visit https://www.brownadvisory.com/mf/funds/mortgage-securities-fund for recent performance information.
KEY FUND STATISTICS (as of June 30, 2025)
|
Net Assets
|
$289,676,716
|
|
Number of Holdings
|
340
|
|
Net Advisory Fee
|
$870,085
|
|
Portfolio Turnover
|
221%
|
|
Security Type
|
(%)
|
|
Agency Residential Mortgage-Backed Securities
|
98.2%
|
|
Money Market Funds
|
4.6%
|
|
Asset-Backed Securities
|
4.6%
|
|
Agency Commercial Mortgage-Backed Securities
|
3.6%
|
|
Non-Agency Commercial Mortgage-Backed Securities
|
1.0%
|
|
Municipal Bonds
|
0.1%
|
|
Futures Contracts
|
-0.2%
|
|
Cash & Other
|
-11.9%
|
|
Top 10 Issuers
|
(%)
|
|
Federal National Mortgage Association
|
56.4%
|
|
Federal Home Loan Mortgage Corp.
|
27.2%
|
|
Ginnie Mae II Pool
|
13.7%
|
|
First American Government Obligations Fund
|
4.6%
|
|
Government National Mortgage Association
|
3.3%
|
|
Verizon Master Trust
|
1.0%
|
|
BX Trust
|
1.0%
|
|
Toyota Auto Receivables Owner Trust
|
0.7%
|
|
Ford Credit Auto Owner Trust
|
0.7%
|
|
Fannie Mae Grantor Trust
|
0.7%
|
WHAT WERE THE FUND COSTS FOR THE PAST YEAR? (based on a hypothetical $10,000 investment)
|
Class Name
|
Costs of a $10,000 investment
|
Costs paid as a percentage of a $10,000 investment
|
|
Institutional Shares
|
$125
|
1.04%
|
HOW DID THE FUND PERFORM LAST YEAR AND WHAT AFFECTED ITS PERFORMANCE?
For the 12-month period ended June 30, 2025, the Fund outperformed its benchmark, the MSCI Europe Index.
WHAT FACTORS INFLUENCED PERFORMANCE
Strong security selection was the key driver of relative outperformance. Particularly, the positive stock selection results in Industrials, Health Care, and Consumer Staples contributed to relative returns. Weaker stock selection in Communication Services detracted from performance. Sector allocation, a result of our bottom-up stock selection process, also added to relative returns. Positive allocation effects driven by our overweight in Industrials and underweight in Health Care was partially offset by our underweight position in Financials and lack of exposure to Utilities detracted from performance. At the issuer level, our top two relative contributors were our overweight position in Rheinmetall and not holding Novo Nordisk, while our top two relative detractors were our overweight position in Bunzl and out-of-benchmark allocation to Vistry Group.
POSITIONING
We remain overweight industrials and consumer staples, with large underweights to information technology and consumer discretionary. We continue to hold a zero weight in Utilities. We will continue to use volatility to opportunistically adjust our positioning. We think the portfolio is well positioned, despite potential for near term volatility.
|
Top Contributors
|
|
|
↑
|
Rheinmetall AG
|
|
↑
|
British American Tobacco p.l.c.
|
|
↑
|
Erste Group Bank AG
|
|
↑
|
Technip Energies NV
|
|
↑
|
AIB Group plc
|
|
Top Detractors
|
|
|
↓
|
Vistry Group PLC
|
|
↓
|
Heineken NV
|
|
↓
|
Glencore plc
|
|
↓
|
Bunzl plc
|
|
↓
|
RS Group PLC
|
PERFORMANCE
The Fund posted positive active returns driven by positive bottom-up stock selection and positive allocation effects.
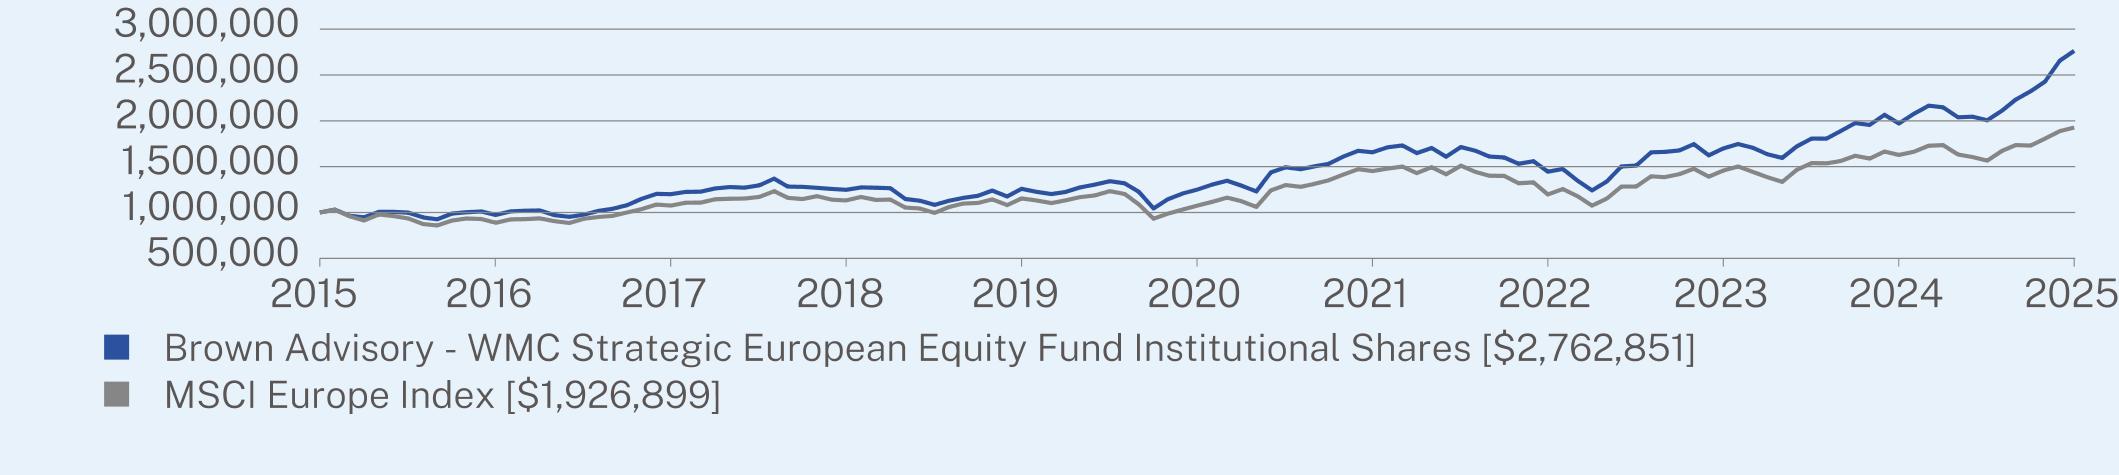
ANNUAL AVERAGE TOTAL RETURN (%)
|
|
1 Year
|
5 Year
|
10 Year
|
|
Institutional Shares
|
40.15
|
17.19
|
10.70
|
|
MSCI Europe Index
|
18.38
|
12.38
|
6.78
|
Visit https://www.brownadvisory.com/mf/funds/wmc-strategic-european-equity-fund for recent performance information.
KEY FUND STATISTICS (as of June 30, 2025)
|
Net Assets
|
$684,062,760
|
|
Number of Holdings
|
66
|
|
Net Advisory Fee
|
$3,714,220
|
|
Portfolio Turnover
|
47%
|
|
Top Sectors*
|
(%)
|
|
Industrials
|
29.6%
|
|
Financials
|
20.3%
|
|
Consumer Staples
|
13.3%
|
|
Health Care
|
10.7%
|
|
Materials
|
6.5%
|
|
Communication Services
|
4.5%
|
|
Consumer Discretionary
|
4.2%
|
|
Information Technology
|
3.1%
|
|
Energy
|
2.8%
|
|
Cash & Other
|
5.0%
|
|
Top 10 Issuers
|
(%)
|
|
British American Tobacco PLC
|
4.7%
|
|
First American Government Obligations Fund
|
4.0%
|
|
AIB Group PLC
|
3.4%
|
|
Smiths Group PLC
|
3.3%
|
|
Unilever PLC
|
3.0%
|
|
Haleon PLC
|
3.0%
|
|
Bunzl PLC
|
2.8%
|
|
Technip Energies NV
|
2.7%
|
|
Erste Group Bank AG
|
2.7%
|
|
Publicis Groupe SA
|
2.7%
|
|
Top 10 Countries
|
(%)
|
|
United Kingdom
|
27.0%
|
|
France
|
13.3%
|
|
Germany
|
13.1%
|
|
Ireland
|
6.5%
|
|
Switzerland
|
6.4%
|
|
United States
|
5.0%
|
|
Belgium
|
4.9%
|
|
Denmark
|
4.3%
|
|
Spain
|
3.9%
|
|
Austria
|
3.6%
|
WHAT WERE THE FUND COSTS FOR THE PAST YEAR? (based on a hypothetical $10,000 investment)
|
Class Name
|
Costs of a $10,000 investment
|
Costs paid as a percentage of a $10,000 investment
|
|
Investor Shares
|
$143
|
1.19%
|
HOW DID THE FUND PERFORM LAST YEAR AND WHAT AFFECTED ITS PERFORMANCE?
For the 12-month period ended June 30, 2025, the Fund outperformed its benchmark, the MSCI Europe Index.
WHAT FACTORS INFLUENCED PERFORMANCE
Strong security selection was the key driver of relative outperformance. Particularly, the positive stock selection results in Industrials, Health Care, and Consumer Staples contributed to relative returns. Weaker stock selection in Communication Services detracted from performance. Sector allocation, a result of our bottom-up stock selection process, also added to relative returns. Positive allocation effects driven by our overweight in Industrials and underweight in Health Care was partially offset by our underweight position in Financials and lack of exposure to Utilities detracted from performance. At the issuer level, our top two relative contributors were our overweight position in Rheinmetall and not holding Novo Nordisk, while our top two relative detractors were our overweight position in Bunzl and out-of-benchmark allocation to Vistry Group.
POSITIONING
We remain overweight industrials and consumer staples, with large underweights to information technology and consumer discretionary. We continue to hold a zero weight in Utilities. We will continue to use volatility to opportunistically adjust our positioning. We think the portfolio is well positioned, despite potential for near term volatility.
|
Top Contributors
|
|
|
↑
|
Rheinmetall AG
|
|
↑
|
British American Tobacco p.l.c.
|
|
↑
|
Erste Group Bank AG
|
|
↑
|
Technip Energies NV
|
|
↑
|
AIB Group plc
|
|
Top Detractors
|
|
|
↓
|
Vistry Group PLC
|
|
↓
|
Heineken NV
|
|
↓
|
Glencore plc
|
|
↓
|
Bunzl plc
|
|
↓
|
RS Group PLC
|
PERFORMANCE
The Fund posted positive active returns driven by positive bottom-up stock selection and positive allocation effects.
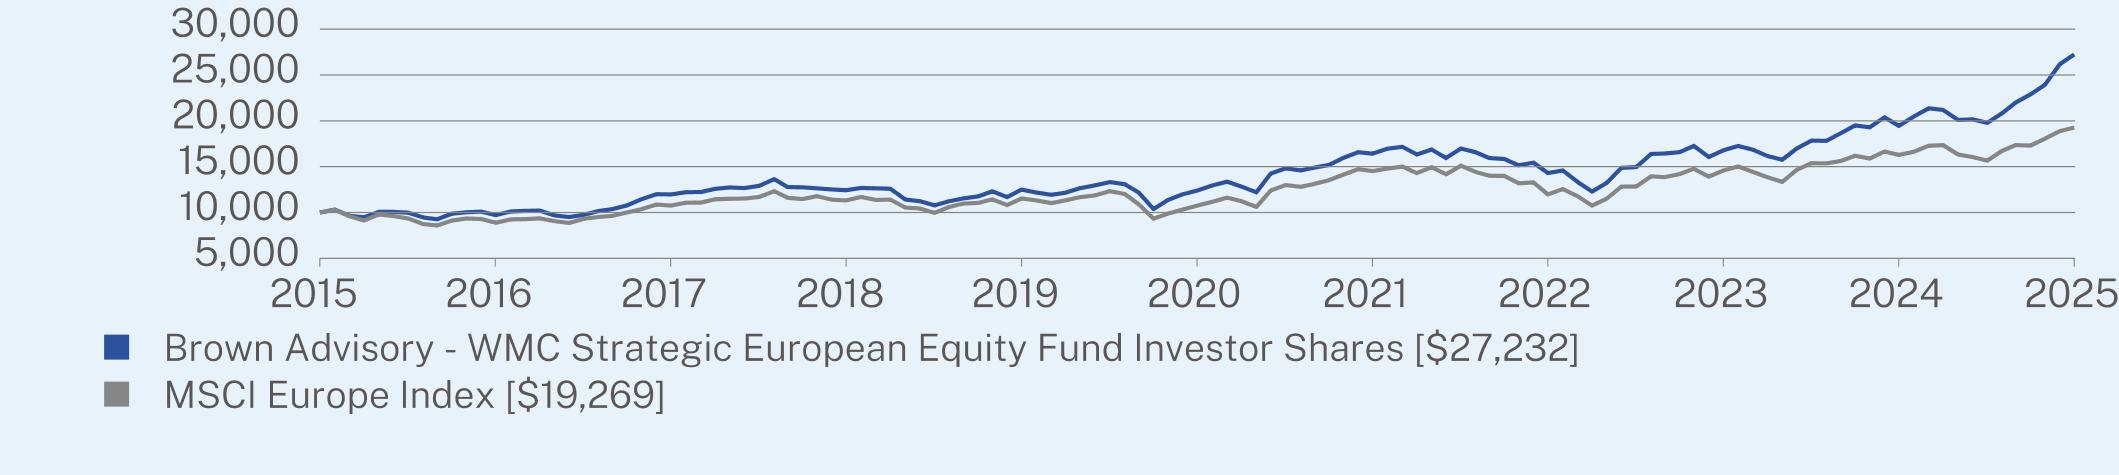
ANNUAL AVERAGE TOTAL RETURN (%)
|
|
1 Year
|
5 Year
|
10 Year
|
|
Investor Shares
|
40.04
|
17.03
|
10.54
|
|
MSCI Europe Index
|
18.38
|
12.38
|
6.78
|
Visit https://www.brownadvisory.com/mf/funds/wmc-strategic-european-equity-fund for recent performance information.
KEY FUND STATISTICS (as of June 30, 2025)
|
Net Assets
|
$684,062,760
|
|
Number of Holdings
|
66
|
|
Net Advisory Fee
|
$3,714,220
|
|
Portfolio Turnover
|
47%
|
|
Top Sectors*
|
(%)
|
|
Industrials
|
29.6%
|
|
Financials
|
20.3%
|
|
Consumer Staples
|
13.3%
|
|
Health Care
|
10.7%
|
|
Materials
|
6.5%
|
|
Communication Services
|
4.5%
|
|
Consumer Discretionary
|
4.2%
|
|
Information Technology
|
3.1%
|
|
Energy
|
2.8%
|
|
Cash & Other
|
5.0%
|
|
Top 10 Issuers
|
(%)
|
|
British American Tobacco PLC
|
4.7%
|
|
First American Government Obligations Fund
|
4.0%
|
|
AIB Group PLC
|
3.4%
|
|
Smiths Group PLC
|
3.3%
|
|
Unilever PLC
|
3.0%
|
|
Haleon PLC
|
3.0%
|
|
Bunzl PLC
|
2.8%
|
|
Technip Energies NV
|
2.7%
|
|
Erste Group Bank AG
|
2.7%
|
|
Publicis Groupe SA
|
2.7%
|
|
Top 10 Countries
|
(%)
|
|
United Kingdom
|
27.0%
|
|
France
|
13.3%
|
|
Germany
|
13.1%
|
|
Ireland
|
6.5%
|
|
Switzerland
|
6.4%
|
|
United States
|
5.0%
|
|
Belgium
|
4.9%
|
|
Denmark
|
4.3%
|
|
Spain
|
3.9%
|
|
Austria
|
3.6%
|
WHAT WERE THE FUND COSTS FOR THE PAST YEAR? (based on a hypothetical $10,000 investment)
|
Class Name
|
Costs of a $10,000 investment
|
Costs paid as a percentage of a $10,000 investment
|
|
Advisor Shares
|
$173
|
1.44%
|
HOW DID THE FUND PERFORM LAST YEAR AND WHAT AFFECTED ITS PERFORMANCE?
For the 12-month period ended June 30, 2025, the Fund outperformed its benchmark, the MSCI Europe Index.
WHAT FACTORS INFLUENCED PERFORMANCE
Strong security selection was the key driver of relative outperformance. Particularly, the positive stock selection results in Industrials, Health Care, and Consumer Staples contributed to relative returns. Weaker stock selection in Communication Services detracted from performance. Sector allocation, a result of our bottom-up stock selection process, also added to relative returns. Positive allocation effects driven by our overweight in Industrials and underweight in Health Care was partially offset by our underweight position in Financials and lack of exposure to Utilities detracted from performance. At the issuer level, our top two relative contributors were our overweight position in Rheinmetall and not holding Novo Nordisk, while our top two relative detractors were our overweight position in Bunzl and out-of-benchmark allocation to Vistry Group.
POSITIONING
We remain overweight industrials and consumer staples, with large underweights to information technology and consumer discretionary. We continue to hold a zero weight in Utilities. We will continue to use volatility to opportunistically adjust our positioning. We think the portfolio is well positioned, despite potential for near term volatility.
|
Top Contributors
|
|
|
↑
|
Rheinmetall AG
|
|
↑
|
British American Tobacco p.l.c.
|
|
↑
|
Erste Group Bank AG
|
|
↑
|
Technip Energies NV
|
|
↑
|
AIB Group plc
|
|
Top Detractors
|
|
|
↓
|
Vistry Group PLC
|
|
↓
|
Heineken NV
|
|
↓
|
Glencore plc
|
|
↓
|
Bunzl plc
|
|
↓
|
RS Group PLC
|
PERFORMANCE
The Fund posted positive active returns driven by positive bottom-up stock selection and positive allocation effects.
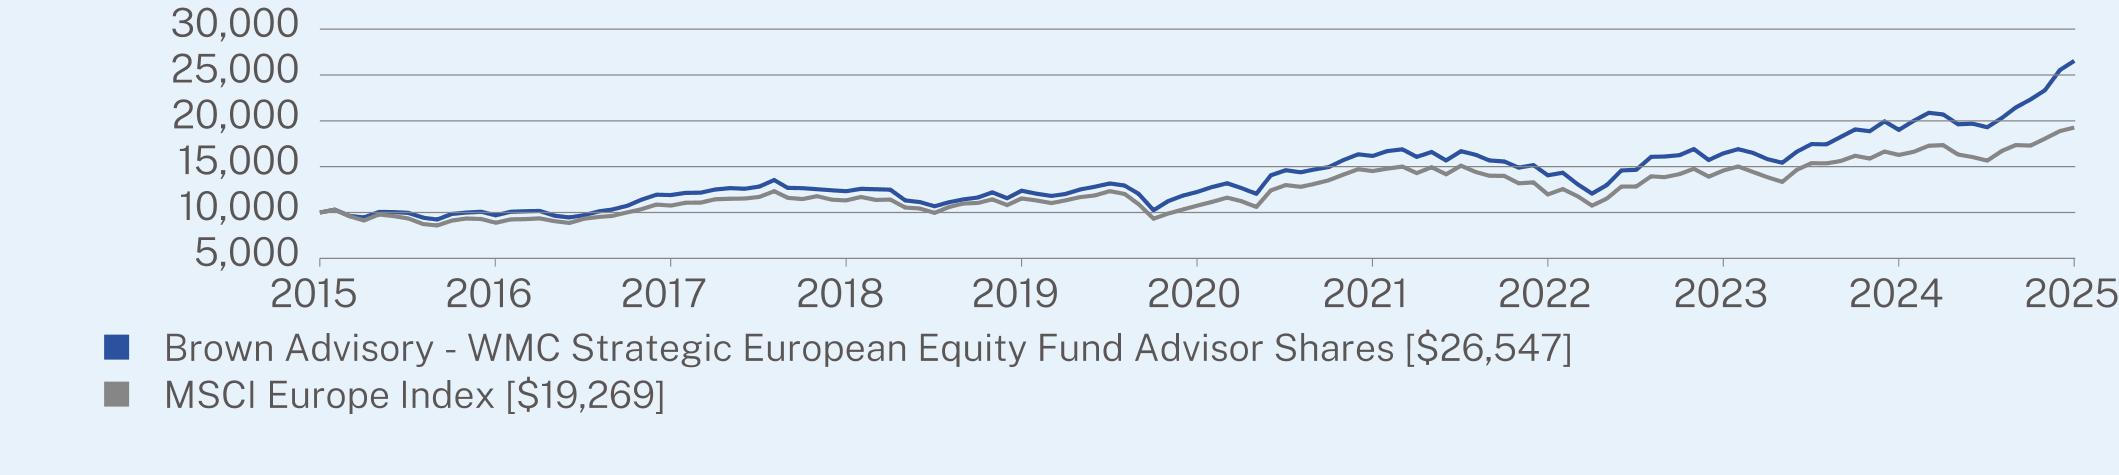
ANNUAL AVERAGE TOTAL RETURN (%)
|
|
1 Year
|
5 Year
|
10 Year
|
|
Advisor Shares
|
39.65
|
16.73
|
10.26
|
|
MSCI Europe Index
|
18.38
|
12.38
|
6.78
|
Visit https://www.brownadvisory.com/mf/funds/wmc-strategic-european-equity-fund for recent performance information.
KEY FUND STATISTICS (as of June 30, 2025)
|
Net Assets
|
$684,062,760
|
|
Number of Holdings
|
66
|
|
Net Advisory Fee
|
$3,714,220
|
|
Portfolio Turnover
|
47%
|
|
Top Sectors*
|
(%)
|
|
Industrials
|
29.6%
|
|
Financials
|
20.3%
|
|
Consumer Staples
|
13.3%
|
|
Health Care
|
10.7%
|
|
Materials
|
6.5%
|
|
Communication Services
|
4.5%
|
|
Consumer Discretionary
|
4.2%
|
|
Information Technology
|
3.1%
|
|
Energy
|
2.8%
|
|
Cash & Other
|
5.0%
|
|
Top 10 Issuers
|
(%)
|
|
British American Tobacco PLC
|
4.7%
|
|
First American Government Obligations Fund
|
4.0%
|
|
AIB Group PLC
|
3.4%
|
|
Smiths Group PLC
|
3.3%
|
|
Unilever PLC
|
3.0%
|
|
Haleon PLC
|
3.0%
|
|
Bunzl PLC
|
2.8%
|
|
Technip Energies NV
|
2.7%
|
|
Erste Group Bank AG
|
2.7%
|
|
Publicis Groupe SA
|
2.7%
|
|
Top 10 Countries
|
(%)
|
|
United Kingdom
|
27.0%
|
|
France
|
13.3%
|
|
Germany
|
13.1%
|
|
Ireland
|
6.5%
|
|
Switzerland
|
6.4%
|
|
United States
|
5.0%
|
|
Belgium
|
4.9%
|
|
Denmark
|
4.3%
|
|
Spain
|
3.9%
|
|
Austria
|
3.6%
|
WHAT WERE THE FUND COSTS FOR THE PAST YEAR? (based on a hypothetical $10,000 investment)
|
Class Name
|
Costs of a $10,000 investment
|
Costs paid as a percentage of a $10,000 investment
|
|
Institutional Shares
|
$55
|
0.54%
|
HOW DID THE FUND PERFORM LAST YEAR AND WHAT AFFECTED ITS PERFORMANCE?
For the 12-month period ended June 30, 2025, the Fund underperformed its benchmark, the Russell 1000® Index.
WHAT FACTORS INFLUENCED PERFORMANCE
Relative underperformance was driven primarily by stock selection in the Communication Services, Health Care, Information Technology and Consumer Discretionary sectors. Stock selection in Materials and an underweight in Industrials also dragged on performance. Having no exposure to the underperforming Energy sector was the main contributor to relative performance during the period.
POSITIONING
During the period, we exited Fund positions in Gentex Corp., Polaris Inc., Tempur Sealy International Inc. (which recently changed its name to Somnigroup International Inc.), Kellanova and Biogen Inc.
We initiated new Fund positions in Elevance Health Inc., Medtronic plc and Chubb Limited.
|
Top Contributors
|
|
|
↑
|
Kellanova
|
|
↑
|
eBay Inc.
|
|
↑
|
American Express Company
|
|
↑
|
BlackRock, Inc.
|
|
↑
|
Westinghouse Air Brake Technologies Corporation
|
|
Top Detractors
|
|
|
↓
|
Merck & Co., Inc.
|
|
↓
|
Biogen Inc.
|
|
↓
|
Polaris Inc.
|
|
↓
|
Campbell’s Company
|
|
↓
|
Harley-Davidson, Inc.
|
PERFORMANCE
The Fund posted positive returns during the period, which will likely be remembered in large part for the events surrounding “Liberation Day”. The April 2 announcement, which ushered in a new era for global trade, introduced a 10% global baseline tariff as well as higher reciprocal tariffs targeting countries with large trade deficits with the United States. This led to a broad sell-off in equity markets before the U.S. government announced a 90-day moratorium on
tariffs for most countries. Although the baseline 10% tariff was maintained, the pause drove a market reversal, with equities rebounding through to the end of the period.
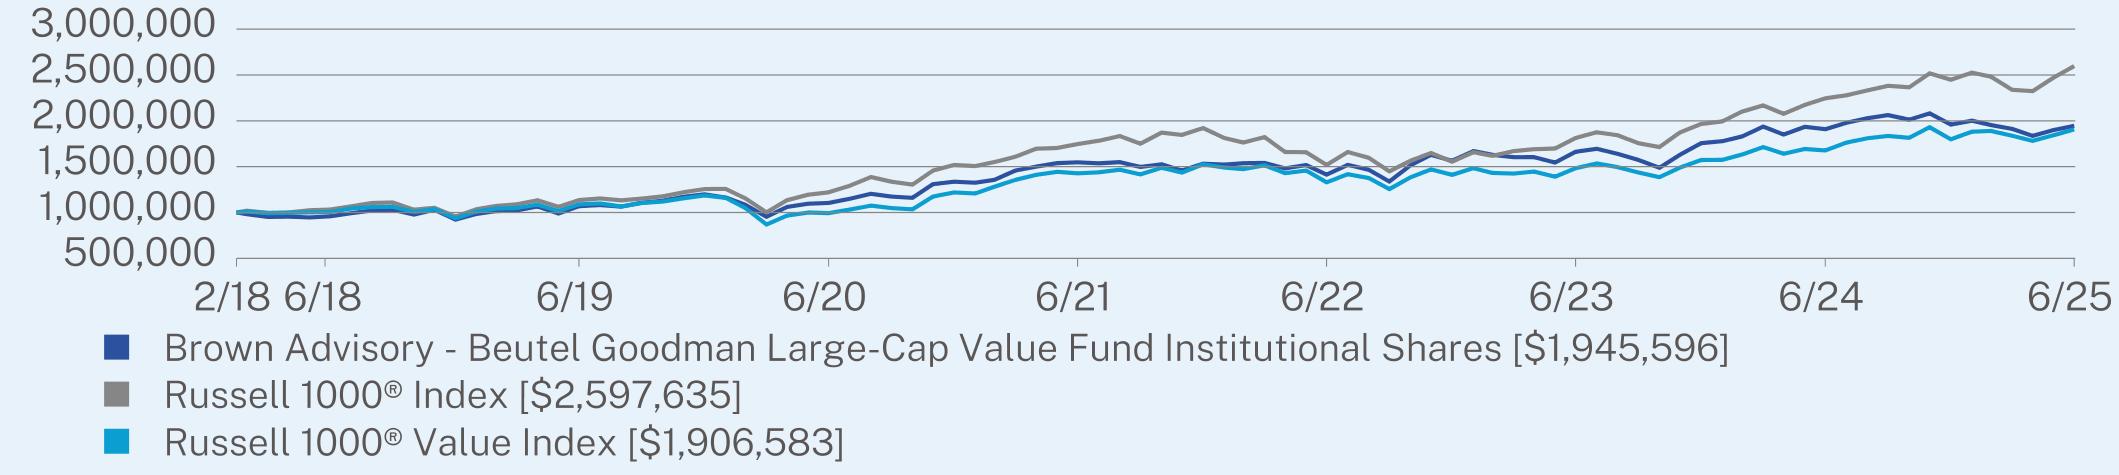
ANNUAL AVERAGE TOTAL RETURN (%)
|
|
1 Year
|
5 Year
|
Since Inception
(02/13/2018) |
|
Institutional Shares
|
1.94
|
11.99
|
9.44
|
|
Russell 1000® Index
|
15.66
|
16.30
|
13.82
|
|
Russell 1000® Value Index
|
13.70
|
13.93
|
9.14
|
Visit https://www.brownadvisory.com/mf/funds/beutel-goodman-large-cap-value-fund for recent performance information.
KEY FUND STATISTICS (as of June 30, 2025)
|
Net Assets
|
$1,668,425,758
|
|
Number of Holdings
|
28
|
|
Net Advisory Fee
|
$8,604,338
|
|
Portfolio Turnover
|
27%
|
|
Top Sectors*
|
(%)
|
|
Financials
|
20.6%
|
|
Information Technology
|
19.1%
|
|
Health Care
|
18.4%
|
|
Industrials
|
10.7%
|
|
Communication Services
|
10.0%
|
|
Consumer Discretionary
|
7.0%
|
|
Consumer Staples
|
6.9%
|
|
Materials
|
4.7%
|
|
Cash & Other
|
2.6%
|
|
Top 10 Issuers
|
(%)
|
|
Gen Digital, Inc.
|
5.1%
|
|
American Express Co.
|
5.1%
|
|
QUALCOMM, Inc.
|
4.9%
|
|
eBay, Inc.
|
4.9%
|
|
Merck & Co., Inc.
|
4.8%
|
|
PPG Industries, Inc.
|
4.7%
|
|
Medtronic PLC
|
4.7%
|
|
Comcast Corp.
|
4.6%
|
|
Westinghouse Air Brake Technologies Corp.
|
4.6%
|
|
Amdocs Ltd.
|
4.6%
|
WHAT WERE THE FUND COSTS FOR THE PAST YEAR? (based on a hypothetical $10,000 investment)
|
Class Name
|
Costs of a $10,000 investment
|
Costs paid as a percentage of a $10,000 investment
|
|
Investor Shares
|
$70
|
0.69%
|
HOW DID THE FUND PERFORM LAST YEAR AND WHAT AFFECTED ITS PERFORMANCE?
For the 12-month period ended June 30, 2025, the Fund underperformed its benchmark, the Russell 1000® Index.
WHAT FACTORS INFLUENCED PERFORMANCE
Relative underperformance was driven primarily by stock selection in the Communication Services, Health Care, Information Technology and Consumer Discretionary sectors. Stock selection in Materials and an underweight in Industrials also dragged on performance. Having no exposure to the underperforming Energy sector was the main contributor to relative performance during the period.
POSITIONING
During the period, we exited Fund positions in Gentex Corp., Polaris Inc., Tempur Sealy International Inc. (which recently changed its name to Somnigroup International Inc.), Kellanova and Biogen Inc.
We initiated new Fund positions in Elevance Health Inc., Medtronic plc and Chubb Limited.
|
Top Contributors
|
|
|
↑
|
Kellanova
|
|
↑
|
eBay Inc.
|
|
↑
|
American Express Company
|
|
↑
|
BlackRock, Inc.
|
|
↑
|
Westinghouse Air Brake Technologies Corporation
|
|
Top Detractors
|
|
|
↓
|
Merck & Co., Inc.
|
|
↓
|
Biogen Inc.
|
|
↓
|
Polaris Inc.
|
|
↓
|
Campbell’s Company
|
|
↓
|
Harley-Davidson, Inc.
|
PERFORMANCE
The Fund posted positive returns during the period, which will likely be remembered in large part for the events surrounding “Liberation Day”. The April 2 announcement, which ushered in a new era for global trade, introduced a 10% global baseline tariff as well as higher reciprocal tariffs targeting countries with large trade deficits with the United States. This led to a broad sell-off in equity markets before the U.S. government announced a 90-day moratorium on
tariffs for most countries. Although the baseline 10% tariff was maintained, the pause drove a market reversal, with equities rebounding through to the end of the period.
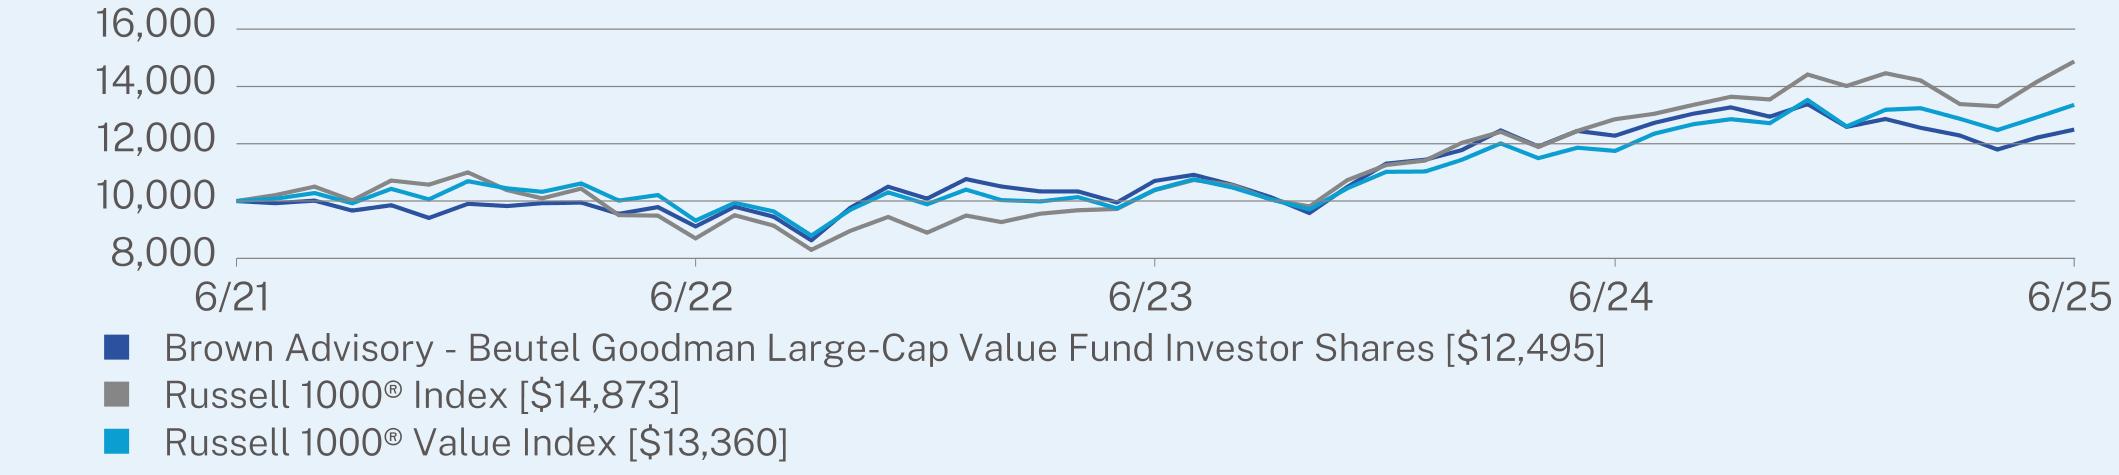
ANNUAL AVERAGE TOTAL RETURN (%)
|
|
1 Year
|
Since Inception
(06/30/2021) |
|
Investor Shares
|
1.74
|
5.73
|
|
Russell 1000® Index
|
15.66
|
10.43
|
|
Russell 1000® Value Index
|
13.70
|
7.51
|
Visit https://www.brownadvisory.com/mf/funds/beutel-goodman-large-cap-value-fund for recent performance information.
KEY FUND STATISTICS (as of June 30, 2025)
|
Net Assets
|
$1,668,425,758
|
|
Number of Holdings
|
28
|
|
Net Advisory Fee
|
$8,604,338
|
|
Portfolio Turnover
|
27%
|
|
Top Sectors*
|
(%)
|
|
Financials
|
20.6%
|
|
Information Technology
|
19.1%
|
|
Health Care
|
18.4%
|
|
Industrials
|
10.7%
|
|
Communication Services
|
10.0%
|
|
Consumer Discretionary
|
7.0%
|
|
Consumer Staples
|
6.9%
|
|
Materials
|
4.7%
|
|
Cash & Other
|
2.6%
|
|
Top 10 Issuers
|
(%)
|
|
Gen Digital, Inc.
|
5.1%
|
|
American Express Co.
|
5.1%
|
|
QUALCOMM, Inc.
|
4.9%
|
|
eBay, Inc.
|
4.9%
|
|
Merck & Co., Inc.
|
4.8%
|
|
PPG Industries, Inc.
|
4.7%
|
|
Medtronic PLC
|
4.7%
|
|
Comcast Corp.
|
4.6%
|
|
Westinghouse Air Brake Technologies Corp.
|
4.6%
|
|
Amdocs Ltd.
|
4.6%
|
WHAT WERE THE FUND COSTS FOR THE PAST YEAR? (based on a hypothetical $10,000 investment)
|
Class Name
|
Costs of a $10,000 investment*
|
Costs paid as a percentage of a $10,000 investment*
|
|
Institutional Shares
|
$78
|
1.00%
|
HOW DID THE FUND PERFORM LAST YEAR AND WHAT AFFECTED ITS PERFORMANCE?
For the 9-month period ended June 30, 2025, the Fund outperformed its benchmark, the TOPIX Index.
WHAT FACTORS INFLUENCED PERFORMANCE
Security selection was the primary driver of relative outperformance. Strong selection in Information Technology and Materials was partially offset by selection in Communication Services and Consumer Discretionary. Sector allocation, a result of our bottom-up stock selection process, however, detracted from returns. Allocation effect was driven by our overweight to Materials and underweight to Communication Services, but partially offset by our underweight to Consumer Staples and Consumer Discretionary.
POSITIONING
Over the 9-month period, we increased our exposure the most to Materials, Real Estate and Health Care, while rotating away from Consumer Discretionary and Industrials. At the sector level, our largest overweight were Materials, Health Care and Real Estate. We were most underweight to Industrials, Communication Services and Consumer Staples.
|
Top Contributors
|
|
|
↑
|
Sony Group Corporation
|
|
↑
|
Mitsubishi UFJ Financial Group, Inc.
|
|
↑
|
TechnoPro Holdings Inc.
|
|
↑
|
THK Co., Ltd.
|
|
↑
|
Shionogi & Co., Ltd.
|
|
Top Detractors
|
|
|
↓
|
Daiichi Sankyo Company, Limited
|
|
↓
|
Shin-Etsu Chemical Co Ltd
|
|
↓
|
MISUMI Group Inc.
|
|
↓
|
Astellas Pharma Inc.
|
|
↓
|
dip Corporation
|
PERFORMANCE
Following a challenging ’24 (we struggled in a narrow large cap, momentum rally), in 1H ’25 our strategy generated alpha amid volatile market environments (1Q: reversal of ’24 factor pattern, 2Q: resurgence of risk-momentum rally driven by domestic/thematics areas). Our engagement led value realization (shareholder return improvement, takeovers, etc.) on the back of accelerating shareholder activism, contributed positively to alpha.
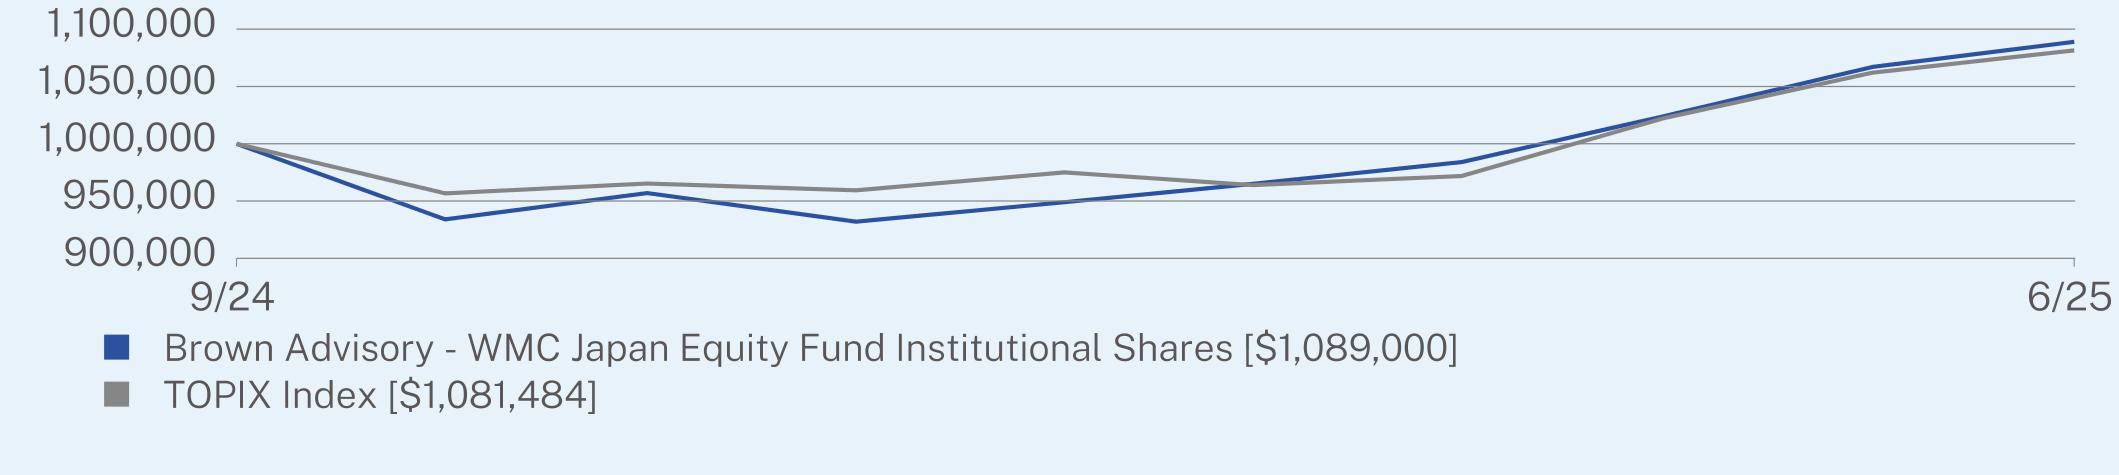
Cumulative TOTAL RETURN (%)
|
|
Since Inception
(09/30/2024) |
|
Institutional Shares
|
8.90
|
|
TOPIX Index
|
8.15
|
Visit https://www.brownadvisory.com/mf/wmc-japan-equity-fund for recent performance information.
KEY FUND STATISTICS (as of June 30, 2025)
|
Net Assets
|
$306,307,899
|
|
Number of Holdings
|
79
|
|
Net Advisory Fee
|
$917,513
|
|
Portfolio Turnover
|
73%
|
|
Top Sectors*
|
(%)
|
|
Industrials
|
18.1%
|
|
Materials
|
16.8%
|
|
Consumer Discretionary
|
14.5%
|
|
Financials
|
13.9%
|
|
Information Technology
|
10.8%
|
|
Health Care
|
10.5%
|
|
Real Estate
|
5.6%
|
|
Communication Services
|
4.1%
|
|
Consumer Staples
|
2.4%
|
|
Cash & Other
|
3.3%
|
|
Top 10 Issuers
|
(%)
|
|
First American Government Obligations Fund
|
4.1%
|
|
KDDI Corp.
|
3.1%
|
|
Shin-Etsu Chemical Co. Ltd.
|
3.0%
|
|
Daiichi Sankyo Co. Ltd.
|
2.7%
|
|
Sony Group Corp.
|
2.6%
|
|
Tokyo Electron Ltd.
|
2.6%
|
|
Sumitomo Mitsui Trust Group, Inc.
|
2.5%
|
|
Asahi Group Holdings Ltd.
|
2.4%
|
|
Dai-ichi Life Holdings, Inc.
|
2.3%
|
|
Shionogi & Co. Ltd.
|
2.2%
|
|
Top Countries
|
(%)
|
|
Japan
|
96.7%
|
|
United States
|
4.1%
|
WHAT WERE THE FUND COSTS FOR THE PAST YEAR? (based on a hypothetical $10,000 investment)
|
Class Name
|
Costs of a $10,000 investment*
|
Costs paid as a percentage of a $10,000 investment*
|
|
Investor Shares
|
$90
|
1.15%
|
HOW DID THE FUND PERFORM LAST YEAR AND WHAT AFFECTED ITS PERFORMANCE?
For the 9-month period ended June 30, 2025, the Fund outperformed its benchmark, the TOPIX Index.
WHAT FACTORS INFLUENCED PERFORMANCE
Security selection was the primary driver of relative outperformance. Strong selection in Information Technology and Materials was partially offset by selection in Communication Services and Consumer Discretionary. Sector allocation, a result of our bottom-up stock selection process, however, detracted from returns. Allocation effect was driven by our overweight to Materials and underweight to Communication Services, but partially offset by our underweight to Consumer Staples and Consumer Discretionary.
POSITIONING
Over the 9-month period, we increased our exposure the most to Materials, Real Estate and Health Care, while rotating away from Consumer Discretionary and Industrials. At the sector level, our largest overweight were Materials, Health Care and Real Estate. We were most underweight to Industrials, Communication Services and Consumer Staples.
|
Top Contributors
|
|
|
↑
|
Sony Group Corporation
|
|
↑
|
Mitsubishi UFJ Financial Group, Inc.
|
|
↑
|
TechnoPro Holdings Inc.
|
|
↑
|
THK Co., Ltd.
|
|
↑
|
Shionogi & Co., Ltd.
|
|
Top Detractors
|
|
|
↓
|
Daiichi Sankyo Company, Limited
|
|
↓
|
Shin-Etsu Chemical Co Ltd
|
|
↓
|
MISUMI Group Inc.
|
|
↓
|
Astellas Pharma Inc.
|
|
↓
|
dip Corporation
|
PERFORMANCE
Following a challenging ’24 (we struggled in a narrow large cap, momentum rally), in 1H ’25 our strategy generated alpha amid volatile market environments (1Q: reversal of ’24 factor pattern, 2Q: resurgence of risk-momentum rally driven by domestic/thematics areas). Our engagement led value realization (shareholder return improvement, takeovers, etc.) on the back of accelerating shareholder activism, contributed positively to alpha.
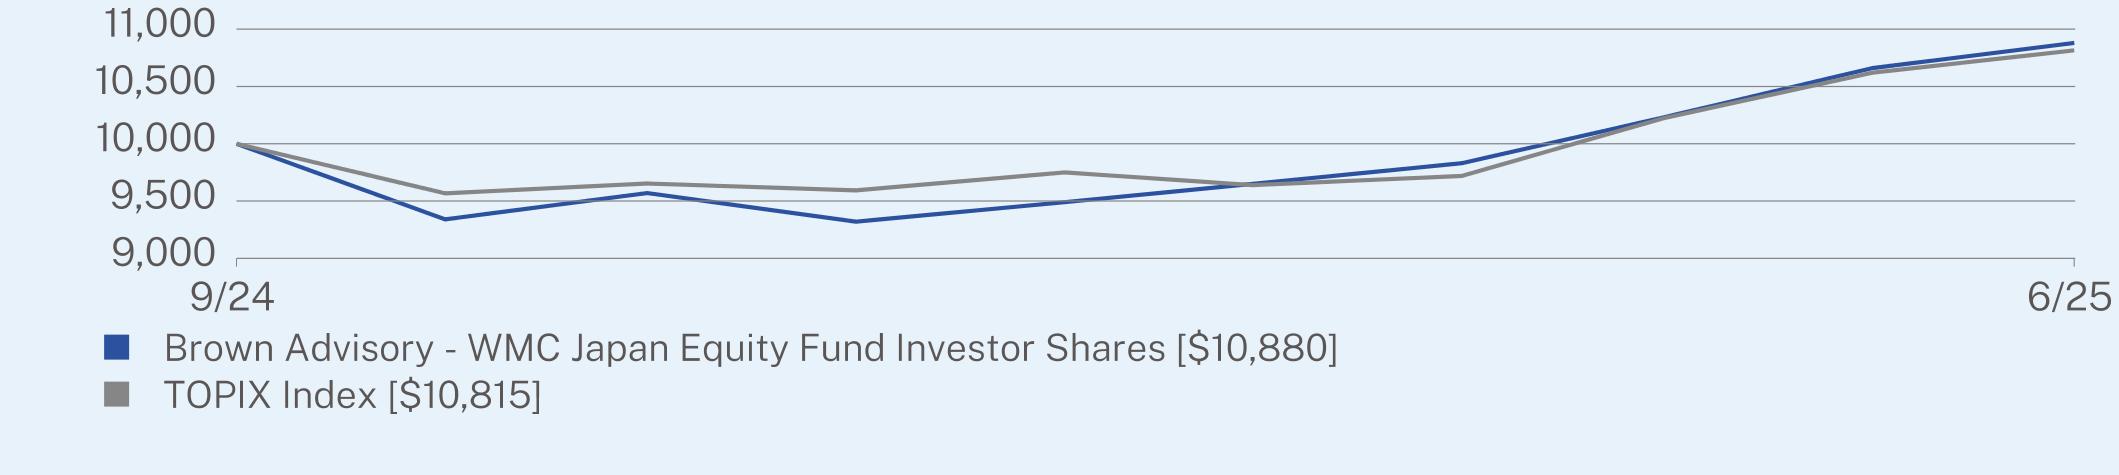
Cumulative TOTAL RETURN (%)
|
|
Since Inception
(09/30/2024) |
|
Investor Shares
|
8.80
|
|
TOPIX Index
|
8.15
|
Visit https://www.brownadvisory.com/mf/wmc-japan-equity-fund for recent performance information.
KEY FUND STATISTICS (as of June 30, 2025)
|
Net Assets
|
$306,307,899
|
|
Number of Holdings
|
79
|
|
Net Advisory Fee
|
$917,513
|
|
Portfolio Turnover
|
73%
|
|
Top Sectors*
|
(%)
|
|
Industrials
|
18.1%
|
|
Materials
|
16.8%
|
|
Consumer Discretionary
|
14.5%
|
|
Financials
|
13.9%
|
|
Information Technology
|
10.8%
|
|
Health Care
|
10.5%
|
|
Real Estate
|
5.6%
|
|
Communication Services
|
4.1%
|
|
Consumer Staples
|
2.4%
|
|
Cash & Other
|
3.3%
|
|
Top 10 Issuers
|
(%)
|
|
First American Government Obligations Fund
|
4.1%
|
|
KDDI Corp.
|
3.1%
|
|
Shin-Etsu Chemical Co. Ltd.
|
3.0%
|
|
Daiichi Sankyo Co. Ltd.
|
2.7%
|
|
Sony Group Corp.
|
2.6%
|
|
Tokyo Electron Ltd.
|
2.6%
|
|
Sumitomo Mitsui Trust Group, Inc.
|
2.5%
|
|
Asahi Group Holdings Ltd.
|
2.4%
|
|
Dai-ichi Life Holdings, Inc.
|
2.3%
|
|
Shionogi & Co. Ltd.
|
2.2%
|
|
Top Countries
|
(%)
|
|
Japan
|
96.7%
|
|
United States
|
4.1%
|
| [1] |
|
||
| [2] |
|
||
| [3] |
|
||
| [4] |
|
||
| [5] |
|
||
| [6] |
|
||
| [7] |
|
||
| [8] |
|
||
| [9] |
|
||
| [10] |
|
||
| [11] |
|
||
| [12] |
|
||
| [13] |
|
||
| [14] |
|
||
| [15] |
|
||
| [16] |
|
||
| [17] |
|
||
| [18] |
|
||
| [19] |
|
||
| [20] |
|
||
| [21] |
|
||
| [22] |
|
||
| [23] |
|
||
| [24] |
|
||
| [25] |
|
||
| [26] |
|
||
| [27] |
|
||
| [28] |
|
||
| [29] |
|
||
| [30] |
|
||
| [31] |
|
||
| [32] |
|
||
| [33] |
|
||
| [34] |
|