| H1 2025 | Update |

| Disclaimer This presentation may contain “forward-looking statements” which include, but are not limited to, statements regarding future events and other statements that are not historical facts. Forward-looking statements are generally accompanied by words such as “believe,” “may,” “will,” “estimate,” “continue,” “anticipate,” “intend,” “expect,” “should,” “would,” “plan,” “predict,” “potential,” “seem,” “seek,” “future,” “outlook” and similar expressions that predict or indicate future events or trends or that are not statements of historical matters. For example, Swvl Holdings Corp (“Swvl“) is using forward-looking statements when it discusses its technology, solutions and product suite capabilities; the belief that its solutions will enable the operation of a fully optimized transportation network, empowering accessible, efficient and reliable transportation; the expansion of its business in the United States (“US”) and the United Kingdom (“UK”); its long-term sustainability and dollar-pegged growth; the expansion of dollar-pegged revenue to reduce exposure to changes in foreign currencies; the expansion of engineering operations and support teams in some of the cost-effective markets it operates in; the expectation that its new cohort of contracts will continue to grow year-over-year (YoY) while its commercial engine will consistently bring in new cohorts of contracts at an accelerating pace; and the expectation that its strong gross profit growth positions Swvl for continued success in the years ahead and the expected revenue and gross margin in the upcoming fiscal year. These statements are based on the current expectations of Swvl’s management and are not predictions of actual performance. These forward-looking statements must not be relied on by any investor as a guarantee, assurance, prediction, or definitive statement of fact or probability. Actual results and outcomes could differ materially for a variety of reasons, including, among others, general economic, political and business conditions; the ability of Swvl to execute its growth strategy, manage growth profitably and retain its key employees; competition with other companies in the mobility industry; Swvl’s limited operating history and lack of experience as a public company; recent implementation of certain policies and procedures to ensure compliance with applicable laws and regulations, including with respect to anti-bribery, anti-corruption, and cyber protection; the risk that Swvl is not able to execute its portfolio optimization plan; the risk that Swvl is unable to attract and retain consumers and qualified drivers and other high quality personnel; the risk that Swvl is unable to protect and enforce its intellectual property rights; the risk that Swvl is unable to determine rider demand to develop new offerings on its platform; the difficulty of obtaining required registrations, licenses, permits or approvals in jurisdictions in which Swvl currently operates or may in the future operate; the fact that Swvl currently operates in and intends to expand into jurisdictions that are, or have been, characterized by political instability, may have inadequate or limited regulatory and legal frameworks and may have limited, if any, treaties or other arrangements in place to protect foreign investment or involvement; the risk that Swvl’s drivers could be classified as employees, workers or quasi-employees in the jurisdictions they operate; the fact that Swvl has operations in countries known to experience high levels of corruption and is subject to territorial anticorruption laws in these jurisdictions; the ability of Swvl to maintain the listing of its securities on Nasdaq; Swvl’s acquisitions may not be beneficial to Swvl as a result of the cost of integrating geographically disparate operations and the diversion of management’s attention from its existing business, among other things; and other risks that will be detailed from time to time in filings with the U.S. Securities and Exchange Commission. The foregoing list of risk factors is not exhaustive. There may be additional risks that Swvl presently does not know or that Swvl currently believes are immaterial that could also cause actual results to differ from those contained in forward-looking statements. In addition, forward-looking statements provide Swvl’s expectations, plans or forecasts of future events and views as of the date of this communication. Swvl anticipates that subsequent events and developments will cause Swvl’s assessments and projections to change. However, while Swvl may elect to update these forward-looking statements in the future, Swvl specifically disclaims any obligation to do so. These forward-looking statements should not be relied upon as representing Swvl’s assessments as of any date subsequent to the date of this presentation. Accordingly, undue reliance should not be placed upon the forward-looking statements. Forward-looking Statements 2 |
| Statement Regarding Non-IFRS Measures This presentation includes references to non-IFRS financial measures, which include amounts presented in constant currencies. However, the presentation of these non-IFRS financial measures is not intended to be considered in isolation from, or as an alternative to, financial measures determined in accordance with IFRS. In addition, these non-IFRS financial measures may differ from non-IFRS financial measures with comparable names used by other companies. Swvl uses these non-IFRS financial measures for financial and operational decision-making and as a means to evaluate period-to-period comparisons, and Swvl’s management believes that these non-IFRS financial measures providemeaningful supplemental information regarding its performance by excluding certain items that may not be indicative of recurring core business operating results. There are a number of limitations related to the use of non-IFRS financial measures. In light of these limitations, we provide specific information regarding the IFRS amounts excluded from these non-IFRS financial measures and evaluate these non-IFRS financial measures together with their relevant financial measures in accordance with IFRS. An explanation of the non-IFRS financial measures referenced in this presentation can be found below: For a reconciliation to the most directly comparable IFRS measures please see Appendix A. Key Business Measures In addition to the measures presented in our consolidated financial statements, this presentation includes references to certain key business measures that Swvl’s management uses to help evaluate and identify trends affecting Swvl’s business, formulate business plans and make strategic decisions. The key business measures referenced in this presentation are set forth below. Dollar-Pegged Revenue, Recurring Revenue, Transactional Revenue, Net Dollar Retention which are defined in Appendix B. Forward-looking Statements (continued) 3 |
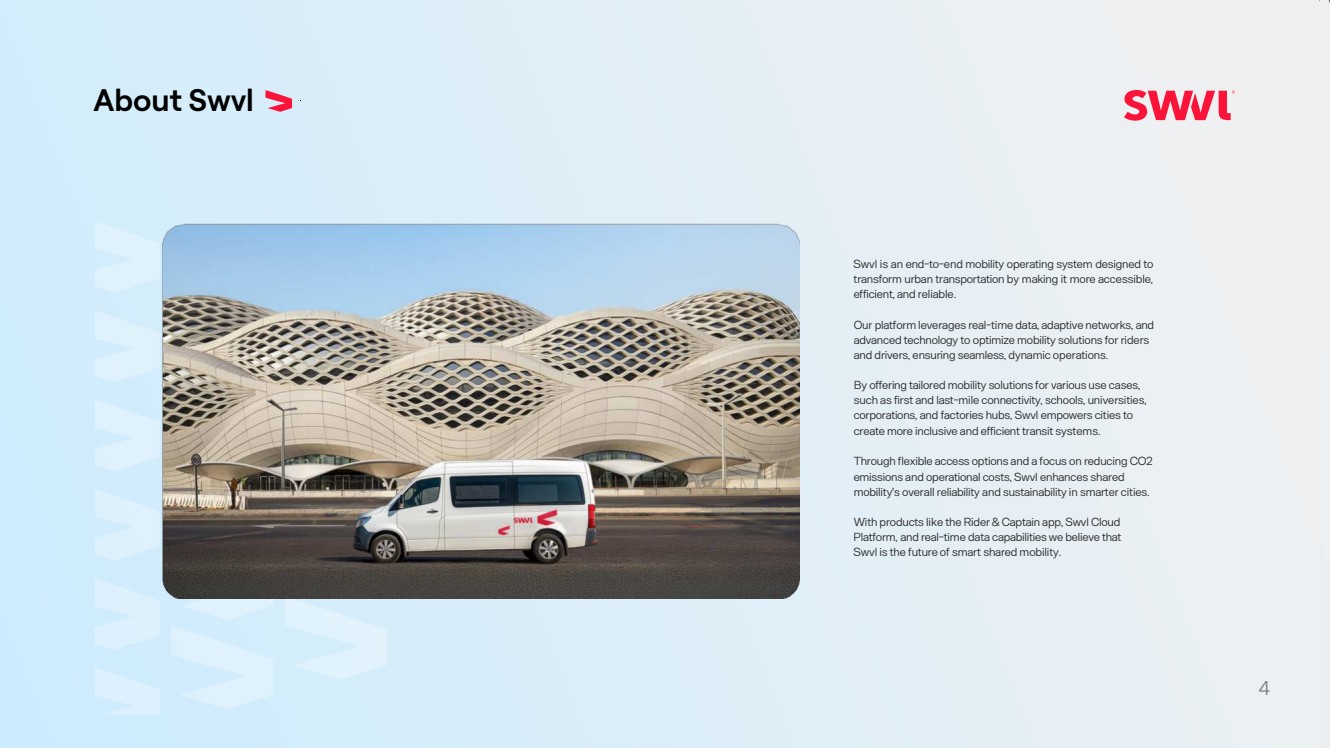
| About Swvl Swvl is an end-to-end mobility operating system designed to transform urban transportation by making it more accessible, efficient, and reliable. Our platform leverages real-time data, adaptive networks, and advanced technology to optimize mobility solutions for riders and drivers, ensuring seamless, dynamic operations. By offering tailored mobility solutions for various use cases, such as first and last-mile connectivity, schools, universities, corporations, and factories hubs, Swvl empowers cities to create more inclusive and efficient transit systems. Through flexible access options and a focus on reducingCO2 emissions and operational costs, Swvl enhances shared mobility's overall reliability and sustainability in smarter cities. With products like the Rider& Captain app, Swvl Cloud Platform, and real-time data capabilities we believe that Swvl is the future of smart shared mobility. 4 |
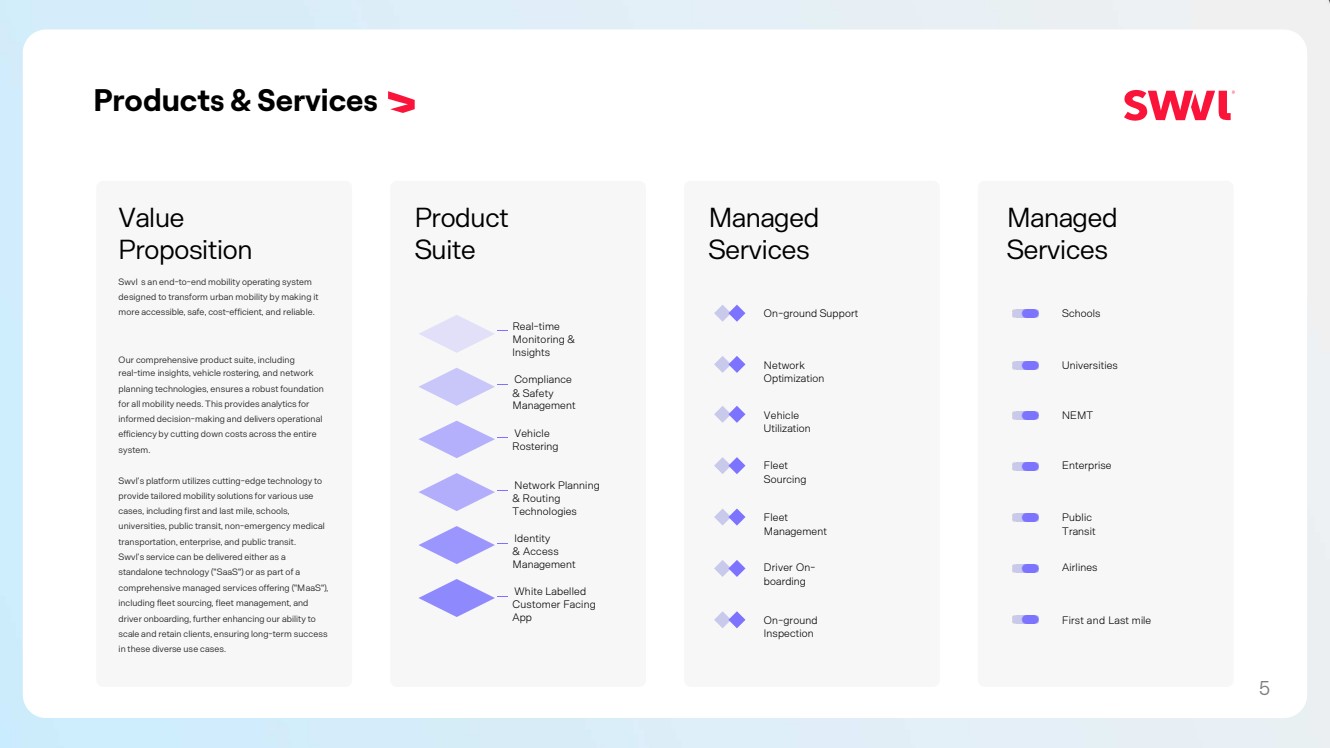
| Products & Services Product Suite Managed Services Real -time Monitoring & Insights Compliance & Safety Management Vehicle Rostering Network Planning & Routing Technologies Identity & Access Management White Labelled Customer Facing App On -ground Support Network Optimization Vehicle Utilization Fleet Sourcing Fleet Management Driver On - boarding On -ground Inspection Value Proposition Swvl s an end -to -end mobility operating system designed to transform urban mobility by making it more accessible, safe, cost -efficient, and reliable. Our comprehensive product suite, including real -time insights, vehicle rostering, and network planning technologies, ensures a robust foundation for all mobility needs. This provides analytics for informed decision -making and delivers operational efficiency by cutting down costs across the entire system. Swvl’s platform utilizes cutting -edge technology to provide tailored mobility solutions for various use cases, including first and last mile, schools, universities, public transit, non -emergency medical transportation, enterprise, and public transit. Swvl’s service can be delivered either as a standalone technology ("SaaS ") or as part of a comprehensive managed services offering ("MaaS "), including fleet sourcing, fleet management, and driver onboarding, further enhancing our ability to scale and retain clients, ensuring long -term success in these diverse use cases. Managed Services Schools Universities NEMT Enterprise Public Transit Airlines First and Last mile 5 |
| Strategy Highlight |

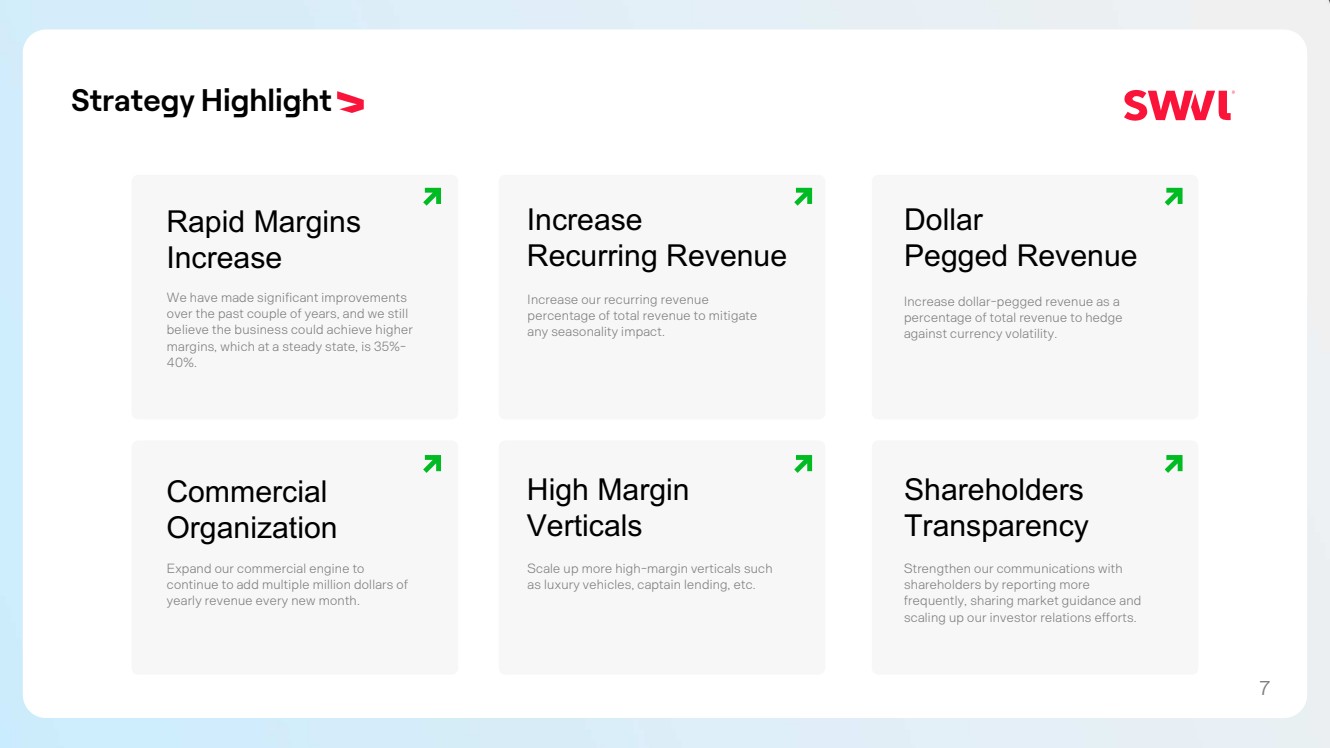
| Strategy Highlight Rapid Margins Increase We have made significant improvements over the past couple of years, and we still believe the business could achieve higher margins, which at a steady state, is 35%- 40%. Increase Recurring Revenue Dollar Pegged Revenue Commercial Organization High Margin Verticals Shareholders Transparency Increase our recurring revenue percentage of total revenue to mitigate any seasonality impact. Increase dollar-pegged revenue as a percentage of total revenue to hedge against currency volatility. Expand our commercial engine to continue to add multiple million dollars of yearly revenue every new month. Scale up more high-margin verticals such as luxury vehicles, captain lending, etc. Strengthen our communications with shareholders by reporting more frequently, sharing market guidance and scaling up our investor relations efforts. 7 |
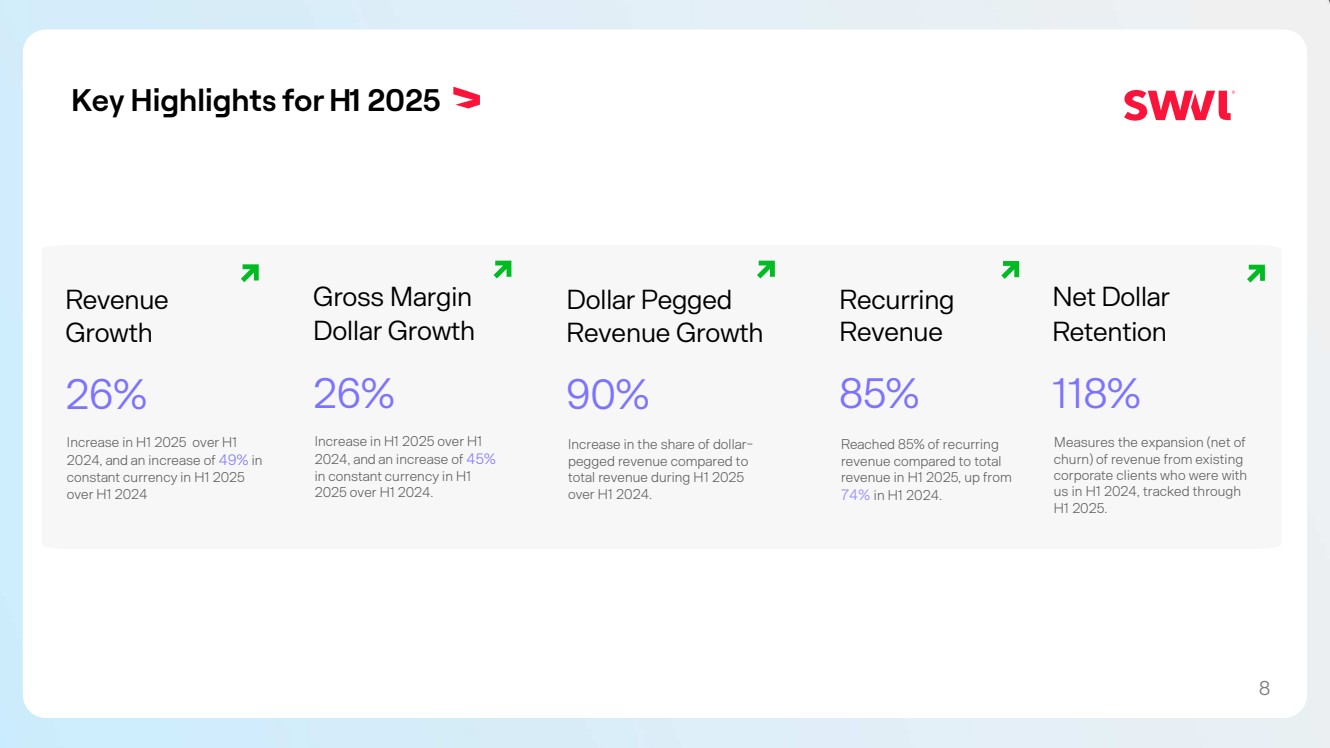
| Key Highlights for H1 2025 Revenue Growth 26% Increase in H1 2025 over H1 2024, and an increase of 49% in constant currency in H1 2025 over H1 2024 Gross Margin Dollar Growth 26% Increase in H1 2025 over H1 2024, and an increase of 45% in constant currency in H1 2025 over H1 2024. 8 Recurring Revenue 85% Reached 85% of recurring revenue compared to total revenue in H1 2025, up from 74% in H1 2024. Dollar Pegged Revenue Growth 90% Increase in the share of dollar-pegged revenue compared to total revenue during H1 2025 over H1 2024. Net Dollar Retention 118% Measures the expansion (net of churn) of revenue from existing corporate clients who were with us in H1 2024, tracked through H1 2025. |
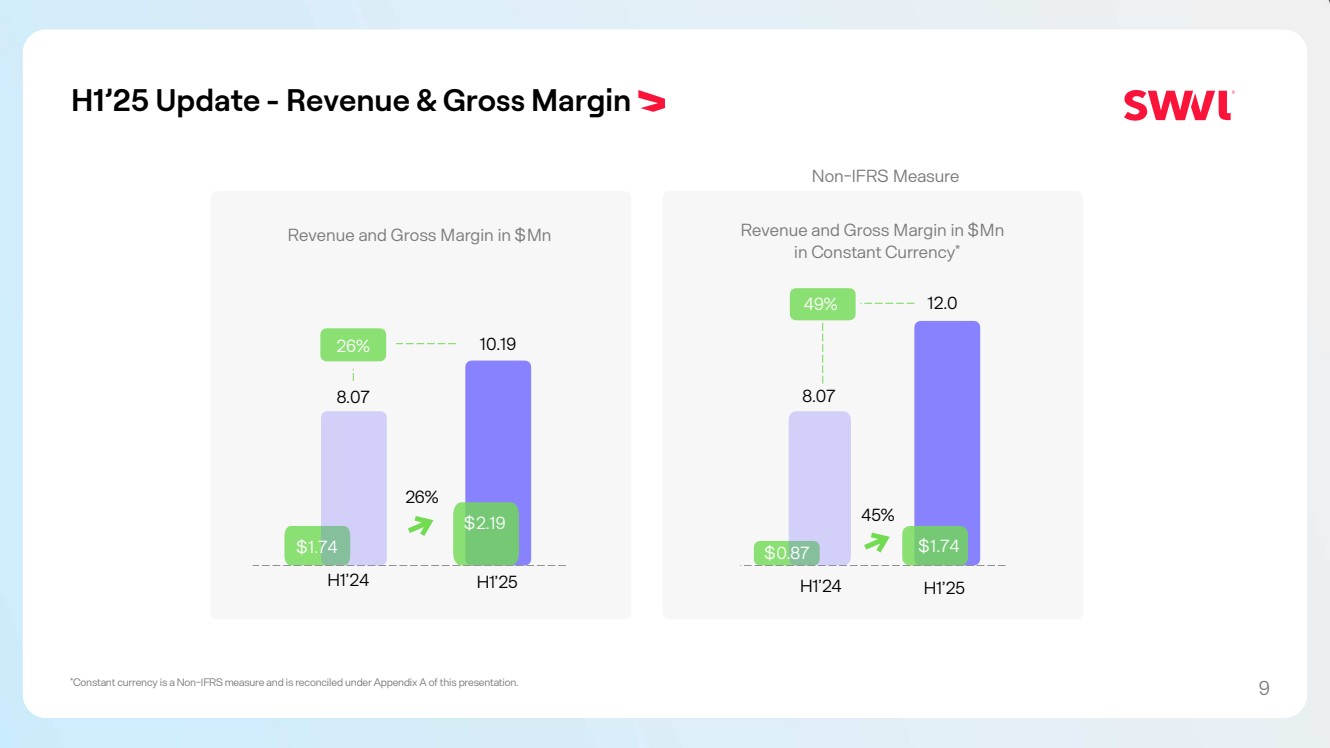
| H1’25 Update - Revenue & Gross Margin Revenue and Gross Margin in $Mn 8.07 26% 10.19 H1’25 $1.74 H1’24 $2.19 26% 8.07 H1’24 $0.87 45% $1.74 H1’25 49% 12.0 Revenue and Gross Margin in $Mn in Constant Currency* *Constant currency is a Non-IFRS measure and is reconciled under Appendix A of this presentation. 9 Non-IFRS Measure |
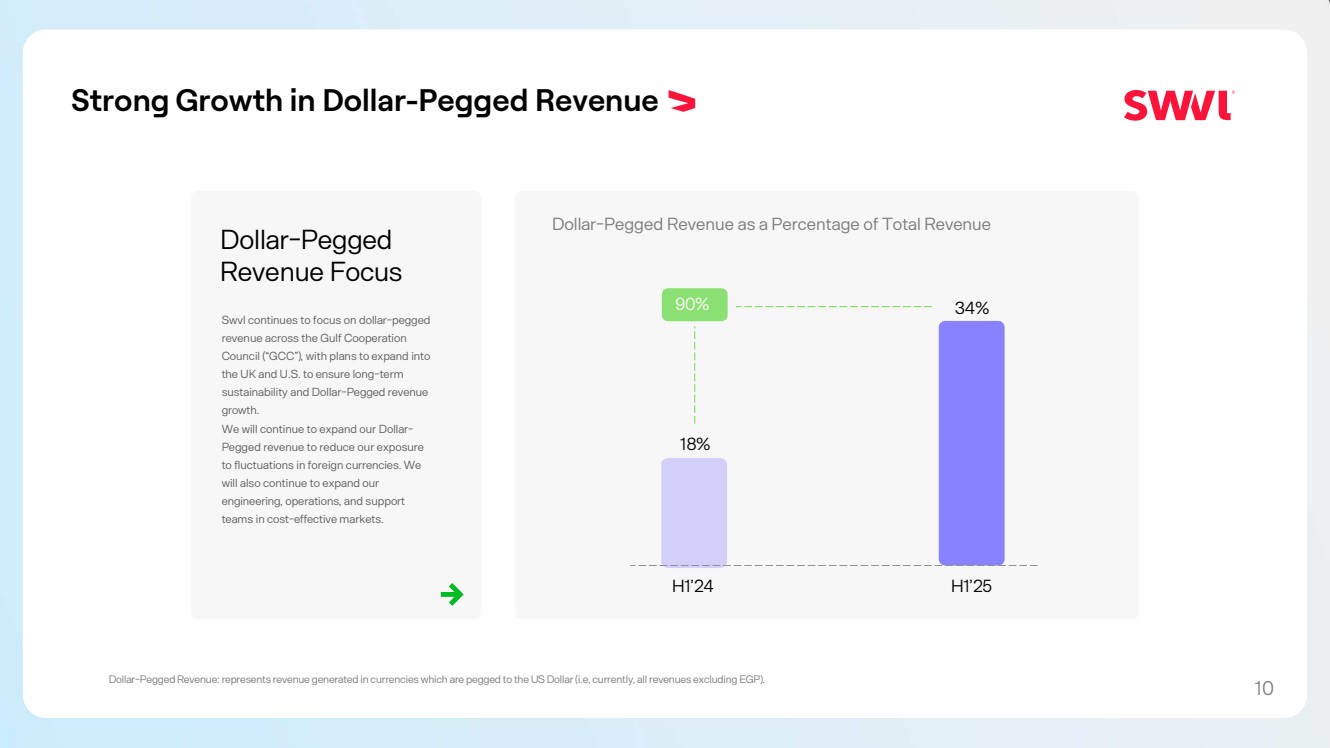
| Strong Growth in Dollar-Pegged Revenue 18% 90% 34% H1’24 H1’25 Dollar-Pegged Revenue as a Percentage of Total Revenue Dollar-Pegged Revenue: represents revenue generated in currencies which are pegged to the US Dollar (i.e, currently, all revenues excluding EGP). Dollar-Pegged Revenue Focus Swvl continues to focus on dollar-pegged revenue across the Gulf Cooperation Council (“GCC”), with plans to expand into the UK and U.S. to ensure long-term sustainability and Dollar-Pegged revenue growth. We will continue to expand our Dollar-Pegged revenue to reduce our exposure to fluctuations in foreign currencies. We will also continue to expand our engineering, operations, and support teams in cost-effective markets. 10 |
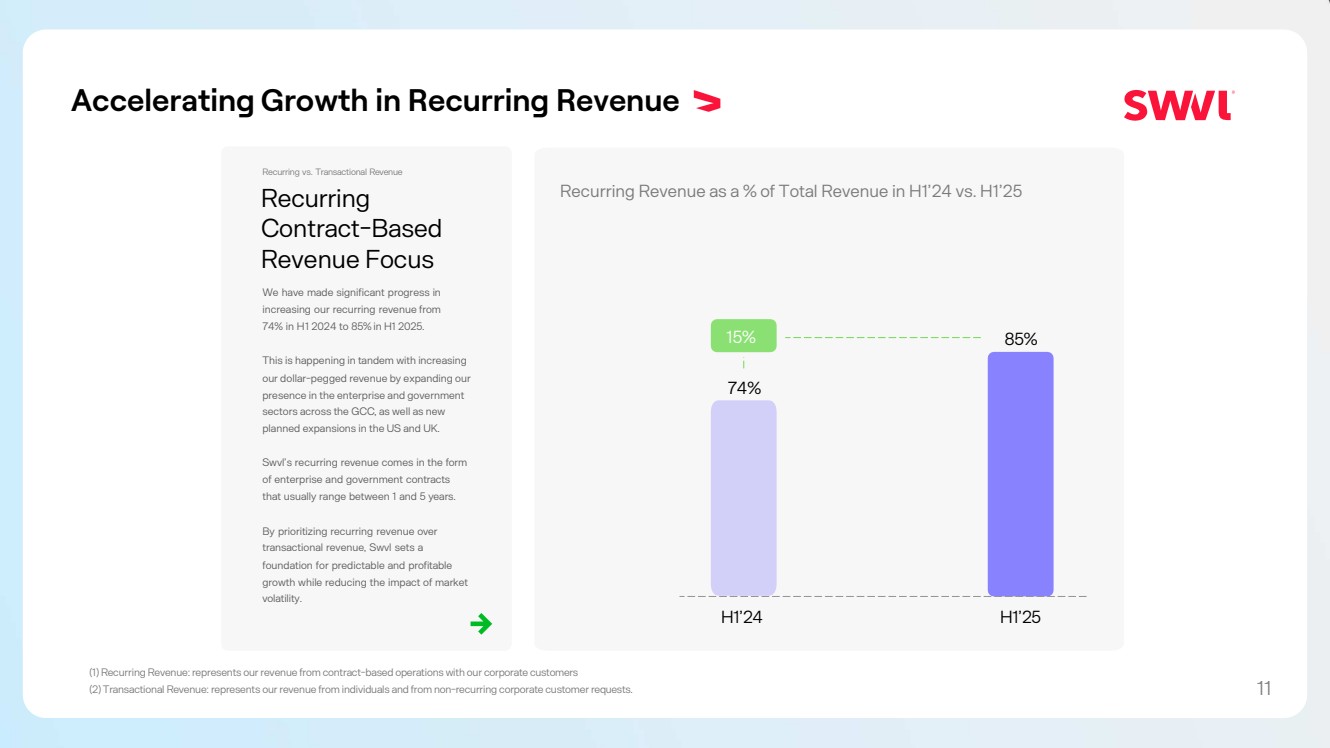
| Accelerating Growth in Recurring Revenue Recurring vs. Transactional Revenue Recurring Contract-Based Revenue Focus We have made significant progress in increasing our recurring revenue from 74% in H1 2024 to 85% in H1 2025. This is happening in tandem with increasing our dollar-pegged revenue by expanding our presence in the enterprise and government sectors across the GCC, as well as new planned expansions in the US and UK. Swvl’s recurring revenue comes in the form of enterprise and government contracts that usually range between 1 and 5 years. By prioritizing recurring revenue over transactional revenue, Swvl sets a foundation for predictable and profitable growth while reducing the impact of market volatility. (1) Recurring Revenue: represents our revenue from contract-based operations with our corporate customers (2) Transactional Revenue: represents our revenue from individuals and from non-recurring corporate customer requests. 74% 15% 85% H1’24 H1’25 Recurring Revenue as a % of Total Revenue in H1’24 vs. H1’25 11 |
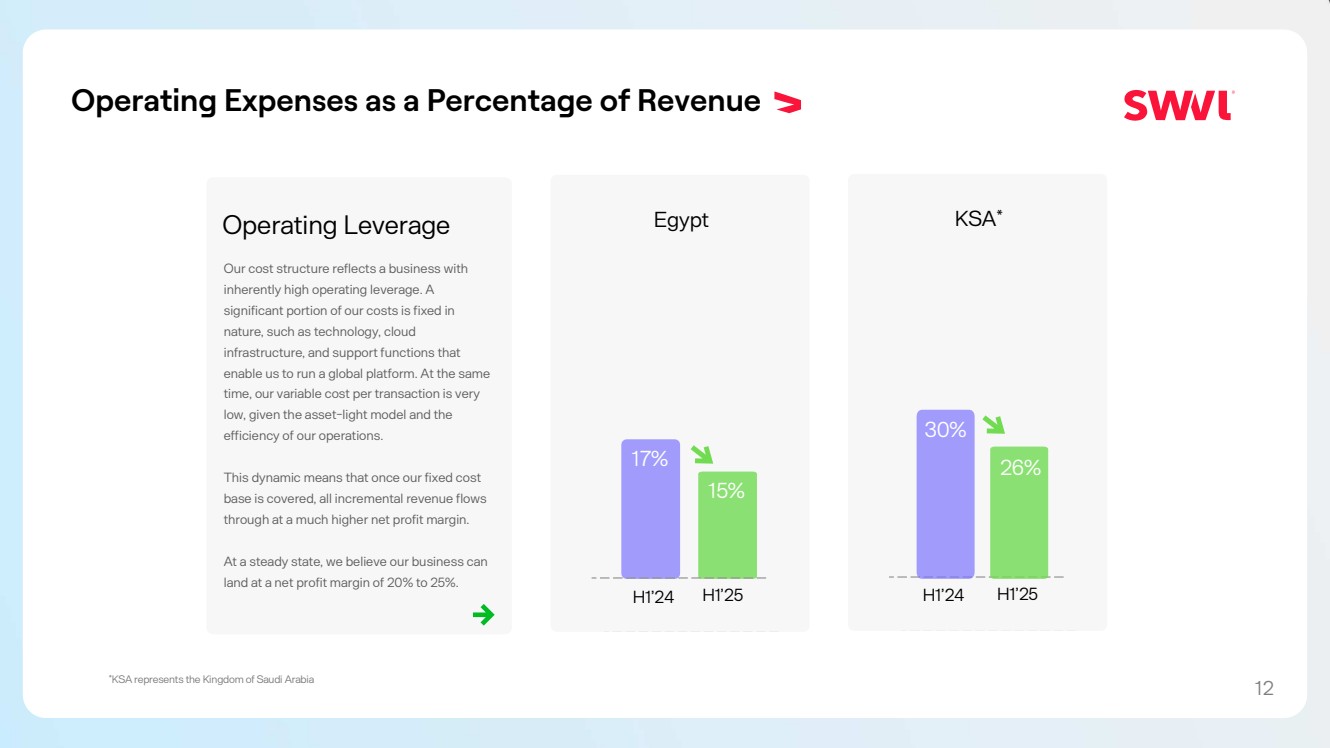
| Operating Expenses as a Percentage of Revenue Operating Leverage Our cost structure reflects a business with inherently high operating leverage. A significant portion of our costs is fixed in nature, such as technology, cloud infrastructure, and support functions that enable us to run a global platform. At the same time, our variable cost per transaction is very low, given the asset-light model and the efficiency of our operations. This dynamic means that once our fixed cost base is covered, all incremental revenue flows through at a much higher net profit margin. At a steady state, we believe our business can land at a net profit margin of 20% to 25%. Egypt 17% 15% H1’24 H1’25 KSA* 30% 26% H1’24 H1’25 12 *KSA represents the Kingdom of Saudi Arabia |
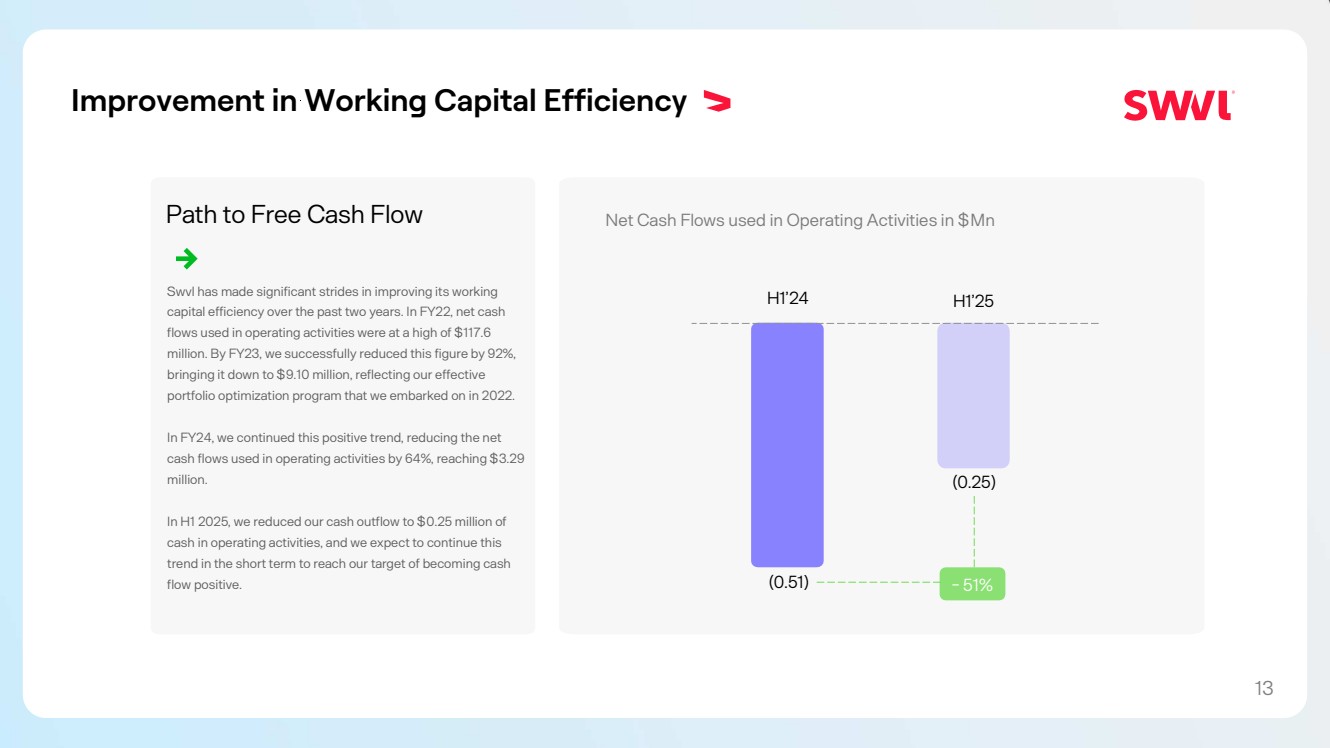
| Improvement in Working Capital Efficiency Net Cash Flows used in Operating Activities in $Mn H1’24 H1’25 (0.51) (0.25) Path to Free Cash Flow Swvl has made significant strides in improving its working capital efficiency over the past two years. In FY22, net cash flows used in operating activities were at a high of $117.6 million. By FY23, we successfully reduced this figure by 92%, bringing it down to $9.10 million, reflecting our effective portfolio optimization program that we embarked on in 2022. In FY24, we continued this positive trend, reducing the net cash flows used in operating activities by 64%, reaching $3.29 million. In H1 2025, we reduced our cash outflow to $0.25 million of cash in operating activities, and we expect to continue this trend in the short term to reach our target of becoming cash flow positive. - 51% 13 |
| Financial Results H1 2025 |

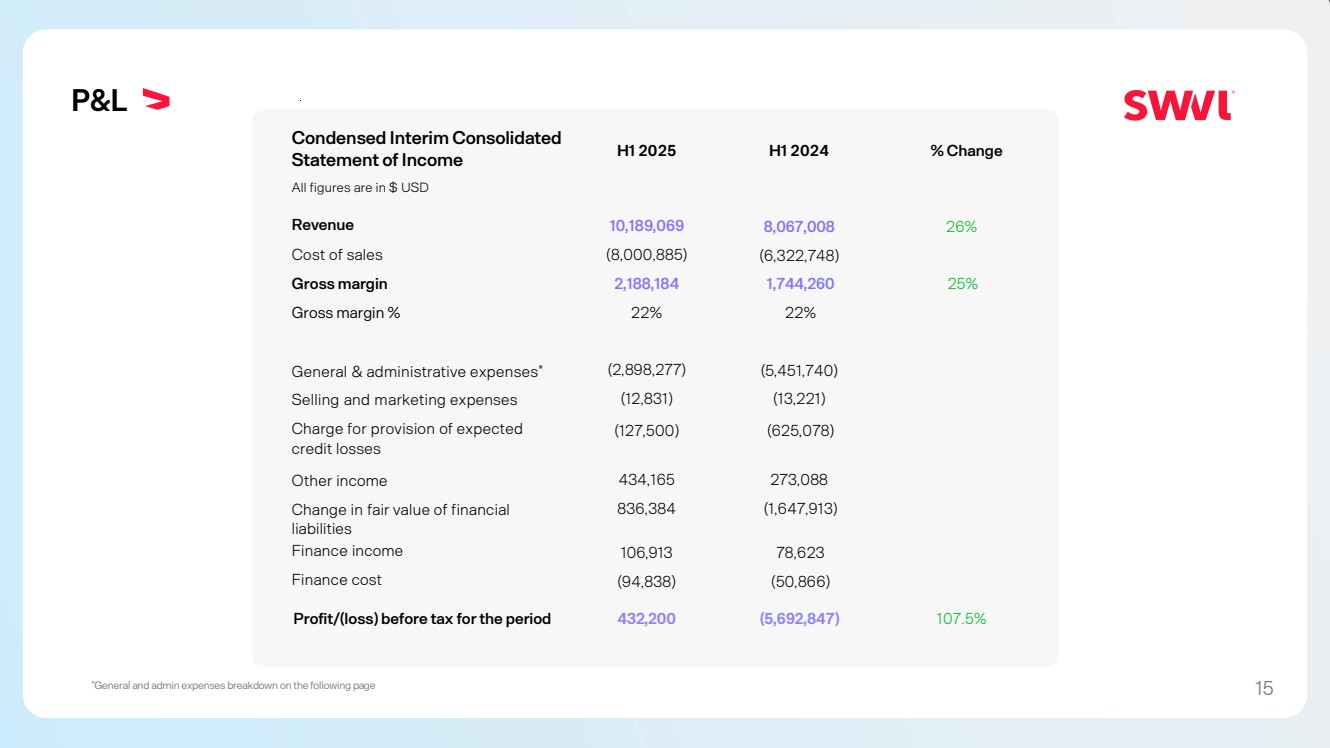
| P&L *General and admin expenses breakdown on the following page Condensed Interim Consolidated Statement of Income H1 2025 H1 2024 % Change All figures are in $ USD Revenue 10,189,069 8,067,008 26% Cost of sales (8,000,885) (6,322,748) Gross margin 2,188,184 1,744,260 25% Gross margin % 22% 22% General & administrative expenses* (2,898,277) (5,451,740) Selling and marketing expenses (12,831) (13,221) Charge for provision of expected credit losses (127,500) (625,078) Other income 434,165 273,088 Change in fair value of financial liabilities 836,384 (1,647,913) Finance income 106,913 78,623 Finance cost (94,838) (50,866) Profit/(loss) before tax forthe period 432,200 (5,692,847) 107.5% 15 |
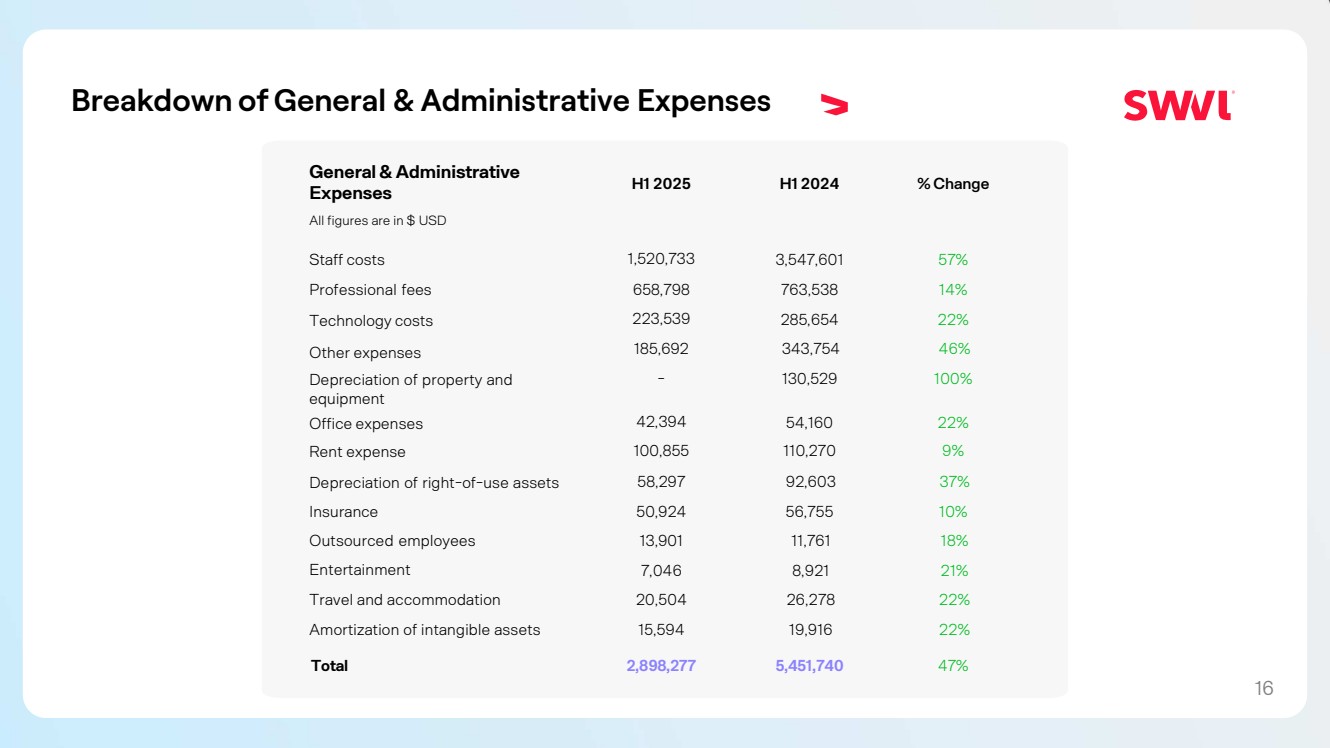
| Breakdown of General & Administrative Expenses General & Administrative Expenses H1 2025 H1 2024 % Change All figures are in $ USD Staff costs 1,520,733 3,547,601 57% Professional fees 658,798 763,538 14% Technology costs 223,539 285,654 22% Other expenses 185,692 343,754 46% Depreciation of property and equipment - 130,529 100% Office expenses 42,394 54,160 22% Rent expense 100,855 110,270 9% Depreciation of right-of-use assets 58,297 92,603 37% Insurance 50,924 56,755 10% Outsourced employees 13,901 11,761 18% Entertainment 7,046 8,921 21% Travel and accommodation 20,504 26,278 22% Amortization of intangible assets 15,594 19,916 22% Total 2,898,277 5,451,740 47% 16 |
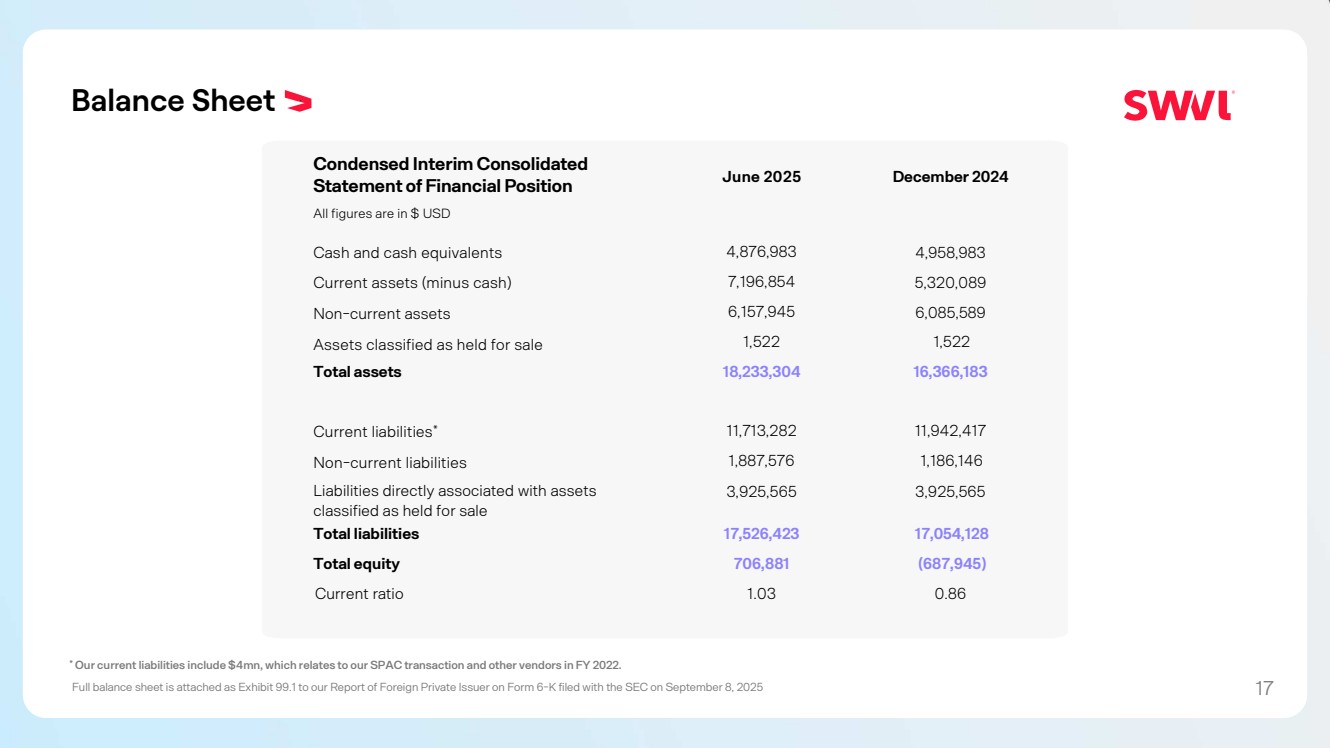
| Condensed Interim Consolidated Statement of Financial Position June 2025 December 2024 All figures are in $ USD Cash and cash equivalents 4,876,983 4,958,983 Current assets (minus cash) 7,196,854 5,320,089 Non-current assets 6,157,945 6,085,589 Assets classified as held for sale 1,522 1,522 Total assets 18,233,304 16,366,183 Current liabilities* 11,713,282 11,942,417 Non-current liabilities 1,887,576 1,186,146 Liabilities directly associated with assets classified as held for sale 3,925,565 3,925,565 Total liabilities 17,526,423 17,054,128 Total equity 706,881 (687,945) Current ratio 1.03 0.86 Balance Sheet * Our current liabilities include $4mn, which relates to our SPAC transaction and other vendors in FY 2022. Full balance sheet is attached as Exhibit 99.1 to our Report of Foreign Private Issuer on Form 6-K filed with the SEC on September 8, 2025 17 |
| Market Performance |
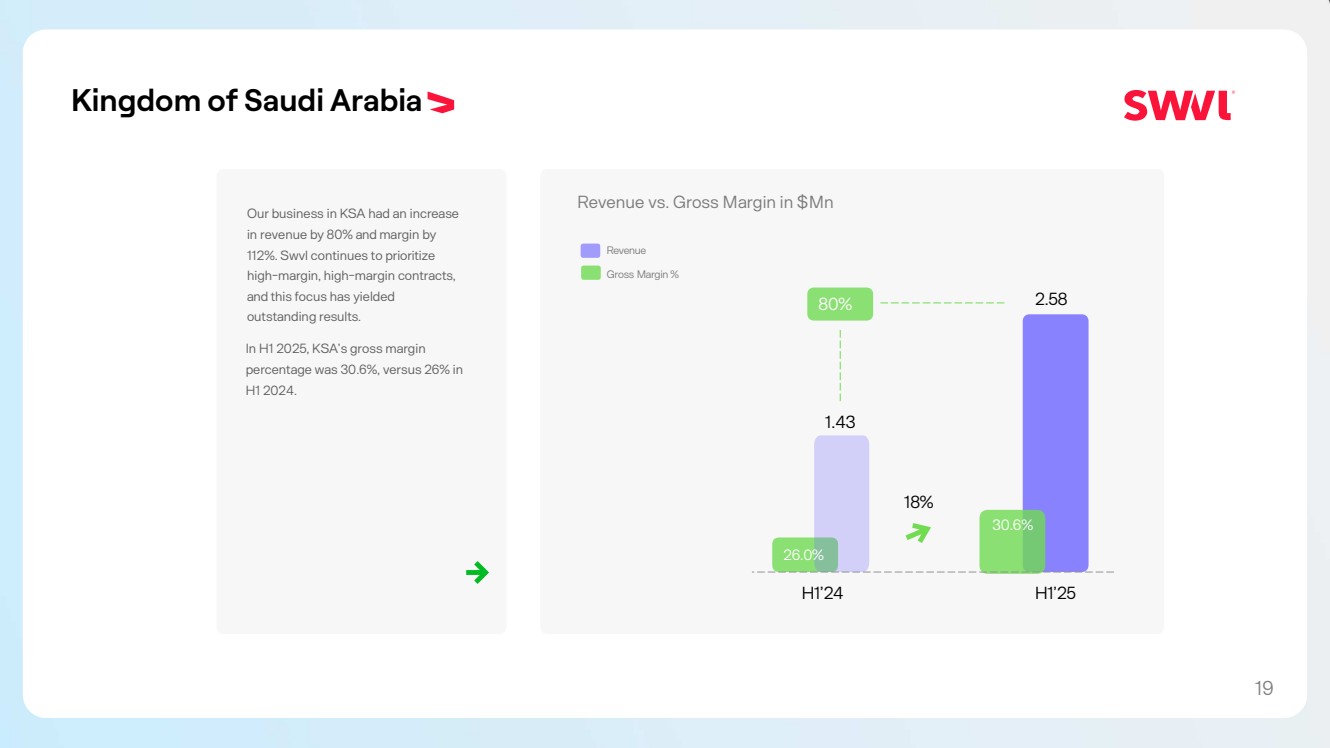
| Kingdom of Saudi Arabia Revenue vs. Gross Margin in $Mn Our business in KSA had an increase in revenue by 80% and margin by 112%. Swvl continues to prioritize high-margin, high-margin contracts, and this focus has yielded outstanding results. In H1 2025, KSA’s gross margin percentage was 30.6%, versus 26% in H1 2024. Revenue Gross Margin % 1.43 2.58 H1’24 H1’25 26.0% 30.6% 18% 80% 19 |
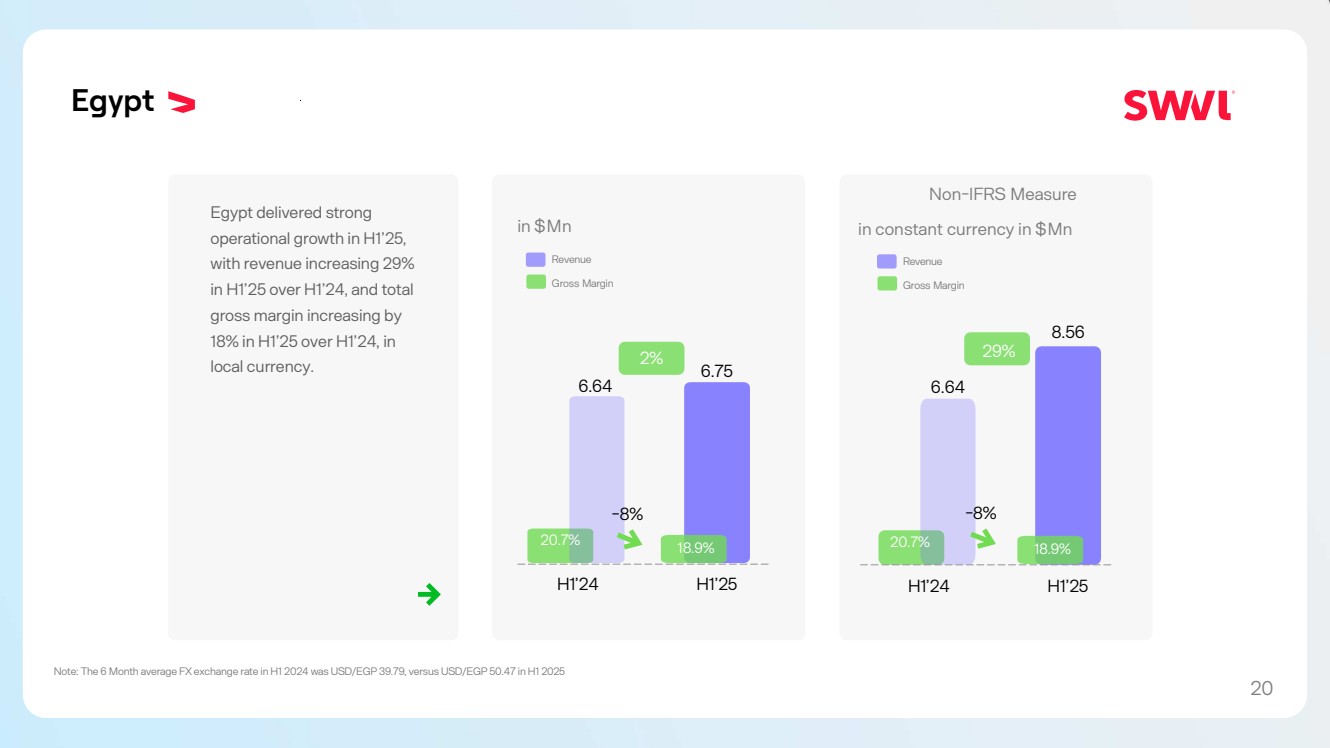
| Egypt in constant currency in $Mn Note: The 6 Month average FX exchange rate in H1 2024 was USD/EGP 39.79, versus USD/EGP 50.47 in H1 2025 6.64 8.56 H1’24 H1’25 20.7% 29% Non-IFRS Measure Revenue Gross Margin in $Mn 6.64 6.75 H1’24 H1’25 20.7% 18.9% -8% 2% Revenue Gross Margin 18.9% -8% Egypt delivered strong operational growth in H1’25, with revenue increasing 29% in H1’25 over H1’24, and total gross margin increasing by 18% in H1’25 over H1’24, in local currency. 20 |
| United Arab Emirates Newly Launched Market Our UAE launch achieved strong Revenue vs. Gross Margin Q1 2025 vs Q2 2025 in $Mn traction in H1'25, generating $0.86M in revenue. Revenue grew 79% QoQ from Q1 to Q2, while gross margin expanded 198%, reflecting both accelerating topline growth and strengthening unit economics. The UAE has also increased its gross margin percentage from 9.7% in Q1 2025 to 16.4% in Q2 2025. Revenue Gross Margin 1’25 Q2’25Q 0.31 0.55 79% 66% 9.9% 16.5% 21 |

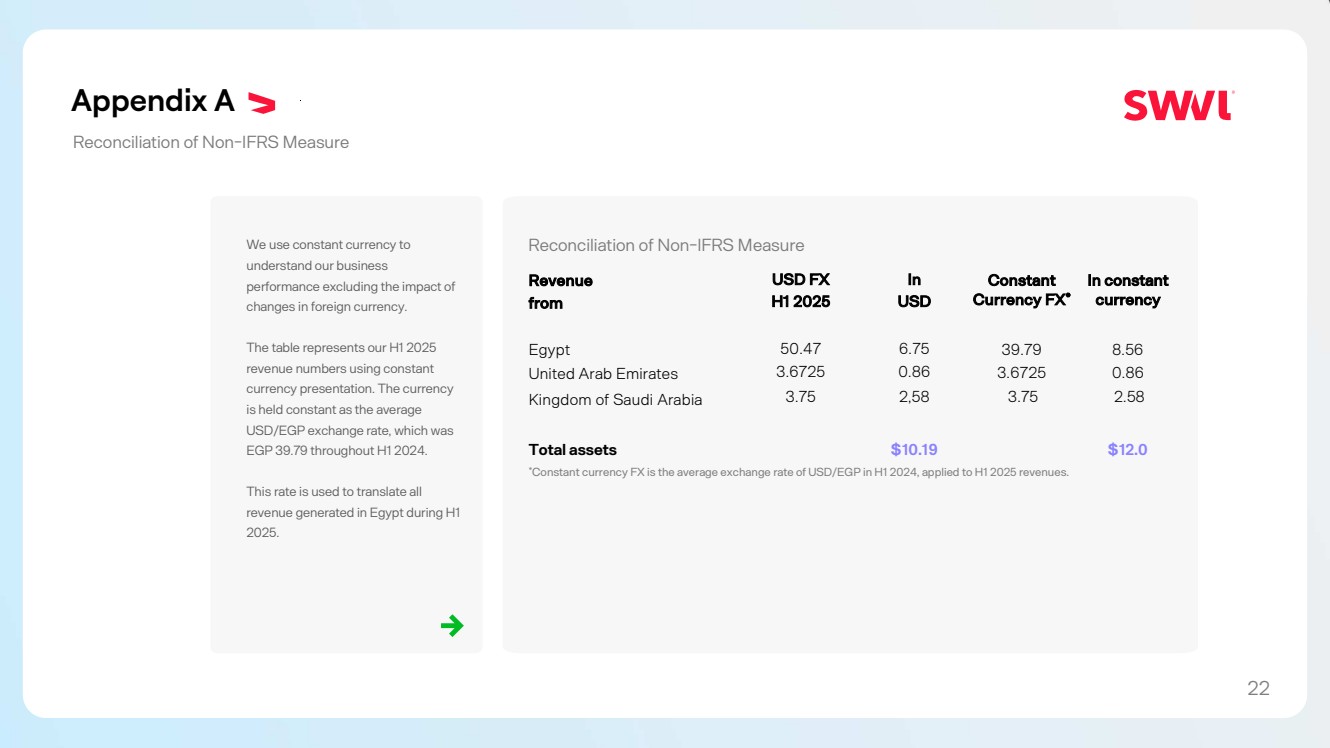
| Appendix A Reconciliation of Non-IFRS Measure We use constant currency to Reconciliation of Non-IFRS Measure understand our business performance excluding the impact of changes in foreign currency. The table represents our H1 2025 revenue numbers using constant currency presentation. The currency is held constant as the average USD/EGP exchange rate, which was EGP 39.79 throughout H1 2024. This rate is used to translate all revenue generated in Egypt during H1 2025. Revenue from USD FX H1 2025 In USD Constant Currency FX* In constant currency Egypt 50.47 6.75 39.79 8.56 United Arab Emirates 3.6725 0.86 3.6725 0.86 Kingdom of Saudi Arabia 3.75 2,58 3.75 2.58 Total assets $10.19 $12.0 *Constant currency FX is the average exchange rate of USD/EGP in H1 2024, applied to H1 2025 revenues. 22 |
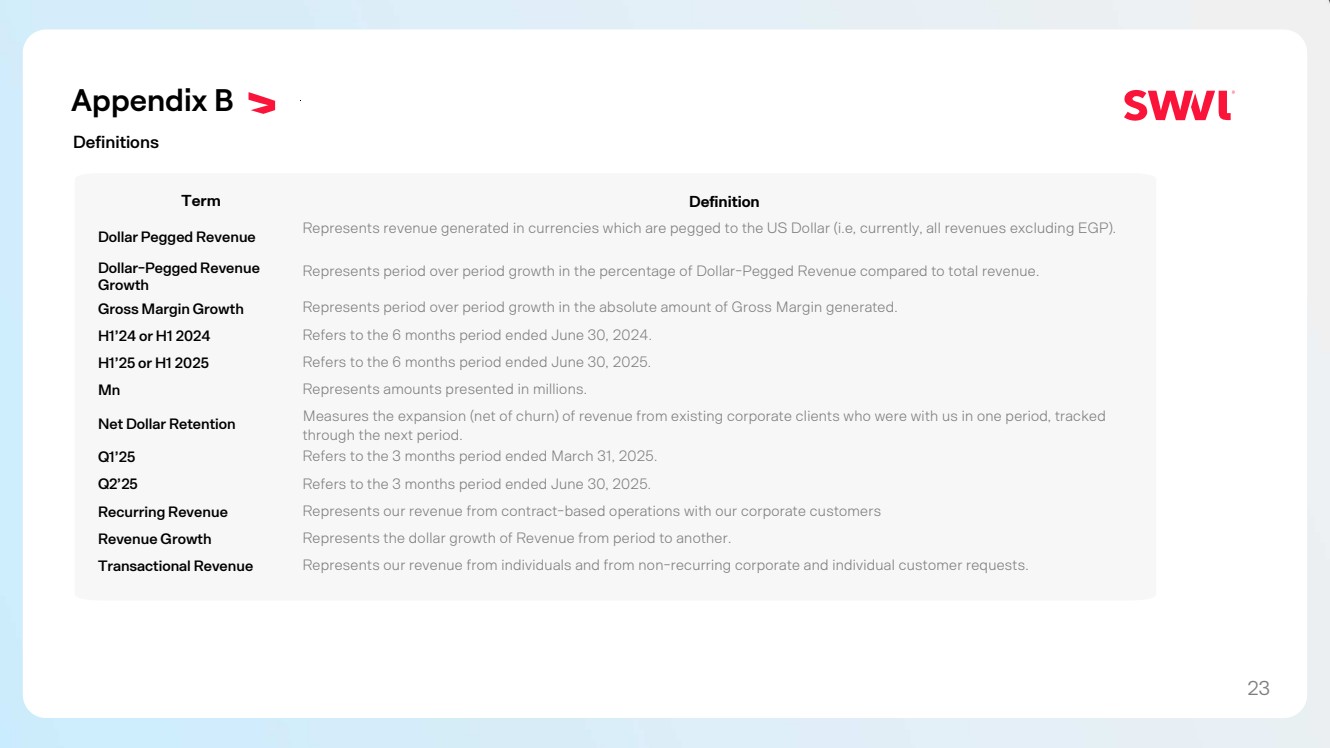
| Appendix B Definitions Term Definition Dollar Pegged Revenue Represents revenue generated in currencies which are pegged to the US Dollar (i.e, currently, all revenues excluding EGP). Dollar-Pegged Revenue Growth Represents period over period growth in the percentage of Dollar-Pegged Revenue compared to total revenue. Gross Margin Growth Represents period over period growth in the absolute amount of Gross Margin generated. H1’24 or H1 2024 Refers to the 6 months period ended June 30, 2024. H1’25 or H1 2025 Refers to the 6 months period ended June 30, 2025. Mn Represents amounts presented in millions. Net Dollar Retention Measures the expansion (net of churn) of revenue from existing corporate clients who were with us in one period, tracked through the next period. Q1’25 Refers to the 3 months period ended March 31, 2025. Q2’25 Refers to the 3 months period ended June 30, 2025. Recurring Revenue Represents our revenue from contract-based operations with our corporate customers Revenue Growth Represents the dollar growth of Revenue from period to another. Transactional Revenue Represents our revenue from individuals and from non-recurring corporate and individual customer requests. 23 |
|