Shareholder Report
Jun. 30, 2025
USD ($)
holding
| WHAT WERE THE FUND COSTS FOR THE PERIOD? (based on a hypothetical $10,000 investment) | |||||||||||
| COST OF $10,000 INVESTMENT | COST PAID AS A PERCENTAGE OF $10,000 INVESTMENT | ||||||||||
| $33 | 0.35% | ||||||||||
| WHAT FACTORS INFLUENCED PERFORMANCE FOR THE PERIOD? | |||||||||||
Growth-tilted U.S. large- and mid-cap stocks with a history of consistently growing dividends rose strongly during the reporting period, though they trailed the stronger returns of growth-tilted companies favored by investors during the period. Companies in the financials sector benefited from interest rates that remained high relative to recent years which boosted net interest income for regional banks, while insurance stocks also gained. The technology sector benefited from increased demand due to the rapid advancements in artificial intelligence (AI) technology, demand for specialized chips, and increased computing power. The health care sector detracted from returns as the changing regulatory environment impacted large pharmaceutical companies as well as companies in the managed care industry that rely heavily on government programs.
PERFORMANCE OF A HYPOTHETICAL $10,000 INVESTMENT | |||||||||||
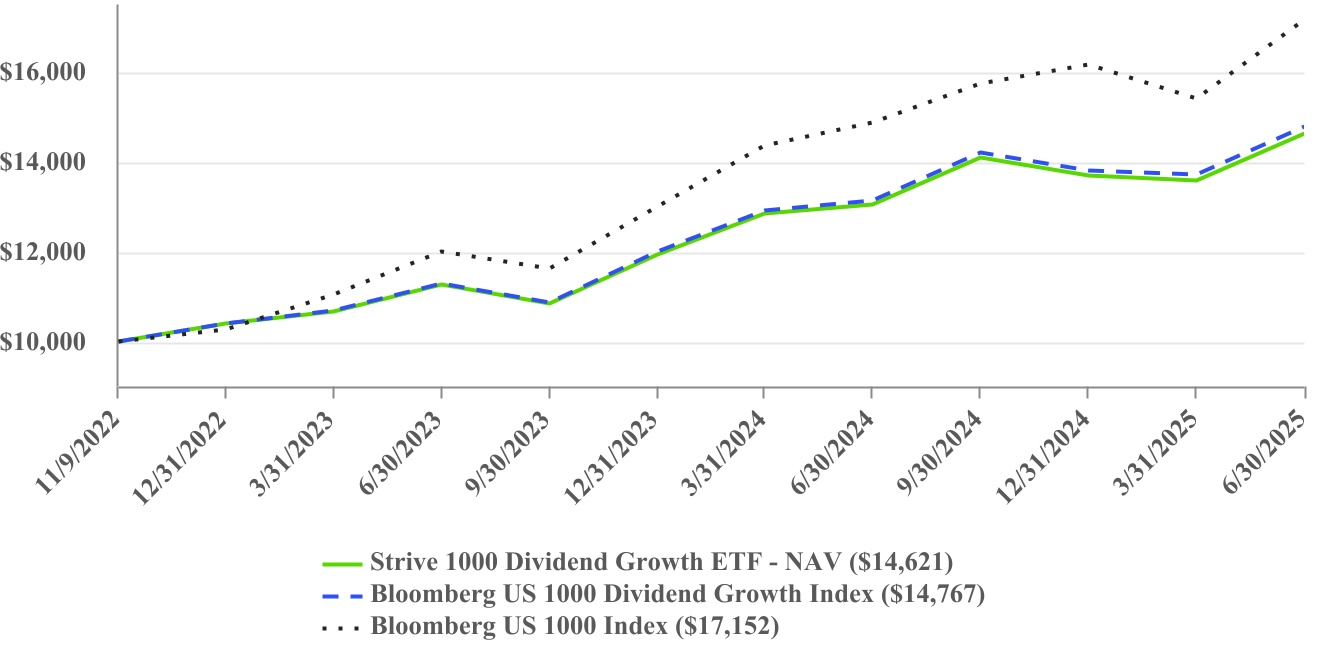
| AVERAGE ANNUAL TOTAL RETURNS | ||||||||||||||
| One Year | Since Inception (11/9/2022) | |||||||||||||
| Strive 1000 Dividend Growth ETF - NAV | 12.13% | 15.49% | ||||||||||||
| Bloomberg US 1000 Dividend Growth Index | 12.53% | 15.92% | ||||||||||||
| Bloomberg US 1000 Index | 15.45% | 22.69% | ||||||||||||
The Fund’s past performance is not a good predictor of how the Fund will perform in the future. The graph and table do not reflect the deduction of taxes that a shareholder would pay on Fund distributions or redemption of Fund shares. Visit www.strivefunds.com/stxd for more recent performance information. | ||||||||||||||
| SECTOR WEIGHTING (as a % of Net Assets) | |||||
| Information Technology | 25.4% | ||||
| Financials | 25.2% | ||||
| Health Care | 14.7% | ||||
| Industrials | 14.0% | ||||
| Consumer Staples | 7.1% | ||||
| Consumer Discretionary | 6.6% | ||||
| Materials | 3.0% | ||||
| Real Estate | 2.2% | ||||
| Utilities | 1.6% | ||||
| Energy | 0.1% | ||||
| Cash and Cash Equivalents | 0.1% | ||||
| TOP 10 HOLDINGS (as a % of Net Assets) | |||||
| Broadcom, Inc. | 6.9% | ||||
| Microsoft Corp. | 6.0% | ||||
| JPMorgan Chase & Co. | 4.8% | ||||
| Eli Lilly & Co. | 4.0% | ||||
| Visa, Inc. - Class A | 3.7% | ||||
| Mastercard, Inc. - Class A | 2.7% | ||||
| Costco Wholesale Corp. | 2.6% | ||||
| Procter & Gamble Co. | 2.2% | ||||
| Home Depot, Inc. | 2.2% | ||||
| Oracle Corp. | 2.1% | ||||
Material Fund Changes
This is a summary of certain changes to the Fund since August 1, 2024. Effective February 1, 2025, the Fund’s fiscal year end changed from July 31 to June 30. For more complete information, you may review the Fund’s next prospectus, which we expect to be available by October 31, 2025 at www.strivefunds.com/stxd or by calling (215) 330-4476.
| WHAT WERE THE FUND COSTS FOR THE PERIOD? (based on a hypothetical $10,000 investment) | |||||||||||
| COST OF $10,000 INVESTMENT | COST PAID AS A PERCENTAGE OF $10,000 INVESTMENT | ||||||||||
| $18 | 0.18% | ||||||||||
| WHAT FACTORS INFLUENCED PERFORMANCE FOR THE PERIOD? | |||||||||||
Growth-tilted U.S. large- and mid-cap stocks rose strongly during the reporting period. Companies in the technology sector, particularly those in the semiconductor industry, benefited from increased demand due to the rapid advancements in artificial intelligence (AI) technology, demand for specialized chips, and increased computing power. In the communication sector, media and entertainment stocks contributed, as the industry realized benefits of AI for advertising. The energy and health care sectors detracted modestly during the period.
PERFORMANCE OF A HYPOTHETICAL $10,000 INVESTMENT | |||||||||||
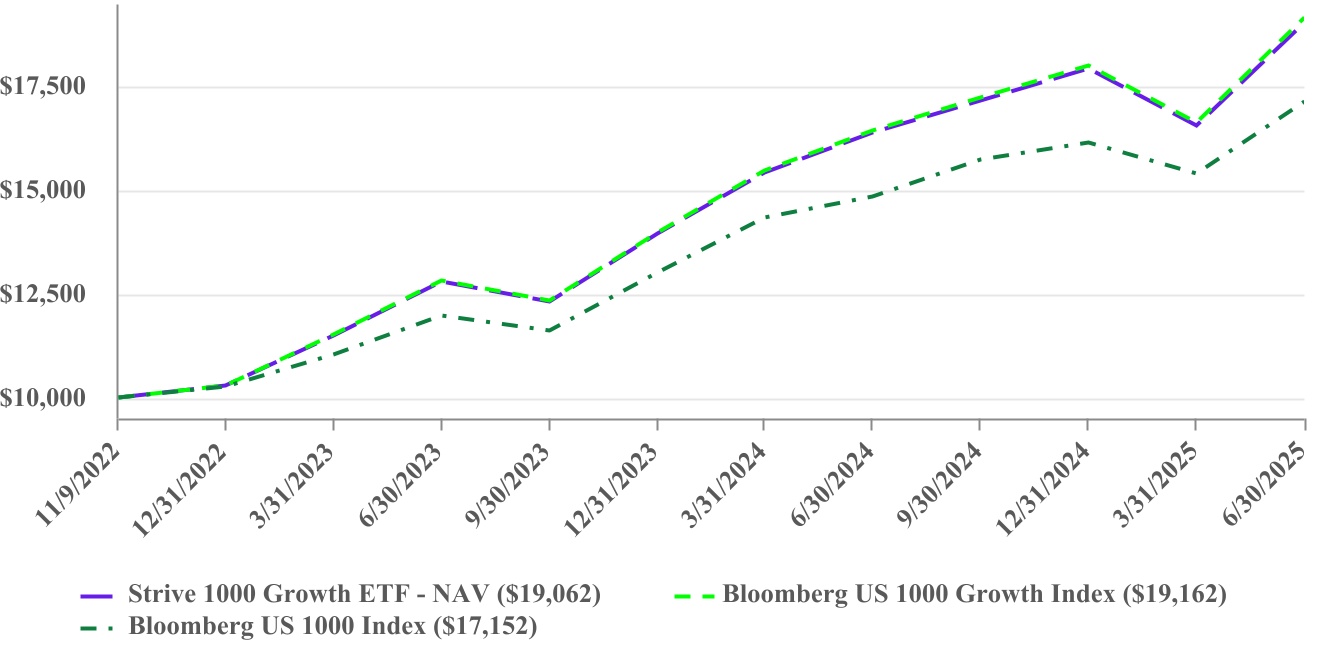
| AVERAGE ANNUAL TOTAL RETURNS | ||||||||||||||
| One Year | Since Inception (11/9/2022) | |||||||||||||
| Strive 1000 Growth ETF - NAV | 16.26% | 27.70% | ||||||||||||
| Bloomberg US 1000 Growth Index | 16.50% | 27.95% | ||||||||||||
| Bloomberg US 1000 Index | 15.45% | 22.69% | ||||||||||||
The Fund’s past performance is not a good predictor of how the Fund will perform in the future. The graph and table do not reflect the deduction of taxes that a shareholder would pay on Fund distributions or redemption of Fund shares. Visit www.strivefunds.com/stxg for more recent performance information. | ||||||||||||||
| SECTOR WEIGHTING (as a % of Net Assets) | |||||
| Information Technology | 40.7% | ||||
| Consumer Discretionary | 12.2% | ||||
| Communication Services | 11.3% | ||||
| Financials | 10.7% | ||||
| Industrials | 9.5% | ||||
| Health Care | 7.4% | ||||
| Consumer Staples | 3.8% | ||||
| Real Estate | 1.5% | ||||
| Materials | 1.5% | ||||
| Utilities | 0.6% | ||||
| Energy | 0.5% | ||||
| Cash and Cash Equivalents | 0.3% | ||||
| TOP 10 HOLDINGS (as a % of Net Assets) | |||||
NVIDIA Corp. | 9.0% | ||||
| Microsoft Corp. | 8.9% | ||||
| Apple, Inc. | 7.3% | ||||
| Amazon.com, Inc. | 5.1% | ||||
| Meta Platforms, Inc. - Class A | 3.9% | ||||
| Broadcom, Inc. | 3.1% | ||||
| Alphabet, Inc. - Class A | 2.5% | ||||
| Tesla, Inc. | 2.2% | ||||
| Alphabet, Inc. - Class C | 2.0% | ||||
| Eli Lilly & Co. | 1.6% | ||||
Material Fund Changes
This is a summary of certain changes to the Fund since August 1, 2024. Effective February 1, 2025, the Fund’s fiscal year end changed from July 31 to June 30. For more complete information, you may review the Fund’s next prospectus, which we expect to be available by October 31, 2025 at www.strivefunds.com/stxg or by calling (215) 330-4476.
| WHAT WERE THE FUND COSTS FOR THE PERIOD? (based on a hypothetical $10,000 investment) | |||||||||||
| COST OF $10,000 INVESTMENT | COST PAID AS A PERCENTAGE OF $10,000 INVESTMENT | ||||||||||
| $17 | 0.18% | ||||||||||
| WHAT FACTORS INFLUENCED PERFORMANCE FOR THE PERIOD? | |||||||||||
Value tilted U.S. large- and mid-cap stocks rose strongly during the reporting period though value-tilted stocks trailed the stronger returns of growth-tilted companies favored by investors during the period. Companies in the financials sector benefited from interest rates that remained high relative to recent years, which boosted net interest income. The energy sector was also a notable detractor amid the expected production increase amid slowing energy demand in major economies. Both the consumer discretionary and materials sectors struggled with trade uncertainty and the impacts of tariffs.
PERFORMANCE OF A HYPOTHETICAL $10,000 INVESTMENT | |||||||||||
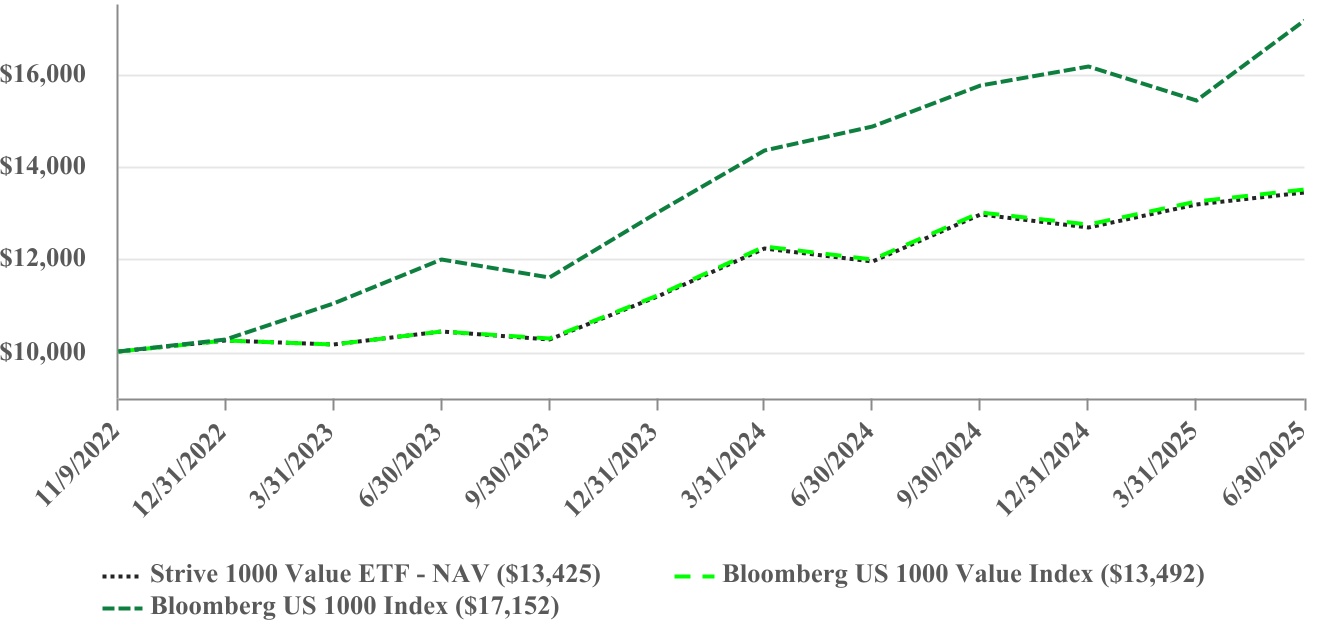
| AVERAGE ANNUAL TOTAL RETURNS | ||||||||||||||
| One Year | Since Inception (11/9/2022) | |||||||||||||
| Strive 1000 Value ETF - NAV | 12.41% | 11.81% | ||||||||||||
| Bloomberg US 1000 Value Index | 12.60% | 12.02% | ||||||||||||
| Bloomberg US 1000 Index | 15.45% | 22.69% | ||||||||||||
The Fund’s past performance is not a good predictor of how the Fund will perform in the future. The graph and table do not reflect the deduction of taxes that a shareholder would pay on Fund distributions or redemption of Fund shares. Visit www.strivefunds.com/stxv for more recent performance information. | ||||||||||||||
| SECTOR WEIGHTING (as a % of Net Assets) | |||||
| Financials | 22.5% | ||||
| Health Care | 14.6% | ||||
| Energy | 9.9% | ||||
| Consumer Staples | 9.5% | ||||
| Industrials | 9.2% | ||||
| Information Technology | 8.4% | ||||
| Utilities | 6.9% | ||||
| Consumer Discretionary | 5.8% | ||||
| Communication Services | 5.2% | ||||
| Real Estate | 4.1% | ||||
| Materials | 3.7% | ||||
| Cash and Cash Equivalents | 0.2% | ||||
| TOP 10 HOLDINGS (as a % of Net Assets) | |||||
| JPMorgan Chase & Co. | 3.2% | ||||
| Exxon Mobil Corp. | 3.0% | ||||
| Johnson & Johnson | 2.4% | ||||
| Bank of America Corp. | 2.0% | ||||
| Philip Morris International, Inc. | 1.6% | ||||
| International Business Machines Corp. | 1.5% | ||||
| Chevron Corp. | 1.5% | ||||
| AT&T, Inc. | 1.4% | ||||
| Wells Fargo & Co. | 1.3% | ||||
| Verizon Communications, Inc. | 1.1% | ||||
Material Fund Changes
This is a summary of certain changes to the Fund since August 1, 2024. Effective February 1, 2025, the Fund’s fiscal year end changed from July 31 to June 30. For more complete information, you may review the Fund’s next prospectus, which we expect to be available by October 31, 2025 at www.strivefunds.com/stxv or by calling (215) 330-4476.
| WHAT WERE THE FUND COSTS FOR THE PERIOD? (based on a hypothetical $10,000 investment) | |||||||||||
| COST OF $10,000 INVESTMENT | COST PAID AS A PERCENTAGE OF $10,000 INVESTMENT | ||||||||||
| $5 | 0.05% | ||||||||||
| WHAT FACTORS INFLUENCED PERFORMANCE FOR THE PERIOD? | |||||||||||
U.S. large-cap stocks rose strongly during the reporting period. The technology sector benefited from increased demand due to the rapid advancements in artificial intelligence (AI) technology, demand for specialized chips, and increased computing power. Companies in the financials sector benefited from interest rates that remain high relative to recent years which boosted net interest income. In the communication sector, media and entertainment stocks contributed, as the industry realized benefits of AI for advertising. The energy and health care sectors detracted modestly during the period.
PERFORMANCE OF A HYPOTHETICAL $10,000 INVESTMENT | |||||||||||
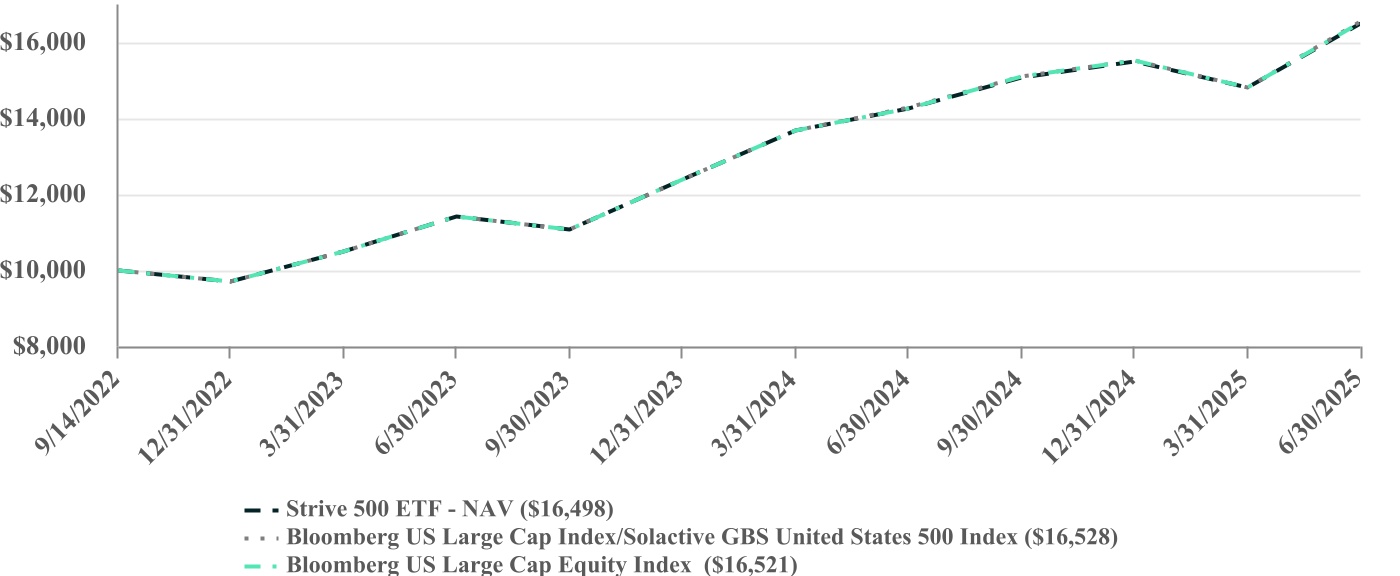
| AVERAGE ANNUAL TOTAL RETURNS | ||||||||||||||
| One Year | Since Inception (9/14/2022) | |||||||||||||
| Strive 500 ETF - NAV | 15.76% | 19.64% | ||||||||||||
Bloomberg 500 Index/Solactive GBS United States 500 Index | 15.85% | 19.72% | ||||||||||||
Bloomberg 500 Index | 15.85% | 19.70% | ||||||||||||
The Fund’s past performance is not a good predictor of how the Fund will perform in the future. The graph and table do not reflect the deduction of taxes that a shareholder would pay on Fund distributions or redemption of Fund shares. Effective January 26, 2024, the Fund’s investment strategy changed to track the investment results of the Bloomberg US Large Cap Index. Prior to January 26, 2024, the Fund’s investment strategy was to track the investment results of the Solactive GBS United States 500 Index. Performance shown for the Bloomberg 500 Index/Solactive GBS United States 500 Index for the period prior to January 26, 2024 is that of the Solactive GBS United States 500 Index and for the period beginning January 26, 2024 is that of the Bloomberg US Large Cap Index. Visit www.strivefunds.com/strv for more recent performance information. | ||||||||||||||
| SECTOR WEIGHTING (as a % of Net Assets) | |||||
| Information Technology | 33.4% | ||||
| Financials | 13.8% | ||||
| Consumer Discretionary | 10.3% | ||||
| Communication Services | 10.1% | ||||
| Health Care | 9.4% | ||||
| Industrials | 8.6% | ||||
| Consumer Staples | 5.3% | ||||
| Energy | 3.0% | ||||
| Utilities | 2.2% | ||||
| Real Estate | 2.0% | ||||
| Materials | 1.8% | ||||
| Cash & Cash Equivalents | 0.1% | ||||
| TOP 10 HOLDINGS (as a % of Net Assets) | |||||
NVIDIA Corp. | 7.0% | ||||
| Microsoft Corp. | 7.0% | ||||
| Apple, Inc. | 5.7% | ||||
| Amazon.com, Inc. | 4.0% | ||||
| Meta Platforms, Inc. - Class A | 3.1% | ||||
| Broadcom, Inc. | 2.4% | ||||
| Alphabet, Inc. - Class A | 1.9% | ||||
| Tesla, Inc. | 1.7% | ||||
| Alphabet, Inc. - Class C | 1.6% | ||||
| JPMorgan Chase & Co. | 1.5% | ||||
Material Fund Changes
This is a summary of certain changes to the Fund since August 1, 2024. Effective February 1, 2025, the Fund’s fiscal year end changed from July 31 to June 30. For more complete information, you may review the Fund’s next prospectus, which we expect to be available by October 31, 2025 at www.strivefunds.com/strv or by calling (215) 330-4476.
| WHAT WERE THE FUND COSTS FOR THE PERIOD? (based on a hypothetical $10,000 investment) | |||||||||||
| COST OF $10,000 INVESTMENT | COST PAID AS A PERCENTAGE OF $10,000 INVESTMENT | ||||||||||
| $30 | 0.32% | ||||||||||
| WHAT FACTORS INFLUENCED PERFORMANCE FOR THE PERIOD? | |||||||||||
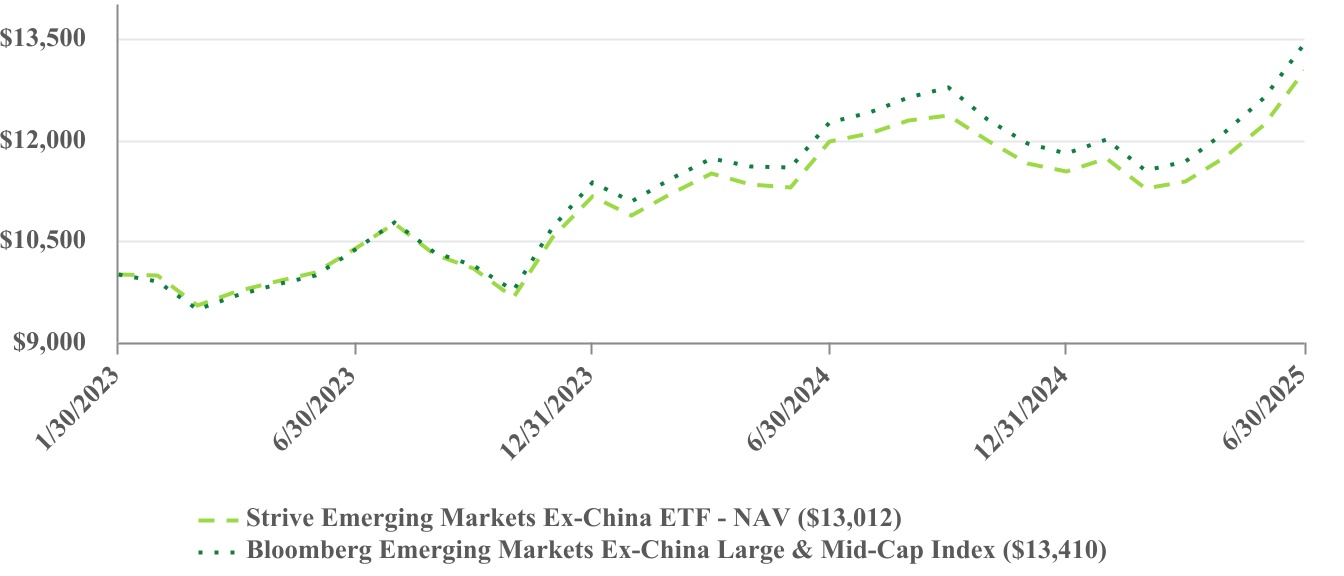
Stocks in the emerging market countries, excluding China, increased during the reporting period, led by equity returns in Taiwan and South Africa. Taiwanese equities were driven primarily by the technology sector, while returns in South Africa were distributed broadly across the sectors represented in the portfolio. South Korean technology detracted as did Indonesian financials. Equities in Chile and Turkey also detracted slightly from total returns.
| PERFORMANCE OF A HYPOTHETICAL $10,000 INVESTMENT | |||||||||||
| AVERAGE ANNUAL TOTAL RETURNS | ||||||||||||||
| One Year | Since Inception (1/30/2023) | |||||||||||||
| Strive Emerging Markets Ex-China ETF - NAV | 8.72% | 11.53% | ||||||||||||
| Bloomberg Emerging Markets Ex-China Large & Mid-Cap Index | 9.53% | 12.93% | ||||||||||||
The Fund’s past performance is not a good predictor of how the Fund will perform in the future. The graph and table do not reflect the deduction of taxes that a shareholder would pay on Fund distributions or redemption of Fund shares. Visit www.strivefunds.com/stxe for more recent performance information. | ||||||||||||||
| SECTOR WEIGHTING (as a % of Net Assets) | |||||
| Financials | 30.4% | ||||
| Information Technology | 29.8% | ||||
| Materials | 6.9% | ||||
| Industrials | 5.8% | ||||
| Consumer Discretionary | 5.4% | ||||
| Energy | 5.4% | ||||
| Communication Services | 5.4% | ||||
| Consumer Staples | 4.8% | ||||
| Utilities | 2.8% | ||||
| Health Care | 2.6% | ||||
| Real Estate | 0.7% | ||||
| TOP 10 COUNTRY WEIGHTING (as a % of Net Assets) | |||||
| India | 29.8% | ||||
| Taiwan | 22.6% | ||||
| South Korea | 14.2% | ||||
| Saudi Arabia | 7.1% | ||||
| Brazil | 5.9% | ||||
| South Africa | 4.2% | ||||
| Mexico | 3.3% | ||||
| United Arab Emirates | 2.1% | ||||
| Indonesia | 1.9% | ||||
| Thailand | 1.8% | ||||
Material Fund Changes
This is a summary of certain changes to the Fund since August 1, 2024. Effective February 1, 2025, the Fund’s fiscal year end changed from July 31 to June 30. For more complete information, you may review the Fund’s next prospectus, which we expect to be available by October 31, 2025 at www.strivefunds.com/stxe or by calling (215) 330-4476.
| WHAT WERE THE FUND COSTS FOR THE PERIOD? (based on a hypothetical $10,000 investment) | |||||||||||
| COST OF $10,000 INVESTMENT | COST PAID AS A PERCENTAGE OF $10,000 INVESTMENT | ||||||||||
| $23 | 0.25% | ||||||||||
| WHAT FACTORS INFLUENCED PERFORMANCE FOR THE PERIOD? | |||||||||||
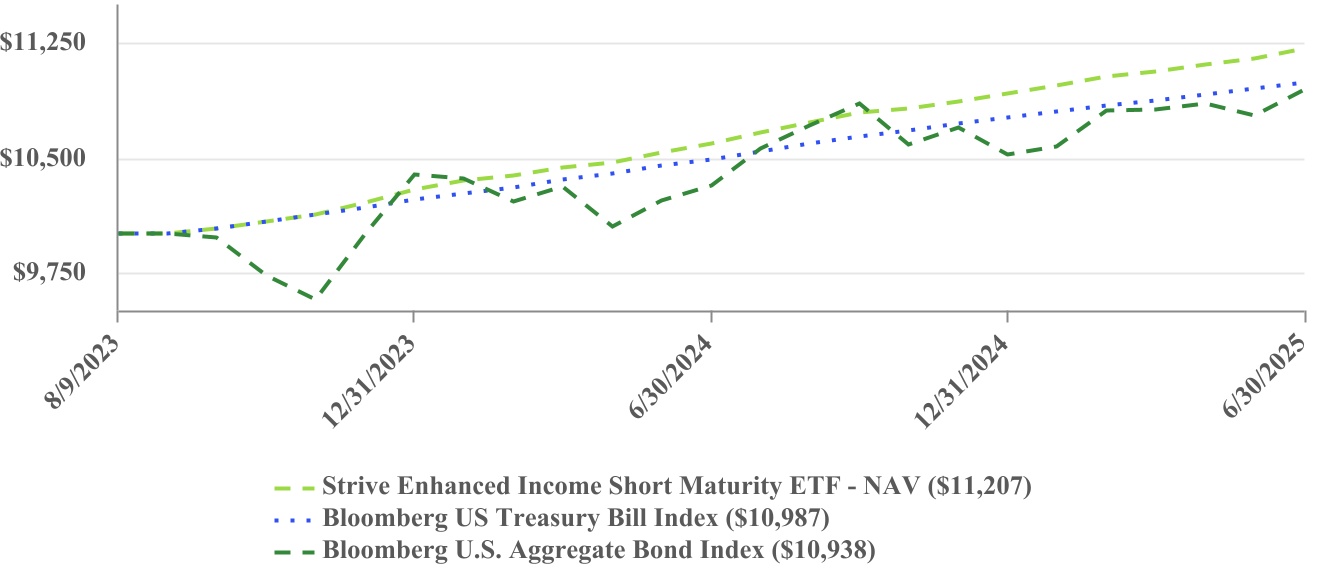
The Fund provides exposure to short-term investment grade assets in structured credit and investment grade corporate sectors to provide durable enhanced yield and outperformance over a full market cycle. The Fund’s return was positively impacted by interest rates declining over the period.
The Fund’s allocations to asset-backed securities (ABS), investment-grade corporate bonds, and agency commercial mortgage-backed securities were the most significant drivers of positive performance, while exposure to collateralized loan obligations (CLOs), non-agency residential mortgage-backed securities, and Treasuries were smaller positive contributions to overall performance. ABS was the most significant contributor to positive performance, specifically with income generation coming from an overweight to short-duration consumer and auto credits that benefited from the attractive higher yields on the front end of the yield curve. The Fund’s higher yield profile, duration, and tighter spreads all contributed to relative outperformance versus the benchmark. The Fund’s allocations to Treasuries and CLOs led to less relative outperformance versus other fixed income sectors like securitized credit that had higher total returns during the period.
PERFORMANCE OF A HYPOTHETICAL $10,000 INVESTMENT | |||||||||||
| AVERAGE ANNUAL TOTAL RETURNS | ||||||||||||||
| One Year | Since Inception (8/9/2023) | |||||||||||||
| Strive Enhanced Income Short Maturity ETF - NAV | 5.84% | 6.20% | ||||||||||||
| Bloomberg US Treasury Bill Index | 4.77% | 5.10% | ||||||||||||
| Bloomberg U.S. Aggregate Bond Index | 6.08% | 4.85% | ||||||||||||
The Fund’s past performance is not a good predictor of how the Fund will perform in the future. The graph and table do not reflect the deduction of taxes that a shareholder would pay on Fund distributions or redemption of Fund shares. Visit www.strivefunds.com/buxx for more recent performance information. | ||||||||||||||
| INVESTMENT WEIGHTING (as a % of Net Assets) | |||||
| Asset-Backed Securities | 28.4% | ||||
| Corporate Bonds | 26.4% | ||||
| Collateralized Mortgage Obligations | 18.9% | ||||
| Collateralized Loan Obligations | 15.5% | ||||
Cash and Cash Equivalents | 5.0% | ||||
| Mortgage-Backed Securities | 3.0% | ||||
| U.S. Treasury Bills | 2.8% | ||||
Material Fund Changes
This is a summary of certain changes to the Fund since August 1, 2024. Effective February 1, 2025, the Fund’s fiscal year end changed from July 31 to June 30. For more complete information, you may review the Fund’s next prospectus, which we expect to be available by October 31, 2025 at www.strivefunds.com/buxx or by calling (215) 330-4476.
| WHAT WERE THE FUND COSTS FOR THE PERIOD? (based on a hypothetical $10,000 investment) | |||||||||||
| COST OF $10,000 INVESTMENT | COST PAID AS A PERCENTAGE OF $10,000 INVESTMENT | ||||||||||
| $28 | 0.29% | ||||||||||
| WHAT FACTORS INFLUENCED PERFORMANCE FOR THE PERIOD? | |||||||||||
PERFORMANCE OF A HYPOTHETICAL $10,000 INVESTMENT | |||||||||||
CUMULATIVE TOTAL RETURNS | ||||||||||||||
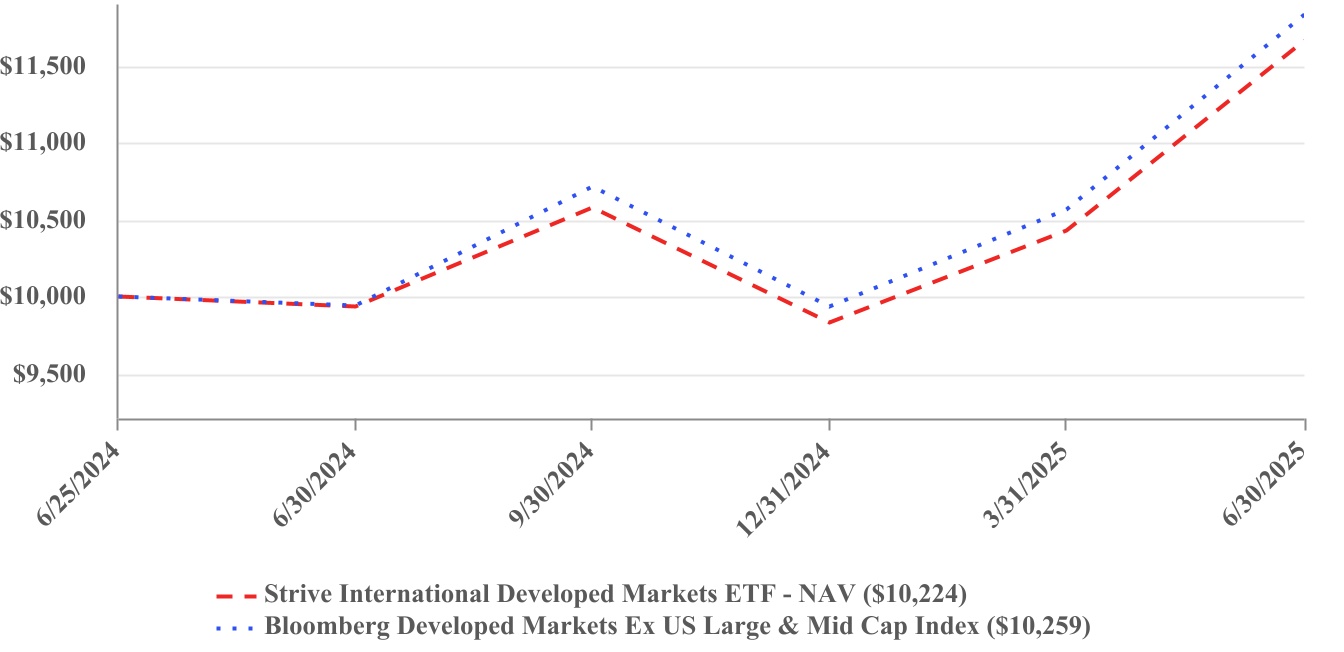
| One Year | Since Inception (6/25/2024) | |||||||||||||
| Strive International Developed Markets ETF - NAV | 17.40% | 16.36% | ||||||||||||
| Bloomberg Developed Markets Ex US Large & Mid Cap Index | 18.99% | 18.06% | ||||||||||||
The Fund’s past performance is not a good predictor of how the Fund will perform in the future. The graph and table do not reflect the deduction of taxes that a shareholder would pay on Fund distributions or redemption of Fund shares. Visit www.strivefunds.com/stxi for more recent performance information. | ||||||||||||||
| SECTOR WEIGHTING (as a % of Net Assets) | |||||
| Financials | 28.9% | ||||
| Industrials | 17.7% | ||||
| Health Care | 10.5% | ||||
| Consumer Discretionary | 8.5% | ||||
| Information Technology | 8.9% | ||||
| Consumer Staples | 7.0% | ||||
| Materials | 5.7% | ||||
| Energy | 4.7% | ||||
| Communication Services | 3.9% | ||||
| Utilities | 3.1% | ||||
| Real Estate | 0.6% | ||||
| Cash and Cash Equivalents | 0.5% | ||||
| TOP 10 COUNTRY WEIGHTING (as a % of Net Assets) | |||||
| Japan | 17.5% | ||||
| United Kingdom | 14.0% | ||||
| Canada | 11.9% | ||||
| France | 11.7% | ||||
| Germany | 10.2% | ||||
| Switzerland | 9.5% | ||||
| Australia | 5.7% | ||||
| Netherlands | 4.4% | ||||
| Spain | 2.9% | ||||
| Italy | 2.7% | ||||
Material Fund Changes
This is a summary of certain changes to the Fund since August 1, 2024. Effective February 1, 2025, the Fund’s fiscal year end changed from July 31 to June 30. For more complete information, you may review the Fund’s next prospectus, which we expect to be available by October 31, 2025 at www.strivefunds.com/stxi or by calling (215) 330-4476.
| WHAT WERE THE FUND COSTS FOR THE PERIOD? (based on a hypothetical $10,000 investment) | |||||||||||
| COST OF $10,000 INVESTMENT | COST PAID AS A PERCENTAGE OF $10,000 INVESTMENT | ||||||||||
| $17 | 0.18% | ||||||||||
| WHAT FACTORS INFLUENCED PERFORMANCE FOR THE PERIOD? | |||||||||||
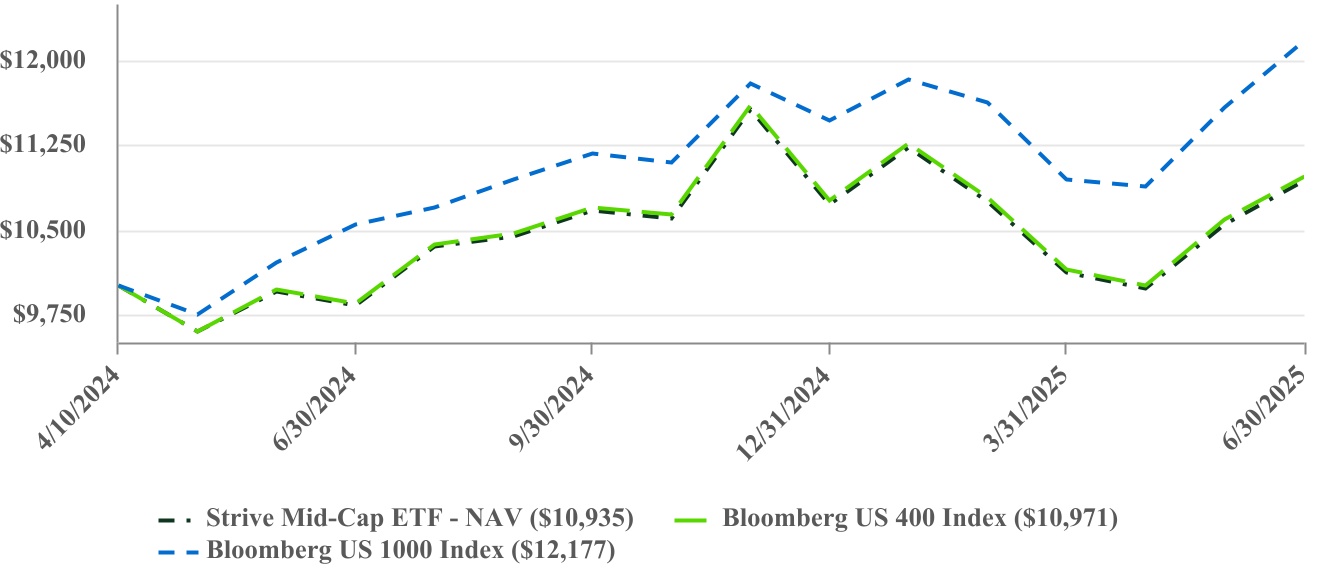
U.S. Mid Cap stocks rose strongly during the reporting period. Companies in the financials sector benefited from interest rates that remained high relative to recent years which boosted net interest income for regional banks, while insurance stocks also gained. The technology sector benefited from increased demand due to the rapid advancements in artificial intelligence (AI) technology, demand for specialized chips, and increased computing power. The energy and health care sectors detracted modestly during the period.
PERFORMANCE OF A HYPOTHETICAL $10,000 INVESTMENT | |||||||||||
CUMULATIVE TOTAL RETURNS | ||||||||||||||
| One Year | Since Inception (4/10/2024) | |||||||||||||
| Strive Mid-Cap ETF - NAV | 11.29% | 7.59% | ||||||||||||
| Bloomberg US 400 Index | 11.43% | 7.88% | ||||||||||||
| Bloomberg US 1000 Index | 15.45% | 17.49% | ||||||||||||
The Fund’s past performance is not a good predictor of how the Fund will perform in the future. The graph and table do not reflect the deduction of taxes that a shareholder would pay on Fund distributions or redemption of Fund shares. Visit www.strivefunds.com/stxm for more recent performance information. | ||||||||||||||
KEY FUND STATISTICS (as of Period End) | ||||||||||||||||||||
Net Assets | $17,154,117 | Portfolio Turnover Rate* | 24% | |||||||||||||||||
| # of Portfolio Holdings | 391 | Advisory Fees Paid | $24,124 | |||||||||||||||||
| *Portfolio turnover is not annualized and is calculated without regard to short-term securities having a maturity of less than one year. Excludes impact of in-kind transactions. | ||||||||||||||||||||
| SECTOR WEIGHTING (as a % of Net Assets) | |||||
| Industrials | 22.2% | ||||
| Financials | 15.8% | ||||
| Information Technology | 13.8% | ||||
| Consumer Discretionary | 12.9% | ||||
| Health Care | 9.1% | ||||
| Real Estate | 6.8% | ||||
| Consumer Staples | 5.5% | ||||
| Materials | 5.4% | ||||
| Utilities | 3.1% | ||||
| Energy | 2.7% | ||||
| Communication Services | 2.5% | ||||
| Cash & Cash Equivalents | 0.2% | ||||
| TOP 10 HOLDINGS (as a % of Net Assets) | |||||
| NRG Energy, Inc. | 0.9% | ||||
| International Paper Co. | 0.7% | ||||
| EMCOR Group, Inc. | 0.7% | ||||
| Jabil, Inc. | 0.6% | ||||
| AerCap Holdings NV | 0.6% | ||||
| CyberArk Software Ltd. | 0.6% | ||||
| Nutanix, Inc. - Class A | 0.6% | ||||
| Guidewire Software, Inc. | 0.6% | ||||
| Casey's General Stores, Inc. | 0.6% | ||||
| Flex Ltd. | 0.5% | ||||
Material Fund Changes
This is a summary of certain changes to the Fund since August 1, 2024. Effective February 1, 2025, the Fund’s fiscal year end changed from July 31 to June 30. For more complete information, you may review the Fund’s next prospectus, which we expect to be available by October 31, 2025 at www.strivefunds.com/stxm or by calling (215) 330-4476.
| WHAT WERE THE FUND COSTS FOR THE PERIOD? (based on a hypothetical $10,000 investment) | |||||||||||
| COST OF $10,000 INVESTMENT | COST PAID AS A PERCENTAGE OF $10,000 INVESTMENT | ||||||||||
| $50 | 0.49% | ||||||||||
| WHAT FACTORS INFLUENCED PERFORMANCE FOR THE PERIOD? | |||||||||||
PERFORMANCE OF A HYPOTHETICAL $10,000 INVESTMENT | |||||||||||
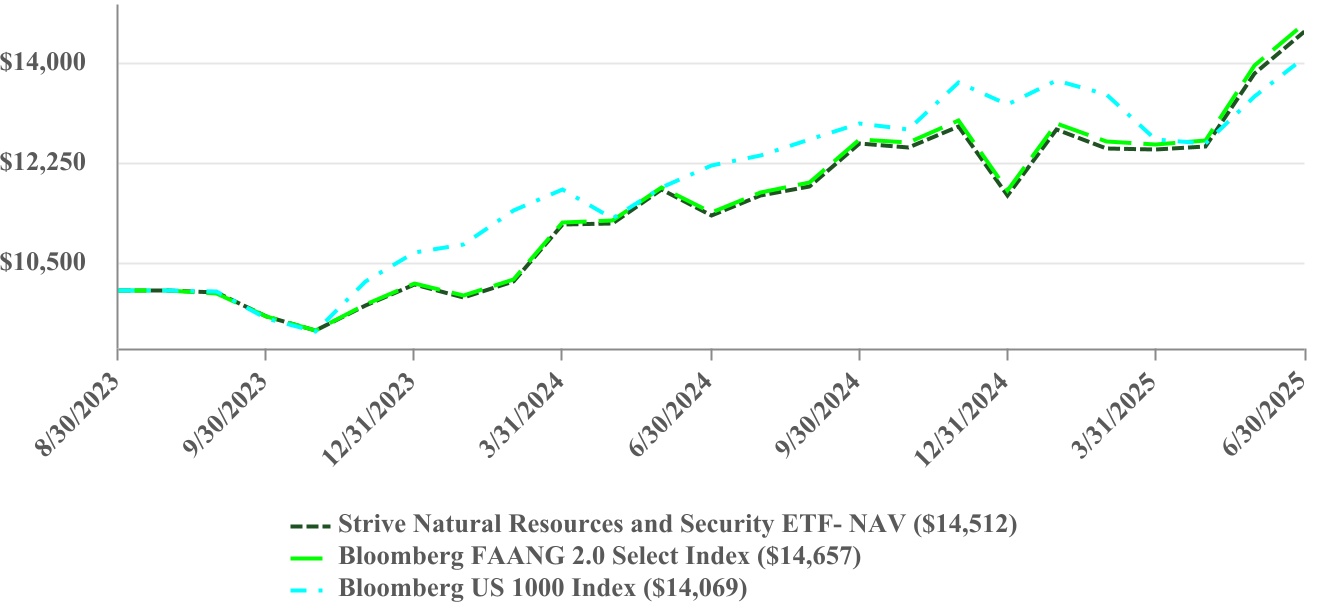
CUMULATIVE TOTAL RETURNS | ||||||||||||||
| One Year | Since Inception (8/30/2023) | |||||||||||||
| Strive Natural Resources and Security ETF - NAV | 28.36% | 22.49% | ||||||||||||
| Bloomberg FAANG 2.0 Select Index | 29.08% | 23.16% | ||||||||||||
| Bloomberg US 1000 Index | 15.45% | 20.44% | ||||||||||||
The Fund’s past performance is not a good predictor of how the Fund will perform in the future. The graph and table do not reflect the deduction of taxes that a shareholder would pay on fund distributions or redemption of fund shares. Visit www.strivefunds.com/ftwo for more recent performance information. | ||||||||||||||
| SECTOR WEIGHTING (as a % of Net Assets) | |||||
| Industrials | 32.5% | ||||
| Materials | 27.4% | ||||
| Energy | 25.0% | ||||
| Utilities | 14.4% | ||||
| Consumer Staples | 0.6% | ||||
| Cash & Cash Equivalents | 0.1% | ||||
| TOP 10 HOLDINGS (as a % of Net Assets) | |||||
| Constellation Energy Corp. | 13.6% | ||||
| Deere & Co. | 8.8% | ||||
| Exxon Mobil Corp. | 7.0% | ||||
| General Electric Co. | 4.6% | ||||
| Cameco Corp. | 4.3% | ||||
| Newmont Corp. | 3.6% | ||||
| Chevron Corp. | 3.5% | ||||
| Corteva, Inc. | 3.5% | ||||
| Freeport-McMoRan, Inc. | 3.4% | ||||
| RTX Corp. | 3.4% | ||||
Material Fund Changes
This is a summary of certain changes to the Fund since August 1, 2024. Effective February 1, 2025, the Fund’s fiscal year end changed from July 31 to June 30. For more complete information, you may review the Fund’s next prospectus, which we expect to be available by October 31, 2025 at www.strivefunds.com/ftwo or by calling (215) 330-4476.
| WHAT WERE THE FUND COSTS FOR THE PERIOD? (based on a hypothetical $10,000 investment) | |||||||||||
| COST OF $10,000 INVESTMENT | COST PAID AS A PERCENTAGE OF $10,000 INVESTMENT | ||||||||||
| $16 | 0.18% | ||||||||||
| WHAT FACTORS INFLUENCED PERFORMANCE FOR THE PERIOD? | |||||||||||
PERFORMANCE OF A HYPOTHETICAL $10,000 INVESTMENT | |||||||||||
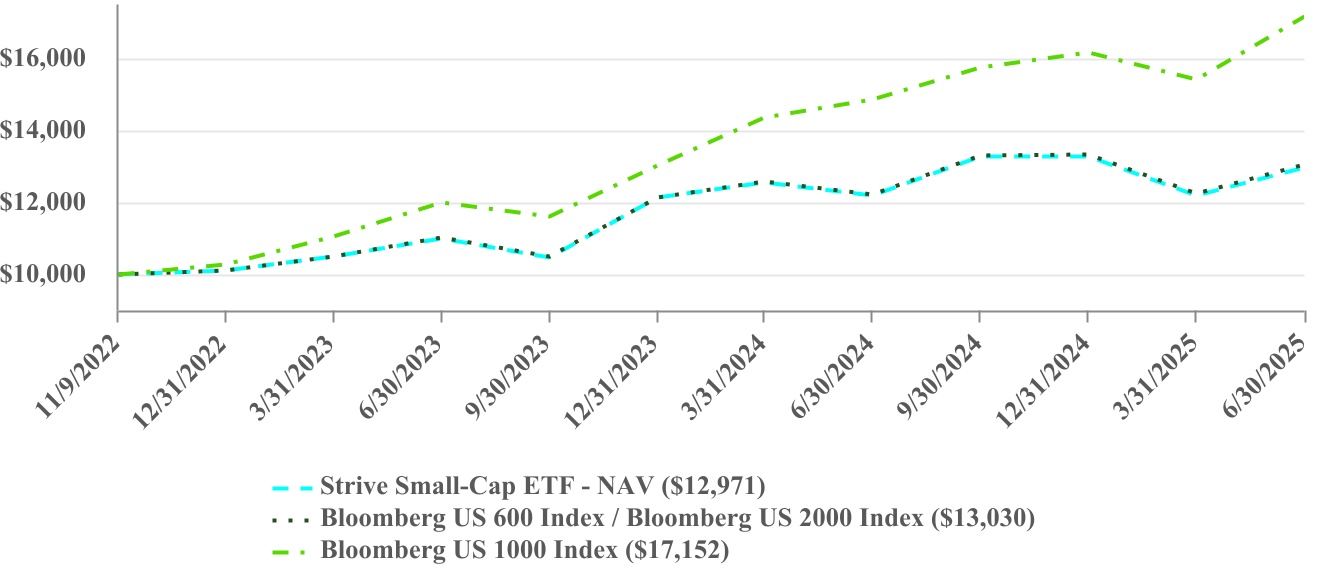
| AVERAGE ANNUAL TOTAL RETURNS | ||||||||||||||
| One Year | Since Inception (11/9/2022) | |||||||||||||
| Strive Small-Cap ETF - NAV | 6.46% | 10.36% | ||||||||||||
| Bloomberg US 600 Index/Bloomberg US 2000 Index | 6.69% | 10.55% | ||||||||||||
| Bloomberg US 1000 Index | 15.45% | 22.69% | ||||||||||||
The Fund’s past performance is not a good predictor of how the Fund will perform in the future. The graph and table do not reflect the deduction of taxes that a shareholder would pay on Fund distributions or redemption of Fund shares. Effective January 25, 2023, the Fund’s investment objective changed to track the total return performance, before fees and expenses, of an index composed of U.S. small-capitalization companies, and the Fund’s investment strategy changed to track the investment results of the Bloomberg 600 Index. Prior to January 25, 2023, the Fund’s investment objective was to track the total return performance, before fees and expenses, of an index composed of U.S. small- and mid-capitalization companies, and the Fund’s investment strategy was to track the investment results of the Bloomberg US 2000 Index. Performance shown for the Bloomberg US 600 Index/Bloomberg US 2000 Index for periods prior to January 25, 2023 is that of the Bloomberg US 2000 Index and for periods beginning January 25, 2023 is that of the Bloomberg US 600 Index. Visit www.strivefunds.com/stxk for more recent performance information. | ||||||||||||||
KEY FUND STATISTICS (as of Period End) | ||||||||||||||||||||
Net Assets | $60,701,238 | Portfolio Turnover Rate* | 32% | |||||||||||||||||
| # of Portfolio Holdings | 593 | Advisory Fees Paid | $93,798 | |||||||||||||||||
| *Portfolio turnover is not annualized and is calculated without regard to short-term securities having a maturity of less than one year. Excludes impact of in-kind transactions. | ||||||||||||||||||||
| SECTOR WEIGHTING (as a % of Net Assets) | |||||
| Financials | 17.7% | ||||
| Industrials | 17.7% | ||||
| Information Technology | 13.5% | ||||
| Consumer Discretionary | 12.5% | ||||
| Health Care | 11.1% | ||||
| Real Estate | 7.4% | ||||
| Materials | 4.9% | ||||
| Energy | 4.5% | ||||
| Utilities | 4.5% | ||||
| Communication Services | 3.1% | ||||
| Consumer Staples | 2.9% | ||||
| Cash and Cash Equivalents | 0.2% | ||||
| TOP 10 HOLDINGS (as a % of Net Assets) | |||||
| Nebius Group NV | 0.5% | ||||
| AeroVironment, Inc. | 0.4% | ||||
| AST SpaceMobile, Inc. | 0.4% | ||||
| Celsius Holdings, Inc. | 0.4% | ||||
| NEXTracker, Inc. - Class A | 0.4% | ||||
| National Fuel Gas Co. | 0.4% | ||||
| Oshkosh Corp. | 0.4% | ||||
| Five Below, Inc. | 0.4% | ||||
| Kratos Defense & Security Solutions, Inc. | 0.4% | ||||
| Dycom Industries, Inc. | 0.4% | ||||
Material Fund Changes
This is a summary of certain changes to the Fund since August 1, 2024. Effective February 1, 2025, the Fund’s fiscal year end changed from July 31 to June 30. For more complete information, you may review the Fund’s next prospectus, which we expect to be available by October 31, 2025 at www.strivefunds.com/stxk or by calling (215) 330-4476.
| WHAT WERE THE FUND COSTS FOR THE PERIOD? (based on a hypothetical $10,000 investment) | |||||||||||
| COST OF $10,000 INVESTMENT | COST PAID AS A PERCENTAGE OF $10,000 INVESTMENT | ||||||||||
| $46 | 0.49% | ||||||||||
| WHAT FACTORS INFLUENCED PERFORMANCE FOR THE PERIOD? | |||||||||||
The Fund provides actively managed core fixed income exposure with a tactical allocation to structured credit and high-yield corporates. The Fund’s return was positively impacted by interest rates declining over the period.
The Fund’s allocation to agency residential mortgage-backed securities (RMBS), asset-backed securities, and investment-grade corporate sectors were the most significant drivers of positive performance, while collateralized loan obligations, corporate bonds and convertibles were smaller positive contributors to overall performance. The Fund’s allocation to agency RMBS was the largest contributor to positive performance given its largest weighting in the portfolio, duration positioning, and an overweight to higher-coupon agency RMBS. The use of treasury futures to increase the Fund’s duration in line with the Bloomberg U.S. Aggregate Bond Index also increased performance with a move lower in treasury rates during the period.
PERFORMANCE OF A HYPOTHETICAL $10,000 INVESTMENT | |||||||||||
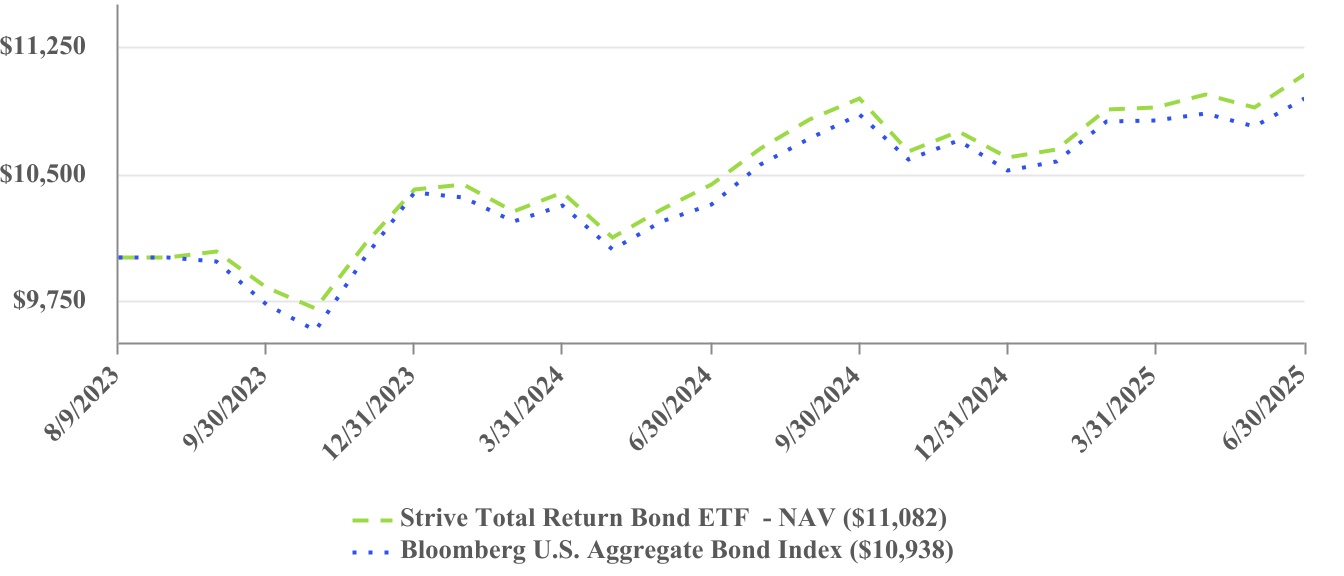
CUMULATIVE TOTAL RETURNS | ||||||||||||||
| One Year | Since Inception (8/9/2023) | |||||||||||||
Strive Total Return Bond ETF - NAV | 6.26% | 5.58% | ||||||||||||
| Bloomberg U.S. Aggregate Bond Index | 6.08% | 4.85% | ||||||||||||
The Fund’s past performance is not a good predictor of how the Fund will perform in the future. The graph and table do not reflect the deduction of taxes that a shareholder would pay on Fund distributions or redemption of Fund shares. Visit www.strivefunds.com/stxt for more recent performance information. | ||||||||||||||
| SECTOR WEIGHTING (as a % of Net Assets) | |||||
| Mortgage-Backed Securities | 44.0% | ||||
| Asset-Backed Securities | 16.1% | ||||
| U.S. Treasury Securities | 13.7% | ||||
| Corporate Bonds | 10.0% | ||||
| Collateralized Loan Obligations | 7.0% | ||||
| Collateralized Mortgage Obligations | 4.5% | ||||
| Convertible Bonds | 1.4% | ||||
| Cash and Cash Equivalents | 3.3% | ||||
Material Fund Changes
This is a summary of certain changes to the Fund since August 1, 2024. Effective February 1, 2025, the Fund’s fiscal year end changed from July 31 to June 30. For more complete information, you may review the Fund’s next prospectus, which we expect to be available by October 31, 2025 at www.strivefunds.com/stxt or by calling (215) 330-4476.
| WHAT WERE THE FUND COSTS FOR THE PERIOD? (based on a hypothetical $10,000 investment) | |||||||||||
| COST OF $10,000 INVESTMENT | COST PAID AS A PERCENTAGE OF $10,000 INVESTMENT | ||||||||||
| $36 | 0.41% | ||||||||||
| WHAT FACTORS INFLUENCED PERFORMANCE FOR THE PERIOD? | |||||||||||
PERFORMANCE OF A HYPOTHETICAL $10,000 INVESTMENT | |||||||||||
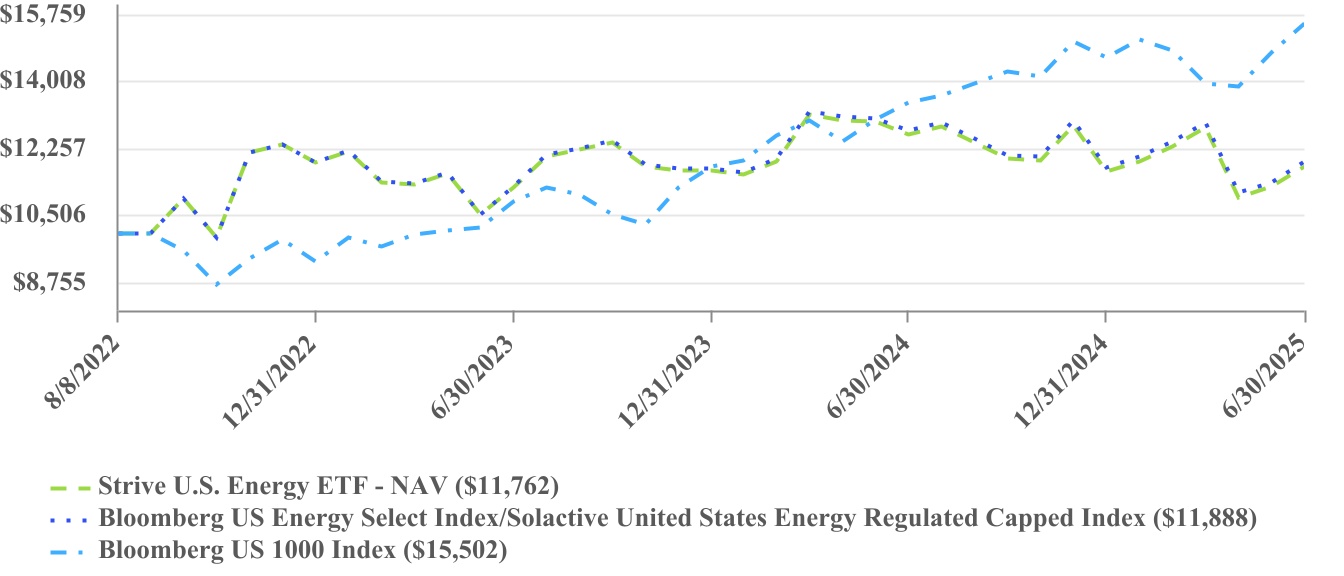
AVERAGE ANNUAL TOTAL RETURNS | ||||||||||||||
| One Year | Since Inception (8/8/2022) | |||||||||||||
| Strive U.S. Energy ETF - NAV | (6.62)% | 5.77% | ||||||||||||
| Bloomberg US Energy Select Index/ Solactive United States Energy Regulated Capped Index | (6.30)% | 6.16% | ||||||||||||
| Bloomberg US 1000 Index | 15.45% | 16.36% | ||||||||||||
The Fund’s past performance is not a good predictor of how the Fund will perform in the future. The graph and table do not reflect the deduction of taxes that a shareholder would pay on Fund distributions or redemption of Fund shares. Effective April 11, 2024, the Fund’s investment strategy changed to track the investment results of the Bloomberg US Energy Select Index. Prior to April 11, 2024, the Fund’s investment strategy was to track the investment results of the Solactive United States Energy Regulated Capped Index. Performance shown for the Bloomberg US Energy Select Index/Solactive United States Energy Regulated Capped Index for periods prior to April 11, 2024 is that of the Solactive United States Energy Regulated Capped Index and for periods beginning April 11, 2024 is that of the Bloomberg US Energy Select Index. Visit www.strivefunds.com/drll for more recent performance information. | ||||||||||||||
| INDUSTRY WEIGHTING (as a % of Net Assets) | |||||
| Integrated Oil & Gas | 46.0% | ||||
| Oil & Gas Exploration & Production | 38.6% | ||||
| Oil & Gas Refining & Marketing | 14.5% | ||||
| Automotive Retail | 0.8% | ||||
| Real Estate | 0.1% | ||||
| Top 10 Holdings (as a % of Net Assets) | |||||
| Exxon Mobil Corp. | 22.5% | ||||
| Chevron Corp. | 20.5% | ||||
| EOG Resources, Inc. | 4.7% | ||||
| Phillips 66 | 4.6% | ||||
| Marathon Petroleum Corp | 4.6% | ||||
| ConocoPhillips | 4.5% | ||||
| Valero Energy Corp | 4.4% | ||||
| Hess Corp | 4.1% | ||||
| EQT Corp | 3.6% | ||||
| Occidental Petroleum Corp | 3.0% | ||||
Material Fund Changes
This is a summary of certain changes to the Fund since August 1, 2024. Effective February 1, 2025, the Fund’s fiscal year end changed from July 31 to June 30. For more complete information, you may review the Fund’s next prospectus, which we expect to be available by October 31, 2025 at www.strivefunds.com/drll or by calling (215) 330-4476.
| WHAT WERE THE FUND COSTS FOR THE PERIOD? (based on a hypothetical $10,000 investment) | |||||||||||
| COST OF $10,000 INVESTMENT | COST PAID AS A PERCENTAGE OF $10,000 INVESTMENT | ||||||||||
| $39 | 0.40% | ||||||||||
| WHAT FACTORS INFLUENCED PERFORMANCE FOR THE PERIOD? | |||||||||||
The U.S. listed semiconductor industry saw positive returns over the period. Several leading chipmakers specializing in high-performance hardware designed for artificial intelligence (“AI”) contributed positively during the reporting period. A U.S. dominant manufacturer of graphics processing units optimized for AI workloads benefited amid unprecedented demand. Semiconductors and semiconductor equipment companies were the most significant detractors, partly due to government restrictions on sales to the large Chinese market. Government policy has shifted in favor of selling U.S. semiconductor technology to China since the end of the reporting period on 6/30. While demand for AI chips surged, U.S. semiconductor companies exposed to PCs, smartphones, industrial, and automotive sectors faced significant headwinds amid trade uncertainly and weakened demand. A semiconductor materials and equipment company in the Netherlands declined as delayed orders from major clients and lingering overcapacity in the semiconductor industry weakened demand for its advanced lithography systems that are essential components in chip manufacturing.
PERFORMANCE OF A HYPOTHETICAL $10,000 INVESTMENT | |||||||||||
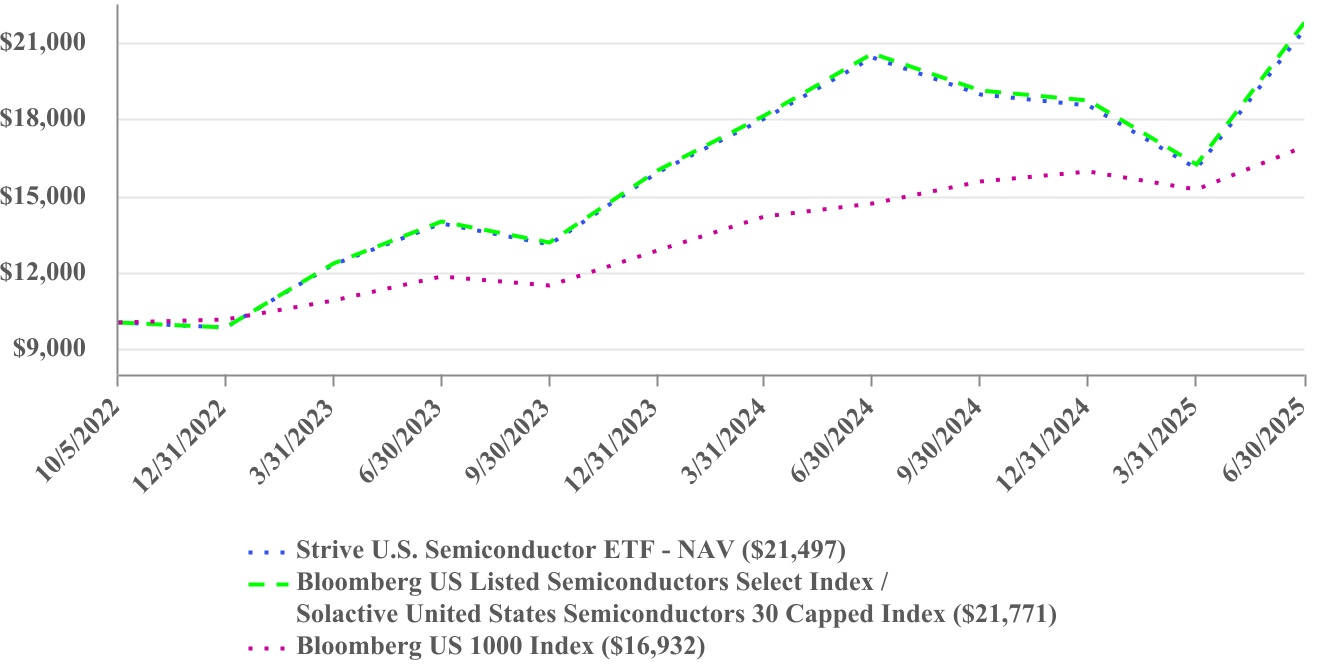
| AVERAGE ANNUAL TOTAL RETURNS | ||||||||||||||
| One Year | Since Inception (10/5/2022) | |||||||||||||
| Strive U.S. Semiconductor ETF - NAV | 5.36% | 32.30% | ||||||||||||
| Bloomberg US Listed Semiconductors Select Index / Solactive United States Semiconductors 30 Capped Index | 5.86% | 32.92% | ||||||||||||
| Bloomberg US 1000 Index | 15.45% | 21.24% | ||||||||||||
The Fund’s past performance is not a good predictor of how the Fund will perform in the future. The graph and table do not reflect the deduction of taxes that a shareholder would pay on Fund distributions or redemption of Fund shares. Effective March 21, 2024, the Fund’s investment strategy changed to track the investment results of the Bloomberg US Listed Semiconductors Select Index. Prior to March 21, 2024, the Fund’s investment strategy was to track the investment results of the Solactive United States Semiconductors 30 Capped Index. Performance shown for the Bloomberg US Listed Semiconductors Select Index/Solactive United States Semiconductors 30 Capped Index for periods prior to March 21, 2024 is that of the Solactive United States Semiconductors 30 Capped Index and for periods beginning March 21, 2024 is that of the Bloomberg US Listed Semiconductors Select Index. Visit www.strivefunds.com/shoc for more recent performance information. | ||||||||||||||
| INDUSTRY WEIGHTING (as a % of Net Assets) | |||||
| Semiconductors | 72.9% | ||||
| Semiconductor Materials & Equipment | 18.4% | ||||
| Application Software | 5.5% | ||||
| Electronic Manufacturing Services | 1.7% | ||||
| Electronic Equipment & Instruments | 1.0% | ||||
| Specialty Chemicals | 0.3% | ||||
| Money Market Funds | 0.2% | ||||
| TOP 10 HOLDINGS (as a % of Net Assets) | |||||
| NVIDIA Corp. | 23.3% | ||||
| Broadcom, Inc. | 18.1% | ||||
| Advanced Micro Devices Inc | 4.9% | ||||
| ASML Holding NV | 4.7% | ||||
| Micron Technology Inc | 4.7% | ||||
| Applied Materials Inc | 4.4% | ||||
| Texas Instruments Inc | 4.3% | ||||
| Lam Research Corp | 4.2% | ||||
| KLA CORP | 4.0% | ||||
| Analog Devices Inc | 4.0% | ||||
Material Fund Changes
This is a summary of certain changes to the Fund since August 1, 2024. Effective February 1, 2025, the Fund’s fiscal year end changed from July 31 to June 30. For more complete information, you may review the Fund’s next prospectus, which we expect to be available by October 31, 2025 at www.strivefunds.com/shoc or by calling (215) 330-4476.