| Fund (Class) | Costs of a $10,000 Investment | Costs Paid as a Percentage of a $10,000 Investment |
|---|---|---|
| Guinness Atkinson Alternative Energy Fund | $58 | 1.11% |
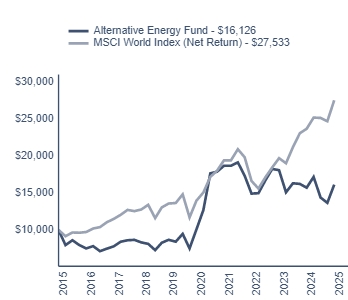
In the first half of 2025, the Guinness Atkinson Alternative Energy Fund produced a total return of 12.13% vs the MSCI World Index (net return) of 9.47%.
What affected the Fund's performance?
Fund performance can be attributed to the following.
Within our portfolio, the top contributing segments were our electrical installation and electrification sectors, while underperforming segments included our solar/wind equipment and auto-exposed electrification names. We are encouraged at the diversity and breadth of contribution within the portfolio, with our top ten contributors equally split across US and Europe and representing all five of our master themes. Key discussion points were as follows:
Our electrical equipment companies all performed well, driven by an acceleration in global electrification activity, grid spending and, in select cases (such as Legrand), exposure to the data centre sub-sector. One of the fund's top contributors was SPIE which delivered upgraded guidance at its Capital Markets Day and benefitted from higher German infrastructure spending.
Amphenol shares performed strongly, having materially beaten revenue and operating margins expectations in 1Q results. Amphenol's IT interconnect solutions "IT Datacom" segment delivered +134% YoY growth (reflecting data centre and AI exposure) while four of its seven non-AI end markets posted mid-teens or better growth.
Deal activity remained strong within the space, with Johnson Matthey contributing well having accepted a bid for its Catalyst Technologies division for £1.8bn from Honeywell, at an implied attractive valuation of 15x TTM EBITDA. Management plan to return ~£1.4bn (60% of current market cap) to shareholders once the deal is closed.
Sectors and companies in the portfolio that were relatively weaker over the period included: Enphase was directly affected by the cuts in subsidy to residential solar tax credits. Gentherm suffered from auto cycle weakness and uncertainties around Trump's tariffs. Owens Corning suffered after highlighting weakness in the North America Residential market. Ameresco was weak after management noted some uncertainty around federal government projects in its $2.5 billion backlog of contracted projects.
| 6 Months (Actual) | 1 Year | 5 Years | 10 Years | |
|---|---|---|---|---|
| Guinness Atkinson Alternative Energy Fund | 12.13% | 2.61% | 9.88% | 4.89% |
| MSCI World Index (Net Return) | 9.47% | 16.26% | 14.55% | 10.66% |
| Net Assets ($) | $16,147,922 |
| Number of Portfolio Holdings | |
| Portfolio Turnover Rate (%) | 12% |
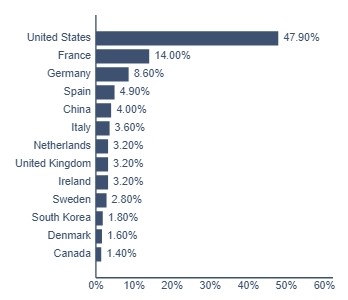
The tables below show the investment makeup of the Fund, representing percentage of the total net assets of the Fund. The Top Ten Holdings and Geographic Allocation exclude short-term holdings, if any.
| Top 10 | % of Net Assets |
|---|---|
| Legrand SA | |
| Iberdrola SA | |
| Eaton Corp PLC | |
| Schneider Electric SE | |
| Siemens AG | |
| Trane Technologies PLC | |
| Hubbell Inc | |
| Amphenol Corp | |
| Spie SA | |
| Nextera Energy Inc |
| Fund (Class) | Costs of a $10,000 Investment | Costs Paid as a Percentage of a $10,000 Investment |
|---|---|---|
| Guinness Atkinson Asia Focus Fund | $105 | 1.98% |
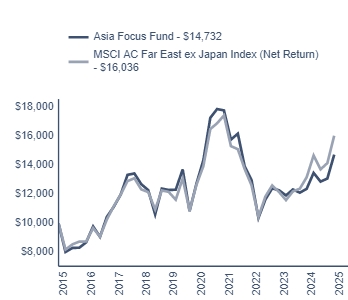
In the first half of 2025, the Guinness Atkinson Asia Focus Fund produced a total return of 14.43% vs the MSCI AC Far East ex Japan Index (net return) of 16.88%.
What affected the Fund's performance?
Fund performance can be attributed to the following:
Asian markets were strong over the period, led by China, Hong Kong, Korea, Taiwan and Singapore. US fiscal and trade policies combined with high domestic stock valuations have prompted moves to diversify from heavy US stock exposure. Asia, along with Europe, has been a beneficiary.
Leading sectors were Communication Services, Industrials, Financials, Health Care and Technology.
Health Care was the top contributor to relative performance in the first half of 2025 with Sino Biopharmaceutical and China Medical Systems both rising around 60% on improving sentiment around China's home-grown research and development. Other significant contributors were Elite Material and Broadcom, both benefiting from the significant AI and datacenter capital expenditure plans.
The Fund's weakest performer was Meituan, a Chinese food delivery company currently embroiled in intense competition with JD.Com, whose share price also fell over the period. Shenzhou International a textile maker and Haitian International a maker of machinery, specifically plastic injection molding machines, were both weaker on trade uncertainty.
| 6 Months (Actual) | 1 Year | 5 Years | 10 Years | |
|---|---|---|---|---|
| Guinness Atkinson Asia Focus Fund | 14.43% | 19.02% | 2.96% | 3.95% |
| MSCI AC Far East ex Japan Index (Net Return) | 16.88% | 21.69% | 4.86% | 4.84% |
| Net Assets ($) | $10,688,651 |
| Number of Portfolio Holdings | |
| Portfolio Turnover Rate (%) | 12% |
The tables below show the investment makeup of the Fund, representing percentage of the total net assets of the Fund. The Top Ten Holdings and Industry Allocation exclude short-term holdings, if any.
| Top 10 | % of Net Assets |
|---|---|
| Taiwan Semiconductor Manufacturing Co Ltd | |
| Tencent Holdings Ltd | |
| NetEase Inc - ADR | |
| Samsung Electronics Co Ltd | |
| China Merchants Bank Co Ltd - H Shares | |
| China Medical System Holdings Ltd | |
| DBS Group Holdings | |
| Broadcom Inc | |
| JD.com Inc | |
| Applied Materials Inc |
| Sector | % of Net Assets |
|---|---|
| Electronic Components - Semiconductor | |
| Commercial Banks | |
| E-Commerce/Services | |
| Semiconductor Components - Integrated Circuits | |
| Internet Application Software | |
| Entertainment Software | |
| Medical Products | |
| E-Commerce/Products | |
| Electronic Component Miscellaneous | |
| Machinery - Construction & Mining | |
| Metal Processors & Fabricators | |
| Machinery - General Industries | |
| Internet & Direct Marketing Retail | |
| Personal Care Products | |
| MRI/Medical Diagnostic Imaging | |
| Auto - Cars/Light Trucks | |
| Photo Equipment & Supplies | |
| Food - Dairy Products | |
| Textile - Apparel | |
| Building Products - Cement/Aggregates | |
| Travel Services | |
| Insurance | |
| Rental Auto/Equipment | |
| Pharmaceuticals |
The tables below show the investment makeup of the Fund, representing percentage of the total net assets of the Fund. The Top Ten Holdings and Industry Allocation exclude short-term holdings, if any.
| Top 10 | % of Net Assets |
|---|---|
| Taiwan Semiconductor Manufacturing Co Ltd | |
| Tencent Holdings Ltd | |
| NetEase Inc - ADR | |
| Samsung Electronics Co Ltd | |
| China Merchants Bank Co Ltd - H Shares | |
| China Medical System Holdings Ltd | |
| DBS Group Holdings | |
| Broadcom Inc | |
| JD.com Inc | |
| Applied Materials Inc |
| Fund (Class) | Costs of a $10,000 Investment | Costs Paid as a Percentage of a $10,000 Investment |
|---|---|---|
| Guinness Atkinson China & Hong Kong Fund | $99 | 1.89% |
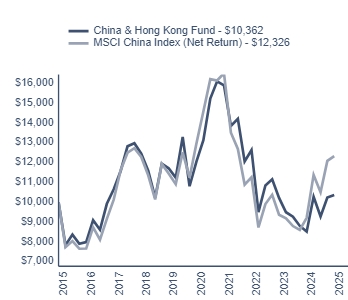
In the first half of 2025, the Guinness Atkinson China & Hong Kong Fund produced a total return of 11.70% vs the MSCI China Index (net return) of 17.33%.
What affected the Fund's performance?
Fund performance can be attributed to the following:
Areas which helped the Fund's performance were:
Stock selection in the Health Care sector, driven by Sino Biopharmaceutical.
Stock selection in the Industrials sector, driven by Shenzhen Inovance Technology and Sany Heavy Industry.
Areas which detracted from the Fund's relative performance were:
The Fund's lower exposure to AI related names and large cap stocks in Hong Kong in the first quarter. Alibaba was the strongest stock in the first quarter and is the second largest stock in the MSCI China Index, accounting for 9.7% the index. In the first quarter it rose 56% due to its exposure to AI in China. The Fund is run on an equally weighted basis and so each position has a neutral weight of 3.3%. As Alibaba outperformed in the first quarter, the Fund benefited from less of its outperformance than the index.
Ultimately, the Fund's underweight to the following large cap stocks explains most of its underperformance versus the index: Alibaba and Tencent (both held), and Xiaomi, BYD and Pinduoduo (none held at the time). In the second quarter, we reduced the Fund's underweight to large cap offshore stocks by buying BYD and Meituan.
| 6 Months (Actual) | 1 Year | 5 Years | 10 Years | |
|---|---|---|---|---|
| Guinness Atkinson China & Hong Kong Fund | 11.70% | 21.70% | -2.96% | 0.36% |
| MSCI China Index (Net Return) | 17.33% | 33.78% | -0.99% | 2.11% |
| Net Assets ($) | $24,942,641 |
| Number of Portfolio Holdings | |
| Portfolio Turnover Rate (%) | 14% |
The tables below show the investment makeup of the Fund, representing percentage of the total net assets of the Fund. The Top Ten Holdings and Geographic Allocation exclude short-term holdings, if any.
| Top 10 | % of Net Assets |
|---|---|
| Tencent Holdings Ltd | |
| NetEase Inc - ADR | |
| Sino Biopharmaceutical Ltd | |
| Shandong Himile Mechanical Science & Technology Co Ltd | |
| AIA Group Ltd | |
| Hong Kong Exchanges & CL | |
| Geely Automobile Holdings Ltd | |
| Shenzhen H&T Intelligent Control Co., Ltd. | |
| China Merchants Bank Co Ltd - H Shares | |
| Weichai Power Co Ltd - H Shares |
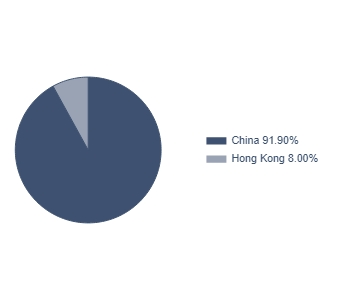
| Fund (Class) | Costs of a $10,000 Investment | Costs Paid as a Percentage of a $10,000 Investment |
|---|---|---|
| Guinness Atkinson Global Energy Fund | $74 | 1.45% |
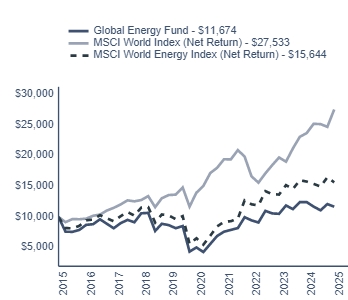
In the first half of 2025, the Guinness Atkinson Global Energy Fund produced a total return of 5.31% vs the MSCI World Index (net return) of 9.47%.
What affected the Fund's performance?
Fund performance can be attributed to the following.
Within the Global Energy Fund over the period, stronger performers included:
European Integrateds: seven of the top ten contributors were European integrateds, reflecting strength in broader European stock markets and a tilting away from low carbon investments back towards growth from fossil fuels.
Canadian integrateds: Canadian oil benchmarks strengthened versus WTI, boosting cashflows, whilst tensions in the Middle East provided a reminder of the energy security qualities of Canadian oil supply.
US refining: tighter refining capacity kept refining margins higher. Particular beneficiaries included Valero Energy and US major, Exxon.
Sectors in the portfolio that were relatively weaker over the period included:
Services: Large cap diversified service companies Halliburton, Schlumberger and Baker Hughes underperformed, driven by a declining US oil/gas rig count and continued capital discipline from E&Ps and integrated oils.
US E&Ps: Oil producers such as Devon, Diamondback and Conocophillips tend to have the greatest operational leverage in the portfolio to oil prices. With the spot Brent price down by 9% since the start of the year, so cashflows for these companies have shrunk.
| 6 Months (Actual) | 1 Year | 5 Years | 10 Years | |
|---|---|---|---|---|
| Guinness Atkinson Global Energy Fund | 5.31% | -6.07% | 18.36% | 1.56% |
| MSCI World Index (Net Return) | 9.47% | 16.26% | 14.55% | 10.66% |
| MSCI World Energy Index (Net Return) | 4.56% | -0.84% | 19.12% | 4.58% |
| Net Assets ($) | $9,610,826 |
| Number of Portfolio Holdings | |
| Portfolio Turnover Rate (%) | 0% |
The tables below show the investment makeup of the Fund, representing percentage of the total net assets of the Fund. The Top Ten Holdings and Geographic Allocation exclude short-term holdings, if any.
| Top 10 | % of Net Assets |
|---|---|
| Shell PLC | |
| Chevron Corp | |
| TotalEnergies SE | |
| Exxon Mobil Corp | |
| Kinder Morgan Inc | |
| Imperial Oil Ltd | |
| Valero Energy Corp | |
| Suncor Energy Inc | |
| BP PLC | |
| ConocoPhillips |
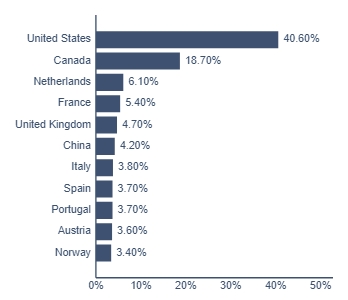
| Fund (Class) | Costs of a $10,000 Investment | Costs Paid as a Percentage of a $10,000 Investment |
|---|---|---|
| Investor Class | $65 | 1.24% |
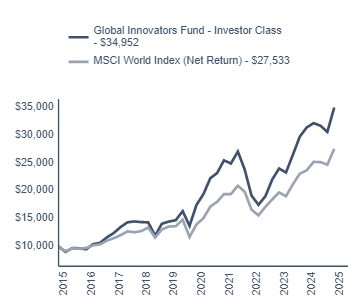
In the first half of 2025, the Guinness Atkinson Global Innovators Fund – Investor Class produced a total return of 10.32% vs the MSCI World Index (net return) of 9.47%.
What affected the Fund's performance?
Fund performance can be attributed to:
The Fund overweight position to the Information Technology sector provided the greatest tailwind to outperformance, bolstered by strong selection effects within the sector. Fund holding Amphenol delivered strong gains (+42.8% USD), though the Fund benefitted from an underweight position to Apple (-17.9% USD) as the stock has struggled in the face of tariffs and related supply chain disruptions.
The Fund also benefitted from strong stock selection within the Consumer Discretionary and Communication Services sectors driven by off benchmark holding Anta Sports (+21.6% USD) and Netflix (50.2% USD) which delivered stellar performance.
With the prospect of a changing regulatory environment and the threat of tariffs, stocks within the Healthcare sector struggled, creating a slight headwind to performance, namely Novo Nordisk (-18.9% USD) and Thermo Fisher (-21.9% USD).From an asset allocation perspective, the Fund benefitted from a zero-weight allocation to Energy, Consumer Staples, Materials and Real Estate.
| 6 Months (Actual) | 1 Year | 5 Years | 10 Years | |
|---|---|---|---|---|
| Guinness Atkinson Global Innovators Fund - Investor Class | 10.32% | 11.42% | 14.91% | 13.33% |
| MSCI World Index (Net Return) | 9.47% | 16.26% | 14.55% | 10.66% |
| Net Assets ($) | $198,382,391 |
| Number of Portfolio Holdings | |
| Portfolio Turnover Rate (%) | 1% |
The tables below show the investment makeup of the Fund, representing percentage of the total net assets of the Fund. The Top Ten Holdings and Geographic Allocation exclude short-term holdings, if any.
| Top 10 | % of Net Assets |
|---|---|
| Netflix Inc | |
| Amphenol Corp | |
| NVIDIA Corp | |
| Taiwan Semiconductor Manufacturing Co Ltd | |
| ANTA Sports Products Ltd | |
| Meta Platforms Inc. - Class A | |
| Intuit Inc | |
| Mastercard Inc | |
| KLA-Tencor Corp | |
| Intercontinental Exchange Inc |
| Fund (Class) | Costs of a $10,000 Investment | Costs Paid as a Percentage of a $10,000 Investment |
|---|---|---|
| Institutional Class | $52 | 0.99% |
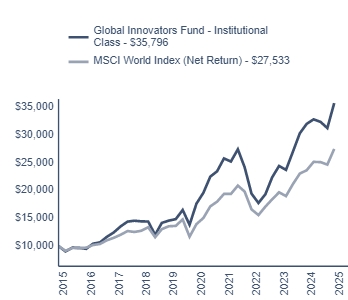
In the first half of 2025, the Guinness Atkinson Global Innovators Fund – Institutional Class produced a total return of 10.46% vs the MSCI World Index (net return) of 9.47%.
What affected the Fund's performance?
Fund performance can be attributed to:
The Fund overweight position to the Information Technology sector provided the greatest tailwind to outperformance, bolstered by strong selection effects within the sector. Fund holding Amphenol delivered strong gains (+42.8% USD), though the Fund benefitted from an underweight position to Apple (-17.9% USD) as the stock has struggled in the face of tariffs and related supply chain disruptions.
The Fund also benefitted from strong stock selection within the Consumer Discretionary and Communication Services sectors driven by off benchmark holding Anta Sports (+21.6% USD) and Netflix (50.2% USD) which delivered stellar performance.
With the prospect of a changing regulatory environment and the threat of tariffs, stocks within the Healthcare sector struggled, creating a slight headwind to performance, namely Novo Nordisk (-18.9% USD) and Thermo Fisher (-21.9% USD).
From an asset allocation perspective, the Fund benefitted from a zero-weight allocation to Energy, Consumer Staples, Materials and Real Estate.
| 6 Months (Actual) | 1 Year | 5 Years | 10 Years | |
|---|---|---|---|---|
| Guinness Atkinson Global Innovators Fund - Institutional Class | 10.46% | 11.69% | 15.19% | 13.60% |
| MSCI World Index (Net Return) | 9.47% | 16.26% | 14.55% | 10.66% |
| Net Assets ($) | $198,382,391 |
| Number of Portfolio Holdings | |
| Portfolio Turnover Rate (%) | 1% |
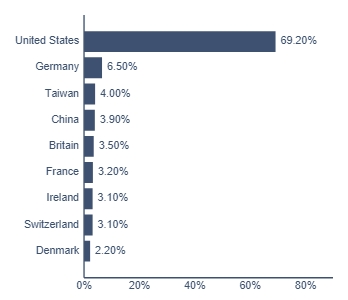
The tables below show the investment makeup of the Fund, representing percentage of the total net assets of the Fund. The Top Ten Holdings and Geographic Allocation exclude short-term holdings, if any.
| Top 10 | % of Net Assets |
|---|---|
| Netflix Inc | |
| Amphenol Corp | |
| NVIDIA Corp | |
| Taiwan Semiconductor Manufacturing Co Ltd | |
| ANTA Sports Products Ltd | |
| Meta Platforms Inc. - Class A | |
| Intuit Inc | |
| Mastercard Inc | |
| KLA-Tencor Corp | |
| Intercontinental Exchange Inc |