Shareholder Report
Jun. 30, 2025
USD ($)
Holding
| What were the Fund costs for last six months? Annual Fund Operating Expenses (based on a hypothetical $10,000 investment) |
Class Name |
|
Cost of a $10,000 investment |
|
|
Cost paid as a percentage of a $10,000 investment |
| |||||
| Class A | $181 | 1.78% | ||||||||||
| Key Fund Statistics |
||||
| Total Net Assets |
$63,378,535 | |||
| # of Portfolio Holdings |
63 | |||
| Portfolio Turnover Rate |
3.42% | |||
| Total Advisory Fees Paid |
$272,029 | |||
| Top 5 Holdings (% of Net Assets) |
||||
| Autopistas Metropolitanas of Puerto Rico, 6.75%, due 06/30/35 |
13.30 | % | ||
| Municipal Electric Authority of Georgia, 7.06%, due 04/01/57 |
3.8% | |||
| FNMA Pool AR5162, 3.50%, due 05/01/43 |
3.3% | |||
| Metropolitan Transportation Authority, 7.34%, due 11/15/39 |
3.3% | |||
| Washington State Convention Center, 6.79%, due 07/01/40 |
2.9% | |||
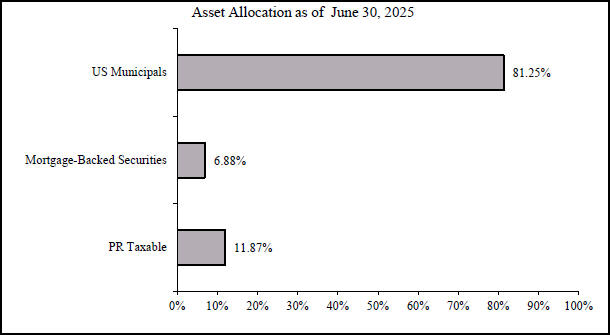
Fund Holdings Summaries
The following graph reflects the breakdown of the investment portfolio (% of Total Investments) as of June 30, 2025:

The following tables show the allocation (% of Total Investments) of the Fund’s portfolio using various metrics as of the end of the period:
| Portfolio Composition |
||||
| Puerto Rico Corporate |
11.87 | % | ||
| Mortgage-Backed Securities |
6.88 | % | ||
| U.S. Municipals - Transportation Bonds |
26.57 | % | ||
| U.S. Municipals - Utilities Bonds |
14.31 | % | ||
| U.S. Municipals - Dedicated Tax Bonds |
23.22 | % | ||
| U.S. Municipals - Healthcare Bonds |
8.01 | % | ||
| U.S. Municipals - Educational Bonds |
5.20 | % | ||
| U.S. Municipals - Others |
3.94 | % | ||
| Total |
100.00 | % | ||
| Geographic Allocation |
||||
| Puerto Rico |
18.75% | |||
| U.S. |
81.25% | |||
| 100.00% |
The following table shows the ratings of the Fund’s portfolio securities (based on % of Total Investments) as of June 30, 2025. The ratings used are the highest rating given by one of the three nationally recognized rating agencies, Fitch Ratings (“Fitch”), Moody’s Investors Service (“Moody’s”), and S&P Global Ratings (“S&P”). Ratings are subject to change. During the period, the United States lost its last remaining sovereign AAA rating when Moody’s downgraded it to AA1, citing as rational “the increase over more than a decade in government debt and interest payment ratios to levels that are significantly higher than similarly rated sovereigns.” Both S&P and Fitch had already downgraded the rating to their equivalent rating of AA+.
| Rating |
Percent | |||
| AAA |
8.67 | % | ||
| AA |
52.30 | % | ||
| A |
30.56 | % | ||
| BBB |
8.47 | % | ||
| Total |
100.00 | % | ||
| Top 5 Holdings (% of Net Assets) |
||||
| Autopistas Metropolitanas of Puerto Rico, 6.75%, due 06/30/35 |
13.30 | % | ||
| Municipal Electric Authority of Georgia, 7.06%, due 04/01/57 |
3.8% | |||
| FNMA Pool AR5162, 3.50%, due 05/01/43 |
3.3% | |||
| Metropolitan Transportation Authority, 7.34%, due 11/15/39 |
3.3% | |||
| Washington State Convention Center, 6.79%, due 07/01/40 |
2.9% | |||
| What were the Fund costs for last six months? |
||||
| Annual Fund Operating Expenses |
||||
| (based on a hypothetical $10,000 investment) |
||||
| Class Name |
Cost of a $10,000 investment |
Cost paid as a percentage of a $10,000 investment |
||||||
| Class P | $181 | 1.78% | ||||||
| Key Fund Statistics |
||||
| Total Net Assets |
$63,378,535 | |||
| # of Portfolio Holdings |
63 | |||
| Portfolio Turnover Rate |
3.42% | |||
| Total Advisory Fees Paid |
$272,029 | |||
| Top 5 Holdings (% of Net Assets) |
||||
| Autopistas Metropolitanas of Puerto Rico, 6.75%, due 06/30/35 | 13.30% | |||
| Municipal Electric Authority of Georgia, 7.06%, due 04/01/57 | 3.8% | |||
| FNMA Pool AR5162, 3.50%, due 05/01/43 | 3.3% | |||
| Metropolitan Transportation Authority, 7.34%, due 11/15/39 | 3.3% | |||
| Washington State Convention Center, 6.79%, due 07/01/40 | 2.9% | |||
Fund Holdings Summaries
The following graph reflects the breakdown of the investment portfolio (% of Total Investments) as of June 30, 2025:
The following tables show the allocation (% of Total Investments) of the Fund’s portfolio using various metrics as of the end of the period:
| Portfolio Composition |
||||
| Puerto Rico Corporate |
11.87 | % | ||
| Mortgage-Backed Securities |
6.88 | % | ||
| U.S. Municipals - Transportation Bonds |
26.57 | % | ||
| U.S. Municipals - Utilities Bonds |
14.31 | % | ||
| U.S. Municipals - Dedicated Tax Bonds |
23.22 | % | ||
| U.S. Municipals - Healthcare Bonds |
8.01 | % | ||
| U.S. Municipals - Educational Bonds |
5.20 | % | ||
| U.S. Municipals - Others |
3.94 | % | ||
| Total |
100.00 | % |
| Geographic Allocation |
||||
| Puerto Rico |
18.75% | |||
| U.S. |
81.25% | |||
| 100.00% |
The following table shows the ratings of the Fund’s portfolio securities (based on % of Total Investments) as of June 30, 2025. The ratings used are the highest rating given by one of the three nationally recognized rating agencies, Fitch Ratings (“Fitch”), Moody’s Investors Service (“Moody’s”), and S&P Global Ratings (“S&P”). Ratings are subject to change. During the period, the United States lost its last remaining sovereign AAA rating when Moody’s downgraded it to AA1, citing as rational “the increase over more than a decade in government debt and interest payment ratios to levels that are significantly higher than similarly rated sovereigns.” Both S&P and Fitch had already downgraded the rating to their equivalent rating of AA+.
| Rating |
Percent | |||
| AAA |
8.67 | % | ||
| AA |
52.30 | % | ||
| A |
30.56 | % | ||
| BBB |
8.47 | % | ||
| Total |
100.00 | % | ||
| Top 5 Holdings (% of Net Assets) |
||||
| Autopistas Metropolitanas of Puerto Rico, 6.75%, due 06/30/35 | 13.30% | |||
| Municipal Electric Authority of Georgia, 7.06%, due 04/01/57 | 3.8% | |||
| FNMA Pool AR5162, 3.50%, due 05/01/43 | 3.3% | |||
| Metropolitan Transportation Authority, 7.34%, due 11/15/39 | 3.3% | |||
| Washington State Convention Center, 6.79%, due 07/01/40 | 2.9% | |||