Shareholder Report
|
12 Months Ended |
|
Jun. 30, 2025
USD ($)
Holding
|
|---|
| Shareholder Report [Line Items] |
|
| Document Type |
N-CSR
|
| Amendment Flag |
false
|
| Registrant Name |
WisdomTree Trust
|
| Entity Central Index Key |
0001350487
|
| Entity Investment Company Type |
N-1A
|
| Document Period End Date |
Jun. 30, 2025
|
| C000232397 |
|
| Shareholder Report [Line Items] |
|
| Fund Name |
WisdomTree Artificial Intelligence and Innovation Fund
|
| Trading Symbol |
WTAI
|
| Annual or Semi-Annual Statement [Text Block] |
This annual shareholder report contains important information about the WisdomTree Artificial Intelligence and Innovation Fund (the "Fund") for the period of July 1, 2024 to June 30, 2025.
|
| Shareholder Report Annual or Semi-Annual |
Annual Shareholder Report
|
| Additional Information [Text Block] |
You can find additional information about the Fund at www.wisdomtree.com/investments/regulatory. You can also request this information by contacting us at 1-866-909-WISE (9473).
|
| Additional Information Phone Number |
1-866-909-WISE (9473)
|
| Additional Information Website |
<span style="box-sizing: border-box; color: rgb(0, 0, 0); display: inline; flex-wrap: nowrap; font-size: 10.6667px; font-weight: 400; grid-area: auto; line-height: 10.6667px; margin: 0px; overflow: visible; text-align: left; text-align-last: auto; white-space-collapse: preserve-breaks;">www.wisdomtree.com/investments/regulatory</span>
|
| Expenses [Text Block] |
What were the Fund's costs for the last year?(based on a hypothetical $10,000 investment) Fund Name | Costs of a $10,000 investment | Costs paid as a percentage of a $10,000 investment |
|---|
WisdomTree Artificial Intelligence and Innovation Fund | $49 | 0.45% |
|---|
|
| Expenses Paid, Amount |
$ 49
|
| Expense Ratio, Percent |
0.45%
|
| Performance Past Does Not Indicate Future [Text] |
The Fund's past performance is not a good predictor of future results. The performance shown in the following graph and table do not reflect the deduction of taxes that a shareholder would pay on Fund distributions or on the redemption of Fund shares. For the most recent performance information visit
|
| Line Graph [Table Text Block] |
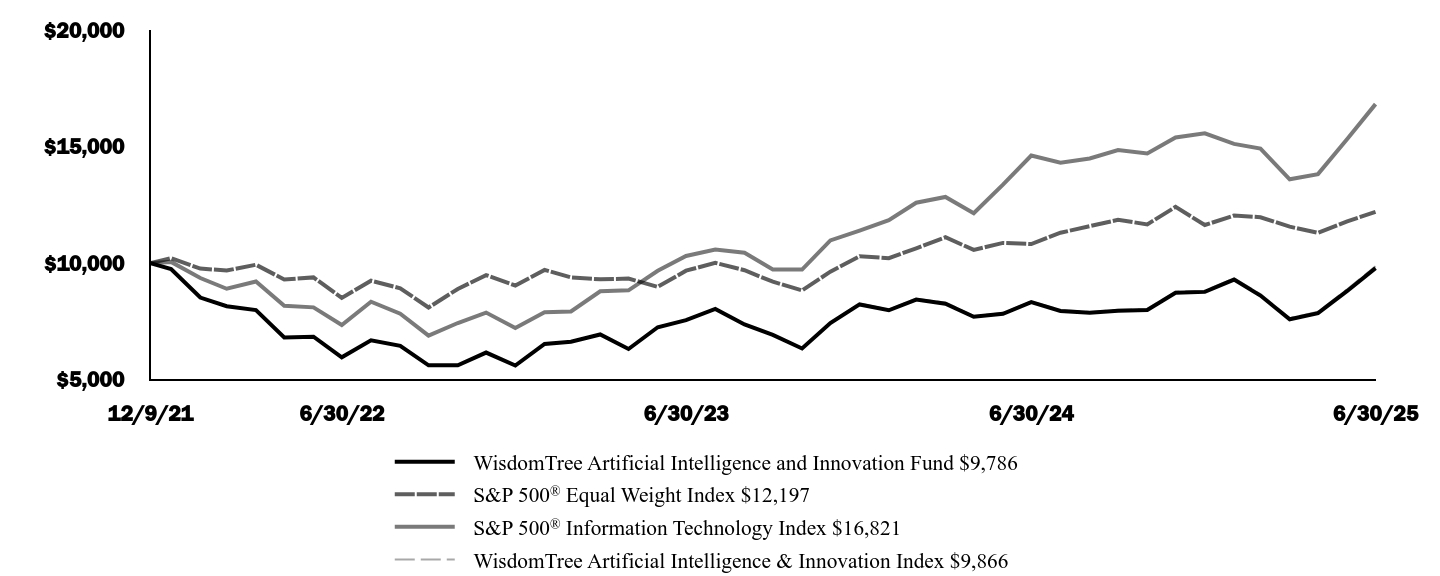 | WisdomTree Artificial Intelligence and Innovation Fund $9,786 | S&P 500® Equal Weight Index $12,197 | S&P 500® Information Technology Index $16,821
| WisdomTree Artificial Intelligence & Innovation Index $9,866
|
|---|
12/9/21 | $10,000 | $10,000 | $10,000 | $10,000 |
|---|
12/31/21 | $9,746 | $10,211 | $10,054 | $9,743 |
|---|
1/31/22 | $8,525 | $9,767 | $9,362 | $8,523 |
|---|
2/28/22 | $8,152 | $9,683 | $8,903 | $8,148 |
|---|
3/31/22 | $7,986 | $9,933 | $9,214 | $7,991 |
|---|
4/30/22 | $6,816 | $9,297 | $8,174 | $6,819 |
|---|
5/31/22 | $6,844 | $9,390 | $8,105 | $6,847 |
|---|
6/30/22 | $5,964 | $8,507 | $7,349 | $5,965 |
|---|
7/31/22 | $6,689 | $9,247 | $8,344 | $6,693 |
|---|
8/31/22 | $6,451 | $8,923 | $7,833 | $6,456 |
|---|
9/30/22 | $5,619 | $8,099 | $6,893 | $5,624 |
|---|
10/31/22 | $5,623 | $8,893 | $7,432 | $5,632 |
|---|
11/30/22 | $6,166 | $9,488 | $7,880 | $6,177 |
|---|
12/31/22 | $5,611 | $9,042 | $7,220 | $5,620 |
|---|
1/31/23 | $6,533 | $9,710 | $7,893 | $6,544 |
|---|
2/28/23 | $6,628 | $9,390 | $7,928 | $6,637 |
|---|
3/31/23 | $6,942 | $9,307 | $8,795 | $6,955 |
|---|
4/30/23 | $6,318 | $9,338 | $8,835 | $6,329 |
|---|
5/31/23 | $7,252 | $8,985 | $9,671 | $7,261 |
|---|
6/30/23 | $7,558 | $9,678 | $10,308 | $7,572 |
|---|
7/31/23 | $8,039 | $10,012 | $10,584 | $8,056 |
|---|
8/31/23 | $7,371 | $9,696 | $10,444 | $7,389 |
|---|
9/30/23 | $6,922 | $9,204 | $9,726 | $6,939 |
|---|
10/31/23 | $6,342 | $8,829 | $9,724 | $6,356 |
|---|
11/30/23 | $7,431 | $9,635 | $10,975 | $7,456 |
|---|
12/31/23 | $8,230 | $10,296 | $11,396 | $8,266 |
|---|
1/31/24 | $7,979 | $10,211 | $11,846 | $8,013 |
|---|
2/29/24 | $8,437 | $10,637 | $12,593 | $8,470 |
|---|
3/31/24 | $8,262 | $11,111 | $12,841 | $8,314 |
|---|
4/30/24 | $7,700 | $10,570 | $12,144 | $7,733 |
|---|
5/31/24 | $7,828 | $10,868 | $13,368 | $7,861 |
|---|
6/30/24 | $8,326 | $10,819 | $14,614 | $8,361 |
|---|
7/31/24 | $7,951 | $11,304 | $14,309 | $7,990 |
|---|
8/31/24 | $7,871 | $11,586 | $14,489 | $7,909 |
|---|
9/30/24 | $7,959 | $11,857 | $14,849 | $7,999 |
|---|
10/31/24 | $7,995 | $11,664 | $14,705 | $8,038 |
|---|
11/30/24 | $8,728 | $12,413 | $15,390 | $8,778 |
|---|
12/31/24 | $8,768 | $11,636 | $15,568 | $8,818 |
|---|
1/31/25 | $9,295 | $12,043 | $15,115 | $9,355 |
|---|
2/28/25 | $8,612 | $11,970 | $14,915 | $8,670 |
|---|
3/31/25 | $7,595 | $11,565 | $13,598 | $7,643 |
|---|
4/30/25 | $7,858 | $11,300 | $13,818 | $7,917 |
|---|
5/31/25 | $8,808 | $11,792 | $15,323 | $8,878 |
|---|
6/30/25 | $9,786 | $12,197 | $16,821 | $9,866 |
|---|
|
| Average Annual Return [Table Text Block] |
Average Annual Total Returns (%) | 1 Year | Since
Inception
12/9/21 |
|---|
Fund NAV Returns | 17.54% | -0.61% |
|---|
S&P 500® Equal Weight Index | 12.73% | 5.73% |
|---|
S&P 500® Information Technology Index | 15.10% | 15.72% |
|---|
WisdomTree Artificial Intelligence & Innovation Index | 18.00% | -0.38% |
|---|
|
| AssetsNet |
$ 210,876,086
|
| Holdings Count | Holding |
71
|
| Advisory Fees Paid, Amount |
$ 922,228
|
| InvestmentCompanyPortfolioTurnover |
32.00%
|
| Additional Fund Statistics [Text Block] |
- Total Net Assets$210,876,086
- # of Portfolio Holdings71
- Portfolio Turnover Rate32%
- Investment Advisory Fees Paid, Net$922,228
|
| Holdings [Text Block] |
Sector Breakdown (% of Net Assets)Information Technology | 77.8% |
|---|
Communication Services | 7.3% |
|---|
Consumer Discretionary | 6.7% |
|---|
Industrials | 5.1% |
|---|
Health Care | 2.1% |
|---|
Consumer Staples | 0.9% |
|---|
Other Assets and Liabilities, Net | 0.1% |
|---|
Total | 100.0% |
|---|
|
| Largest Holdings [Text Block] |
Top 10 Holdings (% of Net Assets)Broadcom, Inc. | 3.9% |
|---|
Palantir Technologies, Inc. | 3.6% |
|---|
NVIDIA Corp. | 3.4% |
|---|
SK Hynix, Inc. | 3.0% |
|---|
Meta Platforms, Inc. | 3.0% |
|---|
Taiwan Semiconductor Manufacturing Co. Ltd. | 2.8% |
|---|
Cloudflare, Inc. | 2.7% |
|---|
Zscaler, Inc. | 2.4% |
|---|
ARM Holdings PLC | 2.3% |
|---|
Crowdstrike Holdings, Inc. | 2.3% |
|---|
|
| Material Fund Change [Text Block] |
|
| Updated Prospectus Phone Number |
1-866-909-WISE (9473)
|
| Updated Prospectus Web Address |
<span style="box-sizing: border-box; color: rgb(0, 0, 0); display: inline; flex-wrap: nowrap; font-size: 10.6667px; font-weight: 400; grid-area: auto; line-height: 10.6667px; margin: 0px; overflow: visible; text-align: left; text-align-last: auto; white-space-collapse: preserve-breaks;">www.wisdomtree.com/investments/regulatory</span>
|
| C000227588 |
|
| Shareholder Report [Line Items] |
|
| Fund Name |
WisdomTree BioRevolution Fund
|
| Trading Symbol |
WDNA
|
| Annual or Semi-Annual Statement [Text Block] |
This annual shareholder report contains important information about the WisdomTree BioRevolution Fund (the "Fund") for the period of July 1, 2024 to June 30, 2025.
|
| Shareholder Report Annual or Semi-Annual |
Annual Shareholder Report
|
| Additional Information [Text Block] |
You can find additional information about the Fund at www.wisdomtree.com/investments/regulatory. You can also request this information by contacting us at 1-866-909-WISE (9473).
|
| Additional Information Phone Number |
1-866-909-WISE (9473)
|
| Additional Information Website |
<span style="box-sizing: border-box; color: rgb(0, 0, 0); display: inline; flex-wrap: nowrap; font-size: 10.6667px; font-weight: 400; grid-area: auto; line-height: 10.6667px; margin: 0px; overflow: visible; text-align: left; text-align-last: auto; white-space-collapse: preserve-breaks;">www.wisdomtree.com/investments/regulatory</span>
|
| Expenses [Text Block] |
What were the Fund's costs for the last year?(based on a hypothetical $10,000 investment) Fund Name | Costs of a $10,000 investment | Costs paid as a percentage of a $10,000 investment |
|---|
WisdomTree BioRevolution Fund | $42 | 0.45% |
|---|
|
| Expenses Paid, Amount |
$ 42
|
| Expense Ratio, Percent |
0.45%
|
| Performance Past Does Not Indicate Future [Text] |
The Fund's past performance is not a good predictor of future results. The performance shown in the following graph and table do not reflect the deduction of taxes that a shareholder would pay on Fund distributions or on the redemption of Fund shares. For the most recent performance information visit
|
| Line Graph [Table Text Block] |
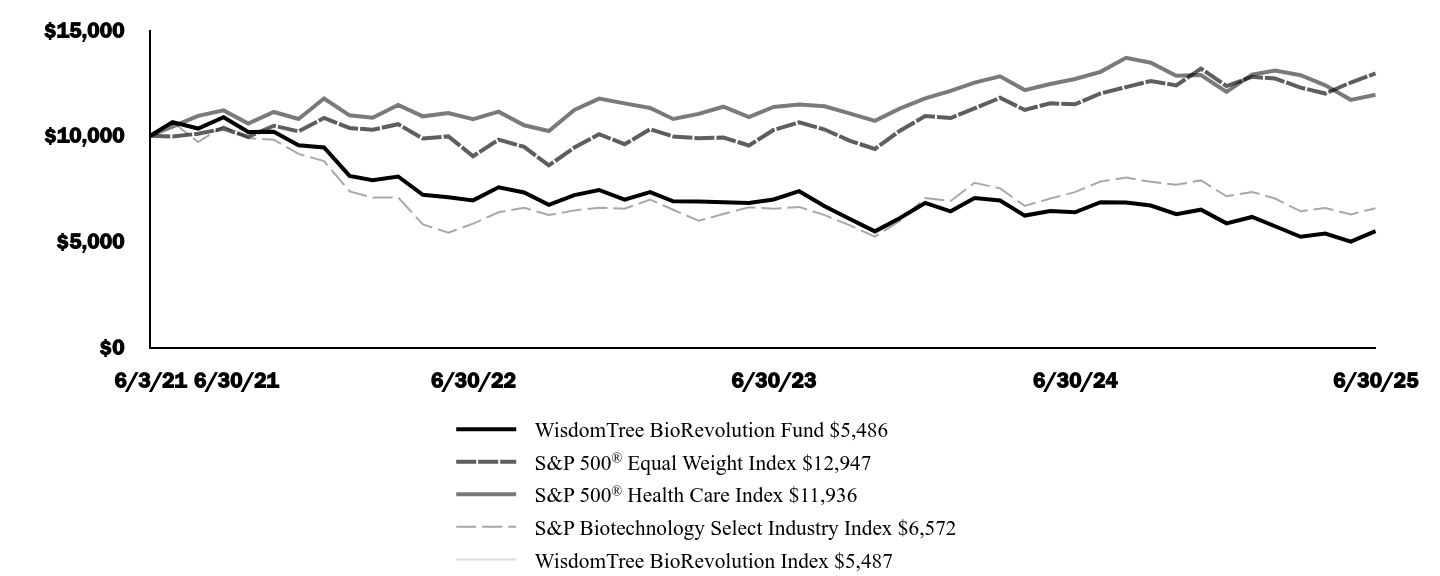 | WisdomTree BioRevolution Fund $5,486 | S&P 500® Equal Weight Index $12,947 | S&P 500® Health Care Index $11,936
| S&P Biotechnology Select Industry Index $6,572
| WisdomTree BioRevolution Index $5,487
|
|---|
6/3/21 | $10,000 | $10,000 | $10,000 | $10,000 | $10,000 |
|---|
6/30/21 | $10,647 | $9,965 | $10,428 | $10,648 | $10,652 |
|---|
7/31/21 | $10,340 | $10,093 | $10,939 | $9,701 | $10,348 |
|---|
8/31/21 | $10,875 | $10,334 | $11,198 | $10,449 | $10,886 |
|---|
9/30/21 | $10,176 | $9,943 | $10,577 | $9,882 | $10,186 |
|---|
10/31/21 | $10,188 | $10,472 | $11,123 | $9,807 | $10,203 |
|---|
11/30/21 | $9,553 | $10,206 | $10,790 | $9,142 | $9,576 |
|---|
12/31/21 | $9,442 | $10,838 | $11,759 | $8,800 | $9,462 |
|---|
1/31/22 | $8,099 | $10,367 | $10,965 | $7,368 | $8,120 |
|---|
2/28/22 | $7,891 | $10,279 | $10,853 | $7,075 | $7,911 |
|---|
3/31/22 | $8,071 | $10,544 | $11,456 | $7,080 | $8,092 |
|---|
4/30/22 | $7,207 | $9,868 | $10,917 | $5,808 | $7,228 |
|---|
5/31/22 | $7,087 | $9,967 | $11,074 | $5,416 | $7,106 |
|---|
6/30/22 | $6,943 | $9,030 | $10,779 | $5,842 | $6,962 |
|---|
7/31/22 | $7,559 | $9,815 | $11,137 | $6,382 | $7,573 |
|---|
8/31/22 | $7,315 | $9,472 | $10,493 | $6,592 | $7,334 |
|---|
9/30/22 | $6,731 | $8,597 | $10,221 | $6,249 | $6,749 |
|---|
10/31/22 | $7,191 | $9,440 | $11,214 | $6,469 | $7,213 |
|---|
11/30/22 | $7,435 | $10,072 | $11,754 | $6,598 | $7,459 |
|---|
12/31/22 | $6,981 | $9,598 | $11,529 | $6,545 | $7,006 |
|---|
1/31/23 | $7,334 | $10,307 | $11,314 | $6,986 | $7,364 |
|---|
2/28/23 | $6,901 | $9,967 | $10,793 | $6,499 | $6,923 |
|---|
3/31/23 | $6,889 | $9,879 | $11,033 | $5,976 | $6,905 |
|---|
4/30/23 | $6,853 | $9,912 | $11,372 | $6,300 | $6,873 |
|---|
5/31/23 | $6,824 | $9,537 | $10,884 | $6,616 | $6,838 |
|---|
6/30/23 | $6,985 | $10,273 | $11,358 | $6,550 | $6,996 |
|---|
7/31/23 | $7,378 | $10,628 | $11,474 | $6,633 | $7,390 |
|---|
8/31/23 | $6,668 | $10,293 | $11,395 | $6,245 | $6,675 |
|---|
9/30/23 | $6,070 | $9,770 | $11,057 | $5,773 | $6,074 |
|---|
10/31/23 | $5,476 | $9,372 | $10,702 | $5,229 | $5,479 |
|---|
11/30/23 | $6,098 | $10,228 | $11,281 | $5,965 | $6,102 |
|---|
12/31/23 | $6,822 | $10,929 | $11,766 | $7,053 | $6,822 |
|---|
1/31/24 | $6,426 | $10,839 | $12,121 | $6,912 | $6,426 |
|---|
2/29/24 | $7,057 | $11,291 | $12,511 | $7,772 | $7,056 |
|---|
3/31/24 | $6,940 | $11,794 | $12,808 | $7,510 | $6,938 |
|---|
4/30/24 | $6,223 | $11,220 | $12,157 | $6,680 | $6,220 |
|---|
5/31/24 | $6,438 | $11,536 | $12,447 | $7,032 | $6,437 |
|---|
6/30/24 | $6,381 | $11,484 | $12,685 | $7,332 | $6,379 |
|---|
7/31/24 | $6,855 | $11,999 | $13,021 | $7,833 | $6,852 |
|---|
8/31/24 | $6,847 | $12,299 | $13,686 | $8,018 | $6,841 |
|---|
9/30/24 | $6,697 | $12,586 | $13,455 | $7,827 | $6,693 |
|---|
10/31/24 | $6,292 | $12,382 | $12,833 | $7,680 | $6,289 |
|---|
11/30/24 | $6,503 | $13,177 | $12,870 | $7,887 | $6,502 |
|---|
12/31/24 | $5,857 | $12,351 | $12,070 | $7,136 | $5,859 |
|---|
1/31/25 | $6,159 | $12,784 | $12,889 | $7,341 | $6,159 |
|---|
2/28/25 | $5,719 | $12,706 | $13,081 | $7,030 | $5,720 |
|---|
3/31/25 | $5,221 | $12,276 | $12,859 | $6,426 | $5,219 |
|---|
4/30/25 | $5,372 | $11,995 | $12,383 | $6,579 | $5,368 |
|---|
5/31/25 | $4,993 | $12,517 | $11,696 | $6,277 | $4,989 |
|---|
6/30/25 | $5,486 | $12,947 | $11,936 | $6,572 | $5,487 |
|---|
|
| Average Annual Return [Table Text Block] |
Average Annual Total Returns (%) | 1 Year | Since
Inception
6/3/21 |
|---|
Fund NAV Returns | -14.02% | -13.69% |
|---|
S&P 500® Equal Weight Index | 12.73% | 6.54% |
|---|
S&P 500® Health Care Index | -5.90% | 4.43% |
|---|
S&P Biotechnology Select Industry Index | -10.36% | -9.78% |
|---|
WisdomTree BioRevolution Index | -13.98% | -13.68% |
|---|
|
| AssetsNet |
$ 2,018,772
|
| Holdings Count | Holding |
91
|
| Advisory Fees Paid, Amount |
$ 9,971
|
| InvestmentCompanyPortfolioTurnover |
32.00%
|
| Additional Fund Statistics [Text Block] |
- Total Net Assets$2,018,772
- # of Portfolio Holdings91
- Portfolio Turnover Rate32%
- Investment Advisory Fees Paid, Net$9,971
|
| Holdings [Text Block] |
Sector Breakdown (% of Net Assets)Health Care | 88.5% |
|---|
Materials | 9.3% |
|---|
Consumer Staples | 1.5% |
|---|
Energy | 0.6% |
|---|
Other Assets and Liabilities, Net | 0.1% |
|---|
Total | 100.0% |
|---|
|
| Largest Holdings [Text Block] |
Top 10 Holdings (% of Net Assets)Verve Therapeutics, Inc. | 5.5% |
|---|
Ginkgo Bioworks Holdings, Inc. | 2.7% |
|---|
Novonesis Novozymes | 2.6% |
|---|
Natera, Inc. | 2.6% |
|---|
CRISPR Therapeutics AG | 2.6% |
|---|
Intellia Therapeutics, Inc. | 2.5% |
|---|
Twist Bioscience Corp. | 2.2% |
|---|
Eli Lilly & Co. | 2.2% |
|---|
Agios Pharmaceuticals, Inc. | 1.9% |
|---|
Gilead Sciences, Inc. | 1.9% |
|---|
|
| Material Fund Change [Text Block] |
|
| Updated Prospectus Phone Number |
1-866-909-WISE (9473)
|
| Updated Prospectus Web Address |
<span style="box-sizing: border-box; color: rgb(0, 0, 0); display: inline; flex-wrap: nowrap; font-size: 10.6667px; font-weight: 400; grid-area: auto; line-height: 10.6667px; margin: 0px; overflow: visible; text-align: left; text-align-last: auto; white-space-collapse: preserve-breaks;">www.wisdomtree.com/investments/regulatory</span>
|
| C000214236 |
|
| Shareholder Report [Line Items] |
|
| Fund Name |
WisdomTree Cloud Computing Fund
|
| Trading Symbol |
WCLD
|
| Annual or Semi-Annual Statement [Text Block] |
This annual shareholder report contains important information about the WisdomTree Cloud Computing Fund (the "Fund") for the period of July 1, 2024 to June 30, 2025.
|
| Shareholder Report Annual or Semi-Annual |
Annual Shareholder Report
|
| Additional Information [Text Block] |
You can find additional information about the Fund at www.wisdomtree.com/investments/regulatory. You can also request this information by contacting us at 1-866-909-WISE (9473).
|
| Additional Information Phone Number |
1-866-909-WISE (9473)
|
| Additional Information Website |
<span style="box-sizing: border-box; color: rgb(0, 0, 0); display: inline; flex-wrap: nowrap; font-size: 10.6667px; font-weight: 400; grid-area: auto; line-height: 10.6667px; margin: 0px; overflow: visible; text-align: left; text-align-last: auto; white-space-collapse: preserve-breaks;">www.wisdomtree.com/investments/regulatory</span>
|
| Expenses [Text Block] |
What were the Fund's costs for the last year?(based on a hypothetical $10,000 investment) Fund Name | Costs of a $10,000 investment | Costs paid as a percentage of a $10,000 investment |
|---|
WisdomTree Cloud Computing Fund | $48 | 0.45% |
|---|
|
| Expenses Paid, Amount |
$ 48
|
| Expense Ratio, Percent |
0.45%
|
| Performance Past Does Not Indicate Future [Text] |
The Fund's past performance is not a good predictor of future results. The performance shown in the following graph and table do not reflect the deduction of taxes that a shareholder would pay on Fund distributions or on the redemption of Fund shares. For the most recent performance information visit
|
| Line Graph [Table Text Block] |
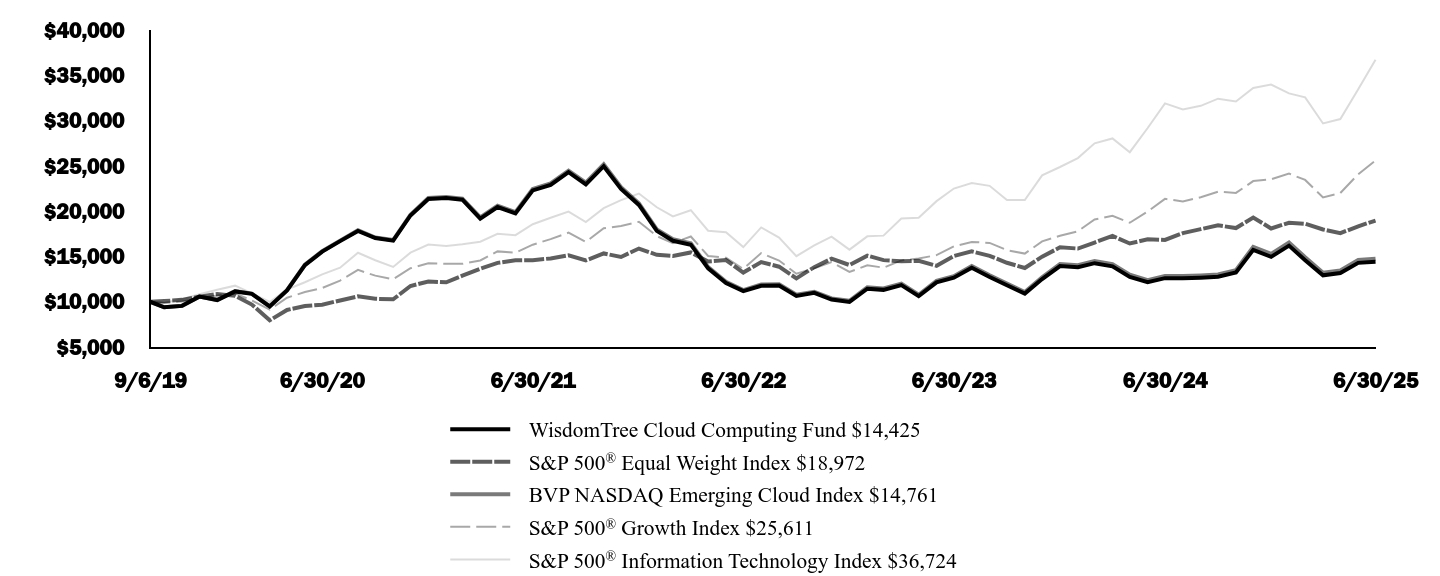 | WisdomTree Cloud Computing Fund $14,425 | S&P 500® Equal Weight Index $18,972 | BVP NASDAQ Emerging Cloud Index $14,761
| S&P 500® Growth Index $25,611
| S&P 500® Information Technology Index $36,724
|
|---|
9/6/19 | $10,000 | $10,000 | $10,000 | $10,000 | $10,000 |
|---|
9/30/19 | $9,401 | $10,091 | $9,407 | $9,869 | $9,912 |
|---|
10/31/19 | $9,557 | $10,220 | $9,565 | $10,041 | $10,298 |
|---|
11/30/19 | $10,575 | $10,565 | $10,594 | $10,385 | $10,852 |
|---|
12/31/19 | $10,200 | $10,859 | $10,225 | $10,690 | $11,340 |
|---|
1/31/20 | $11,153 | $10,661 | $11,185 | $10,932 | $11,789 |
|---|
2/29/20 | $10,886 | $9,704 | $10,919 | $10,151 | $10,931 |
|---|
3/31/20 | $9,489 | $7,960 | $9,509 | $9,139 | $9,987 |
|---|
4/30/20 | $11,269 | $9,110 | $11,295 | $10,460 | $11,365 |
|---|
5/31/20 | $14,054 | $9,539 | $14,094 | $11,082 | $12,167 |
|---|
6/30/20 | $15,547 | $9,689 | $15,593 | $11,537 | $13,035 |
|---|
7/31/20 | $16,700 | $10,158 | $16,755 | $12,344 | $13,768 |
|---|
8/31/20 | $17,829 | $10,612 | $17,898 | $13,525 | $15,421 |
|---|
9/30/20 | $17,043 | $10,343 | $17,102 | $12,893 | $14,594 |
|---|
10/31/20 | $16,752 | $10,280 | $16,819 | $12,496 | $13,849 |
|---|
11/30/20 | $19,533 | $11,750 | $19,619 | $13,708 | $15,432 |
|---|
12/31/20 | $21,361 | $12,252 | $21,468 | $14,267 | $16,317 |
|---|
1/31/21 | $21,457 | $12,153 | $21,574 | $14,195 | $16,167 |
|---|
2/28/21 | $21,269 | $12,892 | $21,378 | $14,195 | $16,362 |
|---|
3/31/21 | $19,190 | $13,660 | $19,316 | $14,570 | $16,639 |
|---|
4/30/21 | $20,463 | $14,307 | $20,603 | $15,571 | $17,515 |
|---|
5/31/21 | $19,753 | $14,582 | $19,896 | $15,432 | $17,356 |
|---|
6/30/21 | $22,302 | $14,603 | $22,471 | $16,309 | $18,562 |
|---|
7/31/21 | $22,897 | $14,791 | $23,066 | $16,927 | $19,279 |
|---|
8/31/21 | $24,318 | $15,144 | $24,483 | $17,635 | $19,966 |
|---|
9/30/21 | $22,973 | $14,570 | $23,145 | $16,614 | $18,811 |
|---|
10/31/21 | $24,972 | $15,346 | $25,167 | $18,122 | $20,348 |
|---|
11/30/21 | $22,454 | $14,956 | $22,640 | $18,380 | $21,233 |
|---|
12/31/21 | $20,698 | $15,883 | $20,879 | $18,835 | $21,951 |
|---|
1/31/22 | $17,837 | $15,192 | $17,997 | $17,258 | $20,440 |
|---|
2/28/22 | $16,744 | $15,062 | $16,904 | $16,482 | $19,438 |
|---|
3/31/22 | $16,309 | $15,451 | $16,468 | $17,216 | $20,117 |
|---|
4/30/22 | $13,703 | $14,461 | $13,838 | $15,068 | $17,847 |
|---|
5/31/22 | $12,083 | $14,606 | $12,206 | $14,863 | $17,695 |
|---|
6/30/22 | $11,185 | $13,233 | $11,305 | $13,633 | $16,045 |
|---|
7/31/22 | $11,776 | $14,384 | $11,908 | $15,381 | $18,217 |
|---|
8/31/22 | $11,808 | $13,880 | $11,944 | $14,560 | $17,102 |
|---|
9/30/22 | $10,654 | $12,598 | $10,778 | $13,107 | $15,049 |
|---|
10/31/22 | $10,990 | $13,833 | $11,120 | $13,696 | $16,225 |
|---|
11/30/22 | $10,255 | $14,759 | $10,380 | $14,393 | $17,203 |
|---|
12/31/22 | $9,996 | $14,065 | $10,121 | $13,296 | $15,762 |
|---|
1/31/23 | $11,453 | $15,104 | $11,599 | $14,044 | $17,231 |
|---|
2/28/23 | $11,325 | $14,606 | $11,476 | $13,772 | $17,309 |
|---|
3/31/23 | $11,848 | $14,477 | $12,006 | $14,577 | $19,201 |
|---|
4/30/23 | $10,634 | $14,526 | $10,781 | $14,785 | $19,289 |
|---|
5/31/23 | $12,159 | $13,976 | $12,328 | $15,155 | $21,114 |
|---|
6/30/23 | $12,662 | $15,054 | $12,839 | $16,121 | $22,505 |
|---|
7/31/23 | $13,759 | $15,574 | $13,957 | $16,612 | $23,108 |
|---|
8/31/23 | $12,741 | $15,083 | $12,928 | $16,509 | $22,802 |
|---|
9/30/23 | $11,832 | $14,317 | $12,011 | $15,704 | $21,234 |
|---|
10/31/23 | $10,910 | $13,733 | $11,076 | $15,326 | $21,230 |
|---|
11/30/23 | $12,514 | $14,988 | $12,710 | $16,670 | $23,962 |
|---|
12/31/23 | $13,955 | $16,016 | $14,180 | $17,290 | $24,880 |
|---|
1/31/24 | $13,819 | $15,884 | $14,048 | $17,790 | $25,862 |
|---|
2/29/24 | $14,270 | $16,545 | $14,518 | $19,088 | $27,494 |
|---|
3/31/24 | $13,915 | $17,283 | $14,164 | $19,494 | $28,036 |
|---|
4/30/24 | $12,761 | $16,442 | $12,993 | $18,733 | $26,514 |
|---|
5/31/24 | $12,163 | $16,906 | $12,387 | $19,970 | $29,186 |
|---|
6/30/24 | $12,614 | $16,829 | $12,850 | $21,364 | $31,906 |
|---|
7/31/24 | $12,602 | $17,584 | $12,845 | $21,085 | $31,241 |
|---|
8/31/24 | $12,670 | $18,023 | $12,917 | $21,547 | $31,633 |
|---|
9/30/24 | $12,765 | $18,444 | $13,019 | $22,159 | $32,420 |
|---|
10/31/24 | $13,236 | $18,144 | $13,505 | $22,019 | $32,106 |
|---|
11/30/24 | $15,734 | $19,309 | $16,066 | $23,327 | $33,599 |
|---|
12/31/24 | $14,968 | $18,099 | $15,286 | $23,527 | $33,988 |
|---|
1/31/25 | $16,205 | $18,733 | $16,558 | $24,158 | $33,001 |
|---|
2/28/25 | $14,597 | $18,619 | $14,917 | $23,455 | $32,563 |
|---|
3/31/25 | $12,929 | $17,989 | $13,215 | $21,533 | $29,687 |
|---|
4/30/25 | $13,176 | $17,578 | $13,474 | $22,014 | $30,169 |
|---|
5/31/25 | $14,306 | $18,342 | $14,631 | $24,085 | $33,455 |
|---|
6/30/25 | $14,425 | $18,972 | $14,761 | $25,611 | $36,724 |
|---|
|
| Average Annual Return [Table Text Block] |
Average Annual Total Returns (%) | 1 Year | 5 Years | Since
Inception
9/6/19 |
|---|
Fund NAV Returns | 14.36% | -1.49% | 6.50% |
|---|
S&P 500® Equal Weight Index | 12.73% | 14.38% | 11.63% |
|---|
BVP NASDAQ Emerging Cloud Index | 14.87% | -1.09% | 6.92% |
|---|
S&P 500® Growth Index | 19.88% | 17.29% | 17.54% |
|---|
S&P 500® Information Technology Index | 15.10% | 23.02% | 25.05% |
|---|
|
| AssetsNet |
$ 377,782,583
|
| Holdings Count | Holding |
69
|
| Advisory Fees Paid, Amount |
$ 1,954,854
|
| InvestmentCompanyPortfolioTurnover |
39.00%
|
| Additional Fund Statistics [Text Block] |
- Total Net Assets$377,782,583
- # of Portfolio Holdings69
- Portfolio Turnover Rate39%
- Investment Advisory Fees Paid, Net$1,954,854
|
| Holdings [Text Block] |
Sector Breakdown (% of Net Assets)Information Technology | 88.7% |
|---|
Financials | 4.9% |
|---|
Industrials | 4.3% |
|---|
Health Care | 2.0% |
|---|
Other Assets and Liabilities, Net | 0.1% |
|---|
Total | 100.0% |
|---|
|
| Largest Holdings [Text Block] |
Top 10 Holdings (% of Net Assets)Zscaler, Inc. | 2.4% |
|---|
Palantir Technologies, Inc. | 2.1% |
|---|
Olo, Inc. | 2.0% |
|---|
Cloudflare, Inc. | 2.0% |
|---|
Rubrik, Inc. | 2.0% |
|---|
Veeva Systems, Inc. | 2.0% |
|---|
Snowflake, Inc. | 1.9% |
|---|
Crowdstrike Holdings, Inc. | 1.9% |
|---|
Toast, Inc. | 1.8% |
|---|
BlackLine, Inc. | 1.8% |
|---|
|
| Material Fund Change [Text Block] |
|
| Updated Prospectus Phone Number |
1-866-909-WISE (9473)
|
| Updated Prospectus Web Address |
<span style="box-sizing: border-box; color: rgb(0, 0, 0); display: inline; flex-wrap: nowrap; font-size: 10.6667px; font-weight: 400; grid-area: auto; line-height: 10.6667px; margin: 0px; overflow: visible; text-align: left; text-align-last: auto; white-space-collapse: preserve-breaks;">www.wisdomtree.com/investments/regulatory</span>
|
| C000224004 |
|
| Shareholder Report [Line Items] |
|
| Fund Name |
WisdomTree Cybersecurity Fund
|
| Trading Symbol |
WCBR
|
| Annual or Semi-Annual Statement [Text Block] |
This annual shareholder report contains important information about the WisdomTree Cybersecurity Fund (the "Fund") for the period of July 1, 2024 to June 30, 2025.
|
| Shareholder Report Annual or Semi-Annual |
Annual Shareholder Report
|
| Additional Information [Text Block] |
You can find additional information about the Fund at www.wisdomtree.com/investments/regulatory. You can also request this information by contacting us at 1-866-909-WISE (9473).
|
| Additional Information Phone Number |
1-866-909-WISE (9473)
|
| Additional Information Website |
<span style="box-sizing: border-box; color: rgb(0, 0, 0); display: inline; flex-wrap: nowrap; font-size: 10.6667px; font-weight: 400; grid-area: auto; line-height: 10.6667px; margin: 0px; overflow: visible; text-align: left; text-align-last: auto; white-space-collapse: preserve-breaks;">www.wisdomtree.com/investments/regulatory</span>
|
| Expenses [Text Block] |
What were the Fund's costs for the last year?(based on a hypothetical $10,000 investment) Fund Name | Costs of a $10,000 investment | Costs paid as a percentage of a $10,000 investment |
|---|
WisdomTree Cybersecurity Fund | $51 | 0.45% |
|---|
|
| Expenses Paid, Amount |
$ 51
|
| Expense Ratio, Percent |
0.45%
|
| Performance Past Does Not Indicate Future [Text] |
The Fund's past performance is not a good predictor of future results. The performance shown in the following graph and table do not reflect the deduction of taxes that a shareholder would pay on Fund distributions or on the redemption of Fund shares. For the most recent performance information visit
|
| Line Graph [Table Text Block] |
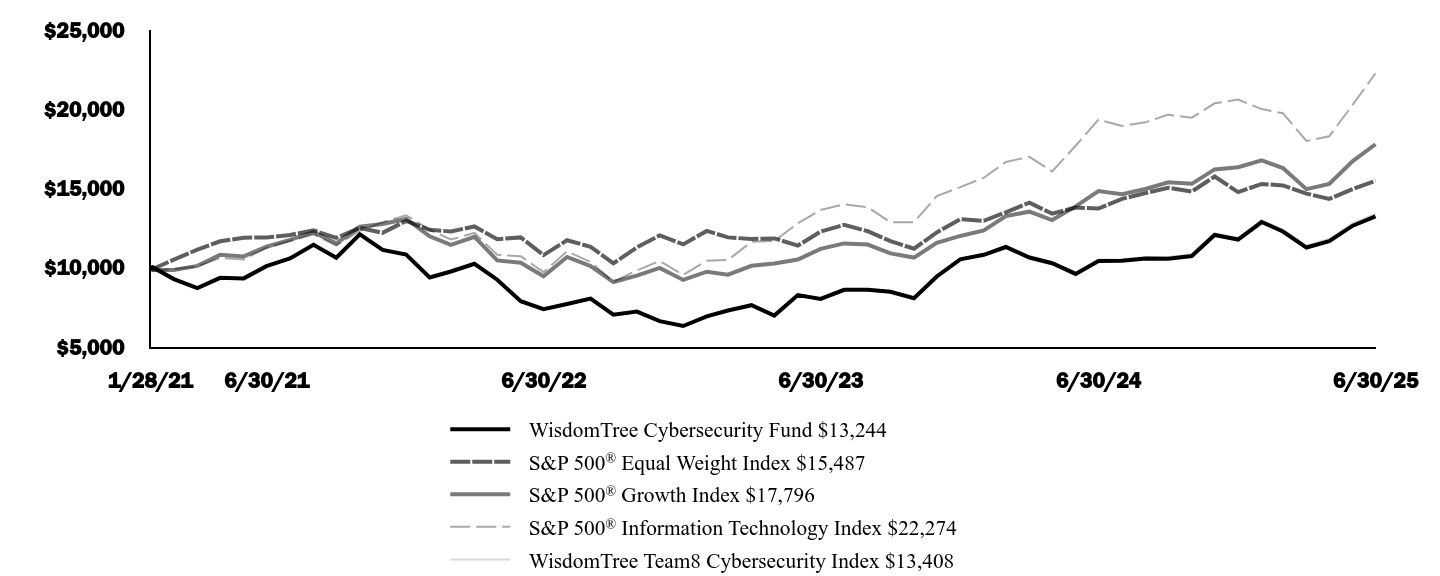 | WisdomTree Cybersecurity Fund $13,244 | S&P 500® Equal Weight Index $15,487 | S&P 500® Growth Index $17,796
| S&P 500® Information Technology Index $22,274
| WisdomTree Team8 Cybersecurity Index $13,408
|
|---|
1/28/21 | $10,000 | $10,000 | $10,000 | $10,000 | $10,000 |
|---|
1/31/21 | $10,046 | $9,921 | $9,863 | $9,806 | $10,048 |
|---|
2/28/21 | $9,293 | $10,524 | $9,863 | $9,924 | $9,302 |
|---|
3/31/21 | $8,730 | $11,151 | $10,124 | $10,092 | $8,741 |
|---|
4/30/21 | $9,371 | $11,679 | $10,820 | $10,623 | $9,387 |
|---|
5/31/21 | $9,338 | $11,903 | $10,723 | $10,526 | $9,358 |
|---|
6/30/21 | $10,108 | $11,920 | $11,332 | $11,258 | $10,135 |
|---|
7/31/21 | $10,592 | $12,074 | $11,762 | $11,693 | $10,622 |
|---|
8/31/21 | $11,456 | $12,362 | $12,253 | $12,110 | $11,501 |
|---|
9/30/21 | $10,645 | $11,894 | $11,544 | $11,409 | $10,696 |
|---|
10/31/21 | $12,114 | $12,527 | $12,592 | $12,341 | $12,176 |
|---|
11/30/21 | $11,134 | $12,208 | $12,771 | $12,878 | $11,194 |
|---|
12/31/21 | $10,840 | $12,965 | $13,087 | $13,313 | $10,901 |
|---|
1/31/22 | $9,394 | $12,401 | $11,992 | $12,397 | $9,440 |
|---|
2/28/22 | $9,772 | $12,295 | $11,453 | $11,789 | $9,836 |
|---|
3/31/22 | $10,258 | $12,613 | $11,963 | $12,201 | $10,323 |
|---|
4/30/22 | $9,253 | $11,805 | $10,470 | $10,824 | $9,315 |
|---|
5/31/22 | $7,903 | $11,923 | $10,328 | $10,732 | $7,953 |
|---|
6/30/22 | $7,400 | $10,802 | $9,473 | $9,731 | $7,447 |
|---|
7/31/22 | $7,724 | $11,741 | $10,688 | $11,049 | $7,777 |
|---|
8/31/22 | $8,065 | $11,330 | $10,117 | $10,373 | $8,123 |
|---|
9/30/22 | $7,051 | $10,284 | $9,107 | $9,127 | $7,093 |
|---|
10/31/22 | $7,246 | $11,292 | $9,516 | $9,841 | $7,296 |
|---|
11/30/22 | $6,640 | $12,048 | $10,001 | $10,434 | $6,654 |
|---|
12/31/22 | $6,334 | $11,481 | $9,239 | $9,560 | $6,350 |
|---|
1/31/23 | $6,941 | $12,330 | $9,758 | $10,451 | $6,962 |
|---|
2/28/23 | $7,311 | $11,923 | $9,569 | $10,498 | $7,335 |
|---|
3/31/23 | $7,647 | $11,818 | $10,129 | $11,646 | $7,675 |
|---|
4/30/23 | $6,990 | $11,857 | $10,273 | $11,699 | $7,015 |
|---|
5/31/23 | $8,283 | $11,408 | $10,530 | $12,806 | $8,318 |
|---|
6/30/23 | $8,042 | $12,289 | $11,202 | $13,649 | $8,079 |
|---|
7/31/23 | $8,620 | $12,713 | $11,543 | $14,015 | $8,662 |
|---|
8/31/23 | $8,620 | $12,312 | $11,471 | $13,829 | $8,665 |
|---|
9/30/23 | $8,491 | $11,687 | $10,912 | $12,879 | $8,541 |
|---|
10/31/23 | $8,088 | $11,210 | $10,649 | $12,876 | $8,137 |
|---|
11/30/23 | $9,459 | $12,235 | $11,583 | $14,533 | $9,521 |
|---|
12/31/23 | $10,540 | $13,074 | $12,014 | $15,090 | $10,575 |
|---|
1/31/24 | $10,827 | $12,966 | $12,361 | $15,686 | $10,867 |
|---|
2/29/24 | $11,317 | $13,506 | $13,263 | $16,675 | $11,408 |
|---|
3/31/24 | $10,656 | $14,108 | $13,545 | $17,004 | $10,751 |
|---|
4/30/24 | $10,295 | $13,422 | $13,016 | $16,081 | $10,374 |
|---|
5/31/24 | $9,621 | $13,800 | $13,876 | $17,702 | $9,702 |
|---|
6/30/24 | $10,432 | $13,738 | $14,844 | $19,351 | $10,521 |
|---|
7/31/24 | $10,452 | $14,354 | $14,651 | $18,948 | $10,547 |
|---|
8/31/24 | $10,590 | $14,712 | $14,972 | $19,185 | $10,691 |
|---|
9/30/24 | $10,581 | $15,056 | $15,397 | $19,663 | $10,684 |
|---|
10/31/24 | $10,748 | $14,811 | $15,300 | $19,472 | $10,855 |
|---|
11/30/24 | $12,073 | $15,762 | $16,209 | $20,378 | $12,199 |
|---|
12/31/24 | $11,785 | $14,775 | $16,347 | $20,614 | $11,906 |
|---|
1/31/25 | $12,891 | $15,292 | $16,786 | $20,015 | $13,031 |
|---|
2/28/25 | $12,292 | $15,199 | $16,298 | $19,749 | $12,428 |
|---|
3/31/25 | $11,282 | $14,685 | $14,962 | $18,005 | $11,412 |
|---|
4/30/25 | $11,681 | $14,349 | $15,296 | $18,298 | $11,818 |
|---|
5/31/25 | $12,662 | $14,973 | $16,735 | $20,290 | $12,815 |
|---|
6/30/25 | $13,244 | $15,487 | $17,796 | $22,274 | $13,408 |
|---|
|
| Average Annual Return [Table Text Block] |
Average Annual Total Returns (%) | 1 Year | Since
Inception
1/28/21 |
|---|
Fund NAV Returns | 26.96% | 6.56% |
|---|
S&P 500® Equal Weight Index | 12.73% | 10.39% |
|---|
S&P 500® Growth Index | 19.88% | 13.91% |
|---|
S&P 500® Information Technology Index | 15.10% | 19.84% |
|---|
WisdomTree Team8 Cybersecurity Index | 27.44% | 6.85% |
|---|
|
| AssetsNet |
$ 135,065,258
|
| Holdings Count | Holding |
26
|
| Advisory Fees Paid, Amount |
$ 520,791
|
| InvestmentCompanyPortfolioTurnover |
35.00%
|
| Additional Fund Statistics [Text Block] |
- Total Net Assets$135,065,258
- # of Portfolio Holdings26
- Portfolio Turnover Rate35%
- Investment Advisory Fees Paid, Net$520,791
|
| Holdings [Text Block] |
Country Breakdown (% of Net Assets)United States | 90.0% |
|---|
Japan | 4.0% |
|---|
Israel | 3.4% |
|---|
South Korea | 2.5% |
|---|
Other Assets and Liabilities, Net | 0.1% |
|---|
Total | 100.0% |
|---|
|
| Largest Holdings [Text Block] |
Top 10 Holdings (% of Net Assets)Cloudflare, Inc. | 7.2% |
|---|
Zscaler, Inc. | 6.9% |
|---|
Crowdstrike Holdings, Inc. | 6.4% |
|---|
Datadog, Inc. | 5.7% |
|---|
Rubrik, Inc. | 5.4% |
|---|
CyberArk Software Ltd. | 5.3% |
|---|
Palo Alto Networks, Inc. | 4.8% |
|---|
Fortinet, Inc. | 4.7% |
|---|
SentinelOne, Inc. | 4.1% |
|---|
NetApp, Inc. | 4.0% |
|---|
|
| Material Fund Change [Text Block] |
|
| Updated Prospectus Phone Number |
1-866-909-WISE (9473)
|
| Updated Prospectus Web Address |
<span style="box-sizing: border-box; color: rgb(0, 0, 0); display: inline; flex-wrap: nowrap; font-size: 10.6667px; font-weight: 400; grid-area: auto; line-height: 10.6667px; margin: 0px; overflow: visible; text-align: left; text-align-last: auto; white-space-collapse: preserve-breaks;">www.wisdomtree.com/investments/regulatory</span>
|
| C000164637 |
|
| Shareholder Report [Line Items] |
|
| Fund Name |
WisdomTree Dynamic International Equity Fund
|
| Trading Symbol |
DDWM
|
| Annual or Semi-Annual Statement [Text Block] |
This annual shareholder report contains important information about the WisdomTree Dynamic International Equity Fund (the "Fund") (formerly, WisdomTree Dynamic Currency Hedged International Equity Fund) for the period of July 1, 2024 to June 30, 2025.
|
| Shareholder Report Annual or Semi-Annual |
Annual Shareholder Report
|
| Additional Information [Text Block] |
You can find additional information about the Fund at www.wisdomtree.com/investments/regulatory. You can also request this information by contacting us at 1-866-909-WISE (9473).
|
| Material Fund Change Notice [Text Block] |
This report describes changes to the Fund that occurred during the reporting period.
|
| Additional Information Phone Number |
1-866-909-WISE (9473)
|
| Additional Information Website |
<span style="box-sizing: border-box; color: rgb(0, 0, 0); display: inline; flex-wrap: nowrap; font-size: 10.6667px; font-weight: 400; grid-area: auto; line-height: 10.6667px; margin: 0px; overflow: visible; text-align: left; text-align-last: auto; white-space-collapse: preserve-breaks;">www.wisdomtree.com/investments/regulatory</span>
|
| Expenses [Text Block] |
What were the Fund's costs for the last year?(based on a hypothetical $10,000 investment) Fund Name | Costs of a $10,000 investment | Costs paid as a percentage of a $10,000 investment |
|---|
WisdomTree Dynamic International Equity Fund | $48 | 0.44% |
|---|
|
| Expenses Paid, Amount |
$ 48
|
| Expense Ratio, Percent |
0.44%
|
| Performance Past Does Not Indicate Future [Text] |
The Fund's past performance is not a good predictor of future results. The performance shown in the following graph and table do not reflect the deduction of taxes that a shareholder would pay on Fund distributions or on the redemption of Fund shares. For the most recent performance information visit
|
| Line Graph [Table Text Block] |
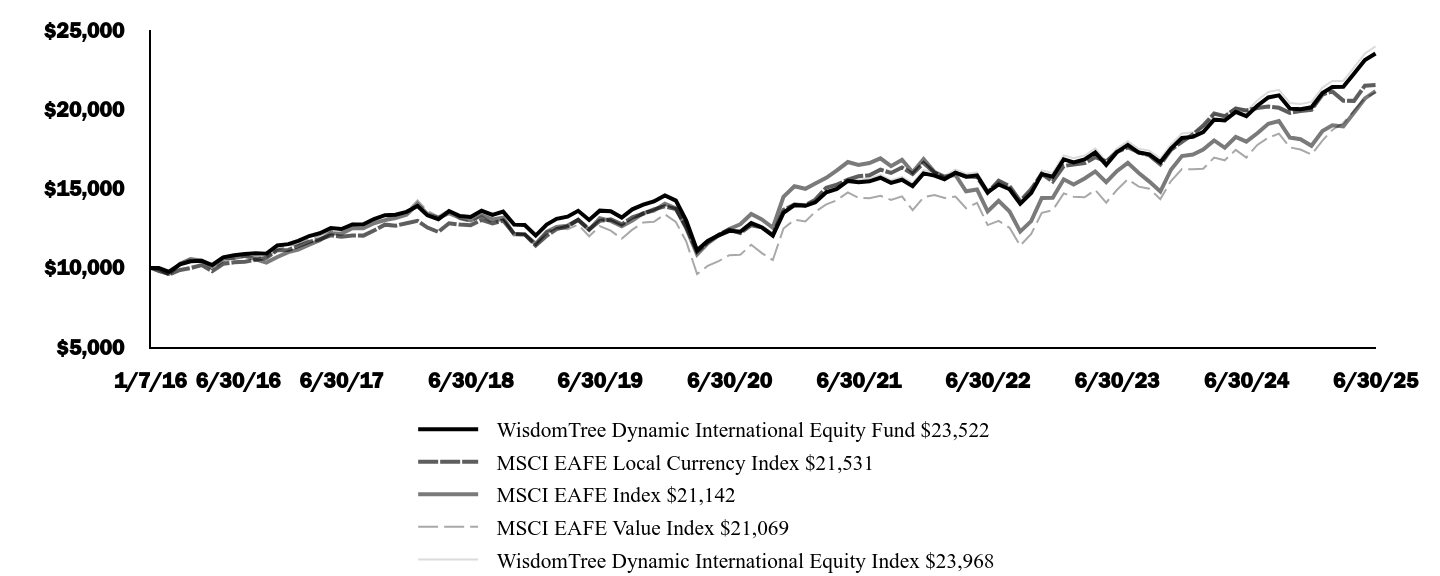 | WisdomTree Dynamic International Equity Fund $23,522 | MSCI EAFE Local Currency Index $21,531 | MSCI EAFE Index $21,142
| MSCI EAFE Value Index $21,069
| WisdomTree Dynamic International Equity Index $23,968
|
|---|
1/7/16 | $10,000 | $10,000 | $10,000 | $10,000 | $10,000 |
|---|
1/31/16 | $9,996 | $9,939 | $9,812 | $9,743 | $9,989 |
|---|
2/29/16 | $9,756 | $9,585 | $9,632 | $9,554 | $9,756 |
|---|
3/31/16 | $10,227 | $9,866 | $10,259 | $10,184 | $10,215 |
|---|
4/30/16 | $10,417 | $9,990 | $10,556 | $10,586 | $10,426 |
|---|
5/31/16 | $10,447 | $10,177 | $10,460 | $10,418 | $10,449 |
|---|
6/30/16 | $10,182 | $9,793 | $10,109 | $9,901 | $10,177 |
|---|
7/31/16 | $10,665 | $10,258 | $10,621 | $10,421 | $10,654 |
|---|
8/31/16 | $10,795 | $10,354 | $10,629 | $10,590 | $10,761 |
|---|
9/30/16 | $10,869 | $10,385 | $10,760 | $10,692 | $10,859 |
|---|
10/31/16 | $10,915 | $10,508 | $10,539 | $10,717 | $10,913 |
|---|
11/30/16 | $10,898 | $10,637 | $10,330 | $10,651 | $10,903 |
|---|
12/31/16 | $11,418 | $11,119 | $10,683 | $11,138 | $11,421 |
|---|
1/31/17 | $11,496 | $11,130 | $10,993 | $11,413 | $11,489 |
|---|
2/28/17 | $11,707 | $11,369 | $11,150 | $11,491 | $11,707 |
|---|
3/31/17 | $12,008 | $11,643 | $11,457 | $11,812 | $12,025 |
|---|
4/30/17 | $12,186 | $11,805 | $11,748 | $12,060 | $12,188 |
|---|
5/31/17 | $12,508 | $12,052 | $12,179 | $12,339 | $12,512 |
|---|
6/30/17 | $12,448 | $11,958 | $12,158 | $12,376 | $12,445 |
|---|
7/31/17 | $12,734 | $12,039 | $12,509 | $12,790 | $12,741 |
|---|
8/31/17 | $12,747 | $12,034 | $12,504 | $12,710 | $12,754 |
|---|
9/30/17 | $13,078 | $12,360 | $12,815 | $13,103 | $13,090 |
|---|
10/31/17 | $13,321 | $12,726 | $13,010 | $13,204 | $13,317 |
|---|
11/30/17 | $13,347 | $12,660 | $13,146 | $13,322 | $13,350 |
|---|
12/31/17 | $13,533 | $12,812 | $13,357 | $13,527 | $13,531 |
|---|
1/31/18 | $13,901 | $12,966 | $14,027 | $14,257 | $13,903 |
|---|
2/28/18 | $13,311 | $12,544 | $13,394 | $13,579 | $13,323 |
|---|
3/31/18 | $13,067 | $12,264 | $13,153 | $13,252 | $13,109 |
|---|
4/30/18 | $13,577 | $12,816 | $13,453 | $13,661 | $13,589 |
|---|
5/31/18 | $13,267 | $12,729 | $13,150 | $13,068 | $13,279 |
|---|
6/30/18 | $13,205 | $12,690 | $12,990 | $12,903 | $13,225 |
|---|
7/31/18 | $13,601 | $13,024 | $13,310 | $13,273 | $13,606 |
|---|
8/31/18 | $13,337 | $12,805 | $13,052 | $12,790 | $13,319 |
|---|
9/30/18 | $13,546 | $12,989 | $13,166 | $13,055 | $13,538 |
|---|
10/31/18 | $12,735 | $12,140 | $12,118 | $12,188 | $12,730 |
|---|
11/30/18 | $12,707 | $12,113 | $12,103 | $12,120 | $12,742 |
|---|
12/31/18 | $12,038 | $11,405 | $11,515 | $11,528 | $12,071 |
|---|
1/31/19 | $12,730 | $12,027 | $12,272 | $12,299 | $12,761 |
|---|
2/28/19 | $13,090 | $12,445 | $12,585 | $12,504 | $13,134 |
|---|
3/31/19 | $13,231 | $12,612 | $12,664 | $12,440 | $13,270 |
|---|
4/30/19 | $13,598 | $13,038 | $13,020 | $12,730 | $13,643 |
|---|
5/31/19 | $13,022 | $12,434 | $12,395 | $11,993 | $13,047 |
|---|
6/30/19 | $13,610 | $12,965 | $13,130 | $12,632 | $13,647 |
|---|
7/31/19 | $13,568 | $13,056 | $12,963 | $12,348 | $13,607 |
|---|
8/31/19 | $13,176 | $12,741 | $12,628 | $11,841 | $13,231 |
|---|
9/30/19 | $13,691 | $13,192 | $12,989 | $12,412 | $13,756 |
|---|
10/31/19 | $13,985 | $13,413 | $13,456 | $12,860 | $14,060 |
|---|
11/30/19 | $14,190 | $13,693 | $13,608 | $12,911 | $14,263 |
|---|
12/31/19 | $14,570 | $13,876 | $14,050 | $13,382 | $14,658 |
|---|
1/31/20 | $14,244 | $13,706 | $13,757 | $12,898 | $14,326 |
|---|
2/29/20 | $12,998 | $12,599 | $12,513 | $11,678 | $13,079 |
|---|
3/31/20 | $11,107 | $11,025 | $10,843 | $9,609 | $11,169 |
|---|
4/30/20 | $11,708 | $11,624 | $11,543 | $10,123 | $11,779 |
|---|
5/31/20 | $12,054 | $12,096 | $12,046 | $10,431 | $12,137 |
|---|
6/30/20 | $12,339 | $12,415 | $12,456 | $10,803 | $12,435 |
|---|
7/31/20 | $12,276 | $12,192 | $12,747 | $10,824 | $12,371 |
|---|
8/31/20 | $12,825 | $12,692 | $13,402 | $11,457 | $12,923 |
|---|
9/30/20 | $12,545 | $12,566 | $13,054 | $10,931 | $12,647 |
|---|
10/31/20 | $12,024 | $12,074 | $12,532 | $10,491 | $12,123 |
|---|
11/30/20 | $13,465 | $13,656 | $14,475 | $12,478 | $13,589 |
|---|
12/31/20 | $13,957 | $13,993 | $15,148 | $13,031 | $14,077 |
|---|
1/31/21 | $13,912 | $13,940 | $14,987 | $12,929 | $14,028 |
|---|
2/28/21 | $14,131 | $14,304 | $15,323 | $13,545 | $14,259 |
|---|
3/31/21 | $14,770 | $15,056 | $15,675 | $14,001 | $14,904 |
|---|
4/30/21 | $14,984 | $15,246 | $16,147 | $14,268 | $15,126 |
|---|
5/31/21 | $15,483 | $15,563 | $16,674 | $14,762 | $15,543 |
|---|
6/30/21 | $15,394 | $15,777 | $16,486 | $14,422 | $15,559 |
|---|
7/31/21 | $15,460 | $15,840 | $16,610 | $14,387 | $15,647 |
|---|
8/31/21 | $15,682 | $16,196 | $16,903 | $14,550 | $15,873 |
|---|
9/30/21 | $15,361 | $15,985 | $16,412 | $14,283 | $15,534 |
|---|
10/31/21 | $15,556 | $16,334 | $16,816 | $14,511 | $15,748 |
|---|
11/30/21 | $15,156 | $15,924 | $16,033 | $13,638 | $15,347 |
|---|
12/31/21 | $15,957 | $16,610 | $16,854 | $14,450 | $16,161 |
|---|
1/31/22 | $15,818 | $16,005 | $16,040 | $14,600 | $16,049 |
|---|
2/28/22 | $15,580 | $15,656 | $15,756 | $14,402 | $15,795 |
|---|
3/31/22 | $15,999 | $15,991 | $15,858 | $14,498 | $16,198 |
|---|
4/30/22 | $15,755 | $15,768 | $14,832 | $13,765 | $15,942 |
|---|
5/31/22 | $15,838 | $15,737 | $14,943 | $14,103 | $16,022 |
|---|
6/30/22 | $14,760 | $14,738 | $13,556 | $12,699 | $14,923 |
|---|
7/31/22 | $15,260 | $15,503 | $14,232 | $12,964 | $15,433 |
|---|
8/31/22 | $14,957 | $15,150 | $13,556 | $12,526 | $15,145 |
|---|
9/30/22 | $14,048 | $14,209 | $12,288 | $11,403 | $14,219 |
|---|
10/31/22 | $14,713 | $14,966 | $12,949 | $12,139 | $14,910 |
|---|
11/30/22 | $15,921 | $15,928 | $14,407 | $13,473 | $16,147 |
|---|
12/31/22 | $15,755 | $15,448 | $14,419 | $13,643 | $15,989 |
|---|
1/31/23 | $16,840 | $16,421 | $15,586 | $14,696 | $17,095 |
|---|
2/28/23 | $16,656 | $16,523 | $15,261 | $14,490 | $16,908 |
|---|
3/31/23 | $16,837 | $16,605 | $15,639 | $14,453 | $17,089 |
|---|
4/30/23 | $17,283 | $16,983 | $16,081 | $14,918 | $17,542 |
|---|
5/31/23 | $16,493 | $16,715 | $15,400 | $14,115 | $16,712 |
|---|
6/30/23 | $17,297 | $17,317 | $16,101 | $14,909 | $17,526 |
|---|
7/31/23 | $17,752 | $17,606 | $16,622 | $15,587 | $17,993 |
|---|
8/31/23 | $17,274 | $17,282 | $15,985 | $15,124 | $17,506 |
|---|
9/30/23 | $17,157 | $17,096 | $15,439 | $14,996 | $17,397 |
|---|
10/31/23 | $16,658 | $16,523 | $14,813 | $14,337 | $16,893 |
|---|
11/30/23 | $17,527 | $17,447 | $16,188 | $15,473 | $17,791 |
|---|
12/31/23 | $18,188 | $17,944 | $17,048 | $16,228 | $18,471 |
|---|
1/31/24 | $18,261 | $18,414 | $17,146 | $16,218 | $18,548 |
|---|
2/29/24 | $18,561 | $18,971 | $17,460 | $16,247 | $18,862 |
|---|
3/31/24 | $19,351 | $19,731 | $18,035 | $16,956 | $19,690 |
|---|
4/30/24 | $19,294 | $19,559 | $17,573 | $16,782 | $19,598 |
|---|
5/31/24 | $19,840 | $20,039 | $18,253 | $17,443 | $20,148 |
|---|
6/30/24 | $19,568 | $19,928 | $17,959 | $16,958 | $19,872 |
|---|
7/31/24 | $20,227 | $20,081 | $18,486 | $17,753 | $20,553 |
|---|
8/31/24 | $20,747 | $20,170 | $19,087 | $18,207 | $21,089 |
|---|
9/30/24 | $20,880 | $20,093 | $19,263 | $18,466 | $21,225 |
|---|
10/31/24 | $20,049 | $19,773 | $18,215 | $17,598 | $20,399 |
|---|
11/30/24 | $20,009 | $19,886 | $18,112 | $17,463 | $20,333 |
|---|
12/31/24 | $20,124 | $19,968 | $17,700 | $17,151 | $20,467 |
|---|
1/31/25 | $21,021 | $20,931 | $18,630 | $18,026 | $21,369 |
|---|
2/28/25 | $21,413 | $21,130 | $18,992 | $18,698 | $21,785 |
|---|
3/31/25 | $21,415 | $20,545 | $18,915 | $19,134 | $21,789 |
|---|
4/30/25 | $22,238 | $20,531 | $19,781 | $19,910 | $22,633 |
|---|
5/31/25 | $23,102 | $21,488 | $20,686 | $20,709 | $23,524 |
|---|
6/30/25 | $23,522 | $21,531 | $21,142 | $21,069 | $23,968 |
|---|
|
| Average Annual Return [Table Text Block] |
Average Annual Total Returns (%) | 1 Year | 5 Years | Since
Inception
1/7/16 |
|---|
Fund NAV Returns | 20.21% | 13.77% | 9.44% |
|---|
MSCI EAFE Local Currency Index | 8.04% | 11.64% | 8.42% |
|---|
MSCI EAFE Index | 17.73% | 11.16% | 8.21% |
|---|
MSCI EAFE Value Index | 24.24% | 14.29% | 8.17% |
|---|
WisdomTree Dynamic International Equity Index | 20.61% | 14.02% | 9.65% |
|---|
|
| AssetsNet |
$ 662,677,191
|
| Holdings Count | Holding |
1,385
|
| Advisory Fees Paid, Amount |
$ 1,457,055
|
| InvestmentCompanyPortfolioTurnover |
25.00%
|
| Additional Fund Statistics [Text Block] |
- Total Net Assets$662,677,191
- # of Portfolio Holdings1,385
- Portfolio Turnover Rate25%
- Investment Advisory Fees Paid, Net$1,457,055
|
| Holdings [Text Block] |
Sector Breakdown (% of Net Assets)Financials | 23.0% |
|---|
Industrials | 18.0% |
|---|
Consumer Discretionary | 9.5% |
|---|
Consumer Staples | 9.2% |
|---|
Health Care | 7.1% |
|---|
Utilities | 7.0% |
|---|
Communication Services | 6.7% |
|---|
Materials | 6.4% |
|---|
Energy | 5.1% |
|---|
Information Technology | 4.1% |
|---|
Other Sectors | 3.5% |
|---|
Other Assets and Liabilities, Net | 0.4% |
|---|
Total | 100.0% |
|---|
|
| Largest Holdings [Text Block] |
Top 10 Holdings (% of Net Assets)HSBC Holdings PLC | 2.5% |
|---|
Novartis AG | 1.5% |
|---|
Intesa Sanpaolo SpA | 1.2% |
|---|
Toyota Motor Corp. | 1.2% |
|---|
British American Tobacco PLC | 1.1% |
|---|
Allianz SE | 1.1% |
|---|
Banco Bilbao Vizcaya Argentaria SA | 1.0% |
|---|
Shell PLC | 1.0% |
|---|
Enel SpA | 1.0% |
|---|
Nestle SA | 1.0% |
|---|
|
| Material Fund Change [Text Block] |
Effective April 30, 2025, the Fund was renamed WisdomTree Dynamic International Equity Fund (formerly, WisdomTree Dynamic Currency Hedged International Equity Fund). Effective April 30, 2025, the Fund's Index was renamed WisdomTree Dynamic International Equity Index (formerly, WisdomTree Dynamic Currency Hedged International Equity Index). |
| Updated Prospectus Phone Number |
1-866-909-WISE (9473)
|
| Updated Prospectus Web Address |
<span style="box-sizing: border-box; color: rgb(0, 0, 0); display: inline; flex-wrap: nowrap; font-size: 10.6667px; font-weight: 400; grid-area: auto; line-height: 10.6667px; margin: 0px; overflow: visible; text-align: left; text-align-last: auto; white-space-collapse: preserve-breaks;">www.wisdomtree.com/investments/regulatory</span>
|
| C000164635 |
|
| Shareholder Report [Line Items] |
|
| Fund Name |
WisdomTree Dynamic International SmallCap Equity Fund
|
| Trading Symbol |
DDLS
|
| Annual or Semi-Annual Statement [Text Block] |
This annual shareholder report contains important information about the WisdomTree Dynamic International SmallCap Equity Fund (the "Fund") (formerly, WisdomTree Dynamic Currency Hedged International SmallCap Equity Fund) for the period of July 1, 2024 to June 30, 2025.
|
| Shareholder Report Annual or Semi-Annual |
Annual Shareholder Report
|
| Additional Information [Text Block] |
You can find additional information about the Fund at www.wisdomtree.com/investments/regulatory. You can also request this information by contacting us at 1-866-909-WISE (9473).
|
| Material Fund Change Notice [Text Block] |
This report describes changes to the Fund that occurred during the reporting period.
|
| Additional Information Phone Number |
1-866-909-WISE (9473)
|
| Additional Information Website |
<span style="box-sizing: border-box; color: rgb(0, 0, 0); display: inline; flex-wrap: nowrap; font-size: 10.6667px; font-weight: 400; grid-area: auto; line-height: 10.6667px; margin: 0px; overflow: visible; text-align: left; text-align-last: auto; white-space-collapse: preserve-breaks;">www.wisdomtree.com/investments/regulatory</span>
|
| Expenses [Text Block] |
What were the Fund's costs for the last year?(based on a hypothetical $10,000 investment) Fund Name | Costs of a $10,000 investment | Costs paid as a percentage of a $10,000 investment |
|---|
WisdomTree Dynamic International SmallCap Equity Fund | $54 | 0.49% |
|---|
|
| Expenses Paid, Amount |
$ 54
|
| Expense Ratio, Percent |
0.49%
|
| Performance Past Does Not Indicate Future [Text] |
The Fund's past performance is not a good predictor of future results. The performance shown in the following graph and table do not reflect the deduction of taxes that a shareholder would pay on Fund distributions or on the redemption of Fund shares. For the most recent performance information visit
|
| Line Graph [Table Text Block] |
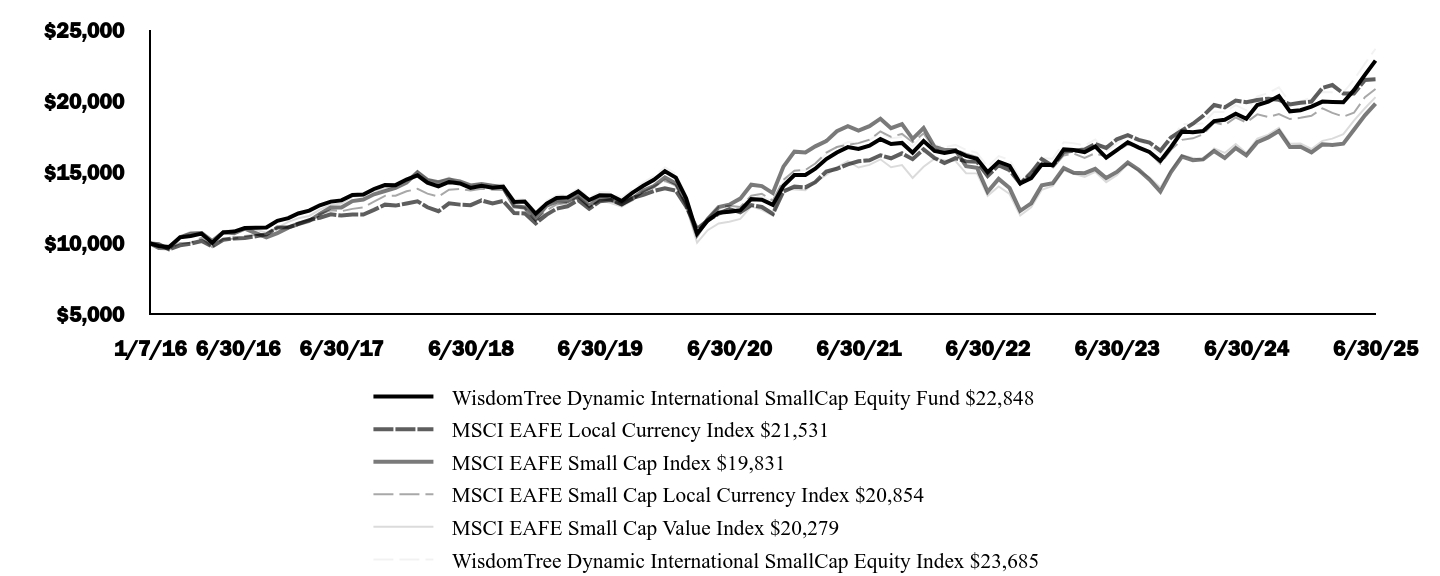 | WisdomTree Dynamic International SmallCap Equity Fund $22,848 | MSCI EAFE Local Currency Index $21,531 | MSCI EAFE Small Cap Index $19,831
| MSCI EAFE Small Cap Local Currency Index $20,854
| MSCI EAFE Small Cap Value Index $20,279
| WisdomTree Dynamic International SmallCap Equity Index $23,685
|
|---|
1/7/16 | $10,000 | $10,000 | $10,000 | $10,000 | $10,000 | $10,000 |
|---|
1/31/16 | $9,827 | $9,939 | $9,674 | $9,808 | $9,696 | $9,823 |
|---|
2/29/16 | $9,757 | $9,585 | $9,662 | $9,586 | $9,706 | $9,748 |
|---|
3/31/16 | $10,433 | $9,866 | $10,437 | $10,034 | $10,484 | $10,421 |
|---|
4/30/16 | $10,520 | $9,990 | $10,677 | $10,057 | $10,820 | $10,511 |
|---|
5/31/16 | $10,689 | $10,177 | $10,732 | $10,400 | $10,764 | $10,692 |
|---|
6/30/16 | $10,040 | $9,793 | $10,166 | $9,740 | $10,161 | $10,051 |
|---|
7/31/16 | $10,780 | $10,258 | $10,789 | $10,310 | $10,869 | $10,803 |
|---|
8/31/16 | $10,835 | $10,354 | $10,725 | $10,329 | $10,903 | $10,873 |
|---|
9/30/16 | $11,081 | $10,385 | $11,044 | $10,530 | $11,146 | $11,117 |
|---|
10/31/16 | $11,098 | $10,508 | $10,731 | $10,587 | $10,967 | $11,135 |
|---|
11/30/16 | $11,119 | $10,637 | $10,430 | $10,670 | $10,752 | $11,153 |
|---|
12/31/16 | $11,591 | $11,119 | $10,728 | $11,106 | $11,116 | $11,641 |
|---|
1/31/17 | $11,779 | $11,130 | $11,107 | $11,167 | $11,520 | $11,817 |
|---|
2/28/17 | $12,108 | $11,369 | $11,356 | $11,482 | $11,768 | $12,146 |
|---|
3/31/17 | $12,307 | $11,643 | $11,584 | $11,677 | $11,932 | $12,341 |
|---|
4/30/17 | $12,685 | $11,805 | $12,080 | $12,054 | $12,377 | $12,722 |
|---|
5/31/17 | $12,942 | $12,052 | $12,525 | $12,325 | $12,719 | $12,997 |
|---|
6/30/17 | $13,026 | $11,958 | $12,522 | $12,265 | $12,805 | $13,105 |
|---|
7/31/17 | $13,407 | $12,039 | $12,976 | $12,430 | $13,297 | $13,478 |
|---|
8/31/17 | $13,437 | $12,034 | $13,082 | $12,538 | $13,348 | $13,513 |
|---|
9/30/17 | $13,829 | $12,360 | $13,456 | $12,940 | $13,716 | $13,905 |
|---|
10/31/17 | $14,103 | $12,726 | $13,683 | $13,343 | $13,827 | $14,166 |
|---|
11/30/17 | $14,098 | $12,660 | $13,900 | $13,356 | $14,054 | $14,196 |
|---|
12/31/17 | $14,491 | $12,812 | $14,270 | $13,663 | $14,482 | $14,597 |
|---|
1/31/18 | $14,791 | $12,966 | $15,000 | $13,837 | $15,110 | $14,883 |
|---|
2/28/18 | $14,277 | $12,544 | $14,468 | $13,502 | $14,517 | $14,402 |
|---|
3/31/18 | $14,012 | $12,264 | $14,305 | $13,292 | $14,328 | $14,139 |
|---|
4/30/18 | $14,321 | $12,816 | $14,499 | $13,780 | $14,624 | $14,450 |
|---|
5/31/18 | $14,212 | $12,729 | $14,360 | $13,834 | $14,223 | $14,346 |
|---|
6/30/18 | $13,907 | $12,690 | $14,081 | $13,715 | $13,917 | $14,060 |
|---|
7/31/18 | $14,048 | $13,024 | $14,173 | $13,837 | $14,084 | $14,223 |
|---|
8/31/18 | $13,916 | $12,805 | $14,059 | $13,776 | $13,884 | $14,102 |
|---|
9/30/18 | $13,991 | $12,989 | $13,957 | $13,753 | $13,880 | $14,156 |
|---|
10/31/18 | $12,912 | $12,140 | $12,614 | $12,595 | $12,725 | $13,080 |
|---|
11/30/18 | $12,952 | $12,113 | $12,525 | $12,499 | $12,602 | $13,135 |
|---|
12/31/18 | $12,086 | $11,405 | $11,717 | $11,555 | $11,850 | $12,249 |
|---|
1/31/19 | $12,798 | $12,027 | $12,661 | $12,335 | $12,781 | $12,990 |
|---|
2/28/19 | $13,200 | $12,445 | $12,945 | $12,742 | $12,987 | $13,393 |
|---|
3/31/19 | $13,226 | $12,612 | $12,966 | $12,841 | $12,913 | $13,417 |
|---|
4/30/19 | $13,650 | $13,038 | $13,357 | $13,302 | $13,216 | $13,855 |
|---|
5/31/19 | $13,049 | $12,434 | $12,651 | $12,618 | $12,487 | $13,238 |
|---|
6/30/19 | $13,389 | $12,965 | $13,187 | $12,959 | $13,028 | $13,610 |
|---|
7/31/19 | $13,371 | $13,056 | $13,094 | $13,122 | $12,845 | $13,589 |
|---|
8/31/19 | $12,986 | $12,741 | $12,771 | $12,814 | $12,580 | $13,203 |
|---|
9/30/19 | $13,558 | $13,192 | $13,130 | $13,254 | $13,037 | $13,779 |
|---|
10/31/19 | $14,055 | $13,413 | $13,726 | $13,616 | $13,668 | $14,301 |
|---|
11/30/19 | $14,469 | $13,693 | $14,030 | $14,034 | $13,900 | $14,740 |
|---|
12/31/19 | $15,076 | $13,876 | $14,642 | $14,378 | $14,497 | $15,360 |
|---|
1/31/20 | $14,626 | $13,706 | $14,218 | $14,103 | $14,012 | $14,900 |
|---|
2/29/20 | $13,182 | $12,599 | $12,824 | $12,865 | $12,612 | $13,414 |
|---|
3/31/20 | $10,693 | $11,025 | $10,613 | $10,796 | $10,059 | $10,857 |
|---|
4/30/20 | $11,606 | $11,624 | $11,716 | $11,767 | $10,932 | $11,802 |
|---|
5/31/20 | $12,164 | $12,096 | $12,552 | $12,571 | $11,408 | $12,377 |
|---|
6/30/20 | $12,224 | $12,415 | $12,723 | $12,651 | $11,529 | $12,428 |
|---|
7/31/20 | $12,326 | $12,192 | $13,151 | $12,560 | $11,721 | $12,533 |
|---|
8/31/20 | $13,114 | $12,692 | $14,132 | $13,351 | $12,604 | $13,338 |
|---|
9/30/20 | $13,075 | $12,566 | $14,028 | $13,487 | $12,361 | $13,308 |
|---|
10/31/20 | $12,708 | $12,074 | $13,539 | $13,017 | $11,953 | $12,954 |
|---|
11/30/20 | $14,055 | $13,656 | $15,399 | $14,469 | $13,861 | $14,359 |
|---|
12/31/20 | $14,808 | $13,993 | $16,450 | $15,115 | $13,793 | $15,135 |
|---|
1/31/21 | $14,813 | $13,940 | $16,389 | $15,166 | $13,735 | $15,142 |
|---|
2/28/21 | $15,256 | $14,304 | $16,823 | $15,615 | $14,334 | $15,591 |
|---|
3/31/21 | $15,929 | $15,056 | $17,191 | $16,386 | $14,820 | $16,288 |
|---|
4/30/21 | $16,387 | $15,246 | $17,882 | $16,775 | $15,350 | $16,770 |
|---|
5/31/21 | $16,768 | $15,563 | $18,239 | $16,926 | $15,778 | $17,129 |
|---|
6/30/21 | $16,640 | $15,777 | $17,937 | $17,050 | $15,334 | $17,042 |
|---|
7/31/21 | $16,872 | $15,840 | $18,242 | $17,298 | $15,524 | $17,272 |
|---|
8/31/21 | $17,335 | $16,196 | $18,768 | $17,865 | $15,914 | $17,757 |
|---|
9/30/21 | $16,989 | $15,985 | $18,098 | $17,495 | $15,356 | $17,398 |
|---|
10/31/21 | $17,063 | $16,334 | $18,382 | $17,695 | $15,512 | $17,477 |
|---|
11/30/21 | $16,384 | $15,924 | $17,354 | $17,112 | $14,606 | $16,810 |
|---|
12/31/21 | $17,194 | $16,610 | $18,111 | $17,727 | $15,393 | $17,652 |
|---|
1/31/22 | $16,501 | $16,005 | $16,786 | $16,637 | $15,965 | $16,913 |
|---|
2/28/22 | $16,358 | $15,656 | $16,573 | $16,360 | $15,852 | $16,765 |
|---|
3/31/22 | $16,501 | $15,991 | $16,566 | $16,594 | $15,802 | $16,925 |
|---|
4/30/22 | $16,151 | $15,768 | $15,430 | $16,310 | $14,941 | $16,579 |
|---|
5/31/22 | $15,943 | $15,737 | $15,318 | $16,063 | $14,925 | $16,366 |
|---|
6/30/22 | $15,012 | $14,738 | $13,636 | $14,846 | $13,349 | $15,390 |
|---|
7/31/22 | $15,743 | $15,503 | $14,538 | $15,772 | $14,009 | $16,142 |
|---|
8/31/22 | $15,450 | $15,150 | $13,893 | $15,488 | $13,478 | $15,867 |
|---|
9/30/22 | $14,218 | $14,209 | $12,295 | $14,278 | $11,963 | $14,583 |
|---|
10/31/22 | $14,589 | $14,966 | $12,816 | $14,899 | $12,541 | $14,976 |
|---|
11/30/22 | $15,541 | $15,928 | $14,086 | $15,637 | $13,771 | $15,992 |
|---|
12/31/22 | $15,511 | $15,448 | $14,237 | $15,316 | $14,046 | $15,959 |
|---|
1/31/23 | $16,612 | $16,421 | $15,300 | $16,184 | $15,135 | $17,111 |
|---|
2/28/23 | $16,560 | $16,523 | $14,968 | $16,321 | $14,891 | $17,048 |
|---|
3/31/23 | $16,414 | $16,605 | $14,937 | $16,006 | $14,683 | $16,885 |
|---|
4/30/23 | $16,818 | $16,983 | $15,238 | $16,346 | $15,039 | $17,309 |
|---|
5/31/23 | $16,031 | $16,715 | $14,602 | $16,094 | $14,307 | $16,472 |
|---|
6/30/23 | $16,559 | $17,317 | $15,024 | $16,498 | $14,800 | $17,011 |
|---|
7/31/23 | $17,113 | $17,606 | $15,690 | $16,953 | $15,583 | $17,601 |
|---|
8/31/23 | $16,735 | $17,282 | $15,168 | $16,780 | $15,104 | $17,204 |
|---|
9/30/23 | $16,428 | $17,096 | $14,497 | $16,380 | $14,650 | $16,865 |
|---|
10/31/23 | $15,798 | $16,523 | $13,645 | $15,608 | $13,927 | $16,239 |
|---|
11/30/23 | $16,761 | $17,447 | $15,017 | $16,580 | $15,145 | $17,268 |
|---|
12/31/23 | $17,863 | $17,944 | $16,111 | $17,279 | $16,207 | $18,391 |
|---|
1/31/24 | $17,814 | $18,414 | $15,846 | $17,387 | $15,999 | $18,356 |
|---|
2/29/24 | $17,901 | $18,971 | $15,906 | $17,676 | $15,891 | $18,451 |
|---|
3/31/24 | $18,601 | $19,731 | $16,498 | $18,493 | $16,680 | $19,254 |
|---|
4/30/24 | $18,688 | $19,559 | $16,008 | $18,322 | $16,359 | $19,243 |
|---|
5/31/24 | $19,119 | $20,039 | $16,701 | $18,852 | $16,991 | $19,715 |
|---|
6/30/24 | $18,761 | $19,928 | $16,193 | $18,507 | $16,354 | $19,355 |
|---|
7/31/24 | $19,726 | $20,081 | $17,117 | $19,074 | $17,372 | $20,329 |
|---|
8/31/24 | $19,964 | $20,170 | $17,455 | $18,883 | $17,651 | $20,572 |
|---|
9/30/24 | $20,363 | $20,093 | $17,901 | $19,090 | $18,128 | $20,975 |
|---|
10/31/24 | $19,285 | $19,773 | $16,779 | $18,740 | $17,004 | $19,894 |
|---|
11/30/24 | $19,364 | $19,886 | $16,790 | $18,827 | $17,018 | $19,978 |
|---|
12/31/24 | $19,620 | $19,968 | $16,404 | $18,970 | $16,641 | $20,258 |
|---|
1/31/25 | $19,970 | $20,931 | $16,969 | $19,496 | $17,212 | $20,635 |
|---|
2/28/25 | $19,948 | $21,130 | $16,919 | $19,178 | $17,365 | $20,629 |
|---|
3/31/25 | $19,921 | $20,545 | $17,009 | $18,914 | $17,676 | $20,602 |
|---|
4/30/25 | $20,771 | $20,531 | $17,996 | $19,183 | $18,629 | $21,502 |
|---|
5/31/25 | $21,848 | $21,488 | $19,005 | $20,278 | $19,498 | $22,638 |
|---|
6/30/25 | $22,848 | $21,531 | $19,831 | $20,854 | $20,279 | $23,685 |
|---|
|
| Average Annual Return [Table Text Block] |
Average Annual Total Returns (%) | 1 Year | 5 Years | Since
Inception
1/7/16 |
|---|
Fund NAV Returns | 21.78% | 13.33% | 9.11% |
|---|
MSCI EAFE Local Currency Index | 8.04% | 11.64% | 8.42% |
|---|
MSCI EAFE Small Cap Index | 22.46% | 9.28% | 7.49% |
|---|
MSCI EAFE Small Cap Local Currency Index | 12.68% | 10.51% | 8.06% |
|---|
MSCI EAFE Small Cap Value Index | 24.00% | 11.96% | 7.74% |
|---|
WisdomTree Dynamic International SmallCap Equity Index | 22.37% | 13.77% | 9.52% |
|---|
|
| AssetsNet |
$ 425,103,322
|
| Holdings Count | Holding |
1,007
|
| Advisory Fees Paid, Amount |
$ 1,724,471
|
| InvestmentCompanyPortfolioTurnover |
43.00%
|
| Additional Fund Statistics [Text Block] |
- Total Net Assets$425,103,322
- # of Portfolio Holdings1,007
- Portfolio Turnover Rate43%
- Investment Advisory Fees Paid, Net$1,724,471
|
| Holdings [Text Block] |
Sector Breakdown (% of Net Assets)Industrials | 25.6% |
|---|
Financials | 15.0% |
|---|
Consumer Discretionary | 13.5% |
|---|
Materials | 9.7% |
|---|
Consumer Staples | 8.0% |
|---|
Information Technology | 8.0% |
|---|
Real Estate | 6.4% |
|---|
Communication Services | 4.4% |
|---|
Health Care | 3.8% |
|---|
Energy | 3.3% |
|---|
Other Sectors | 2.1% |
|---|
Other Assets and Liabilities, Net | 0.2% |
|---|
Total | 100.0% |
|---|
|
| Largest Holdings [Text Block] |
Top 10 Holdings (% of Net Assets)Sydbank AS | 1.0% |
|---|
Harel Insurance Investments & Financial Services Ltd. | 0.8% |
|---|
Cofinimmo SA | 0.7% |
|---|
Plus500 Ltd. | 0.6% |
|---|
Hoegh Autoliners ASA | 0.6% |
|---|
Coface SA | 0.6% |
|---|
Suedzucker AG | 0.6% |
|---|
Menora Mivtachim Holdings Ltd. | 0.5% |
|---|
TP ICAP Group PLC | 0.5% |
|---|
Mandatum OYJ | 0.5% |
|---|
|
| Material Fund Change [Text Block] |
Effective April 30, 2025, the Fund was renamed WisdomTree Dynamic International SmallCap Equity Fund (formerly, the WisdomTree Dynamic Currency Hedged International SmallCap Equity Fund). Effective April 30, 2025, the Fund's Index was renamed WisdomTree Dynamic International SmallCap Equity Index (formerly, WisdomTree Dynamic Currency Hedged International SmallCap Equity Index). |
| Updated Prospectus Phone Number |
1-866-909-WISE (9473)
|
| Updated Prospectus Web Address |
<span style="box-sizing: border-box; color: rgb(0, 0, 0); display: inline; flex-wrap: nowrap; font-size: 10.6667px; font-weight: 400; grid-area: auto; line-height: 10.6667px; margin: 0px; overflow: visible; text-align: left; text-align-last: auto; white-space-collapse: preserve-breaks;">www.wisdomtree.com/investments/regulatory</span>
|
| C000227316 |
|
| Shareholder Report [Line Items] |
|
| Fund Name |
WisdomTree Emerging Markets Efficient Core Fund
|
| Trading Symbol |
NTSE
|
| Annual or Semi-Annual Statement [Text Block] |
This annual shareholder report contains important information about the WisdomTree Emerging Markets Efficient Core Fund (the "Fund") for the period of July 1, 2024 to June 30, 2025.
|
| Shareholder Report Annual or Semi-Annual |
Annual Shareholder Report
|
| Additional Information [Text Block] |
You can find additional information about the Fund at www.wisdomtree.com/investments/regulatory. You can also request this information by contacting us at 1-866-909-WISE (9473).
|
| Additional Information Phone Number |
1-866-909-WISE (9473)
|
| Additional Information Website |
<span style="box-sizing: border-box; color: rgb(0, 0, 0); display: inline; flex-wrap: nowrap; font-size: 10.6667px; font-weight: 400; grid-area: auto; line-height: 10.6667px; margin: 0px; overflow: visible; text-align: left; text-align-last: auto; white-space-collapse: preserve-breaks;">www.wisdomtree.com/investments/regulatory</span>
|
| Expenses [Text Block] |
What were the Fund's costs for the last year?(based on a hypothetical $10,000 investment) Fund Name | Costs of a $10,000 investment | Costs paid as a percentage of a $10,000 investment |
|---|
WisdomTree Emerging Markets Efficient Core Fund | $34 | 0.32% |
|---|
|
| Expenses Paid, Amount |
$ 34
|
| Expense Ratio, Percent |
0.32%
|
| Performance Past Does Not Indicate Future [Text] |
The Fund's past performance is not a good predictor of future results. The performance shown in the following graph and table do not reflect the deduction of taxes that a shareholder would pay on Fund distributions or on the redemption of Fund shares. For the most recent performance information visit
|
| Line Graph [Table Text Block] |
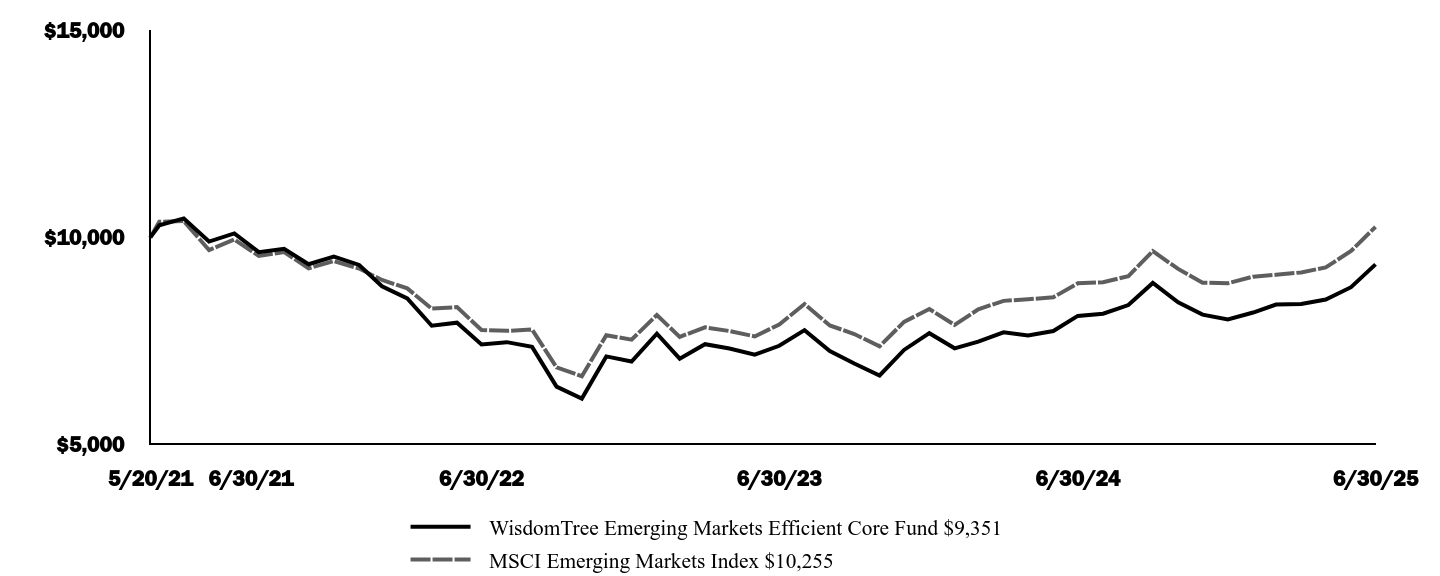 | WisdomTree Emerging Markets Efficient Core Fund $9,351 | MSCI Emerging Markets Index $10,255 |
|---|
5/20/21 | $10,000 | $10,000 |
|---|
5/31/21 | $10,294 | $10,378 |
|---|
6/30/21 | $10,458 | $10,396 |
|---|
7/31/21 | $9,901 | $9,696 |
|---|
8/31/21 | $10,098 | $9,950 |
|---|
9/30/21 | $9,646 | $9,555 |
|---|
10/31/21 | $9,725 | $9,649 |
|---|
11/30/21 | $9,354 | $9,256 |
|---|
12/31/21 | $9,537 | $9,429 |
|---|
1/31/22 | $9,337 | $9,251 |
|---|
2/28/22 | $8,823 | $8,974 |
|---|
3/31/22 | $8,529 | $8,772 |
|---|
4/30/22 | $7,871 | $8,284 |
|---|
5/31/22 | $7,946 | $8,320 |
|---|
6/30/22 | $7,419 | $7,767 |
|---|
7/31/22 | $7,476 | $7,748 |
|---|
8/31/22 | $7,362 | $7,781 |
|---|
9/30/22 | $6,403 | $6,868 |
|---|
10/31/22 | $6,116 | $6,655 |
|---|
11/30/22 | $7,133 | $7,642 |
|---|
12/31/22 | $7,010 | $7,535 |
|---|
1/31/23 | $7,678 | $8,130 |
|---|
2/28/23 | $7,077 | $7,603 |
|---|
3/31/23 | $7,427 | $7,833 |
|---|
4/30/23 | $7,323 | $7,744 |
|---|
5/31/23 | $7,175 | $7,614 |
|---|
6/30/23 | $7,388 | $7,903 |
|---|
7/31/23 | $7,766 | $8,395 |
|---|
8/31/23 | $7,260 | $7,878 |
|---|
9/30/23 | $6,960 | $7,672 |
|---|
10/31/23 | $6,672 | $7,374 |
|---|
11/30/23 | $7,288 | $7,964 |
|---|
12/31/23 | $7,692 | $8,275 |
|---|
1/31/24 | $7,327 | $7,891 |
|---|
2/29/24 | $7,490 | $8,267 |
|---|
3/31/24 | $7,712 | $8,471 |
|---|
4/30/24 | $7,636 | $8,509 |
|---|
5/31/24 | $7,745 | $8,557 |
|---|
6/30/24 | $8,109 | $8,895 |
|---|
7/31/24 | $8,161 | $8,921 |
|---|
8/31/24 | $8,369 | $9,065 |
|---|
9/30/24 | $8,903 | $9,671 |
|---|
10/31/24 | $8,437 | $9,241 |
|---|
11/30/24 | $8,140 | $8,909 |
|---|
12/31/24 | $8,024 | $8,896 |
|---|
1/31/25 | $8,190 | $9,055 |
|---|
2/28/25 | $8,383 | $9,099 |
|---|
3/31/25 | $8,398 | $9,157 |
|---|
4/30/25 | $8,502 | $9,277 |
|---|
5/31/25 | $8,801 | $9,673 |
|---|
6/30/25 | $9,351 | $10,255 |
|---|
|
| Average Annual Return [Table Text Block] |
Average Annual Total Returns (%) | 1 Year | Since
Inception
5/20/21 |
|---|
Fund NAV Returns | 15.32% | -1.62% |
|---|
MSCI Emerging Markets Index | 15.29% | 0.61% |
|---|
|
| AssetsNet |
$ 31,342,041
|
| Holdings Count | Holding |
437
|
| Advisory Fees Paid, Amount |
$ 89,925
|
| InvestmentCompanyPortfolioTurnover |
5.00%
|
| Additional Fund Statistics [Text Block] |
- Total Net Assets$31,342,041
- # of Portfolio Holdings437
- Portfolio Turnover Rate5%
- Investment Advisory Fees Paid, Net$89,925
|
| Holdings [Text Block] |
Sector Breakdown (% of Net Assets)Information Technology | 26.2% |
|---|
Financials | 19.8% |
|---|
Consumer Discretionary | 12.9% |
|---|
Communication Services | 10.0% |
|---|
Materials | 5.3% |
|---|
Consumer Staples | 4.4% |
|---|
Energy | 3.8% |
|---|
Other Sectors | 8.4% |
|---|
Other Assets and Liabilities, Net | 9.2% |
|---|
Total | 100.0% |
|---|
|
| Largest Holdings [Text Block] |
Top 10 Holdings (% of Net Assets)Taiwan Semiconductor Manufacturing Co. Ltd. | 11.8% |
|---|
Dreyfus Treasury Obligations Cash Management Fund, Institutional Shares, 4.19% | 8.3% |
|---|
Tencent Holdings Ltd. | 5.3% |
|---|
Samsung Electronics Co. Ltd. | 3.4% |
|---|
Alibaba Group Holding Ltd. | 3.0% |
|---|
Naspers Ltd. | 2.3% |
|---|
SK Hynix, Inc. | 1.7% |
|---|
Xiaomi Corp. | 1.6% |
|---|
Reliance Industries Ltd. | 1.5% |
|---|
China Construction Bank Corp. | 1.5% |
|---|
|
| Material Fund Change [Text Block] |
|
| Updated Prospectus Phone Number |
1-866-909-WISE (9473)
|
| Updated Prospectus Web Address |
<span style="box-sizing: border-box; color: rgb(0, 0, 0); display: inline; flex-wrap: nowrap; font-size: 10.6667px; font-weight: 400; grid-area: auto; line-height: 10.6667px; margin: 0px; overflow: visible; text-align: left; text-align-last: auto; white-space-collapse: preserve-breaks;">www.wisdomtree.com/investments/regulatory</span>
|
| C000235377 |
|
| Shareholder Report [Line Items] |
|
| Fund Name |
WisdomTree Emerging Markets ex-China Fund
|
| Trading Symbol |
XC
|
| Annual or Semi-Annual Statement [Text Block] |
This annual shareholder report contains important information about the WisdomTree Emerging Markets ex-China Fund (the "Fund") for the period of July 1, 2024 to June 30, 2025.
|
| Shareholder Report Annual or Semi-Annual |
Annual Shareholder Report
|
| Additional Information [Text Block] |
You can find additional information about the Fund at www.wisdomtree.com/investments/regulatory. You can also request this information by contacting us at 1-866-909-WISE (9473).
|
| Additional Information Phone Number |
1-866-909-WISE (9473)
|
| Additional Information Website |
<span style="box-sizing: border-box; color: rgb(0, 0, 0); display: inline; flex-wrap: nowrap; font-size: 10.6667px; font-weight: 400; grid-area: auto; line-height: 10.6667px; margin: 0px; overflow: visible; text-align: left; text-align-last: auto; white-space-collapse: preserve-breaks;">www.wisdomtree.com/investments/regulatory</span>
|
| Expenses [Text Block] |
What were the Fund's costs for the last year?(based on a hypothetical $10,000 investment) Fund Name | Costs of a $10,000 investment | Costs paid as a percentage of a $10,000 investment |
|---|
WisdomTree Emerging Markets ex-China Fund | $33 | 0.32% |
|---|
|
| Expenses Paid, Amount |
$ 33
|
| Expense Ratio, Percent |
0.32%
|
| Performance Past Does Not Indicate Future [Text] |
The Fund's past performance is not a good predictor of future results. The performance shown in the following graph and table do not reflect the deduction of taxes that a shareholder would pay on Fund distributions or on the redemption of Fund shares. For the most recent performance information visit
|
| Line Graph [Table Text Block] |
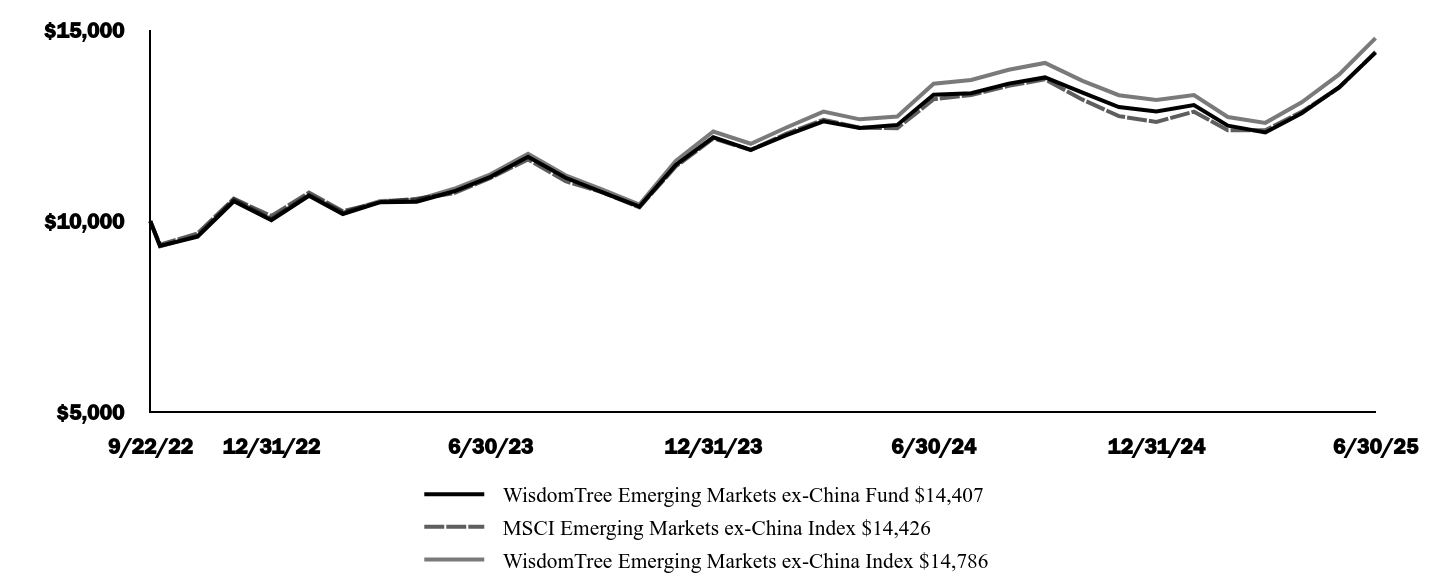 | WisdomTree Emerging Markets ex-China Fund $14,407 | MSCI Emerging Markets ex-China Index $14,426 | WisdomTree Emerging Markets ex-China Index $14,786
|
|---|
9/22/22 | $10,000 | $10,000 | $10,000 |
|---|
9/30/22 | $9,353 | $9,385 | $9,342 |
|---|
10/31/22 | $9,592 | $9,680 | $9,611 |
|---|
11/30/22 | $10,522 | $10,586 | $10,568 |
|---|
12/31/22 | $10,025 | $10,133 | $10,050 |
|---|
1/31/23 | $10,663 | $10,746 | $10,687 |
|---|
2/28/23 | $10,187 | $10,259 | $10,223 |
|---|
3/31/23 | $10,496 | $10,498 | $10,527 |
|---|
4/30/23 | $10,509 | $10,584 | $10,555 |
|---|
5/31/23 | $10,781 | $10,733 | $10,847 |
|---|
6/30/23 | $11,159 | $11,133 | $11,227 |
|---|
7/31/23 | $11,686 | $11,615 | $11,760 |
|---|
8/31/23 | $11,135 | $11,044 | $11,199 |
|---|
9/30/23 | $10,762 | $10,761 | $10,833 |
|---|
10/31/23 | $10,379 | $10,361 | $10,436 |
|---|
11/30/23 | $11,471 | $11,432 | $11,578 |
|---|
12/31/23 | $12,193 | $12,163 | $12,345 |
|---|
1/31/24 | $11,862 | $11,861 | $12,025 |
|---|
2/29/24 | $12,246 | $12,282 | $12,442 |
|---|
3/31/24 | $12,612 | $12,651 | $12,867 |
|---|
4/30/24 | $12,438 | $12,446 | $12,663 |
|---|
5/31/24 | $12,517 | $12,433 | $12,738 |
|---|
6/30/24 | $13,307 | $13,188 | $13,594 |
|---|
7/31/24 | $13,344 | $13,298 | $13,692 |
|---|
8/31/24 | $13,597 | $13,540 | $13,959 |
|---|
9/30/24 | $13,760 | $13,710 | $14,138 |
|---|
10/31/24 | $13,360 | $13,178 | $13,669 |
|---|
11/30/24 | $12,984 | $12,747 | $13,294 |
|---|
12/31/24 | $12,871 | $12,596 | $13,172 |
|---|
1/31/25 | $13,035 | $12,864 | $13,299 |
|---|
2/28/25 | $12,498 | $12,375 | $12,723 |
|---|
3/31/25 | $12,320 | $12,380 | $12,571 |
|---|
4/30/25 | $12,823 | $12,858 | $13,109 |
|---|
5/31/25 | $13,507 | $13,489 | $13,837 |
|---|
6/30/25 | $14,407 | $14,426 | $14,786 |
|---|
|
| Average Annual Return [Table Text Block] |
Average Annual Total Returns (%) | 1 Year | Since
Inception
9/22/22 |
|---|
Fund NAV Returns | 8.27% | 14.08% |
|---|
MSCI Emerging Markets ex-China Index | 9.39% | 14.12% |
|---|
WisdomTree Emerging Markets ex-China Index | 8.76% | 15.13% |
|---|
|
| AssetsNet |
$ 88,804,858
|
| Holdings Count | Holding |
746
|
| Advisory Fees Paid, Amount |
$ 199,670
|
| InvestmentCompanyPortfolioTurnover |
11.00%
|
| Additional Fund Statistics [Text Block] |
- Total Net Assets$88,804,858
- # of Portfolio Holdings746
- Portfolio Turnover Rate11%
- Investment Advisory Fees Paid, Net$199,670
|
| Holdings [Text Block] |
Sector Breakdown (% of Net Assets)Information Technology | 33.5% |
|---|
Financials | 21.9% |
|---|
Consumer Discretionary | 9.0% |
|---|
Industrials | 8.3% |
|---|
Materials | 6.6% |
|---|
Consumer Staples | 5.8% |
|---|
Communication Services | 4.5% |
|---|
Health Care | 4.5% |
|---|
Energy | 3.0% |
|---|
Utilities | 1.9% |
|---|
Other Sectors | 1.3% |
|---|
Other Assets and Liabilities, Net | (0.3)% |
|---|
Total | 100.0% |
|---|
|
| Largest Holdings [Text Block] |
Top 10 Holdings (% of Net Assets)Taiwan Semiconductor Manufacturing Co. Ltd. | 15.7% |
|---|
Samsung Electronics Co. Ltd. | 3.3% |
|---|
HDFC Bank Ltd. | 2.4% |
|---|
Reliance Industries Ltd. | 2.3% |
|---|
Al Rajhi Bank | 2.1% |
|---|
MercadoLibre, Inc. | 2.1% |
|---|
SK Hynix, Inc. | 1.7% |
|---|
ICICI Bank Ltd. | 1.6% |
|---|
MediaTek, Inc. | 1.3% |
|---|
Hon Hai Precision Industry Co. Ltd. | 1.2% |
|---|
|
| Material Fund Change [Text Block] |
|
| Updated Prospectus Phone Number |
1-866-909-WISE (9473)
|
| Updated Prospectus Web Address |
<span style="box-sizing: border-box; color: rgb(0, 0, 0); display: inline; flex-wrap: nowrap; font-size: 10.6667px; font-weight: 400; grid-area: auto; line-height: 10.6667px; margin: 0px; overflow: visible; text-align: left; text-align-last: auto; white-space-collapse: preserve-breaks;">www.wisdomtree.com/investments/regulatory</span>
|
| C000227314 |
|
| Shareholder Report [Line Items] |
|
| Fund Name |
WisdomTree International Efficient Core Fund
|
| Trading Symbol |
NTSI
|
| Annual or Semi-Annual Statement [Text Block] |
This annual shareholder report contains important information about the WisdomTree International Efficient Core Fund (the "Fund") for the period of July 1, 2024 to June 30, 2025.
|
| Shareholder Report Annual or Semi-Annual |
Annual Shareholder Report
|
| Additional Information [Text Block] |
You can find additional information about the Fund at www.wisdomtree.com/investments/regulatory. You can also request this information by contacting us at 1-866-909-WISE (9473).
|
| Additional Information Phone Number |
1-866-909-WISE (9473)
|
| Additional Information Website |
<span style="box-sizing: border-box; color: rgb(0, 0, 0); display: inline; flex-wrap: nowrap; font-size: 10.6667px; font-weight: 400; grid-area: auto; line-height: 10.6667px; margin: 0px; overflow: visible; text-align: left; text-align-last: auto; white-space-collapse: preserve-breaks;">www.wisdomtree.com/investments/regulatory</span>
|
| Expenses [Text Block] |
What were the Fund's costs for the last year?(based on a hypothetical $10,000 investment) Fund Name | Costs of a $10,000 investment | Costs paid as a percentage of a $10,000 investment |
|---|
WisdomTree International Efficient Core Fund | $28 | 0.26% |
|---|
|
| Expenses Paid, Amount |
$ 28
|
| Expense Ratio, Percent |
0.26%
|
| Performance Past Does Not Indicate Future [Text] |
The Fund's past performance is not a good predictor of future results. The performance shown in the following graph and table do not reflect the deduction of taxes that a shareholder would pay on Fund distributions or on the redemption of Fund shares. For the most recent performance information visit
|
| Line Graph [Table Text Block] |
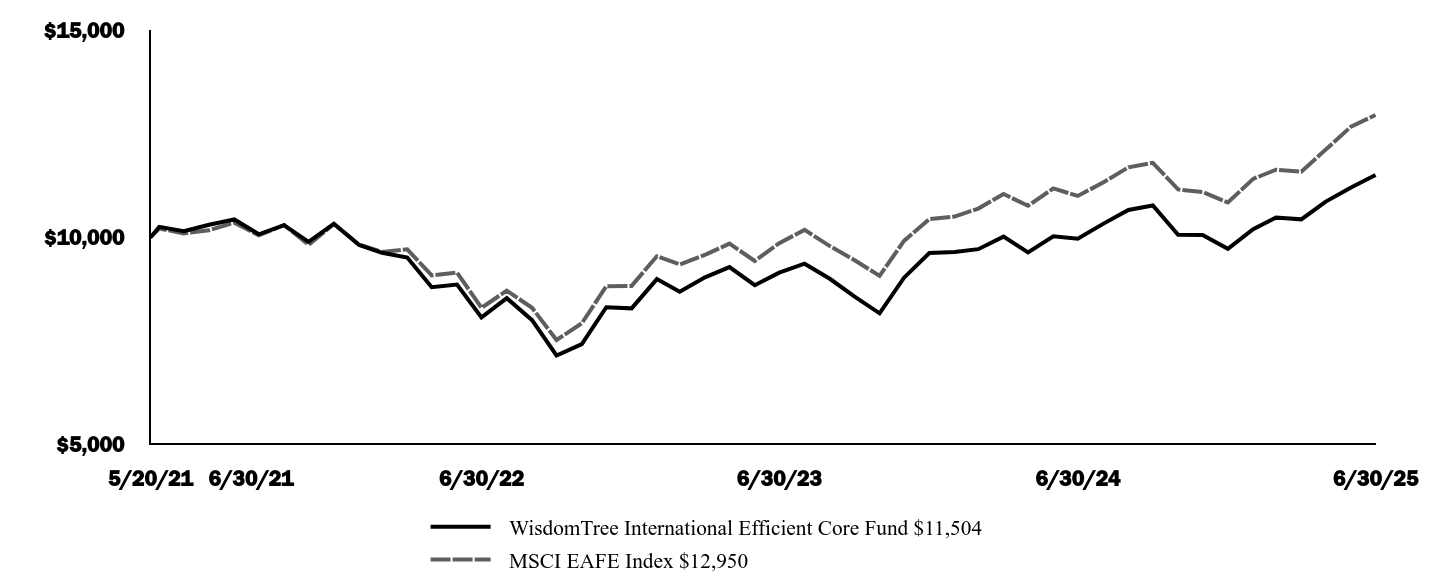 | WisdomTree International Efficient Core Fund $11,504 | MSCI EAFE Index $12,950 |
|---|
5/20/21 | $10,000 | $10,000 |
|---|
5/31/21 | $10,254 | $10,213 |
|---|
6/30/21 | $10,150 | $10,098 |
|---|
7/31/21 | $10,307 | $10,174 |
|---|
8/31/21 | $10,434 | $10,354 |
|---|
9/30/21 | $10,076 | $10,053 |
|---|
10/31/21 | $10,295 | $10,300 |
|---|
11/30/21 | $9,895 | $9,821 |
|---|
12/31/21 | $10,328 | $10,324 |
|---|
1/31/22 | $9,819 | $9,825 |
|---|
2/28/22 | $9,629 | $9,651 |
|---|
3/31/22 | $9,516 | $9,713 |
|---|
4/30/22 | $8,801 | $9,085 |
|---|
5/31/22 | $8,863 | $9,153 |
|---|
6/30/22 | $8,073 | $8,304 |
|---|
7/31/22 | $8,537 | $8,717 |
|---|
8/31/22 | $8,007 | $8,303 |
|---|
9/30/22 | $7,154 | $7,527 |
|---|
10/31/22 | $7,427 | $7,931 |
|---|
11/30/22 | $8,318 | $8,825 |
|---|
12/31/22 | $8,291 | $8,832 |
|---|
1/31/23 | $8,996 | $9,547 |
|---|
2/28/23 | $8,691 | $9,348 |
|---|
3/31/23 | $9,039 | $9,580 |
|---|
4/30/23 | $9,285 | $9,850 |
|---|
5/31/23 | $8,848 | $9,433 |
|---|
6/30/23 | $9,151 | $9,862 |
|---|
7/31/23 | $9,367 | $10,182 |
|---|
8/31/23 | $9,004 | $9,792 |
|---|
9/30/23 | $8,578 | $9,457 |
|---|
10/31/23 | $8,170 | $9,074 |
|---|
11/30/23 | $9,030 | $9,916 |
|---|
12/31/23 | $9,625 | $10,443 |
|---|
1/31/24 | $9,650 | $10,503 |
|---|
2/29/24 | $9,717 | $10,695 |
|---|
3/31/24 | $10,020 | $11,047 |
|---|
4/30/24 | $9,638 | $10,764 |
|---|
5/31/24 | $10,029 | $11,181 |
|---|
6/30/24 | $9,968 | $11,000 |
|---|
7/31/24 | $10,327 | $11,323 |
|---|
8/31/24 | $10,662 | $11,691 |
|---|
9/30/24 | $10,770 | $11,799 |
|---|
10/31/24 | $10,062 | $11,157 |
|---|
11/30/24 | $10,059 | $11,094 |
|---|
12/31/24 | $9,725 | $10,842 |
|---|
1/31/25 | $10,199 | $11,412 |
|---|
2/28/25 | $10,479 | $11,633 |
|---|
3/31/25 | $10,436 | $11,586 |
|---|
4/30/25 | $10,864 | $12,117 |
|---|
5/31/25 | $11,206 | $12,671 |
|---|
6/30/25 | $11,504 | $12,950 |
|---|
|
| Average Annual Return [Table Text Block] |
Average Annual Total Returns (%) | 1 Year | Since
Inception
5/20/21 |
|---|
Fund NAV Returns | 15.41% | 3.46% |
|---|
MSCI EAFE Index | 17.73% | 6.48% |
|---|
|
| AssetsNet |
$ 405,972,013
|
| Holdings Count | Holding |
452
|
| Advisory Fees Paid, Amount |
$ 925,135
|
| InvestmentCompanyPortfolioTurnover |
3.00%
|
| Additional Fund Statistics [Text Block] |
- Total Net Assets$405,972,013
- # of Portfolio Holdings452
- Portfolio Turnover Rate3%
- Investment Advisory Fees Paid, Net$925,135
|
| Holdings [Text Block] |
Sector Breakdown (% of Net Assets)Financials | 21.3% |
|---|
Industrials | 15.7% |
|---|
Health Care | 10.0% |
|---|
Consumer Discretionary | 9.7% |
|---|
Consumer Staples | 7.7% |
|---|
Information Technology | 7.5% |
|---|
Materials | 5.5% |
|---|
Other Sectors | 11.6% |
|---|
Other Assets and Liabilities, Net | 11.0% |
|---|
Total | 100.0% |
|---|
|
| Largest Holdings [Text Block] |
Top 10 Holdings (% of Net Assets)Dreyfus Treasury Obligations Cash Management Fund, Institutional Shares, 4.19% | 9.3% |
|---|
ASML Holding NV | 1.8% |
|---|
SAP SE | 1.7% |
|---|
Nestle SA | 1.4% |
|---|
Shell PLC | 1.4% |
|---|
Novartis AG | 1.3% |
|---|
HSBC Holdings PLC | 1.2% |
|---|
Novo Nordisk AS | 1.2% |
|---|
Roche Holding AG | 1.1% |
|---|
Toyota Motor Corp. | 1.1% |
|---|
|
| Material Fund Change [Text Block] |
|
| Updated Prospectus Phone Number |
1-866-909-WISE (9473)
|
| Updated Prospectus Web Address |
<span style="box-sizing: border-box; color: rgb(0, 0, 0); display: inline; flex-wrap: nowrap; font-size: 10.6667px; font-weight: 400; grid-area: auto; line-height: 10.6667px; margin: 0px; overflow: visible; text-align: left; text-align-last: auto; white-space-collapse: preserve-breaks;">www.wisdomtree.com/investments/regulatory</span>
|
| C000168143 |
|
| Shareholder Report [Line Items] |
|
| Fund Name |
WisdomTree U.S. Corporate Bond Fund
|
| Trading Symbol |
QIG
|
| Annual or Semi-Annual Statement [Text Block] |
This annual shareholder report contains important information about the WisdomTree U.S. Corporate Bond Fund (the "Fund") for the period of July 1, 2024 to June 30, 2025.
|
| Shareholder Report Annual or Semi-Annual |
Annual Shareholder Report
|
| Additional Information [Text Block] |
You can find additional information about the Fund at www.wisdomtree.com/investments/regulatory. You can also request this information by contacting us at 1-866-909-WISE (9473).
|
| Additional Information Phone Number |
1-866-909-WISE (9473)
|
| Additional Information Website |
<span style="box-sizing: border-box; color: rgb(0, 0, 0); display: inline; flex-wrap: nowrap; font-size: 10.6667px; font-weight: 400; grid-area: auto; line-height: 10.6667px; margin: 0px; overflow: visible; text-align: left; text-align-last: auto; white-space-collapse: preserve-breaks;">www.wisdomtree.com/investments/regulatory</span>
|
| Expenses [Text Block] |
What were the Fund's costs for the last year?(based on a hypothetical $10,000 investment) Fund Name | Costs of a $10,000 investment | Costs paid as a percentage of a $10,000 investment |
|---|
WisdomTree U.S. Corporate Bond Fund | $19 | 0.18% |
|---|
|
| Expenses Paid, Amount |
$ 19
|
| Expense Ratio, Percent |
0.18%
|
| Performance Past Does Not Indicate Future [Text] |
The Fund's past performance is not a good predictor of future results. The performance shown in the following graph and table do not reflect the deduction of taxes that a shareholder would pay on Fund distributions or on the redemption of Fund shares. For the most recent performance information visit
|
| Line Graph [Table Text Block] |
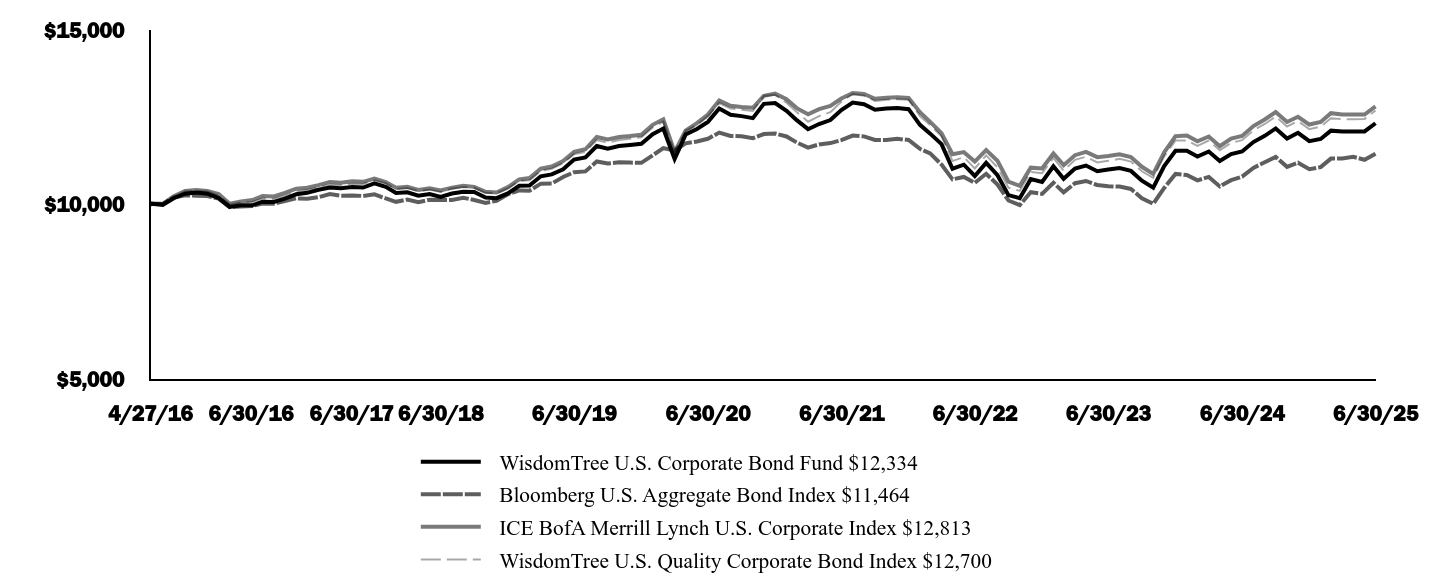 | WisdomTree U.S. Corporate Bond Fund $12,334 | Bloomberg U.S. Aggregate Bond Index $11,464 | ICE BofA Merrill Lynch U.S. Corporate Index $12,813
| WisdomTree U.S. Quality Corporate Bond Index $12,700
|
|---|
4/27/16 | $10,000 | $10,000 | $10,000 | $10,000 |
|---|
4/30/16 | $10,034 | $10,026 | $10,037 | $10,028 |
|---|
5/31/16 | $9,995 | $10,028 | $10,030 | $10,019 |
|---|
6/30/16 | $10,189 | $10,208 | $10,249 | $10,225 |
|---|
7/31/16 | $10,319 | $10,273 | $10,397 | $10,384 |
|---|
8/31/16 | $10,354 | $10,261 | $10,426 | $10,403 |
|---|
9/30/16 | $10,319 | $10,255 | $10,396 | $10,380 |
|---|
10/31/16 | $10,194 | $10,177 | $10,310 | $10,268 |
|---|
11/30/16 | $9,942 | $9,936 | $10,033 | $10,012 |
|---|
12/31/16 | $9,988 | $9,950 | $10,096 | $10,068 |
|---|
1/31/17 | $9,988 | $9,969 | $10,138 | $10,082 |
|---|
2/28/17 | $10,091 | $10,036 | $10,252 | $10,182 |
|---|
3/31/17 | $10,084 | $10,031 | $10,240 | $10,168 |
|---|
4/30/17 | $10,177 | $10,109 | $10,342 | $10,262 |
|---|
5/31/17 | $10,303 | $10,186 | $10,462 | $10,379 |
|---|
6/30/17 | $10,344 | $10,176 | $10,488 | $10,426 |
|---|
7/31/17 | $10,432 | $10,220 | $10,566 | $10,499 |
|---|
8/31/17 | $10,497 | $10,312 | $10,656 | $10,576 |
|---|
9/30/17 | $10,474 | $10,263 | $10,631 | $10,563 |
|---|
10/31/17 | $10,509 | $10,268 | $10,674 | $10,604 |
|---|
11/30/17 | $10,494 | $10,255 | $10,659 | $10,597 |
|---|
12/31/17 | $10,614 | $10,302 | $10,750 | $10,704 |
|---|
1/31/18 | $10,519 | $10,184 | $10,651 | $10,618 |
|---|
2/28/18 | $10,338 | $10,087 | $10,491 | $10,447 |
|---|
3/31/18 | $10,359 | $10,152 | $10,514 | $10,480 |
|---|
4/30/18 | $10,264 | $10,076 | $10,424 | $10,389 |
|---|
5/31/18 | $10,311 | $10,148 | $10,471 | $10,440 |
|---|
6/30/18 | $10,228 | $10,136 | $10,415 | $10,368 |
|---|
7/31/18 | $10,325 | $10,138 | $10,492 | $10,466 |
|---|
8/31/18 | $10,372 | $10,203 | $10,549 | $10,513 |
|---|
9/30/18 | $10,370 | $10,138 | $10,515 | $10,489 |
|---|
10/31/18 | $10,208 | $10,058 | $10,373 | $10,343 |
|---|
11/30/18 | $10,191 | $10,118 | $10,353 | $10,333 |
|---|
12/31/18 | $10,326 | $10,304 | $10,508 | $10,468 |
|---|
1/31/19 | $10,544 | $10,413 | $10,728 | $10,686 |
|---|
2/28/19 | $10,555 | $10,407 | $10,767 | $10,700 |
|---|
3/31/19 | $10,818 | $10,607 | $11,035 | $10,970 |
|---|
4/30/19 | $10,872 | $10,609 | $11,096 | $11,035 |
|---|
5/31/19 | $11,017 | $10,798 | $11,255 | $11,191 |
|---|
6/30/19 | $11,296 | $10,933 | $11,514 | $11,449 |
|---|
7/31/19 | $11,358 | $10,957 | $11,590 | $11,517 |
|---|
8/31/19 | $11,684 | $11,241 | $11,942 | $11,851 |
|---|
9/30/19 | $11,604 | $11,181 | $11,868 | $11,780 |
|---|
10/31/19 | $11,682 | $11,215 | $11,940 | $11,856 |
|---|
11/30/19 | $11,711 | $11,209 | $11,966 | $11,891 |
|---|
12/31/19 | $11,745 | $11,202 | $12,004 | $11,931 |
|---|
1/31/20 | $12,021 | $11,417 | $12,289 | $12,211 |
|---|
2/29/20 | $12,182 | $11,623 | $12,448 | $12,380 |
|---|
3/31/20 | $11,313 | $11,554 | $11,517 | $11,503 |
|---|
4/30/20 | $12,010 | $11,760 | $12,125 | $12,122 |
|---|
5/31/20 | $12,169 | $11,814 | $12,337 | $12,279 |
|---|
6/30/20 | $12,373 | $11,889 | $12,585 | $12,533 |
|---|
7/31/20 | $12,757 | $12,066 | $12,982 | $12,913 |
|---|
8/31/20 | $12,574 | $11,969 | $12,832 | $12,753 |
|---|
9/30/20 | $12,538 | $11,962 | $12,798 | $12,722 |
|---|
10/31/20 | $12,481 | $11,909 | $12,776 | $12,686 |
|---|
11/30/20 | $12,888 | $12,026 | $13,117 | $13,112 |
|---|
12/31/20 | $12,912 | $12,042 | $13,181 | $13,145 |
|---|
1/31/21 | $12,690 | $11,956 | $13,020 | $12,922 |
|---|
2/28/21 | $12,423 | $11,784 | $12,766 | $12,652 |
|---|
3/31/21 | $12,164 | $11,636 | $12,589 | $12,378 |
|---|
4/30/21 | $12,311 | $11,728 | $12,738 | $12,537 |
|---|
5/31/21 | $12,424 | $11,767 | $12,828 | $12,651 |
|---|
6/30/21 | $12,713 | $11,849 | $13,041 | $12,948 |
|---|
7/31/21 | $12,925 | $11,982 | $13,199 | $13,172 |
|---|
8/31/21 | $12,876 | $11,959 | $13,173 | $13,121 |
|---|
9/30/21 | $12,719 | $11,855 | $13,034 | $12,970 |
|---|
10/31/21 | $12,757 | $11,852 | $13,066 | $13,006 |
|---|
11/30/21 | $12,769 | $11,887 | $13,078 | $13,022 |
|---|
12/31/21 | $12,737 | $11,857 | $13,056 | $13,008 |
|---|
1/31/22 | $12,288 | $11,601 | $12,648 | $12,537 |
|---|
2/28/22 | $12,037 | $11,472 | $12,372 | $12,276 |
|---|
3/31/22 | $11,736 | $11,153 | $12,046 | $11,962 |
|---|
4/30/22 | $11,034 | $10,730 | $11,447 | $11,252 |
|---|
5/31/22 | $11,148 | $10,799 | $11,508 | $11,366 |
|---|
6/30/22 | $10,827 | $10,630 | $11,238 | $11,040 |
|---|
7/31/22 | $11,202 | $10,889 | $11,569 | $11,414 |
|---|
8/31/22 | $10,848 | $10,582 | $11,261 | $11,075 |
|---|
9/30/22 | $10,279 | $10,125 | $10,663 | $10,492 |
|---|
10/31/22 | $10,192 | $9,993 | $10,544 | $10,401 |
|---|
11/30/22 | $10,736 | $10,361 | $11,063 | $10,943 |
|---|
12/31/22 | $10,657 | $10,314 | $11,039 | $10,905 |
|---|
1/31/23 | $11,105 | $10,632 | $11,469 | $11,344 |
|---|
2/28/23 | $10,745 | $10,357 | $11,135 | $10,979 |
|---|
3/31/23 | $11,040 | $10,620 | $11,420 | $11,287 |
|---|
4/30/23 | $11,124 | $10,684 | $11,514 | $11,376 |
|---|
5/31/23 | $10,963 | $10,568 | $11,364 | $11,215 |
|---|
6/30/23 | $11,010 | $10,530 | $11,396 | $11,261 |
|---|
7/31/23 | $11,054 | $10,523 | $11,446 | $11,315 |
|---|
8/31/23 | $10,971 | $10,456 | $11,368 | $11,238 |
|---|
9/30/23 | $10,692 | $10,190 | $11,088 | $10,961 |
|---|
10/31/23 | $10,490 | $10,029 | $10,887 | $10,772 |
|---|
11/30/23 | $11,110 | $10,483 | $11,501 | $11,387 |
|---|
12/31/23 | $11,548 | $10,884 | $11,965 | $11,844 |
|---|
1/31/24 | $11,550 | $10,855 | $11,984 | $11,843 |
|---|
2/29/24 | $11,384 | $10,701 | $11,817 | $11,684 |
|---|
3/31/24 | $11,526 | $10,800 | $11,954 | $11,839 |
|---|
4/30/24 | $11,254 | $10,527 | $11,679 | $11,563 |
|---|
5/31/24 | $11,452 | $10,706 | $11,895 | $11,772 |
|---|
6/30/24 | $11,527 | $10,807 | $11,968 | $11,851 |
|---|
7/31/24 | $11,796 | $11,059 | $12,254 | $12,130 |
|---|
8/31/24 | $11,973 | $11,218 | $12,441 | $12,313 |
|---|
9/30/24 | $12,185 | $11,369 | $12,656 | $12,525 |
|---|
10/31/24 | $11,895 | $11,087 | $12,371 | $12,242 |
|---|
11/30/24 | $12,061 | $11,204 | $12,518 | $12,393 |
|---|
12/31/24 | $11,820 | $11,021 | $12,297 | $12,166 |
|---|
1/31/25 | $11,885 | $11,079 | $12,371 | $12,238 |
|---|
2/28/25 | $12,122 | $11,323 | $12,622 | $12,476 |
|---|
3/31/25 | $12,095 | $11,327 | $12,587 | $12,452 |
|---|
4/30/25 | $12,097 | $11,372 | $12,584 | $12,449 |
|---|
5/31/25 | $12,100 | $11,290 | $12,584 | $12,458 |
|---|
6/30/25 | $12,334 | $11,464 | $12,813 | $12,700 |
|---|
|
| Average Annual Return [Table Text Block] |
Average Annual Total Returns (%) | 1 Year | 5 Years | Since
Inception
4/27/16 |
|---|
Fund NAV Returns | 7.00% | -0.06% | 2.31% |
|---|
Bloomberg U.S. Aggregate Bond Index | 6.08% | -0.73% | 1.50% |
|---|
ICE BofA Merrill Lynch U.S. Corporate Index | 7.06% | 0.36% | 2.74% |
|---|
WisdomTree U.S. Quality Corporate Bond Index | 7.16% | 0.27% | 2.64% |
|---|
|
| AssetsNet |
$ 17,880,670
|
| Holdings Count | Holding |
492
|
| Advisory Fees Paid, Amount |
$ 32,058
|
| InvestmentCompanyPortfolioTurnover |
16.00%
|
| Additional Fund Statistics [Text Block] |
- Total Net Assets$17,880,670
- # of Portfolio Holdings492
- Portfolio Turnover Rate16%
- Investment Advisory Fees Paid, Net$32,058
|
| Holdings [Text Block] |
Sector Breakdown (% of Net Assets)Financials | 34.7% |
|---|
Health Care | 13.3% |
|---|
Energy | 8.4% |
|---|
Utilities | 8.1% |
|---|
Information Technology | 7.9% |
|---|
Industrials | 7.1% |
|---|
Consumer Staples | 5.7% |
|---|
Consumer Discretionary | 4.3% |
|---|
Communication Services | 3.5% |
|---|
Materials | 3.4% |
|---|
Other Sectors | 2.1% |
|---|
Other Assets and Liabilities, Net | 1.5% |
|---|
Total | 100.0% |
|---|
|
| Largest Holdings [Text Block] |
Top 10 Holdings (% of Net Assets)Bank of America Corp., 2.59%, due 4/29/2031 | 1.2% |
|---|
Wells Fargo & Co., 4.81%, due 7/25/2028 | 0.9% |
|---|
HCA, Inc., 4.13%, due 6/15/2029 | 0.9% |
|---|
U.S. Bancorp, 5.78%, due 6/12/2029 | 0.9% |
|---|
Morgan Stanley, 3.95%, due 4/23/2027 | 0.9% |
|---|
Deutsche Bank AG, 5.30%, due 5/9/2031 | 0.9% |
|---|
Bank of America Corp., 3.19%, due 7/23/2030 | 0.8% |
|---|
Capital One Financial Corp., 3.80%, due 1/31/2028 | 0.8% |
|---|
Bank of America Corp., 3.42%, due 12/20/2028 | 0.8% |
|---|
Broadridge Financial Solutions, Inc., 3.40%, due 6/27/2026 | 0.8% |
|---|
|
| Material Fund Change [Text Block] |
|
| Updated Prospectus Phone Number |
1-866-909-WISE (9473)
|
| Updated Prospectus Web Address |
<span style="box-sizing: border-box; color: rgb(0, 0, 0); display: inline; flex-wrap: nowrap; font-size: 10.6667px; font-weight: 400; grid-area: auto; line-height: 10.6667px; margin: 0px; overflow: visible; text-align: left; text-align-last: auto; white-space-collapse: preserve-breaks;">www.wisdomtree.com/investments/regulatory</span>
|
| C000200315 |
|
| Shareholder Report [Line Items] |
|
| Fund Name |
WisdomTree U.S. Efficient Core Fund
|
| Trading Symbol |
NTSX
|
| Annual or Semi-Annual Statement [Text Block] |
This annual shareholder report contains important information about the WisdomTree U.S. Efficient Core Fund (the "Fund") for the period of July 1, 2024 to June 30, 2025.
|
| Shareholder Report Annual or Semi-Annual |
Annual Shareholder Report
|
| Additional Information [Text Block] |
You can find additional information about the Fund at www.wisdomtree.com/investments/regulatory. You can also request this information by contacting us at 1-866-909-WISE (9473).
|
| Additional Information Phone Number |
1-866-909-WISE (9473)
|
| Additional Information Website |
<span style="box-sizing: border-box; color: rgb(0, 0, 0); display: inline; flex-wrap: nowrap; font-size: 10.6667px; font-weight: 400; grid-area: auto; line-height: 10.6667px; margin: 0px; overflow: visible; text-align: left; text-align-last: auto; white-space-collapse: preserve-breaks;">www.wisdomtree.com/investments/regulatory</span>
|
| Expenses [Text Block] |
What were the Fund's costs for the last year?(based on a hypothetical $10,000 investment) Fund Name | Costs of a $10,000 investment | Costs paid as a percentage of a $10,000 investment |
|---|
WisdomTree U.S. Efficient Core Fund | $22 | 0.20% |
|---|
|
| Expenses Paid, Amount |
$ 22
|
| Expense Ratio, Percent |
0.20%
|
| Performance Past Does Not Indicate Future [Text] |
The Fund's past performance is not a good predictor of future results. The performance shown in the following graph and table do not reflect the deduction of taxes that a shareholder would pay on Fund distributions or on the redemption of Fund shares. For the most recent performance information visit
|
| Line Graph [Table Text Block] |
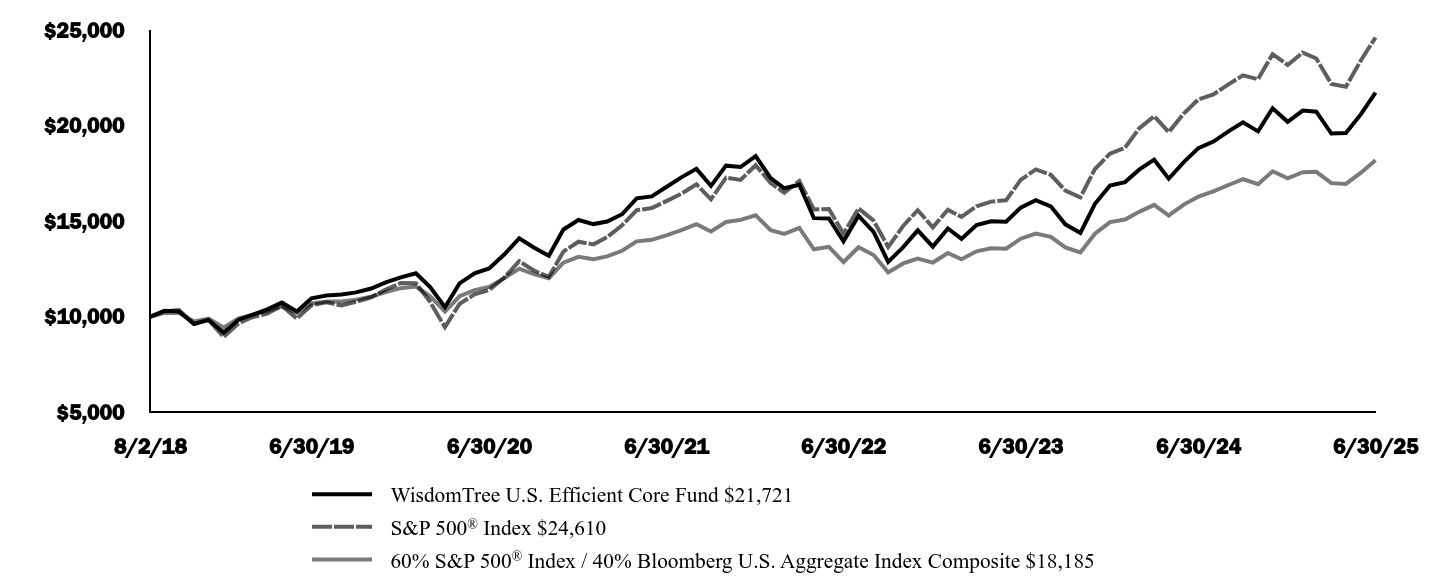 | WisdomTree U.S. Efficient Core Fund $21,721 | S&P 500® Index $24,610 | 60% S&P 500® Index / 40% Bloomberg U.S. Aggregate Index Composite $18,185
|
|---|
8/2/18 | $10,000 | $10,000 | $10,000 |
|---|
8/31/18 | $10,311 | $10,285 | $10,201 |
|---|
9/30/18 | $10,279 | $10,343 | $10,210 |
|---|
10/31/18 | $9,612 | $9,636 | $9,757 |
|---|
11/30/18 | $9,832 | $9,833 | $9,898 |
|---|
12/31/18 | $9,166 | $8,945 | $9,434 |
|---|
1/31/19 | $9,844 | $9,662 | $9,910 |
|---|
2/28/19 | $10,101 | $9,972 | $10,095 |
|---|
3/31/19 | $10,386 | $10,166 | $10,290 |
|---|
4/30/19 | $10,740 | $10,577 | $10,540 |
|---|
5/31/19 | $10,277 | $9,905 | $10,208 |
|---|
6/30/19 | $10,964 | $10,603 | $10,690 |
|---|
7/31/19 | $11,109 | $10,756 | $10,794 |
|---|
8/31/19 | $11,166 | $10,585 | $10,796 |
|---|
9/30/19 | $11,275 | $10,783 | $10,894 |
|---|
10/31/19 | $11,477 | $11,017 | $11,050 |
|---|
11/30/19 | $11,801 | $11,417 | $11,292 |
|---|
12/31/19 | $12,056 | $11,761 | $11,494 |
|---|
1/31/20 | $12,272 | $11,757 | $11,578 |
|---|
2/29/20 | $11,559 | $10,789 | $11,086 |
|---|
3/31/20 | $10,498 | $9,456 | $10,268 |
|---|
4/30/20 | $11,744 | $10,669 | $11,070 |
|---|
5/31/20 | $12,270 | $11,177 | $11,394 |
|---|
6/30/20 | $12,526 | $11,399 | $11,558 |
|---|
7/31/20 | $13,254 | $12,042 | $12,020 |
|---|
8/31/20 | $14,101 | $12,907 | $12,512 |
|---|
9/30/20 | $13,621 | $12,417 | $12,224 |
|---|
10/31/20 | $13,190 | $12,087 | $12,009 |
|---|
11/30/20 | $14,565 | $13,410 | $12,828 |
|---|
12/31/20 | $15,061 | $13,925 | $13,131 |
|---|
1/31/21 | $14,847 | $13,785 | $13,013 |
|---|
2/28/21 | $14,983 | $14,165 | $13,158 |
|---|
3/31/21 | $15,362 | $14,785 | $13,451 |
|---|
4/30/21 | $16,192 | $15,574 | $13,943 |
|---|
5/31/21 | $16,295 | $15,683 | $14,022 |
|---|
6/30/21 | $16,789 | $16,049 | $14,258 |
|---|
7/31/21 | $17,290 | $16,431 | $14,526 |
|---|
8/31/21 | $17,737 | $16,930 | $14,846 |
|---|
9/30/21 | $16,846 | $16,143 | $14,463 |
|---|
10/31/21 | $17,903 | $17,274 | $14,955 |
|---|
11/30/21 | $17,833 | $17,154 | $15,066 |
|---|
12/31/21 | $18,401 | $17,923 | $15,310 |
|---|
1/31/22 | $17,246 | $16,995 | $14,524 |
|---|
2/28/22 | $16,718 | $16,486 | $14,331 |
|---|
3/31/22 | $16,901 | $17,099 | $14,648 |
|---|
4/30/22 | $15,164 | $15,608 | $13,525 |
|---|
5/31/22 | $15,143 | $15,636 | $13,653 |
|---|
6/30/22 | $13,944 | $14,346 | $12,861 |
|---|
7/31/22 | $15,281 | $15,668 | $13,637 |
|---|
8/31/22 | $14,437 | $15,029 | $13,230 |
|---|
9/30/22 | $12,871 | $13,645 | $12,321 |
|---|
10/31/22 | $13,639 | $14,750 | $12,789 |
|---|
11/30/22 | $14,520 | $15,574 | $13,047 |
|---|
12/31/22 | $13,669 | $14,677 | $12,834 |
|---|
1/31/23 | $14,621 | $15,599 | $13,336 |
|---|
2/28/23 | $14,069 | $15,218 | $13,003 |
|---|
3/31/23 | $14,795 | $15,777 | $13,423 |
|---|
4/30/23 | $14,993 | $16,023 | $13,581 |
|---|
5/31/23 | $14,972 | $16,093 | $13,558 |
|---|
6/30/23 | $15,708 | $17,156 | $14,082 |
|---|
7/31/23 | $16,102 | $17,708 | $14,350 |
|---|
8/31/23 | $15,776 | $17,426 | $14,175 |
|---|
9/30/23 | $14,832 | $16,595 | $13,624 |
|---|
10/31/23 | $14,386 | $16,246 | $13,367 |
|---|
11/30/23 | $15,908 | $17,729 | $14,339 |
|---|
12/31/23 | $16,865 | $18,535 | $14,950 |
|---|
1/31/24 | $17,044 | $18,846 | $15,085 |
|---|
2/29/24 | $17,692 | $19,853 | $15,488 |
|---|
3/31/24 | $18,215 | $20,491 | $15,851 |
|---|
4/30/24 | $17,219 | $19,655 | $15,296 |
|---|
5/31/24 | $18,091 | $20,629 | $15,866 |
|---|
6/30/24 | $18,820 | $21,369 | $16,280 |
|---|
7/31/24 | $19,163 | $21,629 | $16,557 |
|---|
8/31/24 | $19,699 | $22,154 | $16,892 |
|---|
9/30/24 | $20,167 | $22,627 | $17,199 |
|---|
10/31/24 | $19,698 | $22,422 | $16,936 |
|---|
11/30/24 | $20,907 | $23,738 | $17,610 |
|---|
12/31/24 | $20,197 | $23,172 | $17,240 |
|---|
1/31/25 | $20,784 | $23,818 | $17,564 |
|---|
2/28/25 | $20,728 | $23,507 | $17,578 |
|---|
3/31/25 | $19,583 | $22,182 | $16,988 |
|---|
4/30/25 | $19,614 | $22,032 | $16,946 |
|---|
5/31/25 | $20,596 | $23,419 | $17,534 |
|---|
6/30/25 | $21,721 | $24,610 | $18,185 |
|---|
|
| Average Annual Return [Table Text Block] |
Average Annual Total Returns (%) | 1 Year | 5 Years | Since
Inception
8/2/18 |
|---|
Fund NAV Returns | 15.41% | 11.64% | 11.88% |
|---|
S&P 500® Index | 15.16% | 16.64% | 13.91% |
|---|
60% S&P 500® Index / 40% Bloomberg U.S. Aggregate Index Composite | 11.70% | 9.49% | 9.03% |
|---|
|
| AssetsNet |
$ 1,205,557,062
|
| Holdings Count | Holding |
503
|
| Advisory Fees Paid, Amount |
$ 2,312,502
|
| InvestmentCompanyPortfolioTurnover |
15.00%
|
| Additional Fund Statistics [Text Block] |
- Total Net Assets$1,205,557,062
- # of Portfolio Holdings503
- Portfolio Turnover Rate15%
- Investment Advisory Fees Paid, Net$2,312,502
|
| Holdings [Text Block] |
Sector Breakdown (% of Net Assets)Information Technology | 29.5% |
|---|
Financials | 13.3% |
|---|
Communication Services | 10.0% |
|---|
Consumer Discretionary | 9.3% |
|---|
Health Care | 8.0% |
|---|
Industrials | 7.3% |
|---|
Consumer Staples | 5.3% |
|---|
Other Sectors | 7.4% |
|---|
Other Assets and Liabilities, Net | 9.9% |
|---|
Total | 100.0% |
|---|
|
| Largest Holdings [Text Block] |
Top 10 Holdings (% of Net Assets)Dreyfus Treasury Obligations Cash Management Fund, Institutional Shares, 4.19% | 8.6% |
|---|
NVIDIA Corp. | 6.5% |
|---|
Microsoft Corp. | 6.0% |
|---|
Apple, Inc. | 5.0% |
|---|
Amazon.com, Inc. | 3.6% |
|---|
Alphabet, Inc. | 3.6% |
|---|
Meta Platforms, Inc. | 3.1% |
|---|
Broadcom, Inc. | 2.0% |
|---|
Berkshire Hathaway, Inc. | 1.7% |
|---|
Tesla, Inc. | 1.6% |
|---|
|
| Material Fund Change [Text Block] |
|
| Updated Prospectus Phone Number |
1-866-909-WISE (9473)
|
| Updated Prospectus Web Address |
<span style="box-sizing: border-box; color: rgb(0, 0, 0); display: inline; flex-wrap: nowrap; font-size: 10.6667px; font-weight: 400; grid-area: auto; line-height: 10.6667px; margin: 0px; overflow: visible; text-align: left; text-align-last: auto; white-space-collapse: preserve-breaks;">www.wisdomtree.com/investments/regulatory</span>
|
| C000168145 |
|
| Shareholder Report [Line Items] |
|
| Fund Name |
WisdomTree U.S. High Yield Corporate Bond Fund
|
| Trading Symbol |
QHY
|
| Annual or Semi-Annual Statement [Text Block] |
This annual shareholder report contains important information about the WisdomTree U.S. High Yield Corporate Bond Fund (the "Fund") for the period of July 1, 2024 to June 30, 2025.
|
| Shareholder Report Annual or Semi-Annual |
Annual Shareholder Report
|
| Additional Information [Text Block] |
You can find additional information about the Fund at www.wisdomtree.com/investments/regulatory. You can also request this information by contacting us at 1-866-909-WISE (9473).
|
| Additional Information Phone Number |
1-866-909-WISE (9473)
|
| Additional Information Website |
<span style="box-sizing: border-box; color: rgb(0, 0, 0); display: inline; flex-wrap: nowrap; font-size: 10.6667px; font-weight: 400; grid-area: auto; line-height: 10.6667px; margin: 0px; overflow: visible; text-align: left; text-align-last: auto; white-space-collapse: preserve-breaks;">www.wisdomtree.com/investments/regulatory</span>
|
| Expenses [Text Block] |
What were the Fund's costs for the last year?(based on a hypothetical $10,000 investment) Fund Name | Costs of a $10,000 investment | Costs paid as a percentage of a $10,000 investment |
|---|
WisdomTree U.S. High Yield Corporate Bond Fund | $40 | 0.38% |
|---|
|
| Expenses Paid, Amount |
$ 40
|
| Expense Ratio, Percent |
0.38%
|
| Performance Past Does Not Indicate Future [Text] |
The Fund's past performance is not a good predictor of future results. The performance shown in the following graph and table do not reflect the deduction of taxes that a shareholder would pay on Fund distributions or on the redemption of Fund shares. For the most recent performance information visit
|
| Line Graph [Table Text Block] |
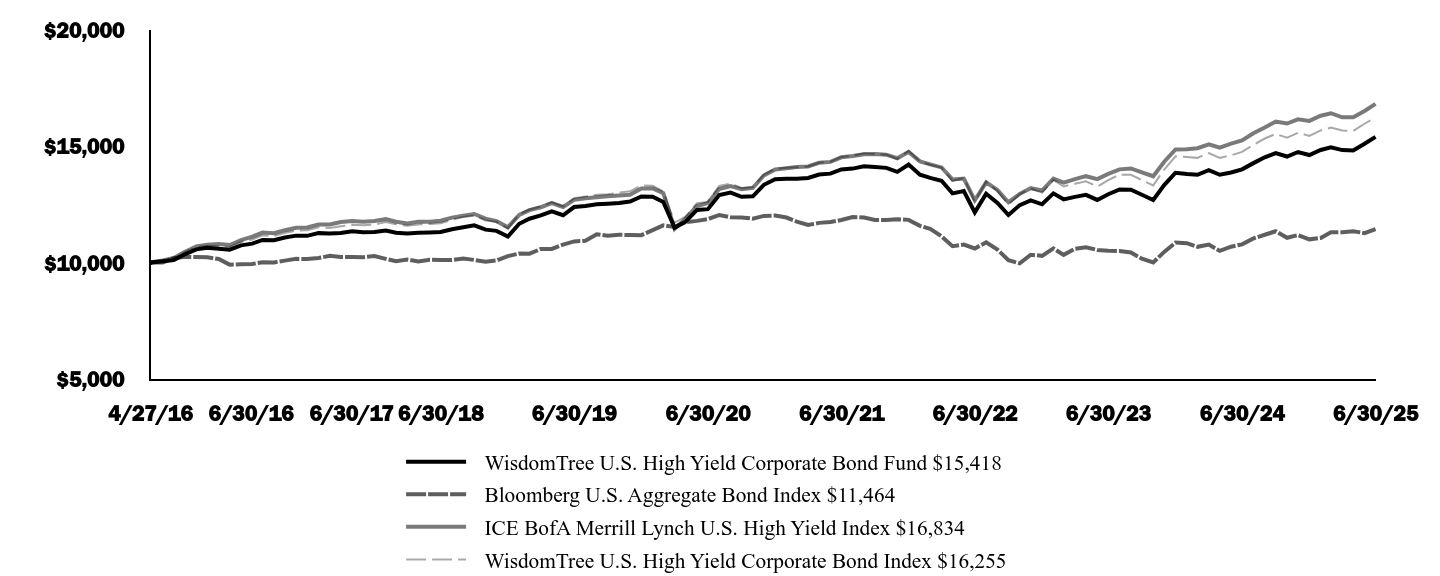 | WisdomTree U.S. High Yield Corporate Bond Fund $15,418 | Bloomberg U.S. Aggregate Bond Index $11,464 | ICE BofA Merrill Lynch U.S. High Yield Index $16,834
| WisdomTree U.S. High Yield Corporate Bond Index $16,255
|
|---|
4/27/16 | $10,000 | $10,000 | $10,000 | $10,000 |
|---|
4/30/16 | $10,028 | $10,026 | $10,042 | $10,037 |
|---|
5/31/16 | $10,085 | $10,028 | $10,115 | $10,094 |
|---|
6/30/16 | $10,134 | $10,208 | $10,224 | $10,177 |
|---|
7/31/16 | $10,383 | $10,273 | $10,483 | $10,469 |
|---|
8/31/16 | $10,593 | $10,261 | $10,716 | $10,681 |
|---|
9/30/16 | $10,661 | $10,255 | $10,785 | $10,739 |
|---|
10/31/16 | $10,616 | $10,177 | $10,819 | $10,724 |
|---|
11/30/16 | $10,579 | $9,936 | $10,777 | $10,684 |
|---|
12/31/16 | $10,765 | $9,950 | $10,988 | $10,908 |
|---|
1/31/17 | $10,837 | $9,969 | $11,136 | $11,013 |
|---|
2/28/17 | $10,995 | $10,036 | $11,310 | $11,191 |
|---|
3/31/17 | $10,983 | $10,031 | $11,286 | $11,171 |
|---|
4/30/17 | $11,103 | $10,109 | $11,414 | $11,294 |
|---|
5/31/17 | $11,180 | $10,186 | $11,516 | $11,402 |
|---|
6/30/17 | $11,171 | $10,176 | $11,528 | $11,413 |
|---|
7/31/17 | $11,288 | $10,220 | $11,661 | $11,540 |
|---|
8/31/17 | $11,268 | $10,312 | $11,658 | $11,507 |
|---|
9/30/17 | $11,298 | $10,263 | $11,763 | $11,586 |
|---|
10/31/17 | $11,363 | $10,268 | $11,808 | $11,643 |
|---|
11/30/17 | $11,328 | $10,255 | $11,776 | $11,631 |
|---|
12/31/17 | $11,339 | $10,302 | $11,811 | $11,660 |
|---|
1/31/18 | $11,399 | $10,184 | $11,887 | $11,761 |
|---|
2/28/18 | $11,305 | $10,087 | $11,776 | $11,663 |
|---|
3/31/18 | $11,268 | $10,152 | $11,703 | $11,607 |
|---|
4/30/18 | $11,299 | $10,076 | $11,781 | $11,660 |
|---|
5/31/18 | $11,315 | $10,148 | $11,779 | $11,677 |
|---|
6/30/18 | $11,337 | $10,136 | $11,820 | $11,711 |
|---|
7/31/18 | $11,456 | $10,138 | $11,952 | $11,859 |
|---|
8/31/18 | $11,541 | $10,203 | $12,038 | $11,978 |
|---|
9/30/18 | $11,623 | $10,138 | $12,108 | $12,041 |
|---|
10/31/18 | $11,437 | $10,058 | $11,910 | $11,829 |
|---|
11/30/18 | $11,386 | $10,118 | $11,802 | $11,772 |
|---|
12/31/18 | $11,141 | $10,304 | $11,543 | $11,488 |
|---|
1/31/19 | $11,690 | $10,413 | $12,073 | $12,103 |
|---|
2/28/19 | $11,905 | $10,407 | $12,277 | $12,302 |
|---|
3/31/19 | $12,049 | $10,607 | $12,398 | $12,433 |
|---|
4/30/19 | $12,226 | $10,609 | $12,571 | $12,619 |
|---|
5/31/19 | $12,055 | $10,798 | $12,411 | $12,438 |
|---|
6/30/19 | $12,406 | $10,933 | $12,716 | $12,790 |
|---|
7/31/19 | $12,453 | $10,957 | $12,781 | $12,862 |
|---|
8/31/19 | $12,524 | $11,241 | $12,831 | $12,929 |
|---|
9/30/19 | $12,550 | $11,181 | $12,871 | $12,958 |
|---|
10/31/19 | $12,577 | $11,215 | $12,901 | $13,024 |
|---|
11/30/19 | $12,641 | $11,209 | $12,936 | $13,082 |
|---|
12/31/19 | $12,861 | $11,202 | $13,207 | $13,340 |
|---|
1/31/20 | $12,846 | $11,417 | $13,207 | $13,321 |
|---|
2/29/20 | $12,625 | $11,623 | $13,003 | $13,081 |
|---|
3/31/20 | $11,522 | $11,554 | $11,474 | $11,743 |
|---|
4/30/20 | $11,781 | $11,760 | $11,910 | $11,992 |
|---|
5/31/20 | $12,285 | $11,814 | $12,454 | $12,568 |
|---|
6/30/20 | $12,317 | $11,889 | $12,576 | $12,628 |
|---|
7/31/20 | $12,923 | $12,066 | $13,177 | $13,310 |
|---|
8/31/20 | $13,024 | $11,969 | $13,306 | $13,417 |
|---|
9/30/20 | $12,845 | $11,962 | $13,168 | $13,225 |
|---|
10/31/20 | $12,866 | $11,909 | $13,229 | $13,267 |
|---|
11/30/20 | $13,362 | $12,026 | $13,759 | $13,801 |
|---|
12/31/20 | $13,600 | $12,042 | $14,021 | $14,047 |
|---|
1/31/21 | $13,620 | $11,956 | $14,075 | $14,095 |
|---|
2/28/21 | $13,619 | $11,784 | $14,124 | $14,114 |
|---|
3/31/21 | $13,656 | $11,636 | $14,148 | $14,143 |
|---|
4/30/21 | $13,799 | $11,728 | $14,303 | $14,305 |
|---|
5/31/21 | $13,839 | $11,767 | $14,344 | $14,347 |
|---|
6/30/21 | $14,022 | $11,849 | $14,540 | $14,555 |
|---|
7/31/21 | $14,055 | $11,982 | $14,592 | $14,609 |
|---|
8/31/21 | $14,152 | $11,959 | $14,672 | $14,710 |
|---|
9/30/21 | $14,126 | $11,855 | $14,677 | $14,682 |
|---|
10/31/21 | $14,087 | $11,852 | $14,651 | $14,653 |
|---|
11/30/21 | $13,917 | $11,887 | $14,500 | $14,470 |
|---|
12/31/21 | $14,231 | $11,857 | $14,773 | $14,815 |
|---|
1/31/22 | $13,795 | $11,601 | $14,367 | $14,356 |
|---|
2/28/22 | $13,656 | $11,472 | $14,238 | $14,222 |
|---|
3/31/22 | $13,536 | $11,153 | $14,106 | $14,102 |
|---|
4/30/22 | $12,992 | $10,730 | $13,593 | $13,523 |
|---|
5/31/22 | $13,093 | $10,799 | $13,627 | $13,653 |
|---|
6/30/22 | $12,177 | $10,630 | $12,700 | $12,631 |
|---|
7/31/22 | $12,975 | $10,889 | $13,465 | $13,497 |
|---|
8/31/22 | $12,585 | $10,582 | $13,142 | $13,094 |
|---|
9/30/22 | $12,064 | $10,125 | $12,614 | $12,513 |
|---|
10/31/22 | $12,490 | $9,993 | $12,973 | $12,967 |
|---|
11/30/22 | $12,693 | $10,361 | $13,216 | $13,197 |
|---|
12/31/22 | $12,525 | $10,314 | $13,115 | $13,024 |
|---|
1/31/23 | $12,993 | $10,632 | $13,629 | $13,571 |
|---|
2/28/23 | $12,737 | $10,357 | $13,452 | $13,288 |
|---|
3/31/23 | $12,843 | $10,620 | $13,604 | $13,407 |
|---|
4/30/23 | $12,930 | $10,684 | $13,730 | $13,510 |
|---|
5/31/23 | $12,712 | $10,568 | $13,605 | $13,283 |
|---|
6/30/23 | $12,958 | $10,530 | $13,826 | $13,565 |
|---|
7/31/23 | $13,160 | $10,523 | $14,023 | $13,798 |
|---|
8/31/23 | $13,149 | $10,456 | $14,063 | $13,787 |
|---|
9/30/23 | $12,935 | $10,190 | $13,897 | $13,564 |
|---|
10/31/23 | $12,708 | $10,029 | $13,727 | $13,335 |
|---|
11/30/23 | $13,346 | $10,483 | $14,352 | $14,013 |
|---|
12/31/23 | $13,878 | $10,884 | $14,878 | $14,580 |
|---|
1/31/24 | $13,826 | $10,855 | $14,884 | $14,556 |
|---|
2/29/24 | $13,789 | $10,701 | $14,928 | $14,516 |
|---|
3/31/24 | $13,988 | $10,800 | $15,100 | $14,725 |
|---|
4/30/24 | $13,792 | $10,527 | $14,955 | $14,513 |
|---|
5/31/24 | $13,889 | $10,706 | $15,124 | $14,624 |
|---|
6/30/24 | $14,023 | $10,807 | $15,265 | $14,774 |
|---|
7/31/24 | $14,290 | $11,059 | $15,570 | $15,077 |
|---|
8/31/24 | $14,539 | $11,218 | $15,817 | $15,346 |
|---|
9/30/24 | $14,723 | $11,369 | $16,076 | $15,543 |
|---|
10/31/24 | $14,573 | $11,087 | $15,988 | $15,379 |
|---|
11/30/24 | $14,768 | $11,204 | $16,168 | $15,590 |
|---|
12/31/24 | $14,637 | $11,021 | $16,102 | $15,459 |
|---|
1/31/25 | $14,854 | $11,079 | $16,324 | $15,691 |
|---|
2/28/25 | $14,967 | $11,323 | $16,430 | $15,816 |
|---|
3/31/25 | $14,849 | $11,327 | $16,254 | $15,686 |
|---|
4/30/25 | $14,837 | $11,372 | $16,254 | $15,674 |
|---|
5/31/25 | $15,123 | $11,290 | $16,527 | $15,979 |
|---|
6/30/25 | $15,418 | $11,464 | $16,834 | $16,255 |
|---|
|
| Average Annual Return [Table Text Block] |
Average Annual Total Returns (%) | 1 Year | 5 Years | Since
Inception
4/27/16 |
|---|
Fund NAV Returns | 9.95% | 4.59% | 4.83% |
|---|
Bloomberg U.S. Aggregate Bond Index | 6.08% | -0.73% | 1.50% |
|---|
ICE BofA Merrill Lynch U.S. High Yield Index | 10.28% | 6.01% | 5.84% |
|---|
WisdomTree U.S. High Yield Corporate Bond Index | 10.02% | 5.18% | 5.43% |
|---|
|
| AssetsNet |
$ 198,292,206
|
| Holdings Count | Holding |
458
|
| Advisory Fees Paid, Amount |
$ 807,494
|
| InvestmentCompanyPortfolioTurnover |
66.00%
|
| Additional Fund Statistics [Text Block] |
- Total Net Assets$198,292,206
- # of Portfolio Holdings458
- Portfolio Turnover Rate66%
- Investment Advisory Fees Paid, Net$807,494
|
| Holdings [Text Block] |
Sector Breakdown (% of Net Assets)Consumer Discretionary | 19.2% |
|---|
Communication Services | 15.8% |
|---|
Energy | 15.4% |
|---|
Industrials | 10.5% |
|---|
Financials | 10.3% |
|---|
Health Care | 6.6% |
|---|
Consumer Staples | 5.3% |
|---|
Real Estate | 4.0% |
|---|
Utilities | 3.1% |
|---|
Other Sectors | 5.4% |
|---|
Other Assets and Liabilities, Net | 4.4% |
|---|
Total | 100.0% |
|---|
|
| Largest Holdings [Text Block] |
Top 10 Holdings (% of Net Assets)Dreyfus Treasury Obligations Cash Management Fund, Institutional Shares, 4.19% | 2.9% |
|---|
United Rentals North America, Inc., 3.88%, due 2/15/2031 | 0.5% |
|---|
Tenneco, Inc., 8.00%, due 11/17/2028 | 0.6% |
|---|
United Airlines, Inc., 4.63%, due 4/15/2029 | 0.6% |
|---|
DaVita, Inc., 4.63%, due 6/1/2030 | 0.6% |
|---|
Post Holdings, Inc., 4.50%, due 9/15/2031 | 0.5% |
|---|
Sirius XM Radio LLC, 4.13%, due 7/1/2030 | 0.5% |
|---|
MPT Operating Partnership LP/MPT Finance Corp., 5.00%, due 10/15/2027 | 0.5% |
|---|
Fertitta Entertainment LLC/Fertitta Entertainment Finance Co., Inc., 6.75%, due 1/15/2030 | 0.5% |
|---|
NGL Energy Operating LLC/NGL Energy Finance Corp., 8.38%, due 2/15/2032 | 0.5% |
|---|
|
| Material Fund Change [Text Block] |
|
| Updated Prospectus Phone Number |
1-866-909-WISE (9473)
|
| Updated Prospectus Web Address |
<span style="box-sizing: border-box; color: rgb(0, 0, 0); display: inline; flex-wrap: nowrap; font-size: 10.6667px; font-weight: 400; grid-area: auto; line-height: 10.6667px; margin: 0px; overflow: visible; text-align: left; text-align-last: auto; white-space-collapse: preserve-breaks;">www.wisdomtree.com/investments/regulatory</span>
|
| C000168144 |
|
| Shareholder Report [Line Items] |
|
| Fund Name |
WisdomTree U.S. Short-Term Corporate Bond Fund
|
| Trading Symbol |
QSIG
|
| Annual or Semi-Annual Statement [Text Block] |
This annual shareholder report contains important information about the WisdomTree U.S. Short-Term Corporate Bond Fund (the "Fund") for the period of July 1, 2024 to June 30, 2025.
|
| Shareholder Report Annual or Semi-Annual |
Annual Shareholder Report
|
| Additional Information [Text Block] |
You can find additional information about the Fund at www.wisdomtree.com/investments/regulatory. You can also request this information by contacting us at 1-866-909-WISE (9473).
|
| Additional Information Phone Number |
1-866-909-WISE (9473)
|
| Additional Information Website |
<span style="box-sizing: border-box; color: rgb(0, 0, 0); display: inline; flex-wrap: nowrap; font-size: 10.6667px; font-weight: 400; grid-area: auto; line-height: 10.6667px; margin: 0px; overflow: visible; text-align: left; text-align-last: auto; white-space-collapse: preserve-breaks;">www.wisdomtree.com/investments/regulatory</span>
|
| Expenses [Text Block] |
What were the Fund's costs for the last year?(based on a hypothetical $10,000 investment) Fund Name | Costs of a $10,000 investment | Costs paid as a percentage of a $10,000 investment |
|---|
WisdomTree U.S. Short-Term Corporate Bond Fund | $19 | 0.18% |
|---|
|
| Expenses Paid, Amount |
$ 19
|
| Expense Ratio, Percent |
0.18%
|
| Performance Past Does Not Indicate Future [Text] |
The Fund's past performance is not a good predictor of future results. The performance shown in the following graph and table do not reflect the deduction of taxes that a shareholder would pay on Fund distributions or on the redemption of Fund shares. For the most recent performance information visit
|
| Line Graph [Table Text Block] |
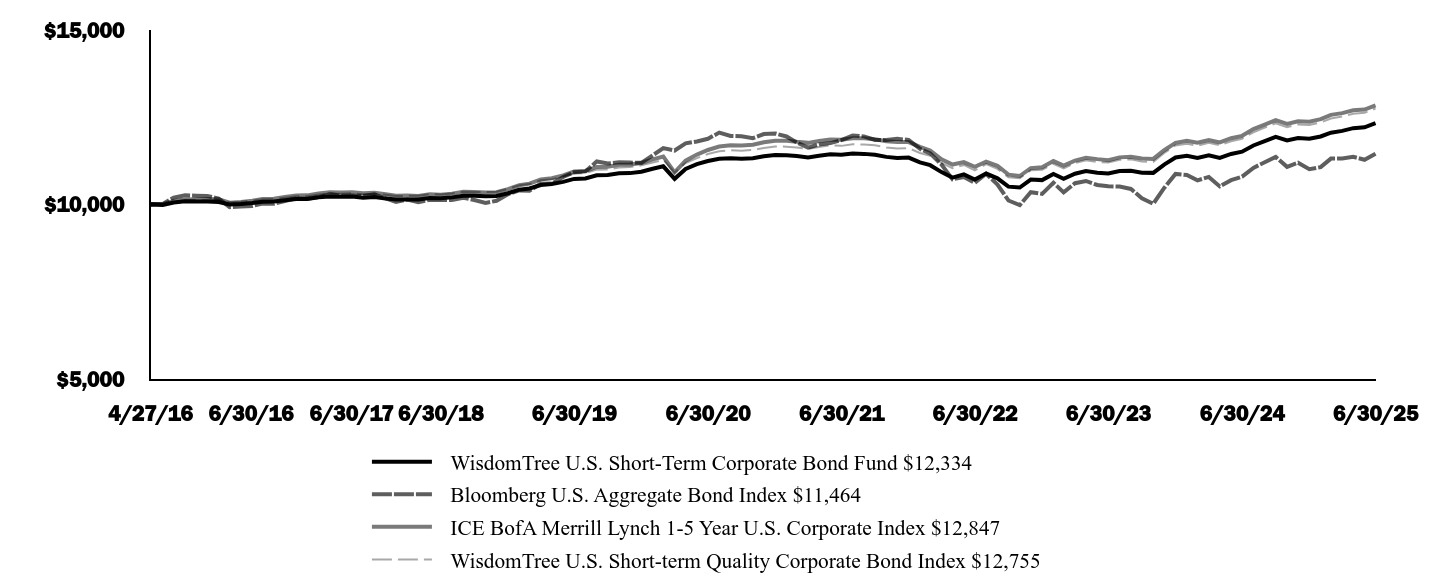 | WisdomTree U.S. Short-Term Corporate Bond Fund $12,334 | Bloomberg U.S. Aggregate Bond Index $11,464 | ICE BofA Merrill Lynch 1-5 Year U.S. Corporate Index $12,847
| WisdomTree U.S. Short-term Quality Corporate Bond Index $12,755
|
|---|
4/27/16 | $10,000 | $10,000 | $10,000 | $10,000 |
|---|
4/30/16 | $10,014 | $10,026 | $10,020 | $10,015 |
|---|
5/31/16 | $9,997 | $10,028 | $10,018 | $10,013 |
|---|
6/30/16 | $10,066 | $10,208 | $10,111 | $10,090 |
|---|
7/31/16 | $10,101 | $10,273 | $10,154 | $10,130 |
|---|
8/31/16 | $10,096 | $10,261 | $10,158 | $10,136 |
|---|
9/30/16 | $10,097 | $10,255 | $10,168 | $10,148 |
|---|
10/31/16 | $10,084 | $10,177 | $10,159 | $10,141 |
|---|
11/30/16 | $10,013 | $9,936 | $10,060 | $10,074 |
|---|
12/31/16 | $10,027 | $9,950 | $10,080 | $10,090 |
|---|
1/31/17 | $10,055 | $9,969 | $10,118 | $10,125 |
|---|
2/28/17 | $10,092 | $10,036 | $10,166 | $10,159 |
|---|
3/31/17 | $10,097 | $10,031 | $10,177 | $10,170 |
|---|
4/30/17 | $10,134 | $10,109 | $10,225 | $10,207 |
|---|
5/31/17 | $10,170 | $10,186 | $10,271 | $10,244 |
|---|
6/30/17 | $10,169 | $10,176 | $10,272 | $10,245 |
|---|
7/31/17 | $10,216 | $10,220 | $10,327 | $10,297 |
|---|
8/31/17 | $10,239 | $10,312 | $10,362 | $10,324 |
|---|
9/30/17 | $10,234 | $10,263 | $10,352 | $10,317 |
|---|
10/31/17 | $10,239 | $10,268 | $10,364 | $10,331 |
|---|
11/30/17 | $10,206 | $10,255 | $10,333 | $10,302 |
|---|
12/31/17 | $10,222 | $10,302 | $10,346 | $10,316 |
|---|
1/31/18 | $10,184 | $10,184 | $10,303 | $10,286 |
|---|
2/28/18 | $10,151 | $10,087 | $10,263 | $10,253 |
|---|
3/31/18 | $10,153 | $10,152 | $10,265 | $10,259 |
|---|
4/30/18 | $10,156 | $10,076 | $10,255 | $10,261 |
|---|
5/31/18 | $10,197 | $10,148 | $10,300 | $10,305 |
|---|
6/30/18 | $10,188 | $10,136 | $10,291 | $10,295 |
|---|
7/31/18 | $10,214 | $10,138 | $10,320 | $10,325 |
|---|
8/31/18 | $10,263 | $10,203 | $10,373 | $10,376 |
|---|
9/30/18 | $10,260 | $10,138 | $10,368 | $10,371 |
|---|
10/31/18 | $10,250 | $10,058 | $10,357 | $10,371 |
|---|
11/30/18 | $10,252 | $10,118 | $10,361 | $10,377 |
|---|
12/31/18 | $10,332 | $10,304 | $10,450 | $10,459 |
|---|
1/31/19 | $10,435 | $10,413 | $10,560 | $10,561 |
|---|
2/28/19 | $10,467 | $10,407 | $10,606 | $10,594 |
|---|
3/31/19 | $10,566 | $10,607 | $10,724 | $10,701 |
|---|
4/30/19 | $10,595 | $10,609 | $10,765 | $10,734 |
|---|
5/31/19 | $10,658 | $10,798 | $10,843 | $10,804 |
|---|
6/30/19 | $10,743 | $10,933 | $10,954 | $10,896 |
|---|
7/31/19 | $10,753 | $10,957 | $10,970 | $10,909 |
|---|
8/31/19 | $10,847 | $11,241 | $11,086 | $11,007 |
|---|
9/30/19 | $10,854 | $11,181 | $11,089 | $11,014 |
|---|
10/31/19 | $10,901 | $11,215 | $11,145 | $11,065 |
|---|
11/30/19 | $10,908 | $11,209 | $11,152 | $11,085 |
|---|
12/31/19 | $10,947 | $11,202 | $11,197 | $11,129 |
|---|
1/31/20 | $11,033 | $11,417 | $11,299 | $11,213 |
|---|
2/29/20 | $11,102 | $11,623 | $11,381 | $11,287 |
|---|
3/31/20 | $10,745 | $11,554 | $10,931 | $10,921 |
|---|
4/30/20 | $11,027 | $11,760 | $11,265 | $11,197 |
|---|
5/31/20 | $11,164 | $11,814 | $11,438 | $11,338 |
|---|
6/30/20 | $11,253 | $11,889 | $11,569 | $11,454 |
|---|
7/31/20 | $11,319 | $12,066 | $11,669 | $11,534 |
|---|
8/31/20 | $11,336 | $11,969 | $11,705 | $11,560 |
|---|
9/30/20 | $11,322 | $11,962 | $11,695 | $11,551 |
|---|
10/31/20 | $11,335 | $11,909 | $11,717 | $11,571 |
|---|
11/30/20 | $11,392 | $12,026 | $11,789 | $11,629 |
|---|
12/31/20 | $11,425 | $12,042 | $11,836 | $11,670 |
|---|
1/31/21 | $11,420 | $11,956 | $11,836 | $11,664 |
|---|
2/28/21 | $11,400 | $11,784 | $11,802 | $11,643 |
|---|
3/31/21 | $11,355 | $11,636 | $11,773 | $11,603 |
|---|
4/30/21 | $11,405 | $11,728 | $11,826 | $11,657 |
|---|
5/31/21 | $11,445 | $11,767 | $11,871 | $11,702 |
|---|
6/30/21 | $11,431 | $11,849 | $11,864 | $11,687 |
|---|
7/31/21 | $11,467 | $11,982 | $11,905 | $11,731 |
|---|
8/31/21 | $11,458 | $11,959 | $11,903 | $11,723 |
|---|
9/30/21 | $11,432 | $11,855 | $11,877 | $11,703 |
|---|
10/31/21 | $11,372 | $11,852 | $11,821 | $11,640 |
|---|
11/30/21 | $11,343 | $11,887 | $11,800 | $11,612 |
|---|
12/31/21 | $11,351 | $11,857 | $11,796 | $11,622 |
|---|
1/31/22 | $11,216 | $11,601 | $11,658 | $11,484 |
|---|
2/28/22 | $11,135 | $11,472 | $11,551 | $11,402 |
|---|
3/31/22 | $10,937 | $11,153 | $11,305 | $11,201 |
|---|
4/30/22 | $10,781 | $10,730 | $11,152 | $11,049 |
|---|
5/31/22 | $10,872 | $10,799 | $11,221 | $11,142 |
|---|
6/30/22 | $10,725 | $10,630 | $11,090 | $10,989 |
|---|
7/31/22 | $10,895 | $10,889 | $11,234 | $11,163 |
|---|
8/31/22 | $10,759 | $10,582 | $11,117 | $11,027 |
|---|
9/30/22 | $10,521 | $10,125 | $10,865 | $10,786 |
|---|
10/31/22 | $10,496 | $9,993 | $10,825 | $10,764 |
|---|
11/30/22 | $10,722 | $10,361 | $11,051 | $10,988 |
|---|
12/31/22 | $10,708 | $10,314 | $11,075 | $11,002 |
|---|
1/31/23 | $10,884 | $10,632 | $11,253 | $11,174 |
|---|
2/28/23 | $10,744 | $10,357 | $11,125 | $11,041 |
|---|
3/31/23 | $10,891 | $10,620 | $11,265 | $11,195 |
|---|
4/30/23 | $10,968 | $10,684 | $11,348 | $11,277 |
|---|
5/31/23 | $10,918 | $10,568 | $11,308 | $11,228 |
|---|
6/30/23 | $10,896 | $10,530 | $11,278 | $11,210 |
|---|
7/31/23 | $10,966 | $10,523 | $11,358 | $11,291 |
|---|
8/31/23 | $10,973 | $10,456 | $11,377 | $11,302 |
|---|
9/30/23 | $10,918 | $10,190 | $11,324 | $11,239 |
|---|
10/31/23 | $10,915 | $10,029 | $11,314 | $11,228 |
|---|
11/30/23 | $11,152 | $10,483 | $11,563 | $11,482 |
|---|
12/31/23 | $11,356 | $10,884 | $11,773 | $11,699 |
|---|
1/31/24 | $11,403 | $10,855 | $11,833 | $11,747 |
|---|
2/29/24 | $11,342 | $10,701 | $11,778 | $11,692 |
|---|
3/31/24 | $11,418 | $10,800 | $11,853 | $11,775 |
|---|
4/30/24 | $11,344 | $10,527 | $11,784 | $11,705 |
|---|
5/31/24 | $11,455 | $10,706 | $11,907 | $11,820 |
|---|
6/30/24 | $11,520 | $10,807 | $11,974 | $11,891 |
|---|
7/31/24 | $11,698 | $11,059 | $12,165 | $12,075 |
|---|
8/31/24 | $11,825 | $11,218 | $12,296 | $12,207 |
|---|
9/30/24 | $11,943 | $11,369 | $12,424 | $12,334 |
|---|
10/31/24 | $11,842 | $11,087 | $12,317 | $12,224 |
|---|
11/30/24 | $11,914 | $11,204 | $12,388 | $12,300 |
|---|
12/31/24 | $11,891 | $11,021 | $12,377 | $12,284 |
|---|
1/31/25 | $11,956 | $11,079 | $12,452 | $12,357 |
|---|
2/28/25 | $12,065 | $11,323 | $12,573 | $12,469 |
|---|
3/31/25 | $12,115 | $11,327 | $12,623 | $12,525 |
|---|
4/30/25 | $12,194 | $11,372 | $12,705 | $12,606 |
|---|
5/31/25 | $12,217 | $11,290 | $12,727 | $12,632 |
|---|
6/30/25 | $12,334 | $11,464 | $12,847 | $12,755 |
|---|
|
| Average Annual Return [Table Text Block] |
Average Annual Total Returns (%) | 1 Year | 5 Years | Since
Inception
4/27/16 |
|---|
Fund NAV Returns | 7.07% | 1.85% | 2.31% |
|---|
Bloomberg U.S. Aggregate Bond Index | 6.08% | -0.73% | 1.50% |
|---|
ICE BofA Merrill Lynch 1-5 Year U.S. Corporate Index | 7.29% | 2.12% | 2.77% |
|---|
WisdomTree U.S. Short-term Quality Corporate Bond Index | 7.27% | 2.17% | 2.69% |
|---|
|
| AssetsNet |
$ 48,768,300
|
| Holdings Count | Holding |
487
|
| Advisory Fees Paid, Amount |
$ 84,578
|
| InvestmentCompanyPortfolioTurnover |
46.00%
|
| Additional Fund Statistics [Text Block] |
- Total Net Assets$48,768,300
- # of Portfolio Holdings487
- Portfolio Turnover Rate46%
- Investment Advisory Fees Paid, Net$84,578
|
| Holdings [Text Block] |
Sector Breakdown (% of Net Assets)Financials | 42.7% |
|---|
Health Care | 11.5% |
|---|
Industrials | 8.7% |
|---|
Information Technology | 7.7% |
|---|
Utilities | 7.1% |
|---|
Energy | 6.3% |
|---|
Consumer Staples | 5.4% |
|---|
Communication Services | 3.9% |
|---|
Consumer Discretionary | 3.9% |
|---|
Materials | 2.1% |
|---|
Other Assets and Liabilities, Net | 0.7% |
|---|
Total | 100.0% |
|---|
|
| Largest Holdings [Text Block] |
Top 10 Holdings (% of Net Assets)Bank of America Corp., 1.73%, due 7/22/2027 | 1.1% |
|---|
Morgan Stanley, 1.51%, due 7/20/2027 | 0.9% |
|---|
Deutsche Bank AG, 6.72%, due 1/18/2029 | 0.8% |
|---|
Bank of America Corp., 2.55%, due 2/4/2028 | 0.7% |
|---|
L3Harris Technologies, Inc., 4.40%, due 6/15/2028 | 0.7% |
|---|
Bank of America Corp., 3.71%, due 4/24/2028 | 0.6% |
|---|
Elevance Health, Inc., 4.10%, due 3/1/2028 | 0.6% |
|---|
Bank of America Corp., 5.20%, due 4/25/2029 | 0.6% |
|---|
Philip Morris International, Inc., 4.88%, due 2/13/2029 | 0.6% |
|---|
Truist Financial Corp., 1.27%, due 3/2/2027 | 0.6% |
|---|
|
| Material Fund Change [Text Block] |
|
| Updated Prospectus Phone Number |
1-866-909-WISE (9473)
|
| Updated Prospectus Web Address |
<span style="box-sizing: border-box; color: rgb(0, 0, 0); display: inline; flex-wrap: nowrap; font-size: 10.6667px; font-weight: 400; grid-area: auto; line-height: 10.6667px; margin: 0px; overflow: visible; text-align: left; text-align-last: auto; white-space-collapse: preserve-breaks;">www.wisdomtree.com/investments/regulatory</span>
|