Shareholder Report
Jun. 30, 2025
USD ($)
Holding
capitalgroup.com/EMEF-M-literature
(800) 421-4225
Share class | Costs of a $10,000 investment | Costs paid as a percentage of a $10,000 investment |
| Class M | $ 75 | 0.69 % |
Management's discussion of fund performance
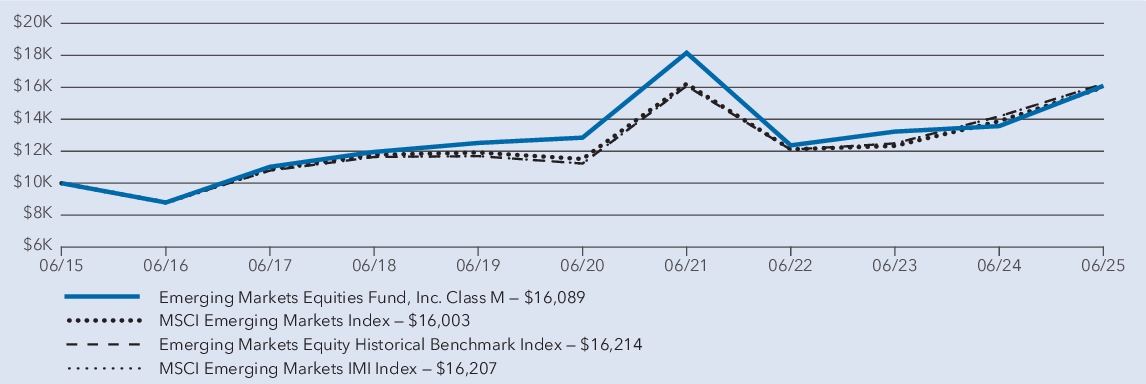
The fund’s Class M shares gained 18.55% for the year .
ended
June 30, 2025. That result compares with a 15.29% gain for the MSCI Emerging Markets Index. For information on returns for additional periods
, including the fund lifetime, please refer to capitalgroup.com/EMEF-M
What factors influenced results
During the fund’s fiscal year, emerging market equities saw double-digit returns, driven by a weakening U.S. dollar, cooling inflation and stability in key economies. China’s stock
market
posted robust gains, fueled by government stimulus and a modest rise in exports, despite tariff uncertainty. Indian markets remained resilient despite foreign investor outflows, weakening corporate earnings and escalating geopolitical tensions. Taiwan benefited from strong artificial intelligence-driven tech demand and inventory stocking by foreign firms in anticipation of U.S. tariff hikes.The fund benefited from strong stock selection, with holdings in health care, financials, communication services and industrials seeing the most robust positive returns. Holdings in information technology and consumer discretionary were also positive, though below the portfolio’s overall return. From a country perspective, China, Brazil and Taiwan contributed meaningfully to absolute returns.
Conversely, investments in the energy, utilities and consumer staples sectors were the notable detractors to overall results. The fund’s holdings in the real estate and materials sectors also saw negative returns. Holdings in India and Korea had positive returns but lagged those of the overall fund.
Average annual total returns
1 year | 5 years | 10 years | |
| Emerging Markets Equities Fund — Class M * | 18.55 % | 4.60 % | 4.87 % |
| MSCI Emerging Markets Index † | 15.29 % | 6.81 % | 4.81 % |
| Emerging Markets Equity Historical Benchmark Index † | 14.33 % | 7.62 % | 4.95 % |
| MSCI Emerging Markets IMI Index † | 14.28 % | 7.61 % | 4.95 % |
Effective June 2, 2025, the fund’s primary benchmark changed from the Emerging Markets Equity Historical Benchmark Index (formerly known as the MSCI Emerging Markets Investable Market Index (IMI) (linked index)) (the “Previous Primary Benchmark”) to the MSCI Emerging Markets Index, a broad-based index that represents the overall applicable securities market, as required by the U.S.
Securities
and Exchange Commission (“SEC”). The Previous Primary Benchmark provides a means to compare the fund’s results to a benchmark that the investment adviser believes is more representative of the fund’s investment universe over the fund’s lifetime. There is no change in the fund’s investment strategies as a result of the benchmark change.*
Investment results assume all distributions are reinvested and reflect applicable fees and expenses. When applicable, results reflect fee waivers and/or expense reimbursements, without which they would have been lower.†
Results assume all distributions are reinvested. Any market index shown
is unmanaged, and therefore, has no expenses. Investors cannot invest directly in an index. Source(s): MSCI. Securities
and Exchange Commission (“SEC”).
Key fund statistics
| Fund net assets (in millions) | $ 574 |
| Total number of portfolio holdings | 122 |
| Total advisory fees paid (in millions) | $ 7 |
| Portfolio turnover rate | 57 % |
Portfolio holdings by se
(percent of net assets)cto
r 
Material
fun
d changesThis is a summary of certain changes to the fund since July 1, 2024. For more complete information, you may review the fund’s next prospectus, which we expect to be available by September 1, 2025 at or upon request at
capitalgroup.com/EMEF-M-literature
(800) 421-4225.
Effective June 2, 2025, the fund name is
Emerging
Markets Equities Fund, Inc.Emerging
Markets Equities Fund, Inc.
This is a summary of certain changes to the fund since July 1, 2024. For more complete information, you may review the fund’s next prospectus, which we expect to be available by September 1, 2025 at or upon request at
capitalgroup.com/EMEF-M-literature
(800) 421-4225.
capitalgroup.com/EMEF-F2-literature
(800) 421-4225
.
Share class | Costs of a $10,000 investment | Costs paid as a percentage of a $10,000 investment |
| Class F-2 | $ 8* | 0.96 % † |
*
Based on operations for the period from June 2, 2025 to June 30
, 2025. Expenses for the full year
would be higher.†
Annualized.Management's discussion of fund performance
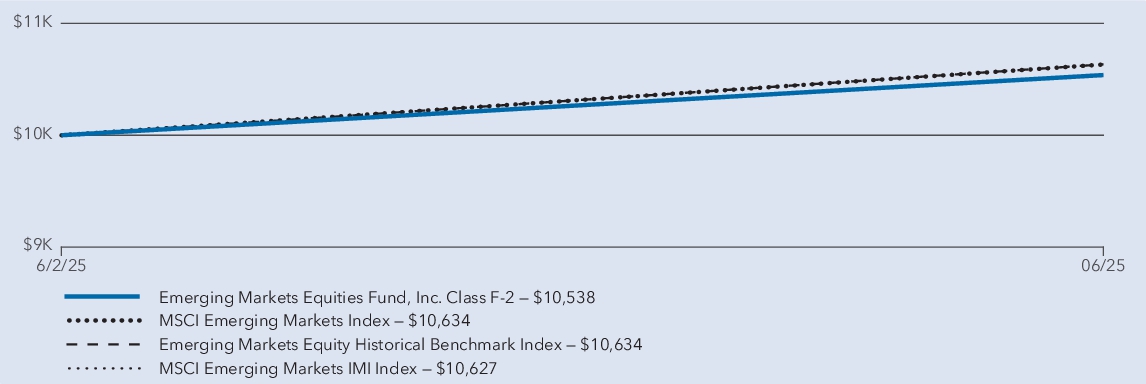
The fund’s Class F-2 shares gained 5.38% for the
period
from June 2, 2025 to June 30, 2025. That result compares with a 6.34% gain for the MSCI Emerging Markets
Index.What factors influenced results
During the fund’s fiscal year, emerging market equities saw double-digit returns, driven by a weakening U.S. dollar, cooling inflation and stability in key economies. China’s stock market posted robust gains, fueled by government stimulus and a modest rise in exports, despite tariff uncertainty. Indian markets remained resilient despite foreign investor outflows, weakening corporate earnings and escalating geopolitical tensions. Taiwan benefited from strong artificial intelligence-driven tech demand and inventory stocking by foreign firms in anticipation of U.S. tariff hikes.
The fund benefited from strong stock selection, with holdings in health care, financials, communication services and industrials seeing the most robust positive returns. Holdings in information technology
and
consumer discretionary were also positive, though below the portfolio’s overall return. From a country perspective, China, Brazil and Taiwan contributed meaningfully to absolute returns.Conversely, investments in the energy, utilities and consumer staples sectors were the notable detractors to overall results. The fund’s holdings in the real estate and materials sectors also saw negative returns. Holdings in India and Korea had positive returns but lagged those of the overall fund.
Average annual total returns
Since inception 1 | |
| Emerging Markets Equities Fund — Class F-2 2 | 5.38 % |
| MSCI Emerging Markets Index 3 | 6.34 % |
| Emerging Markets Equity Historical Benchmark Index 3 | 6.34 % |
| MSCI Emerging Markets IMI Index 3 | 6.27 % |
Effective June 2, 2025, the fund’s primary benchmark changed from the Emerging Markets Equity Historical Benchmark Index (formerly known as the MSCI Emerging Markets Investable Market Index (IMI) (linked index)) (the “Previous Primary Benchmark”) to the MSCI Emerging Markets Index, a broad-based index that represents the overall applicable securities market, as required by the U.S. Securities and Exchange Commission (“SEC”). The Previous Primary Benchmark provides a means to compare the fund’s results to a benchmark that the investment adviser believes is more representative of the fund’s investment universe over the fund’s lifetime. There is no change in the fund’s investment strategies as a result of the benchmark change.
1
Class F-2 shares were first offered on June 2, 2025.2
Investment results assume all distributions are reinvested and reflect applicable fees and expenses. When applicable, results reflect fee waivers and/or expense reimbursements, without which they would have been lower.3
Results assume all distributions are reinvested. Any market index shown is unmanaged, and therefore, has no expenses. Investors cannot invest directly in an index. Source(s): MSCI.Key fund statistics
| Fund net assets (in millions) | $ 574 |
| Total number of portfolio holdings | 122 |
| Total advisory fees paid (in millions) | $ 7 |
| Portfolio turnover rate | 57 % |
Portfolio holdings by sector
(percent of net assets)
Material fund changes
This is a summary of certain changes to the fund since July 1, 2024. For more complete information, you may review the fund’s next prospectus, which we expect to be available by September 1, 2025 at or upon request at (800) 421-4225.
capitalgroup.com/EMEF-F2-literature
Effective June 2, 2025, the fund name is Emerging
Markets
Equities Fund, Inc.Markets
Equities Fund, Inc.
This is a summary of certain changes to the fund since July 1, 2024. For more complete information, you may review the fund’s next prospectus, which we expect to be available by September 1, 2025 at or upon request at (800) 421-4225.
capitalgroup.com/EMEF-F2-literature
capitalgroup.com/EMEF-F3-literature
(800) 421-4225
.
investment
Share class | Costs of a $10,000 investment | Costs paid as a percentage of a $10,000 investment |
| Class F-3 | $ 80 | 0.73 % |
Management's discussion of fund performance
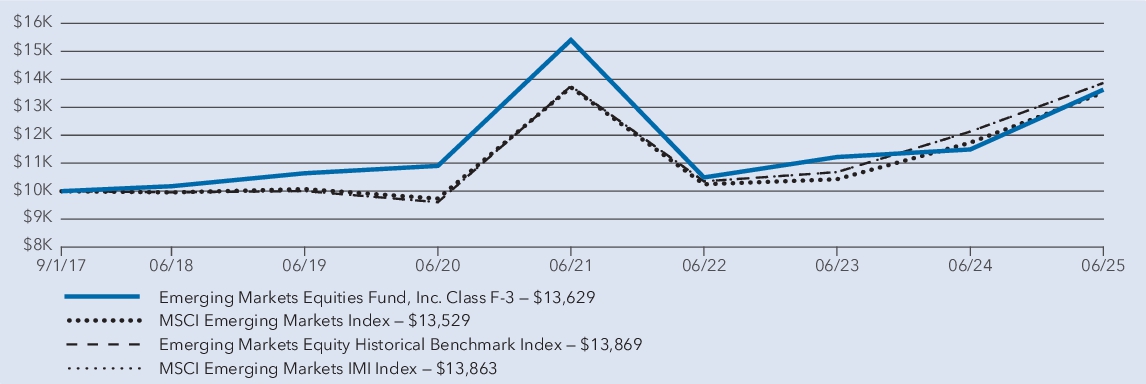
The fund’s Class F-3 shares gained 18.60% for the year ended June 30, 2025. That .
result
compares with a 15.29% gain for the MSCI Emerging Markets Index. For information on returns
for additional
periods, including
the fund lifetime, please refer to capitalgroup.com/EMEF-F3
The fund benefited from strong stock selection, with holdings in health care, financials, communication services and industrials seeing the most robust positive returns. Holdings in information technology and consumer discretionary were also positive, though below the portfolio’s overall return. From a country perspective, China, Brazil and Taiwan contributed meaningfully to absolute returns.
Conversely, investments in the energy, utilities and consumer staples sectors were the notable detractors to overall results. The fund’s holdings in the real estate and materials sectors also saw negative returns. Holdings in India and Korea had positive returns but lagged those of the overall fund.
How a hypothetical $10,000 investment has grown
Figures assume reinvestment of dividends and capital gains.
Average annual total returns
1 year | 5 years | Since inception 1 | |
| Emerging Markets Equities Fund — Class F-3 2 | 18.60 % | 4.56 % | 4.03 % |
| MSCI Emerging Markets Index 3 | 15.29 % | 6.81 % | 3.94 % |
| Emerging Markets Equity Historical Benchmark Index 3 | 14.33 % | 7.62 % | 4.27 % |
| MSCI Emerging Markets IMI Index 3 | 14.28 % | 7.61 % | 4.26 % |
Effective June 2, 2025, the fund’s primary benchmark changed from the Emerging Markets Equity Historical Benchmark Index (formerly known as the MSCI Emerging Markets Investable Market Index (IMI) (linked index)) (the “Previous Primary Benchmark”) to the MSCI Emerging Markets Index, a broad-based index that represents the overall applicable securities market, as required by the U.S. Securities and Exchange Commission (“SEC”). The Previous Primary Benchmark provides a means to compare the fund’s results to a benchmark that the investment adviser believes is more representative of the fund’s investment universe over the fund’s lifetime. There is no change in the fund’s investment strategies as a result of the benchmark change.
1
Class F-3 shares were first offered on September 1, 2017.2
Investment results assume all distributions are reinvested and reflect applicable fees and expenses. When applicable, results reflect fee waivers and/or expense reimbursements, without which they would have been lower.3
Results assume all distributions are reinvested. Any market index shown is unmanaged, and therefore, has no expenses. Investors cannot invest directly in an index. Source(s): MSCI.Key fund statistics
| Fund net assets (in millions) | $ 574 |
| Total number of portfolio holdings | 122 |
| Total advisory fees paid (in millions) | $ 7 |
| Portfolio turnover rate | 57 % |
Portfolio holdings by sector
(percent of net assets)
Material fund changes
This is a summary of certain changes to the fund since July 1, 2024. For more complete information, you may review the fund’s next or upon request at (800) 421-4225.
prospectus
, which we expect to be available by September 1, 2025 at capitalgroup.com/EMEF-F3-literature
Effective June 2, 2025, the fund name
is
Emerging Markets Equities
Fund, Inc.is
Emerging Markets Equities
Fund, Inc.
This is a summary of certain changes to the fund since July 1, 2024. For more complete information, you may review the fund’s next or upon request at (800) 421-4225.
prospectus
, which we expect to be available by September 1, 2025 at capitalgroup.com/EMEF-F3-literature
capitalgroup.com/EMEF-R6-literature
(800) 421-4225
.
What were the fund costs for the l
(based on a hypothetical $10,000 investment)a
st year?Share class | Costs of a $10,000 investment | Costs paid as a percentage of a $10,000 investment |
| Class R-6 | $ 81 | 0.74 % |
Management's discussion of fund performance
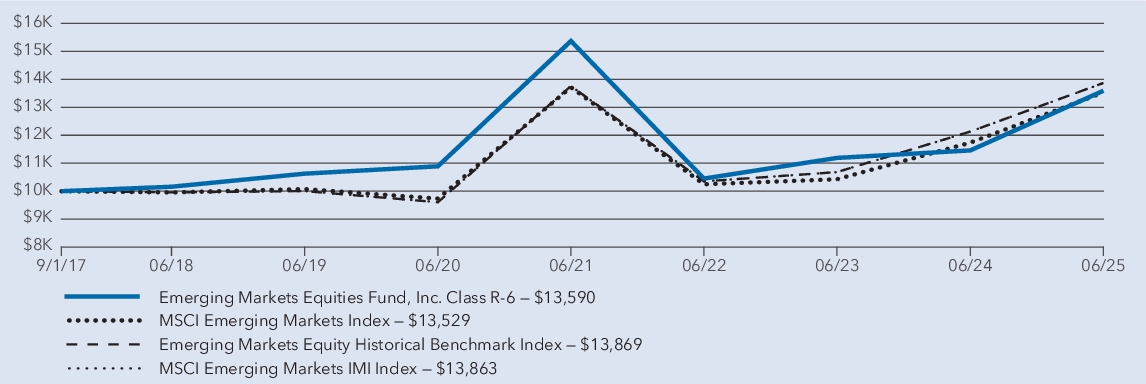
The fund’s Class R-6 shares gained 18.61% for the year ended June 30, 2025. That result compares with a 15.29% gain for the MSCI Emerging Markets Index. For information on returns for additional periods, including the fund lifetime, please refer to .
capitalgroup.com/EMEF-R6
The fund benefited from strong stock selection, with holdings in health care, financials, communication services and industrials seeing the most robust positive returns. Holdings in information technology and consumer discretionary were also positive, though below the portfolio’s overall return. From a country perspective, China, Brazil and Taiwan contributed meaningfully to absolute returns.
Conversely, investments in the energy, utilities and consumer staples sectors were the notable detractors to overall results. The fund’s holdings in the real estate and materials sectors also saw negative returns. Holdings in India and Korea had positive returns but lagged those of the overall fund.
How a hypothetical $10,000 investment has grown
Figures assume reinvestment of dividends and capital gains.
Average annual total returns
1 year | 5 years | Since inception 1 | |
| Emerging Markets Equities Fund — Class R-6 2 | 18.61 % | 4.53 % | 4.00 % |
| MSCI Emerging Markets Index 3 | 15.29 % | 6.81 % | 3.94 % |
| Emerging Markets Equity Historical Benchmark Index 3 | 14.33 % | 7.62 % | 4.27 % |
| MSCI Emerging Markets IMI Index 3 | 14.28 % | 7.61 % | 4.26 % |
Effective June 2, 2025, the fund’s primary benchmark changed from the Emerging Markets Equity Historical Benchmark Index (formerly known as the MSCI Emerging Markets Investable Market Index (IMI) (linked index)) (the “Previous Primary Benchmark”) to the MSCI Emerging Markets Index, a broad-based index that represents the overall applicable securities market, as required by the U.S. Securities and Exchange Commission (“SEC”). The Previous Primary Benchmark provides a means to compare the fund’s results to a benchmark that the investment adviser believes is more representative of the fund’s investment universe over the fund’s lifetime. There is no change in the fund’s investment strategies as a result of the benchmark change.
1
Class R-6 shares were first offered on September 1, 2017.2
Investment results assu
me all distributions are reinvested and reflect applicable fees and expenses. When applicable, results reflect fee waivers and/or expense reimbursements, without which they would have been lower.3
Results assume all distributions are reinvested. Any market
index shown is unmanaged, and therefore, has no expenses. Investors cannot invest directly in an index. Source(s): MSCI.Key fund statistics
| Fund net assets (in millions) | $ 574 |
| Total number of portfolio holdings | 122 |
| Total advisory fees paid (in millions) | $ 7 |
| Portfolio turnover rate | 57 % |
Portfolio holdings by sector
(percent of net assets)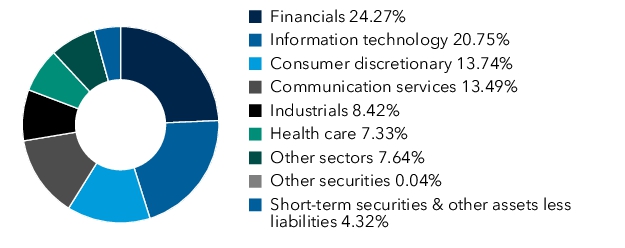
Material fund changes
This is a summary of certain changes to the fund since July 1, 2024. For more complete information, you may review the fund’s next prospectus, which we expect to be available by September 1, 2025 at or upon request at (800) 421-4225.
capitalgroup.com/EMEF-R6-literature
Effective June 2, 2025, the fund name is Emerging
Markets
Equities Fund, Inc.Markets
Equities Fund, Inc.
This is a summary of certain changes to the fund since July 1, 2024. For more complete information, you may review the fund’s next prospectus, which we expect to be available by September 1, 2025 at or upon request at (800) 421-4225.
capitalgroup.com/EMEF-R6-literature
| [1] | Based on operations for the period from June 2, 2025 to June 30, 2025. Expenses for the full year would be higher. |
| [2] | Annualized. |