Shareholder Report
Jun. 30, 2025
USD ($)
Holding
capitalgroup.com/mutual-fund-literature-A
(800) 421-4225
.
What were the fund costs for the last year?
(based on a hypothetical $10,000 investment)Share class | Costs of a $10,000 investment | Costs paid as a percentage of a $10,000 investment |
| Class A | $ 98 | 0.90 % |
Management's discussion of fund performance
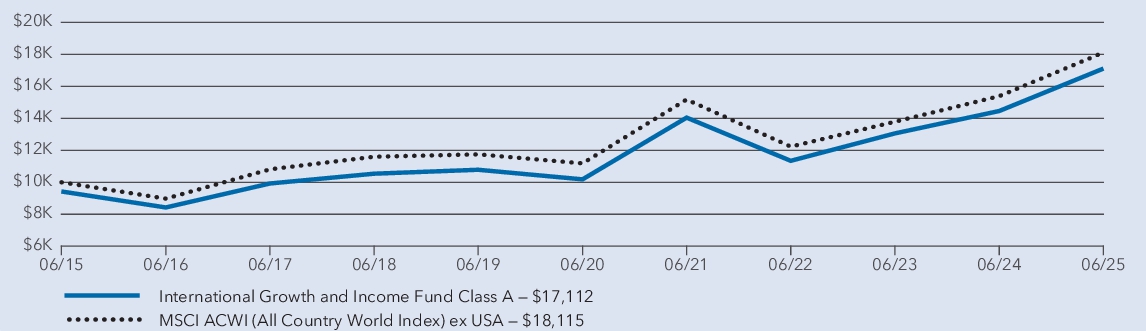
The fund’s Class A shares gained 18.34% for the year ended June 30, 2025. That result compares with a 17.72% gain for the MSCI ACWI (All Country World Index) ex USA. For information on returns for additional periods, including the fund lifetime, please refer to .
capitalgroup.com/mutual-fund-returns-A
What factors influenced results
International stocks advanced in a period marked by erratic trade policy and signs of
slowing
growth. Europe saw moderate growth driven by resilient domestic demand and easing inflation despite global trade tensions. Germany announced fiscal reforms, including plans to increase spending on defense and infrastructure projects, which are expected to boost the country’s economy and potentially have broader positive implications for Europe. The U.K. showed early signs of recovery, though persistent inflation limited overall momentum. Japan’s growth slowed, hindered by weak consumer spending and declining export demand. Among emerging markets, China’s growth was supported by targeted stimulus and a rebound in exports, while India’s economy remained resilient despite slower growth amid global headwinds.Overall, most sectors added to the fund’s positive results, with financials and utilities particularly additive. Likewise, holdings in industrials, communication services and consumer staples saw returns surpassing those of the overall portfolio. From a geographic perspective, shares of companies based in the eurozone and the United Kingdom contributed positively to absolute returns.
On the contrary, holdings in the health care sector saw negative returns during the period. Also, investments in companies based in European countries outside the eurozone were negative, and Japan holdings detracted from the broader portfolio’s return while remaining positive.
Average annual total
returns
1 year | 5 years | 10 years | |
| International Growth and Income Fund — Class A (with sales charge) * | 11.53 % | 9.63 % | 5.52 % |
| International Growth and Income Fund — Class A (without sales charge) * | 18.34 % | 10.94 % | 6.14 % |
| MSCI ACWI (All Country World Index) ex USA † | 17.72 % | 10.13 % | 6.12 % |
*
Investment results assume all distributions are reinvested and reflect applicable fees and expenses. When applicable, results reflect fee waivers and/or expense reimbursements, without which they would have been lower.†
Results assume all distributions are reinvested. Any market index shown is unmanaged, and therefore, has no expenses. Investors cannot invest directly in an index. Source(s): MSCI.Key fund statistics
| Fund net assets (in millions) | $ 17,258 |
| Total number of portfolio holdings | 290 |
| Total advisory fees paid (in millions) | $ 74 |
| Portfolio turnover rate | 40 % |
Portfolio holdings by sector
(percent of net assets)
capitalgroup.com/mutual-fund-literature-C
(800) 421-4225
.
What were the fund costs for the last year?
(based on a hypothetical $10,000 investment)Share class | Costs of a $10,000 investment | Costs paid as a percentage of a $10,000 investment |
| Class C | $ 179 | 1.65 % |
Management's discussion of fund performance
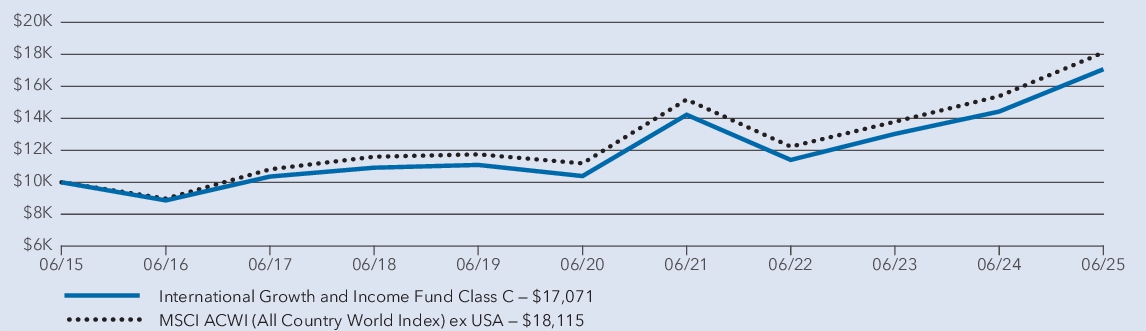
The fund’s Class C shares gained 17.44% for .
the
year ended June 30, 2025. That result compares with a 17.72% gain for the MSCI ACWI (All Country World Index) ex USA. For information on returns for additional periods, including the fund lifetime, please refer to capitalgroup.com/mutual-fund-returns-C
What factors influenced results
International stocks advanced in a period marked by erratic trade policy and signs of slowing growth. Europe saw moderate growth driven by resilient domestic demand and easing inflation despite global trade tensions. Germany announced fiscal reforms, including plans to increase spending on defense and infrastructure projects, which are expected to boost the country’s economy and potentially have broader positive implications for Europe. The U.K. showed early signs of recovery, though persistent inflation limited overall momentum. Japan’s growth slowed, hindered by weak consumer spending and declining export demand. Among emerging markets, China’s growth was supported by targeted stimulus and a rebound in exports, while India’s economy remained resilient despite slower growth amid global headwinds.
Overall, most sectors added to the fund’s positive results, with financials and utilities particularly additive. Likewise, holdings in industrials, communication services and consumer staples saw returns surpassing those of the overall portfolio. From a geographic perspective, shares of companies based in the eurozone and the United Kingdom contributed positively to absolute returns.
On the contrary, holdings in the health care sector saw negative returns during the period. Also, investments in companies based in European countries outside the eurozone were negative, and Japan holdings detracted from the broader portfolio’s return while remaining positive.
Average annual total returns
1 year | 5 years | 10 years | |
| International Growth and Income Fund — Class C (with sales charge) * | 16.44 % | 10.12 % | 5.49 % |
| International Growth and Income Fund — Class C (without sales charge) * | 17.44 % | 10.12 % | 5.49 % |
| MSCI ACWI (All Country World Index) ex USA † | 17.72 % | 10.13 % | 6.12 % |
*
Investment results assume all distributions are reinvested and reflect applicable fees and expenses. When applicable, results reflect fee waivers and/or expense reimbursements, without which they would have been lower.†
Results assume all distributions are reinvested. Any market index shown is unmanaged
, and therefore
, has no expenses. Investors cannot invest directly in an index. Source(s): MSCI.Key fund statistics
| Fund net assets (in millions) | $ 17,258 |
| Total number of portfolio holdings | 290 |
| Total advisory fees paid (in millions) | $ 74 |
| Portfolio turnover rate | 40 % |
Portfolio holdings by sector
(percent of net assets)
capitalgroup.com/mutual-fund-literature
(800) 421-4225
.
What were the fund costs for the last year?
(based on a hypothetical $10,000 investment)Share class | Costs of a $10,000 investment | Costs paid as a percentage of a $10,000 investment |
| Class T | $ 71 | 0.65 % |
Management's discussion of fund performance
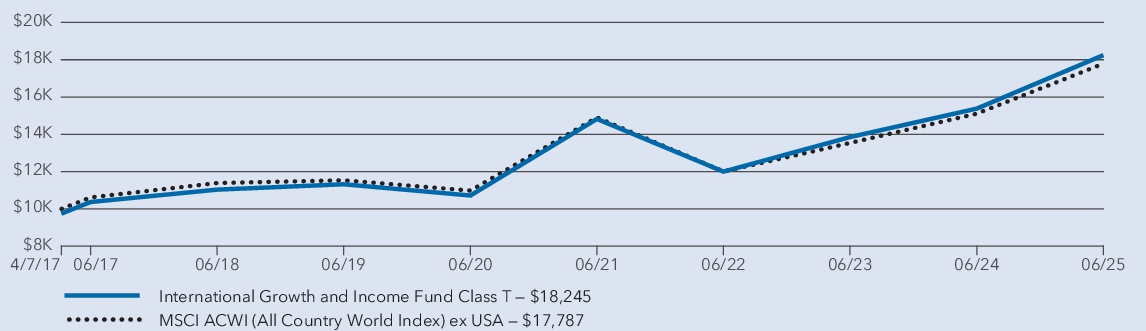
The fund’s Class T shares gained 18.63% for the year ended June 30, 2025. That result compares with a 17.72%
gain
for the MSCI ACWI (All Country World Index) ex USA.What factors influenced results
International stocks advanced in a period marked by erratic trade policy and signs of slowing growth. Europe saw moderate growth driven by resilient domestic demand and easing inflation despite global trade tensions. Germany announced fiscal reforms, including plans to increase spending on defense and infrastructure projects, which are expected to boost the country’s economy and potentially have broader positive implications for Europe. The U.K. showed early signs of recovery, though persistent inflation limited overall momentum. Japan’s growth slowed, hindered by weak consumer spending and declining export demand. Among emerging markets, China’s growth was supported by targeted stimulus and a rebound in exports, while India’s economy remained resilient despite slower growth amid global headwinds.
Overall, most sectors added to the fund’s positive results, with financials and utilities particularly additive. Likewise, holdings in industrials, communication services and consumer staples saw returns surpassing those of the overall portfolio. From a geographic perspective, shares of companies based in the eurozone and the United Kingdom contributed positively to absolute returns.
On the contrary, holdings in the health care sector saw negative returns during the period. Also, investments in companies based in European countries outside the eurozone were negative, and Japan holdings detracted from the broader portfolio’s return while remaining positive.
Average annual total returns
1 year | 5 years | Since inception 1 | |
| International Growth and Income Fund — Class T (with sales charge) 2 | 15.64 % | 10.66 % | 7.58 % |
| International Growth and Income Fund — Class T (without sales charge) 2 | 18.63 % | 11.22 % | 7.91 % |
| MSCI ACWI (All Country World Index) ex USA 3 | 17.72 % | 10.13 % | 7.25 % |
1
Class T shares were first offered on April 7, 2017.2
Investment results assume all distributions are reinvested and reflect applicable fees and expenses. When applicable, results reflect fee waivers and/or expense reimbursements, without which they would have been lower.3
Results assume all distributions are reinvested. Any market index shown
is unmanaged
, and therefore, has no expenses. Investors cannot invest directly in an index. Source(s): MSCI.Key fund statistics
| Fund net assets (in millions) | $ 17,258 |
| Total number of portfolio holdings | 290 |
| Total advisory fees paid (in millions) | $ 74 |
| Portfolio turnover rate | 40 % |
Portfolio holdings by sector
(percent of net assets)
capitalgroup.com/mutual-fund-literature-F1
(800) 421-4225
.
What were the fund costs for the last year?
(based on a hypothetical $10,000 investment)Share class | Costs of a $10,000 investment | Costs paid as a percentage of a $10,000 investment |
| Class F-1 | $ 100 | 0.92 % |
Management's discussion of fund performance
The fund’s Class F-1 shares gained 18.32% for the year ended June 30, 2025. That result compares with a 17.72% gain for the MSCI ACWI (All Country World .
Index
) ex USA. For information on returns for additional periods, including the fund lifetime, please refer to capitalgroup.com/mutual-fund-returns-F1
What factors influenced results
International stocks advanced in a period marked by erratic trade policy and signs of slowing growth. Europe saw moderate growth driven by resilient domestic demand and easing inflation despite global trade tensions. Germany announced fiscal reforms, including plans to increase spending on defense and infrastructure projects, which are expected to boost the country’s economy and potentially have broader positive implications for Europe. The U.K. showed early signs of recovery, though persistent inflation limited overall momentum. Japan’s growth slowed, hindered by weak consumer spending and declining export demand. Among emerging markets, China’s growth was supported by targeted stimulus and a rebound in exports, while India’s economy remained resilient despite slower growth amid global headwinds.
Overall, most sectors added to the fund’s positive results, with financials and utilities particularly additive. Likewise, holdings in industrials, communication services and consumer staples saw returns surpassing those of the overall portfolio. From a geographic perspective, shares of companies based in the eurozone and the United Kingdom contributed positively to absolute returns.
On the contrary, holdings in the health care sector saw negative returns during the period. Also, investments in companies based in European countries outside the eurozone were negative, and Japan holdings detracted from the broader portfolio’s return while remaining positive.

Average annual total returns
1 year | 5 years | 10 years | |
| International Growth and Income Fund — Class F-1 * | 18.32 % | 10.92 % | 6.12 % |
| MSCI ACWI (All Country World Index) ex USA † | 17.72 % | 10.13 % | 6.12 % |
*
Investment results assume all distributions are reinvested and reflect applicable fees and expenses. When applicable, results reflect fee waivers and/or expense reimbursements, without which they would have been lower.†
Results assume all distributions are reinvested. Any market index shown is unmanaged, and therefore, has
no expenses. Investors cannot invest directly in an index. Source(s): MSCI.Key fund statistics
| Fund net assets (in millions) | $ 17,258 |
| Total number of portfolio holdings | 290 |
| Total advisory fees paid (in millions) | $ 74 |
| Portfolio turnover rate | 40 % |
Portfolio holdings by sector
(percent of net assets)
capitalgroup.com/mutual-fund-literature-F2
(800) 421-4225
.
What were the fund costs for the last year?
(based on a hypothetical $10,000 investment)Share class | Costs of a $10,000 investment | Costs paid as a percentage of a $10,000 investment |
| Class F-2 | $ 70 | 0.64 % |
Management's discussion of fund performance
The fund’s Class F-2 shares gained 18.67% for the year ended June 30, 2025. That result compares with a 17.72% gain for the MSCI ACWI (.
All
Country World Index) ex USA. For information on returns for additional periods, including the fund lifetime, please refer to capitalgroup.com/mutual-fund-returns-F2
What factors influenced results
International stocks advanced in a period marked by erratic trade policy and signs of slowing growth. Europe saw moderate growth driven by resilient domestic demand and easing inflation despite global trade tensions. Germany announced fiscal reforms, including plans to increase spending on defense and infrastructure projects, which are expected to boost the country’s economy and potentially have broader positive implications for Europe. The U.K. showed early signs of recovery, though persistent inflation limited overall momentum. Japan’s growth slowed, hindered by weak consumer spending and declining export demand. Among emerging markets, China’s growth was supported by targeted stimulus and a rebound in exports, while India’s economy remained resilient despite slower growth amid global headwinds.
Overall, most sectors added to the fund’s positive results, with financials and utilities particularly additive. Likewise, holdings in industrials, communication services and consumer staples saw returns surpassing those of the overall portfolio. From a geographic perspective, shares of companies based in the eurozone and the United Kingdom contributed positively to absolute returns.
On the contrary, holdings in the health care sector saw negative returns during the period. Also, investments in companies based in European countries outside the eurozone were negative, and Japan holdings detracted from the broader portfolio’s return while remaining positive.

Average annual total returns
1 year | 5 years | 10 years | |
| International Growth and Income Fund — Class F-2 * | 18.67 % | 11.23 % | 6.41 % |
| MSCI ACWI (All Country World Index) ex USA † | 17.72 % | 10.13 % | 6.12 % |
*
Investment results assume all distributions are reinvested and reflect applicable fees and expenses. When applicable, results reflect fee waivers and/or expense reimbursements, without which they would have been lower.†
Results assume all distributions are reinvested. Any market index shown is unmanaged, and therefore, has no
expenses. Investors cannot invest directly in an index. Source(s): MSCI.Key fund statistics
| Fund net assets (in millions) | $ 17,258 |
| Total number of portfolio holdings | 290 |
| Total advisory fees paid (in millions) | $ 74 |
| Portfolio turnover rate | 40 % |
Portfolio holdings by sector
(percent of net assets)
capitalgroup.com/mutual-fund-literature-F3
(800) 421-4225
.
What were the fund costs for the last year?
(based on a hypothetical $10,000 investment)Share class | Costs of a $10,000 investment | Costs paid as a percentage of a $10,000 investment |
| Class F-3 | $ 58 | 0.53 % |
Management's discussion of fund performance
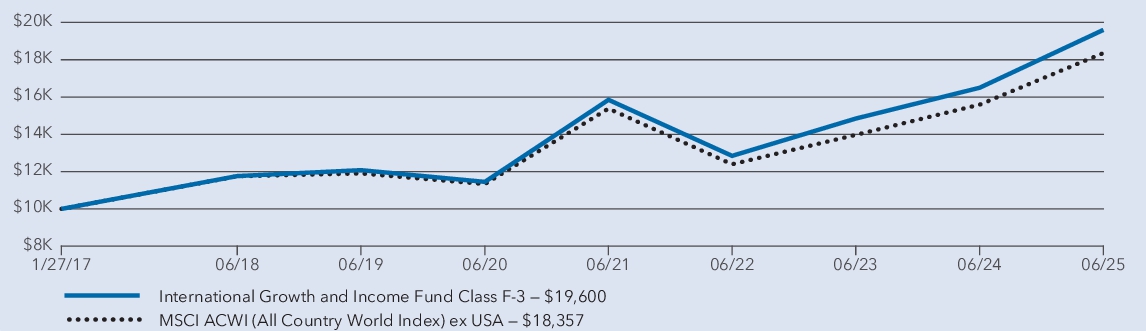
The fund’s Class F-3 shares gained 18.80% for the year ended June 30, 2025. That result compares with a .
17.72
% gain for the MSCI ACWI (All Country World Index) ex USA. For information on returns for additional periods, including the fund lifetime, please refer to capitalgroup.com/mutual-fund-returns-F3
What factors influenced results
International stocks advanced in a period marked by erratic trade policy and signs of slowing growth. Europe saw moderate growth driven by resilient domestic demand and easing inflation despite global trade tensions. Germany announced fiscal reforms, including plans to increase spending on defense and infrastructure projects, which are expected to boost the country’s economy and potentially have broader positive implications for Europe. The U.K. showed early signs of recovery, though persistent inflation limited overall momentum. Japan’s growth slowed, hindered by weak consumer spending and declining export demand. Among emerging markets, China’s growth was supported by targeted stimulus and a rebound in exports, while India’s economy remained resilient despite slower growth amid global headwinds.
Overall, most sectors added to the fund’s positive results, with financials and utilities particularly additive. Likewise, holdings in industrials, communication services and consumer staples saw returns surpassing those of the overall portfolio. From a geographic perspective, shares of companies based in the eurozone and the United Kingdom contributed positively to absolute returns.
On the contrary, holdings in the health care sector saw negative returns during the period. Also, investments in companies based in European countries outside the eurozone were negative, and Japan holdings detracted from the broader portfolio’s return while remaining positive.
Average annual total returns
1 year | 5 years | Since inception 1 | |
| International Growth and Income Fund — Class F-3 2 | 18.80 % | 11.35 % | 8.32 % |
| MSCI ACWI (All Country World Index) ex USA 3 | 17.72 % | 10.13 % | 7.48 % |
1
Class F-3 shares were first offered on January 27, 2017.2
Investment results assume all distributions are reinvested and reflect applicable fees and expenses. When applicable, results reflect fee waivers and/or expense reimbursements, without which they would have been lower.3
Results assume all distributions are reinvested. Any market index shown is unmanaged, and therefore, has no expenses. Investors cannot invest directly in an index. Source(s): MSCI
.Key fund statistics
| Fund net assets (in millions) | $ 17,258 |
| Total number of portfolio holdings | 290 |
| Total advisory fees paid (in millions) | $ 74 |
| Portfolio turnover rate | 40 % |
Portfolio holdings by sector
(percent of net assets)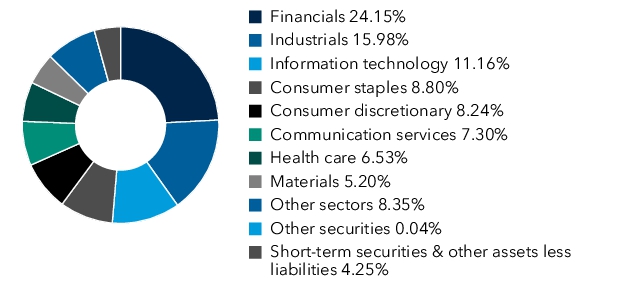
capitalgroup.com/mutual-fund-literature-529A
. You can also request this information by contacting us at
(800) 421-4225.
What were the fund costs for the last year?
(based on a hypothetical $10,000 investment)Share class | Costs of a $10,000 investment | Costs paid as a percentage of a $10,000 investment |
| Class 529-A | $ 102 | 0.93 % |
Management's discussion of fund performance
The fund’s Class 529-A shares gained 18.29% for the year ended June 30, 2025. That result compares with a 17.72% gain for the .
MSCI
ACWI (All Country World Index) ex USA. For information on returns for additional periods, including the fund lifetime, please refer to capitalgroup.com/mutual-fund-returns-529A
What factors influenced results
International stocks advanced in a period marked by erratic trade policy and signs of slowing growth. Europe saw moderate growth driven by resilient domestic demand and easing inflation despite global trade tensions. Germany announced fiscal reforms, including plans to increase spending on defense and infrastructure projects, which are expected to boost the country’s economy and potentially have broader positive implications for Europe. The U.K. showed early signs of recovery, though persistent inflation limited overall momentum. Japan’s growth slowed, hindered by weak consumer spending and declining export demand. Among emerging markets, China’s growth was supported by targeted stimulus and a rebound in exports, while India’s economy remained resilient despite slower growth amid global headwinds.
Overall, most sectors added to the fund’s positive results, with financials and utilities particularly additive. Likewise, holdings in industrials, communication services and consumer staples saw returns surpassing those of the overall portfolio. From a geographic perspective, shares of companies based in the eurozone and the United Kingdom contributed positively to absolute returns.
On the contrary, holdings in the health care sector saw negative returns during the period. Also, investments in companies based in European countries outside the eurozone were negative, and Japan holdings detracted from the broader portfolio’s return while remaining positive.

Average annual total returns
1 year | 5 years | 10 years | |
| International Growth and Income Fund — Class 529-A (with sales charge) * | 14.15 % | 10.12 % | 5.72 % |
| International Growth and Income Fund — Class 529-A (without sales charge) * | 18.29 % | 10.91 % | 6.10 % |
| MSCI ACWI (All Country World Index) ex USA † | 17.72 % | 10.13 % | 6.12 % |
*
Investment results assume all distributions are reinvested and reflect applicable fees and expenses. When applicable, results reflect fee waivers and/or expense reimbursements, without which they would have been lower.†
Results assume all distributions are reinvested. Any market index shown is unmanaged, and therefore, has no expenses. Investors cannot invest directly in an index. Source(s): MSCI.Key fund statistics
| Fund net assets (in millions) | $ 17,258 |
| Total number of portfolio holdings | 290 |
| Total advisory fees paid (in millions) | $ 74 |
| Portfolio turnover rate | 40 % |
Portfolio holdings by sector
(percent
of net assets
)
capitalgroup.com/mutual-fund-literature-529C
. You can also request this information by contacting us at
(800) 421-4225.
What were the fund costs for the last year?
(based on a hypothetical $10,000 investment)Share class | Costs of a $10,000 investment | Costs paid as a percentage of a $10,000 investment |
| Class 529-C | $ 185 | 1.70 % |
Management's discussion of fund performance
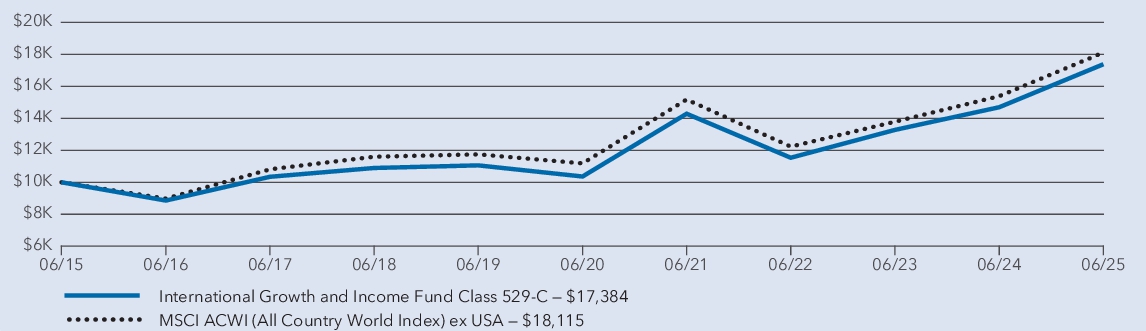
The fund’s Class 529-C shares gained 17.42% for the year ended June 30, 2025. That result compares with a 17.72% gain for the MSCI ACWI (All Country World Index) ex USA. For information on returns for additional periods, including the fund lifetime, please refer to .
capitalgroup.com/mutual-fund-returns-529C
What factors influenced results
International stocks advanced in a period marked by erratic trade policy and signs of slowing growth. Europe saw moderate growth driven by resilient domestic demand and easing inflation despite global trade tensions. Germany announced fiscal reforms, including plans to increase spending on defense and infrastructure projects, which are expected to boost the country’s economy and potentially have broader positive implications for Europe. The U.K. showed early signs of recovery, though persistent inflation limited overall momentum. Japan’s growth slowed, hindered by weak consumer spending and declining export demand. Among emerging markets, China’s growth was supported by targeted stimulus and a rebound in exports, while India’s economy remained resilient despite slower growth amid global headwinds.
Overall, most sectors added to the fund’s positive results, with financials and utilities particularly additive. Likewise, holdings in industrials, communication services and consumer staples saw returns surpassing those of the overall portfolio. From a geographic perspective, shares of companies based in the eurozone and the United Kingdom contributed positively to absolute returns.
On the contrary, holdings in the health care sector saw negative returns during the period. Also, investments in companies based in European countries outside the eurozone were negative, and Japan holdings detracted from the broader portfolio’s return while remaining positive.
Average annual total returns
1 year | 5 years | 10 years | |
| International Growth and Income Fund — Class 529-C (with sales charge) * | 16.42 % | 10.07 % | 5.69 % |
| International Growth and Income Fund — Class 529-C (without sales charge) * | 17.42 % | 10.07 % | 5.69 % |
| MSCI ACWI (All Country World Index) ex USA † | 17.72 % | 10.13 % | 6.12 % |
*
Investment results assume all distributions are reinvested and reflect applicable fees and expenses. When applicable, results reflect fee waivers and/or expense reimbursements, without which they would have been lower.†
Results assume all distributions are reinvested. Any market index shown is unmanaged, and therefore, has no expenses. Investors cannot invest directly in an index. Source(s): MSCI.reflect
the deduction
of taxes that a shareholder would pay on fund distributions or redemption of fund shares.
Key fund statistics
| Fund net assets (in millions) | $ 17,258 |
| Total number of portfolio holdings | 290 |
| Total advisory fees paid (in millions) | $ 74 |
| Portfolio turnover rate | 40 % |
Portfolio holdings by sector
(percent of net assets
)
capitalgroup.com/mutual-fund-literature-529E
. You can also request this information by contacting us at
(800) 421-4225.
What were the fund costs for the last year?
(based on a hypothetical $10,000 investment
)Share class | Costs of a $10,000 investment | Costs paid as a percentage of a $10,000 investment |
| Class 529-E | $ 123 | 1.13 % |
Management's discussion of fund performance
The fund’s Class 529-E shares gained 18.04% for the year ended June 30, 2025. That result compares with a 17.72% gain for the MSCI ACWI (All Country World Index) ex USA. For information on returns for additional periods, including the fund lifetime, please refer to .
capitalgroup.com/mutual-fund-returns-529E
What factors influenced results
International stocks advanced in a period marked by erratic trade policy and signs of slowing growth. Europe saw moderate growth driven by resilient domestic demand and easing inflation despite global trade tensions. Germany announced fiscal reforms, including plans to increase spending on defense and infrastructure projects, which are expected to boost the country’s economy and potentially have broader positive implications for Europe. The U.K. showed early signs of recovery, though persistent inflation limited overall momentum. Japan’s growth slowed, hindered by weak consumer spending and declining export demand. Among emerging markets, China’s growth was supported by targeted stimulus and a rebound in exports, while India’s economy remained resilient despite slower growth amid global headwinds.
Overall, most sectors added to the fund’s positive results, with financials and utilities particularly additive. Likewise, holdings in industrials, communication services and consumer staples saw returns surpassing those of the overall portfolio. From a geographic perspective, shares of companies based in the eurozone and the United Kingdom contributed positively to absolute returns.
On the contrary, holdings in the health care sector saw negative returns during the period. Also, investments in companies based in European countries outside the eurozone were negative, and Japan holdings detracted from the broader portfolio’s return while remaining positive.

Average annual total returns
1 year | 5 years | 10 years | |
| International Growth and Income Fund — Class 529-E * | 18.04 % | 10.69 % | 5.88 % |
| MSCI ACWI (All Country World Index) ex USA † | 17.72 % | 10.13 % | 6.12 % |
*
Investment results assume all distributions are reinvested and reflect applicable fees and expenses. When applicable
, results
reflect fee waivers and/or expense reimbursements, without which they would have been lower.†
Results assume all distributions are reinvested. Any market index shown is unmanaged, and therefore, has no expenses. Investors cannot invest directly in an index. Source(s): MSCI.Key fund statistics
| Fund net assets (in millions) | $ 17,258 |
| Total number of portfolio holdings | 290 |
| Total advisory fees paid (in millions) | $ 74 |
| Portfolio turnover rate | 40 % |
Portfolio holdings by sector
(percent of net assets)
capitalgroup.com/mutual-fund-literature
(800) 421-4225
.
What were the fund costs for the last year?
(based on a hypothetical $10,000 investment)Share class | Costs of a $10,000 investment | Costs paid as a percentage of a $10,000 investment |
| Class 529-T | $ 75 | 0.69 % |
Management's discussion of fund performance
The fund’s Class 529-T shares gained 18.58% for the year ended June 30, 2025. That result compares with a 17.72% gain for the MSCI ACWI (All Country World Index) ex USA.
What factors influenced results
International stocks advanced in a period marked by erratic trade policy and signs of slowing growth. Europe saw moderate growth driven by resilient domestic demand and easing inflation despite global trade tensions. Germany announced fiscal reforms, including plans to increase spending on defense and infrastructure projects, which are expected to boost the country’s economy and potentially have broader positive implications for Europe. The U.K. showed early signs of recovery, though persistent inflation limited overall momentum. Japan’s growth slowed, hindered by weak consumer spending and declining export demand. Among emerging markets, China’s growth was supported by targeted stimulus and a rebound in exports, while India’s economy remained resilient despite slower growth amid global headwinds.
Overall, most sectors added to the fund’s positive results, with financials and utilities particularly additive. Likewise, holdings in industrials, communication services and consumer staples saw returns surpassing those of the overall portfolio. From a geographic perspective, shares of companies based in the eurozone and the United Kingdom contributed positively to absolute returns.
On the contrary, holdings in the health care sector saw negative returns during the period. Also, investments in companies based in European countries outside the eurozone were negative, and Japan holdings detracted from the broader portfolio’s return while remaining positive.

Average annual total returns
1 year | 5 years | Since inception 1 | |
| International Growth and Income Fund — Class 529-T (with sales charge)2 | 15.60 % | 10.61 % | 7.53 % |
| International Growth and Income Fund — Class 529-T (without sales charge)2 | 18.58 % | 11.17 % | 7.86 % |
| MSCI ACWI (All Country World Index) ex USA 3 | 17.72 % | 10.13 % | 7.25 % |
1
Class 529-T shares were first offered on April 7, 2017.2
Investment results assume all distributions are reinvested and reflect applicable fees and expenses. When applicable, results reflect fee waivers and/or expense reimbursements, without which they would have been lower.3
Results assume all distributions are reinvested. Any market index shown is unmanaged, and therefore, has no expenses. Investors cannot invest directly in an index. Source(s): MSCI.Key fund statistics
| Fund net assets (in millions) | $ 17,258 |
| Total number of portfolio holdings | 290 |
| Total advisory fees paid (in millions) | $ 74 |
| Portfolio turnover rate | 40 % |
Portfolio holdings by sector
(percent of net assets)
capitalgroup.com/mutual-fund-literature-529F1
(800) 421-4225
.
What were the fund costs for the last year?
(based on a hypothetical $10,000 investmen
t)
Share class | Costs of a $10,000 investment | Costs paid as a percentage of a $10,000 investment |
| Class 529-F-1 | $ 80 | 0.73 % |
Management's discussion of fund performance
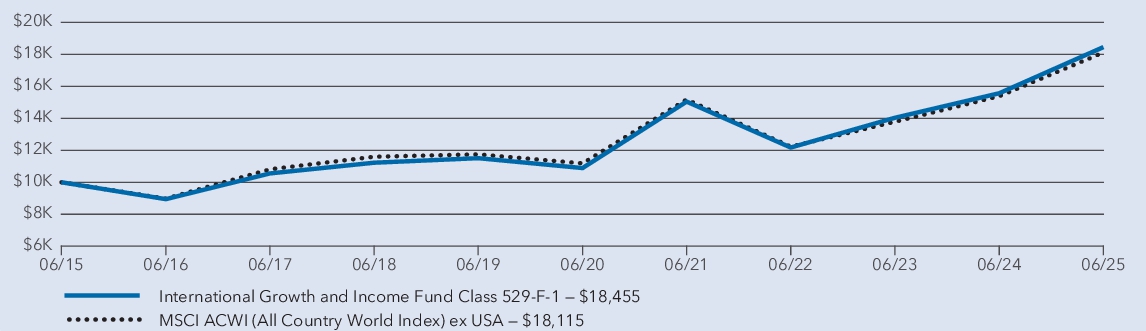
The fund’s Class 529-F-1 shares gained 18.52% for the year ended June 30, 2025. That result compares with a 17.72% gain for the MSCI ACWI (All Country World Index) ex USA. For information on returns for additional periods, including the fund lifetime, please refer to .
capitalgroup.com/mutual-fund-returns-529F1
What factors influenced results
International stocks advanced in a period marked by erratic trade policy and signs of slowing growth. Europe saw moderate growth driven by resilient domestic demand and easing inflation despite global trade tensions. Germany announced fiscal reforms, including plans to increase spending on defense and infrastructure projects, which are expected to boost the country’s economy and potentially have broader positive implications for Europe. The U.K. showed early signs of recovery, though persistent inflation limited overall momentum. Japan’s growth slowed, hindered by weak consumer spending and declining export demand. Among emerging markets, China’s growth was supported by targeted stimulus and a rebound in exports, while India’s economy remained resilient despite slower growth amid global headwinds.
Overall, most sectors added to the fund’s positive results, with financials and utilities particularly additive. Likewise, holdings in industrials, communication services and consumer staples saw returns surpassing those of the overall portfolio. From a geographic perspective, shares of companies based in the eurozone and the United Kingdom contributed positively to absolute returns.
On the contrary, holdings in the health care sector saw negative returns during the period. Also, investments in companies based in European countries outside the eurozone were negative, and Japan holdings detracted from the broader portfolio’s return while remaining positive.
Average annual total returns
1 year | 5 years | 10 years | |
| International Growth and Income Fund — Class 529-F-1* | 18.52 % | 11.13 % | 6.32 % |
| MSCI ACWI (All Country World Index) ex USA† | 17.72 % | 10.13 % | 6.12 % |
*
Investment results assume all distributions are reinvested and reflect applicable fees and expenses. When applicable, results reflect fee waivers and/or expense reimbursements, without which they would have been lower.†
Results assume all distributions are reinvested. Any market index shown is unmanaged, and therefore, has no expenses. Investors cannot invest directly in an index. Source(s): MSCI.Key fund statistics
| Fund net assets (in millions) | $ 17,258 |
| Total number of portfolio holdings | 290 |
| Total advisory fees paid (in millions) | $ 74 |
| Portfolio turnover rate | 40 % |
Portfolio holdings by sector
(percent
of net assets)
capitalgroup.com/mutual-fund-literature-529F2
. You can also request this information by contacting us at
(800) 421-4225.
What were the fund costs for the last year?
(based on a hypothetical $10,000 investment)Share class | Costs of a $10,000 investment | Costs paid as a percentage of a $10,000 investment |
| Class 529-F-2 | $ 70 | 0.64 % |
Management's discussion of fund performance
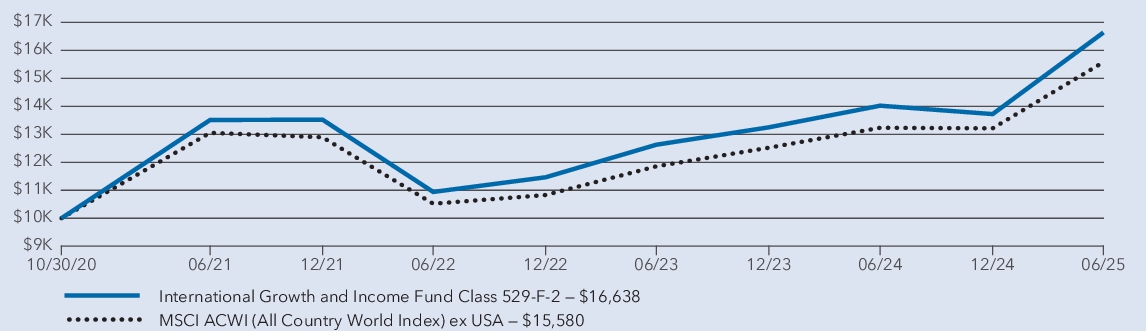
The fund’s Class 529-F-2 shares gained 18.63% for the year ended June 30, 2025. That result compares with a 17.72% gain for the MSCI ACWI (All Country World Index) ex USA. For information on returns for additional periods, including the fund lifetime, please refer to .
capitalgroup.com/mutual-fund-returns-529F2
What factors influenced results
International stocks advanced in a period marked by erratic trade policy and signs of slowing growth. Europe saw moderate growth driven by resilient domestic demand and easing inflation despite global trade tensions. Germany announced fiscal reforms, including plans to increase spending on defense and infrastructure projects, which are expected to boost the country’s economy and potentially have broader positive implications for Europe. The U.K. showed early signs of recovery, though persistent inflation limited overall momentum. Japan’s growth slowed, hindered by weak consumer spending and declining export demand. Among emerging markets, China’s growth was supported by targeted stimulus and a rebound in exports, while India’s economy remained resilient despite slower growth amid global headwinds.
Overall, most sectors added to the fund’s positive results, with financials and utilities particularly additive. Likewise, holdings in industrials, communication services and consumer staples saw returns surpassing those of the overall portfolio. From a geographic perspective, shares of companies based in the eurozone and the United Kingdom contributed positively to absolute returns.
On the contrary, holdings in the health care sector saw negative returns during the period. Also, investments in companies based in European countries outside the eurozone were negative, and Japan holdings detracted from the broader portfolio’s return while remaining positive.
Average annual total returns
1 year | Since inception 1 | |
| International Growth and Income Fund — Class 529-F-2 2 | 18.63 % | 11.53 % |
| MSCI ACWI (All Country World Index) ex USA 3 | 17.72 % | 9.97 % |
1
Class 529-F-2 shares were first offered on October 30, 2020.2
Investment results assume all distributions are reinvested and reflect applicable fees and expenses. When applicable, results reflect fee waivers and/or expense reimbursements, without which they would have been lower.3
Results assume all distributions are reinvested. Any market index shown is unmanaged, and therefore, has no expenses. Investors cannot invest directly in an index. Source(s): MSCI.Key fund statistics
| Fund net assets (in millions) | $ 17,258 |
| Total number of portfolio holdings | 290 |
| Total advisory fees paid (in millions) | $ 74 |
| Portfolio turnover rate | 40 % |
Portfolio holdings by sector
(percent of net assets)
capitalgroup.com/mutual-fund-literature-529F3
. You can also request this information by contacting us at
(800) 421-4225.
What were the fund costs for the last year?
(based on a hypothetical $10,000 investment
)Share class | Costs of a $10,000 investment | Costs paid as a percentage of a $10,000 investment |
| Class 529-F-3 | $ 63 | 0.58 % |
Management's discussion of fund performance
The fund’s Class 529-F-3 shares gained 18.70% for the year ended June 30, 2025. That result compares with a 17.72% gain for the MSCI ACWI (All Country World Index) ex USA. For information on returns for additional periods, including the fund lifetime, please refer to .
capitalgroup.com/mutual-fund-returns-529F3
What factors influenced results
International stocks advanced in a period marked by erratic trade policy and signs of slowing growth. Europe saw moderate growth driven by resilient domestic demand and easing inflation despite global trade tensions. Germany announced fiscal reforms, including plans to increase spending on defense and infrastructure projects, which are expected to boost the country’s economy and potentially have broader positive implications for Europe. The U.K. showed early signs of recovery, though persistent inflation limited overall momentum. Japan’s growth slowed, hindered by weak consumer spending and declining export demand. Among emerging markets, China’s growth was supported by targeted stimulus and a rebound in exports, while India’s economy remained resilient despite slower growth amid global headwinds.
Overall, most sectors added to the fund’s positive results, with financials and utilities particularly additive. Likewise, holdings in industrials, communication services and consumer staples saw returns surpassing those of the overall portfolio. From a geographic perspective, shares of companies based in the eurozone and the United Kingdom contributed positively to absolute returns.
On the contrary, holdings in the health care sector saw negative returns during the period. Also, investments in companies based in European countries outside the eurozone were negative, and Japan holdings detracted from the broader portfolio’s return while remaining positive.
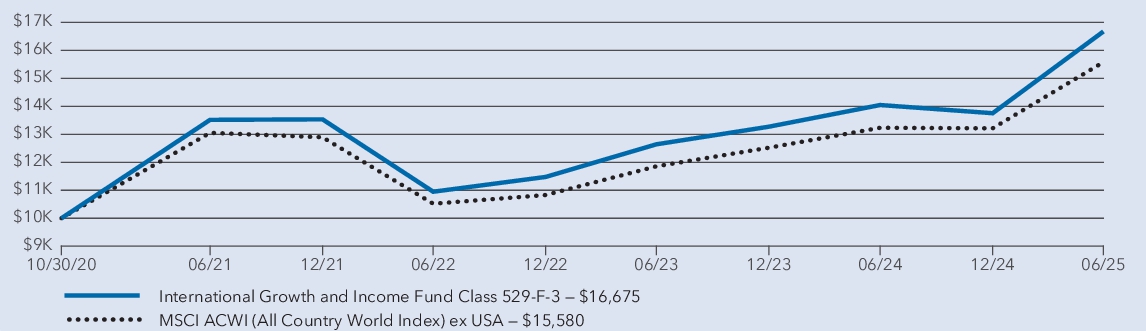
Average annual total returns
1 year | Since inception 1 | |
| International Growth and Income Fund — Class 529-F-3 2 | 18.70 % | 11.58 % |
| MSCI ACWI (All Country World Index) ex USA 3 | 17.72 % | 9.97 % |
1
Class 529-F-3 shares were first offered on October 30, 2020.2
Investment results assume all distributions are reinvested and reflect applicable fees and expenses. When applicable, results reflect
fee waivers and/or expense reimbursements, without which they would have been lower.3
Results assume all distributions are reinvested. Any market index shown is unmanaged, and therefore, has no expenses. Investors
cannot invest directly in an index. Source(s): MSCI.Key fund statistics
| Fund net assets (in millions) | $ 17,258 |
| Total number of portfolio holdings | 290 |
| Total advisory fees paid (in millions) | $ 74 |
| Portfolio turnover rate | 40 % |
Portfolio holdings by sector
(percent
of net assets)
capitalgroup.com/mutual-fund-literature-R1
. You can also request this information by contacting us at
(800) 421-4225.
What were the fund costs for the last year?
(based on a hypothetical $10,000 investment)Share class | Costs of a $10,000 investment | Costs paid as a percentage of a $10,000 investment |
| Class R-1 | $ 178 | 1.64 % |
Management's discussion of fund performance
The fund’s Class R-1 shares gained 17.44% for the year ended June 30, 2025. That result compares with a 17.72% gain for the MSCI ACWI (All Country World Index) ex USA. For information on returns for additional periods, including the fund lifetime, please refer to .
capitalgroup.com/mutual-fund-returns-R1
What factors influenced results
International stocks advanced in a period marked by erratic trade policy and signs of slowing growth. Europe saw moderate growth driven by resilient domestic demand and easing inflation despite global trade tensions. Germany announced fiscal reforms, including plans to increase spending on defense and infrastructure projects, which are expected to boost the country’s economy and potentially have broader positive implications for Europe. The U.K. showed early signs of recovery, though persistent inflation limited overall momentum. Japan’s growth slowed, hindered by weak consumer spending and declining export demand. Among emerging markets, China’s growth was supported by targeted stimulus and a rebound in exports, while India’s economy remained resilient despite slower growth amid global headwinds.
Overall, most sectors added to the fund’s positive results, with financials and utilities particularly additive. Likewise, holdings in industrials, communication services and consumer staples saw returns surpassing those of the overall portfolio. From a geographic perspective, shares of companies based in the eurozone and the United Kingdom contributed positively to absolute returns.
On the contrary, holdings in the health care sector saw negative returns during the period. Also, investments in companies based in European countries outside the eurozone were negative, and Japan holdings detracted from the broader portfolio’s return while remaining positive.
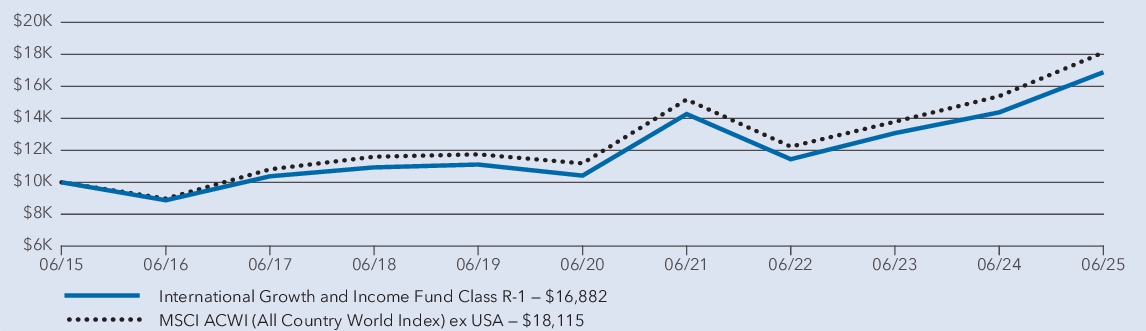
Average annual total returns
1 year | 5 years | 10 years | |
| International Growth and Income Fund — Class R-1 * | 17.44 % | 10.14 % | 5.38 % |
| MSCI ACWI (All Country World Index) ex USA † | 17.72 % | 10.13 % | 6.12 % |
*
Investment results assume all distributions are reinvested and reflect applicable fees and expenses. When applicable, results reflect fee waivers and/or expense reimbursements, without which they would have been lower.†
Results assume all distributions are reinvested. Any market index shown is unmanaged, and therefore, has no expenses. Investors cannot invest directly in an index. Source(s): MSCI.Key fund statistics
| Fund net assets (in millions) | $ 17,258 |
| Total number of portfolio holdings | 290 |
| Total advisory fees paid (in millions) | $ 74 |
| Portfolio turnover rate | 40 % |
Portfolio holdings by sector
(percent of net assets)
capitalgroup.com/mutual-fund-literature-R2
. You can also request this information by contacting us at
(800) 421-4225.
What were the fund costs for the last year?
(based on a hypothetical $10,000 investment)Share class | Costs of a $10,000 investment | Costs paid as a percentage of a $10,000 investment |
| Class R-2 | $ 177 | 1.63 % |
Management's discussion of fund performance
The fund’s Class R-2 shares gained 17.48% for the year ended June 30, 2025. That result compares with a 17.72% gain for the MSCI ACWI (All Country World Index) ex USA. For information on returns for additional periods, including the fund lifetime, please refer to .
capitalgroup.com/mutual-fund-returns-R2
What factors influenced results
International stocks advanced in a period marked by erratic trade policy and signs of slowing growth. Europe saw moderate growth driven by resilient domestic demand and easing inflation despite global trade tensions. Germany announced fiscal reforms, including plans to increase spending on defense and infrastructure projects, which are expected to boost the country’s economy and potentially have broader positive implications for Europe. The U.K. showed early signs of recovery, though persistent inflation limited overall momentum. Japan’s growth slowed, hindered by weak consumer spending and declining export demand. Among emerging markets, China’s growth was supported by targeted stimulus and a rebound in exports, while India’s economy remained resilient despite slower growth amid global headwinds.
Overall, most sectors added to the fund’s positive results, with financials and utilities particularly additive. Likewise, holdings in industrials, communication services and consumer staples saw returns surpassing those of the overall portfolio. From a geographic perspective, shares of companies based in the eurozone and the United Kingdom contributed positively to absolute returns.
On the contrary, holdings in the health care sector saw negative returns during the period. Also, investments in companies based in European countries outside the eurozone were negative, and Japan holdings detracted from the broader portfolio’s return while remaining positive.
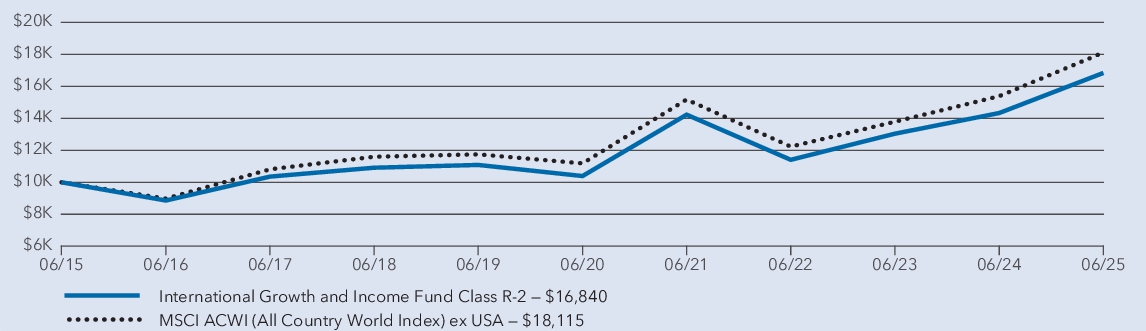
Average annual total returns
1 year | 5 years | 10 years | |
| International Growth and Income Fund — Class R-2 * | 17.48 % | 10.14 % | 5.35 % |
| MSCI ACWI (All Country World Index) ex USA † | 17.72 % | 10.13 % | 6.12 % |
*
Investment results assume all distributions are reinvested and reflect applicable fees and expenses. When applicable, results reflect fee waivers and/or expense reimbursements, without which they would have been lower.†
Results assume all distributions are reinvested. Any market index shown is unmanaged, and therefore, has no expenses. Investors cannot invest directly in an index. Source(s): MSCI.Key fund statistics
| Fund net assets (in millions) | $ 17,258 |
| Total number of portfolio holdings | 290 |
| Total advisory fees paid (in millions) | $ 74 |
| Portfolio turnover rate | 40 % |
Portfolio holdings by sector
(percent of net assets)
capitalgroup.com/mutual-fund-literature-R2E
(800) 421-4225
.
What were the fund costs for the last year?
(based on a hypothetical $10,000 investment)Share class |
Costs of a $10,000 investment |
Costs paid as a percentage of a $10,000 investment |
| Class R-2E | $ 145 |
1.33 % |
Management's discussion of fund performance
The fund’s Class R-2E shares gained 17.82% for the year ended June 30, 2025. That result compares with a 17.72% gain for the MSCI ACWI (All Country World Index) ex USA. For information on returns for additional periods, including the fund lifetime, please refer to .
capitalgroup.com/mutual-fund-returns-R2E
What factors influenced results
International stocks advanced in a period marked by erratic trade policy and signs of slowing growth. Europe saw moderate growth driven by resilient domestic demand and easing inflation despite global trade tensions. Germany announced fiscal reforms, including plans to increase spending on defense and infrastructure projects, which are expected to boost the country’s economy and potentially have broader positive implications for Europe. The U.K. showed early signs of recovery, though persistent inflation limited overall momentum. Japan’s growth slowed, hindered by weak consumer spending and declining export demand. Among emerging markets, China’s growth was supported by targeted stimulus and a rebound in exports, while India’s economy remained resilient despite slower growth amid global headwinds.
Overall, most sectors added to the fund’s positive results, with financials and utilities particularly additive. Likewise, holdings in industrials, communication services and consumer staples saw returns surpassing those of the overall portfolio. From a geographic perspective, shares of companies based in the eurozone and the United Kingdom contributed positively to absolute returns.
On the contrary, holdings in the health care sector saw negative returns during the period. Also, investments in companies based in European countries outside the eurozone were negative, and Japan holdings detracted from the broader portfolio’s return while remaining positive.
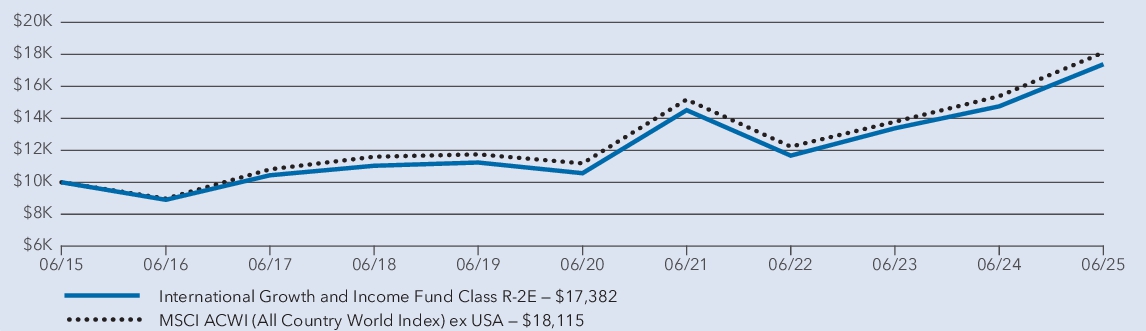
Average annual total returns
1 year |
5 years |
10 years |
|
| International Growth and Income Fund — Class R-2E * |
17.82 % |
10.46 % |
5.68 % |
| MSCI ACWI (All Country World Index) ex USA † |
17.72 % |
10.13 % |
6.12 % |
*
Investment results assume all distributions are reinvested and reflect applicable fees and expenses. When applicable, results reflect fee waivers and/or expense reimbursements, without which they would have been lower.†
Results assume all distributions are reinvested. Any market index shown is unmanaged, and therefore, has no expenses. Investors cannot invest directly in an index. Source(s): MSCI.Key fund statistics
| Fund net assets (in millions) | $ 17,258 |
| Total number of portfolio holdings | 290 |
| Total advisory fees paid (in millions) | $ 74 |
| Portfolio turnover rate | 40 % |
Portfolio holdings by sector
(percent of net assets)
capitalgroup.com/mutual-fund-literature-R3
(800) 421-4225
.
What were the fund costs for the last year?
(based on a hypothetical $10,000 investment)Share class |
Costs of a $10,000 investment |
Costs paid as a percentage of a $10,000 investment |
| Class R-3 | $ 129 |
1.18 % |
Management's discussion of fund performance
The fund’s Class R-3 shares gained 17.99% for the year ended June 30, 2025. That result compares with a 17.72% gain for the MSCI ACWI (All Country World Index) ex USA. For information on returns for additional periods, including the fund lifetime, please refer to .
capitalgroup.com/mutual-fund-returns-R3
What factors influenced results
International stocks advanced in a period marked by erratic trade policy and signs of slowing growth. Europe saw moderate growth driven by resilient domestic demand and easing inflation despite global trade tensions. Germany announced fiscal reforms, including plans to increase spending on defense and infrastructure projects, which are expected to boost the country’s economy and potentially have broader positive implications for Europe. The U.K. showed early signs of recovery, though persistent inflation limited overall momentum. Japan’s growth slowed, hindered by weak consumer spending and declining export demand. Among emerging markets, China’s growth was supported by targeted stimulus and a rebound in exports, while India’s economy remained resilient despite slower growth amid global headwinds.
Overall, most sectors added to the fund’s positive results, with financials and utilities particularly additive. Likewise, holdings in industrials, communication services and consumer staples saw returns surpassing those of the overall portfolio. From a geographic perspective, shares of companies based in the eurozone and the United Kingdom contributed positively to absolute returns.
On the contrary, holdings in the health care sector saw negative returns during the period. Also, investments in companies based in European countries outside the eurozone were negative, and Japan holdings detracted from the broader portfolio’s return while remaining positive.

Average annual total returns
1 year |
5 years |
10 years |
|
| International Growth and Income Fund — Class R-3 * |
17.99 % |
10.63 % |
5.83 % |
| MSCI ACWI (All Country World Index) ex USA † |
17.72 % |
10.13 % |
6.12 % |
*
Investment results assume all distributions are reinvested and reflect applicable fees and expenses. When applicable, results reflect fee waivers and/or expense reimbursements, without which they would have been lower.†
Results assume all distributions are reinvested. Any market index shown is unmanaged, and therefore, has no expenses. Investors cannot invest directly in an index. Source(s): MSCI.Key fund statistics
| Fund net assets (in millions) | $ 17,258 |
| Total number of portfolio holdings | 290 |
| Total advisory fees paid (in millions) | $ 74 |
| Portfolio turnover rate | 40 % |
Portfolio holdings by sector
(percent of net assets)
capitalgroup.com/mutual-fund-literature-R4
(800) 421-4225
.
What were the fund costs for the last year?
(based on a hypothetical $10,000 investment)Share class |
Costs of a $10,000 investment |
Costs paid as a percentage of a $10,000 investment |
| Class R-4 | $ 96 |
0.88 % |
Management's discussion of fund performance
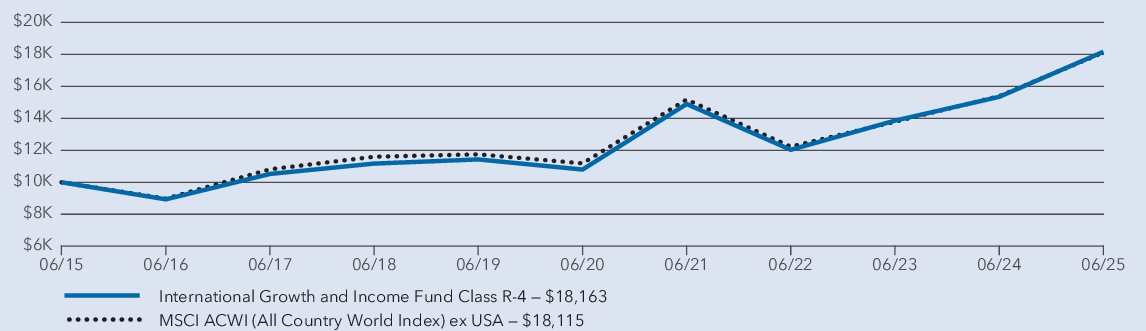
The fund’s Class R-4 shares gained 18.36% for the year ended June 30, 2025. That result compares with a 17.72% gain for the MSCI ACWI (All Country World Index) ex USA. For information on returns for additional periods, including the fund lifetime, please refer to .
capitalgroup.com/mutual-fund-returns-R4
What factors influenced results
International stocks advanced in a period marked by erratic trade policy and signs of slowing growth. Europe saw moderate growth driven by resilient domestic demand and easing inflation despite global trade tensions. Germany announced fiscal reforms, including plans to increase spending on defense and infrastructure projects, which are expected to boost the country’s economy and potentially have broader positive implications for Europe. The U.K. showed early signs of recovery, though persistent inflation limited overall momentum. Japan’s growth slowed, hindered by weak consumer spending and declining export demand. Among emerging markets, China’s growth was supported by targeted stimulus and a rebound in exports, while India’s economy remained resilient despite slower growth amid global headwinds.
Overall, most sectors added to the fund’s positive results, with financials and utilities particularly additive. Likewise, holdings in industrials, communication services and consumer staples saw returns surpassing those of the overall portfolio. From a geographic perspective, shares of companies based in the eurozone and the United Kingdom contributed positively to absolute returns.
On the contrary, holdings in the health care sector saw negative returns during the period. Also, investments in companies based in European countries outside the eurozone were negative, and Japan holdings detracted from the broader portfolio’s return while remaining positive.
Average annual total returns
1 year |
5 years |
10 years |
|
| International Growth and Income Fund — Class R-4 * |
18.36 % |
10.97 % |
6.15 % |
| MSCI ACWI (All Country World Index) ex USA † |
17.72 % |
10.13 % |
6.12 % |
*
Investment results assume all distributions are reinvested and reflect applicable fees and expenses. When applicable, results reflect fee waivers and/or expense reimbursements, without which they would have been lower.†
Results assume all distributions are reinvested. Any market index shown is unmanaged, and therefore, has no expenses. Investors cannot invest directly in an index. Source(s): MSCI.Key fund statistics
| Fund net assets (in millions) | $ 17,258 |
| Total number of portfolio holdings | 290 |
| Total advisory fees paid (in millions) | $ 74 |
| Portfolio turnover rate | 40 % |
Portfolio holdings by sector
(percent of net assets)
capitalgroup.com/mutual-fund-literature-R5E
(800) 421-4225
.
What were the fund costs for the last year?
(based on a hypothetical $10,000 investment)Share class | Costs of a $10,000 investment | Costs paid as a percentage of a $10,000 investment |
| Class R-5E | $ 74 | 0.68 % |
Management's discussion of fund performance
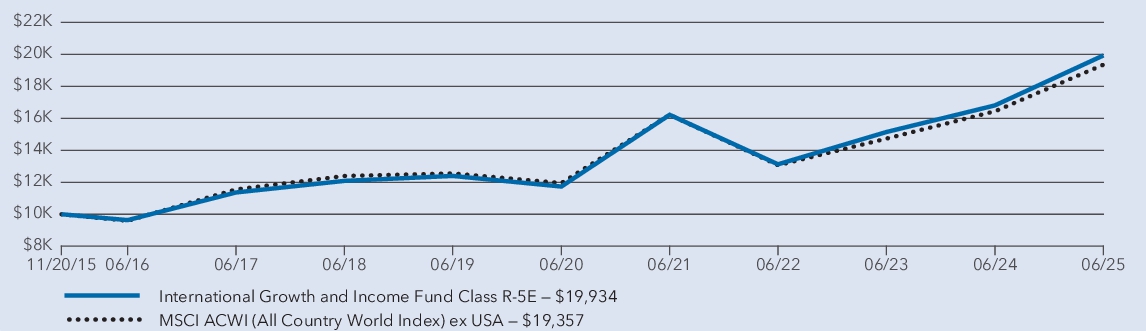
The fund’s Class R-5E shares gained 18.57% for the year ended June 30, 2025. That result compares with a 17.72% gain for the MSCI ACWI (All Country World Index) ex USA. For information on returns for additional periods, including the fund lifetime, please refer to .
capitalgroup.com/mutual-fund-returns-R5E
What factors influenced results
International stocks advanced in a period marked by erratic trade policy and signs of slowing growth. Europe saw moderate growth driven by resilient domestic demand and easing inflation despite global trade tensions. Germany announced fiscal reforms, including plans to increase spending on defense and infrastructure projects, which are expected to boost the country’s economy and potentially have broader positive implications for Europe. The U.K. showed early signs of recovery, though persistent inflation limited overall momentum. Japan’s growth slowed, hindered by weak consumer spending and declining export demand. Among emerging markets, China’s growth was supported by targeted stimulus and a rebound in exports, while India’s economy remained resilient despite slower growth amid global headwinds.
Overall, most sectors added to the fund’s positive results, with financials and utilities particularly additive. Likewise, holdings in industrials, communication services and consumer staples saw returns surpassing those of the overall portfolio. From a geographic perspective, shares of companies based in the eurozone and the United Kingdom contributed positively to absolute returns.
On the contrary, holdings in the health care sector saw negative returns during the period. Also, investments in companies based in European countries outside the eurozone were negative, and Japan holdings detracted from the broader portfolio’s return while remaining positive.
Average annual total returns
1 year | 5 years | Since inception 1 | |
| International Growth and Income Fund — Class R-5E 2 | 18.57 % | 11.18 % | 7.44 % |
| MSCI ACWI (All Country World Index) ex USA 3 | 17.72 % | 10.13 % | 7.11 % |
1
Class R-5E shares were first offered on November 20, 2015.2
Investment results assume all distributions are reinvested and reflect applicable fees and expenses. When applicable, results reflect fee waivers and/or expense reimbursements, without which they would have been lower.3
Results assume all distributions are reinvested. Any market index shown is unmanaged, and therefore, has no expenses. Investors cannot invest directly in an index. Source(s): MSCI.Key fund statistics
| Fund net assets (in millions) | $ 17,258 |
| Total number of portfolio holdings | 290 |
| Total advisory fees paid (in millions) | $ 74 |
| Portfolio turnover rate | 40 % |
Portfolio holdings by sector
(percent of net assets)
capitalgroup.com/mutual-fund-literature-R5
(800) 421-4225
.
What were the fund costs for the last year?
(based on a hypothetical $10,000 investment)Share class |
Costs of a $10,000 investment |
Costs paid as a percentage of a $10,000 investment |
| Class R-5 | $ 65 |
0.59 % |
Management's discussion of fund performance
The fund’s Class R-5 shares gained 18.71% for the year ended June 30, 2025. That result compares with a 17.72% gain for the MSCI ACWI (All Country World Index) ex USA. For information on returns for additional periods, including the fund lifetime, please refer to .
capitalgroup.com/mutual-fund-returns-R5
What factors influenced results
International stocks advanced in a period marked by erratic trade policy and signs of slowing growth. Europe saw moderate growth driven by resilient domestic demand and easing inflation despite global trade tensions. Germany announced fiscal reforms, including plans to increase spending on defense and infrastructure projects, which are expected to boost the country’s economy and potentially have broader positive implications for Europe. The U.K. showed early signs of recovery, though persistent inflation limited overall momentum. Japan’s growth slowed, hindered by weak consumer spending and declining export demand. Among emerging markets, China’s growth was supported by targeted stimulus and a rebound in exports, while India’s economy remained resilient despite slower growth amid global headwinds.
Overall, most sectors added to the fund’s positive results, with financials and utilities particularly additive. Likewise, holdings in industrials, communication services and consumer staples saw returns surpassing those of the overall portfolio. From a geographic perspective, shares of companies based in the eurozone and the United Kingdom contributed positively to absolute returns.
On the contrary, holdings in the health care sector saw negative returns during the period. Also, investments in companies based in European countries outside the eurozone were negative, and Japan holdings detracted from the broader portfolio’s return while remaining positive.

Average annual total returns
1 year |
5 years |
10 years |
|
| International Growth and Income Fund — Class R-5 * |
18.71 % |
11.31 % |
6.48 % |
| MSCI ACWI (All Country World Index) ex USA † |
17.72 % |
10.13 % |
6.12 % |
*
Investment results assume all distributions are reinvested and reflect applicable fees and expenses. When applicable, results reflect fee waivers and/or expense reimbursements, without which they would have been lower.†
Results assume all distributions are reinvested. Any market index shown is unmanaged, and therefore, has no expenses. Investors cannot invest directly in an index. Source(s): MSCI.Key fund statistics
| Fund net assets (in millions) | $ 17,258 |
| Total number of portfolio holdings | 290 |
| Total advisory fees paid (in millions) | $ 74 |
| Portfolio turnover rate | 40 % |
Portfolio holdings by sector
(percent of net assets)
capitalgroup.com/mutual-fund-literature-R6
(800) 421-4225
.
What were the fund costs for the last year?
(based on a hypothetical $10,000 investment)Share class | Costs of a $10,000 investment | Costs paid as a percentage of a $10,000 investment |
| Class R-6 | $ 58 | 0.53 % |
Management's discussion of fund performance
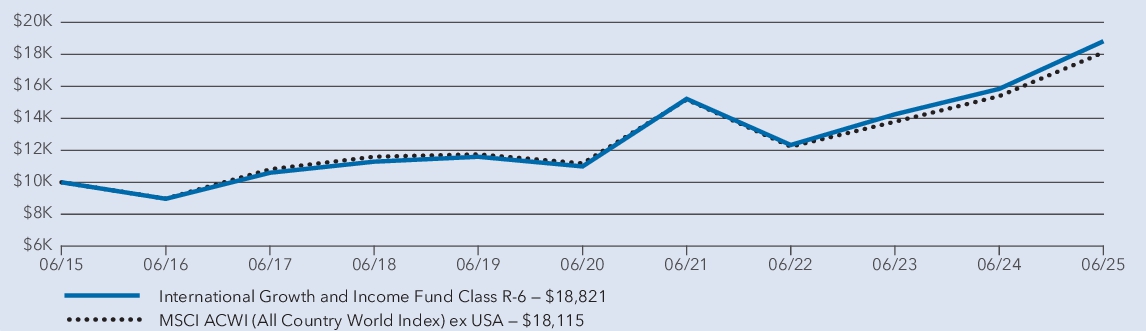
The fund’s Class R-6 shares gained 18.78% for the year ended June 30, 2025. That result compares with a 17.72% gain for the MSCI ACWI (All Country World Index) ex USA. For information on returns for additional periods, including the fund lifetime, please refer to .
capitalgroup.com/mutual-fund-returns-R6
What factors influenced results
International stocks advanced in a period marked by erratic trade policy and signs of slowing growth. Europe saw moderate growth driven by resilient domestic demand and easing inflation despite global trade tensions. Germany announced fiscal reforms, including plans to increase spending on defense and infrastructure projects, which are expected to boost the country’s economy and potentially have broader positive implications for Europe. The U.K. showed early signs of recovery, though persistent inflation limited overall momentum. Japan’s growth slowed, hindered by weak consumer spending and declining export demand. Among emerging markets, China’s growth was supported by targeted stimulus and a rebound in exports, while India’s economy remained resilient despite slower growth amid global headwinds.
Overall, most sectors added to the fund’s positive results, with financials and utilities particularly additive. Likewise, holdings in industrials, communication services and consumer staples saw returns surpassing those of the overall portfolio. From a geographic perspective, shares of companies based in the eurozone and the United Kingdom contributed positively to absolute returns.
On the contrary, holdings in the health care sector saw negative returns during the period. Also, investments in companies based in European countries outside the eurozone were negative, and Japan holdings detracted from the broader portfolio’s return while remaining positive.
Average annual total returns
1 year | 5 years | 10 years | |
| International Growth and Income Fund — Class R-6 * | 18.78 % | 11.35 % | 6.53 % |
| MSCI ACWI (All Country World Index) ex USA † | 17.72 % | 10.13 % | 6.12 % |
*
Investment results assume all distributions are reinvested and reflect applicable fees and expenses. When applicable, results reflect fee waivers and/or expense reimbursements, without which they would have been lower.†
Results assume all distributions are reinvested. Any market index shown is unmanaged, and therefore, has no expenses. Investors cannot invest directly in an index. Source(s): MSCI.Key fund statistics
| Fund net assets (in millions) | $ 17,258 |
| Total number of portfolio holdings | 290 |
| Total advisory fees paid (in millions) | $ 74 |
| Portfolio turnover rate | 40 % |
Portfolio holdings by sector
(percent of net assets)