Shareholder Report
Jun. 30, 2025
USD ($)
Holding
Fund Expenses
What were the Fund costs for the last six months?
(Based on a hypothetical $10,000 investment)
| Fund (Class) | Costs of a $10,000 investment | Costs paid as a percentage of a $10,000 investment |
| AMG GW&K Municipal Enhanced SMA Shares (MESHX) |
$0 | 0.00% |
Key Fund Statistics (as of June 30, 2025)
| Fund net assets | $206,665,050 |
| Total number of portfolio holdings | 140 |
| Net advisory fees paid | $0 |
| Portfolio turnover rate as of the end of the reporting period | 21% |
Graphical Representation of Holdings (as of June 30, 2025)
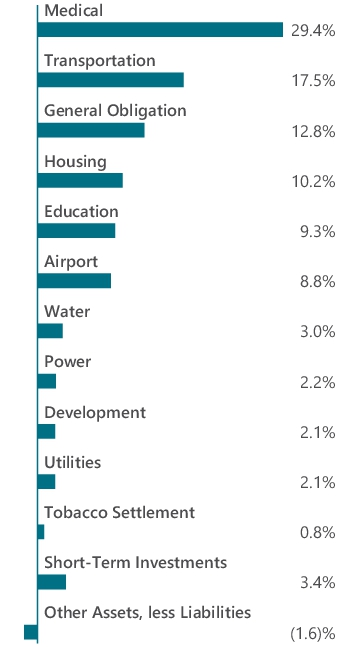
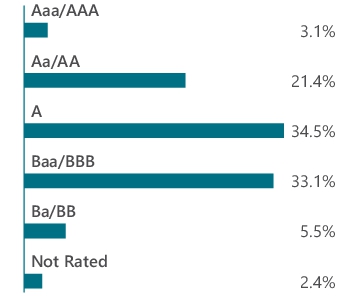
Top ten holdings and portfolio breakdown are shown as a percentage of net assets of the Fund and ratings are shown as a percentage of total long-term investments of the Fund.
Top Ten Holdings
| Rhode Island Health and Educational Building Corp., 5.250%, 05/15/54 | 2.4% |
| County of Jefferson Sewer Revenue, 5.500%, 10/01/53 | 2.3% |
| Pennsylvania Higher Educational Facilities Authority, Series B2, 5.000%, 11/01/54 | 2.2% |
| Pennsylvania Economic Development Financing Authority, 5.000%, 12/31/57 | 1.9% |
| Texas Private Activity Bond Surface Transportation Corp., 5.000%, 06/30/58 | 1.9% |
| Massachusetts Development Finance Agency, 5.250%, 07/01/52 | 1.8% |
| Massachusetts Development Finance Agency, 5.250%, 07/01/55 | 1.7% |
| Orange County Health Facilities Authority, Series A, 5.250%, 10/01/56 |
1.7% |
| Metropolitan Transportation Authority, Series 1, 4.750%, 11/15/45 | 1.7% |
| Columbus Regional Airport Authority, Series A, 5.500%, 01/01/55 | 1.5% |
| Top Ten as a Group | 19.1% |
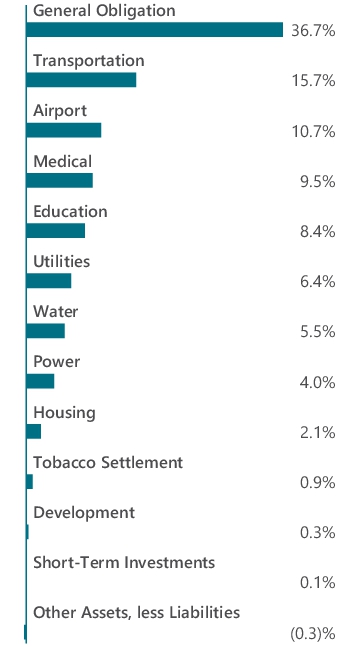
Portfolio Breakdown
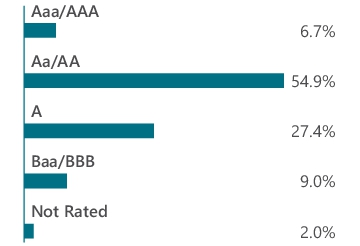
Ratings
Top Ten Holdings
| Rhode Island Health and Educational Building Corp., 5.250%, 05/15/54 | 2.4% |
| County of Jefferson Sewer Revenue, 5.500%, 10/01/53 | 2.3% |
| Pennsylvania Higher Educational Facilities Authority, Series B2, 5.000%, 11/01/54 | 2.2% |
| Pennsylvania Economic Development Financing Authority, 5.000%, 12/31/57 | 1.9% |
| Texas Private Activity Bond Surface Transportation Corp., 5.000%, 06/30/58 | 1.9% |
| Massachusetts Development Finance Agency, 5.250%, 07/01/52 | 1.8% |
| Massachusetts Development Finance Agency, 5.250%, 07/01/55 | 1.7% |
| Orange County Health Facilities Authority, Series A, 5.250%, 10/01/56 |
1.7% |
| Metropolitan Transportation Authority, Series 1, 4.750%, 11/15/45 | 1.7% |
| Columbus Regional Airport Authority, Series A, 5.500%, 01/01/55 | 1.5% |
| Top Ten as a Group | 19.1% |
Fund Expenses
What were the Fund costs for the last six months?
(Based on a hypothetical $10,000 investment)
| Fund (Class) | Costs of a $10,000 investment | Costs paid as a percentage of a $10,000 investment |
| AMG GW&K Securitized Bond SMA Shares (GWSBX) |
$0 | 0.00% |
Key Fund Statistics (as of June 30, 2025)
| Fund net assets | $111,086,743 |
| Total number of portfolio holdings | 65 |
| Net advisory fees paid | $0 |
| Portfolio turnover rate as of the end of the reporting period | 5% |
Graphical Representation of Holdings (as of June 30, 2025)
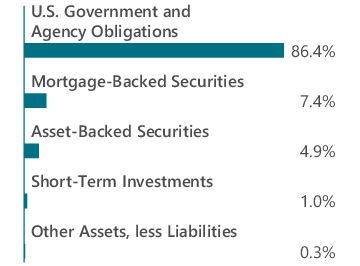
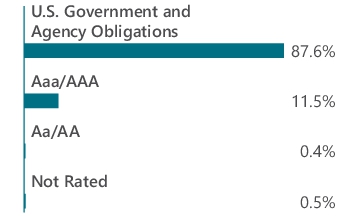
Top ten holdings and portfolio breakdown are shown as a percentage of net assets of the Fund and ratings are shown as a percentage of total long-term investments of the Fund.
Top Ten Holdings
| FHLMC, 5.500%, 02/01/54 | 4.4% |
| FNMA, 5.000%, 01/01/53 | 4.3% |
| FHLMC, 3.500%, 06/01/49 | 4.3% |
| Freddie Mac Multifamily Structured Pass Through Certificates, Class A2, 1.658%, 12/25/30 | 3.9% |
| FNMA, 2.500%, 11/01/51 | 3.7% |
| FNMA, 4.000%, 06/01/53 | 3.7% |
| FHLMC, 6.000%, 10/01/53 | 3.7% |
| FNMA, 5.500%, 07/01/53 | 3.7% |
| Freddie Mac Multifamily Structured Pass Through Certificates, Class A2, 4.500%, 07/25/33 | 3.6% |
| U.S. Treasury Notes, 4.250%, 11/15/34 | 3.5% |
| Top Ten as a Group | 38.8% |
Portfolio Breakdown
Ratings
Top Ten Holdings
| FHLMC, 5.500%, 02/01/54 | 4.4% |
| FNMA, 5.000%, 01/01/53 | 4.3% |
| FHLMC, 3.500%, 06/01/49 | 4.3% |
| Freddie Mac Multifamily Structured Pass Through Certificates, Class A2, 1.658%, 12/25/30 | 3.9% |
| FNMA, 2.500%, 11/01/51 | 3.7% |
| FNMA, 4.000%, 06/01/53 | 3.7% |
| FHLMC, 6.000%, 10/01/53 | 3.7% |
| FNMA, 5.500%, 07/01/53 | 3.7% |
| Freddie Mac Multifamily Structured Pass Through Certificates, Class A2, 4.500%, 07/25/33 | 3.6% |
| U.S. Treasury Notes, 4.250%, 11/15/34 | 3.5% |
| Top Ten as a Group | 38.8% |
Fund Expenses
What were the Fund costs for the last six months?
(Based on a hypothetical $10,000 investment)
| Fund (Class) | Costs of a $10,000 investment | Costs paid as a percentage of a $10,000 investment |
| AMG Yacktman Special Opportunities Fund (Class Z/YASLX) |
$47 | 0.90% |
Key Fund Statistics (as of June 30, 2025)
| Fund net assets | $28,221,957 |
| Total number of portfolio holdings | 46 |
| Net advisory fees paid | $47,931 |
| Portfolio turnover rate as of the end of the reporting period | 2% |
Graphical Representation of Holdings (as of June 30, 2025)
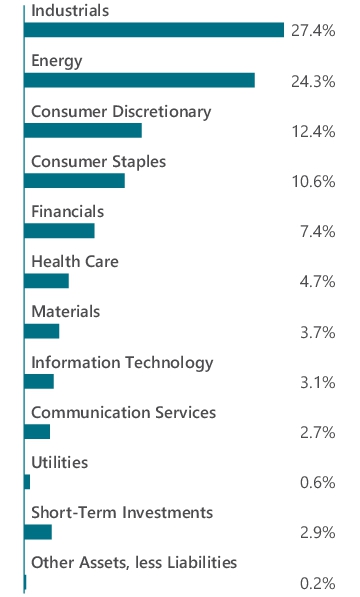
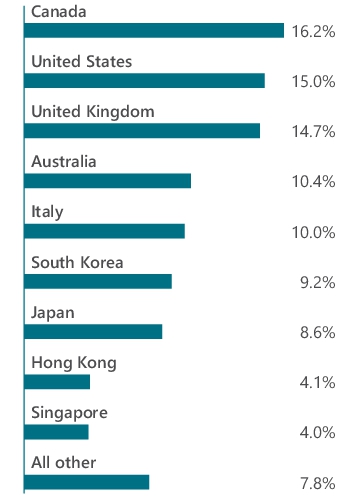
Top ten holdings and portfolio breakdown are shown as a percentage of net assets of the Fund and country allocation is shown as a percentage of total long-term investments of the Fund.
Top Ten Holdings
| Omni Bridgeway, Ltd. (Australia) | 7.4% |
| Arrow Exploration Corp. (Canada) | 6.4% |
| Total Energy Services, Inc. (Canada) | 5.6% |
| Italian Wine Brands S.p.A. (Italy) | 5.3% |
| Macfarlane Group PLC (United Kingdom) | 5.2% |
| Legacy Housing Corp. (United States) | 4.8% |
| Fila S.p.A. (Italy) | 4.4% |
| Brickability Group PLC (United Kingdom) | 4.3% |
| Texhong International Group, Ltd. (Hong Kong) | 4.0% |
| U-Haul Holding Co., Non-Voting Shares (United States) | 3.9% |
| Top Ten as a Group | 51.3% |
Portfolio Breakdown

Country Allocation

Top Ten Holdings
| Omni Bridgeway, Ltd. (Australia) | 7.4% |
| Arrow Exploration Corp. (Canada) | 6.4% |
| Total Energy Services, Inc. (Canada) | 5.6% |
| Italian Wine Brands S.p.A. (Italy) | 5.3% |
| Macfarlane Group PLC (United Kingdom) | 5.2% |
| Legacy Housing Corp. (United States) | 4.8% |
| Fila S.p.A. (Italy) | 4.4% |
| Brickability Group PLC (United Kingdom) | 4.3% |
| Texhong International Group, Ltd. (Hong Kong) | 4.0% |
| U-Haul Holding Co., Non-Voting Shares (United States) | 3.9% |
| Top Ten as a Group | 51.3% |
Fund Expenses
What were the Fund costs for the last six months?
(Based on a hypothetical $10,000 investment)
| Fund (Class) | Costs of a $10,000 investment | Costs paid as a percentage of a $10,000 investment |
| AMG Yacktman Special Opportunities Fund (Class I/YASSX) |
$52 | 1.00% |
Key Fund Statistics (as of June 30, 2025)
| Fund net assets | $28,221,957 |
| Total number of portfolio holdings | 46 |
| Net advisory fees paid | $47,931 |
| Portfolio turnover rate as of the end of the reporting period | 2% |
Graphical Representation of Holdings (as of June 30, 2025)
Top ten holdings and portfolio breakdown are shown as a percentage of net assets of the Fund and country allocation is shown as a percentage of total long-term investments of the Fund.
Top Ten Holdings
| Omni Bridgeway, Ltd. (Australia) | 7.4% |
| Arrow Exploration Corp. (Canada) | 6.4% |
| Total Energy Services, Inc. (Canada) | 5.6% |
| Italian Wine Brands S.p.A. (Italy) | 5.3% |
| Macfarlane Group PLC (United Kingdom) | 5.2% |
| Legacy Housing Corp. (United States) | 4.8% |
| Fila S.p.A. (Italy) | 4.4% |
| Brickability Group PLC (United Kingdom) | 4.3% |
| Texhong International Group, Ltd. (Hong Kong) | 4.0% |
| U-Haul Holding Co., Non-Voting Shares (United States) | 3.9% |
| Top Ten as a Group | 51.3% |
Portfolio Breakdown
Country Allocation
Top Ten Holdings
| Omni Bridgeway, Ltd. (Australia) | 7.4% |
| Arrow Exploration Corp. (Canada) | 6.4% |
| Total Energy Services, Inc. (Canada) | 5.6% |
| Italian Wine Brands S.p.A. (Italy) | 5.3% |
| Macfarlane Group PLC (United Kingdom) | 5.2% |
| Legacy Housing Corp. (United States) | 4.8% |
| Fila S.p.A. (Italy) | 4.4% |
| Brickability Group PLC (United Kingdom) | 4.3% |
| Texhong International Group, Ltd. (Hong Kong) | 4.0% |
| U-Haul Holding Co., Non-Voting Shares (United States) | 3.9% |
| Top Ten as a Group | 51.3% |
Fund Expenses
What were the Fund costs for the last six months?
(Based on a hypothetical $10,000 investment)
| Fund (Class) | Costs of a $10,000 investment | Costs paid as a percentage of a $10,000 investment |
| AMG TimesSquare International Small Cap Fund (Class Z/TCMIX) |
$59 | 1.05% |
Key Fund Statistics (as of June 30, 2025)
| Fund net assets | $127,476,525 |
| Total number of portfolio holdings | 84 |
| Net advisory fees paid | $383,040 |
| Portfolio turnover rate as of the end of the reporting period | 30% |
Graphical Representation of Holdings (as of June 30, 2025)
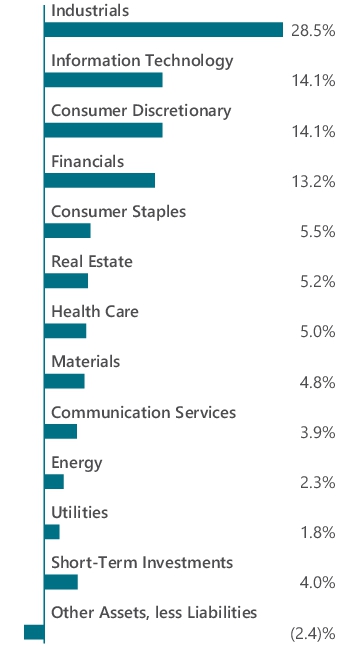
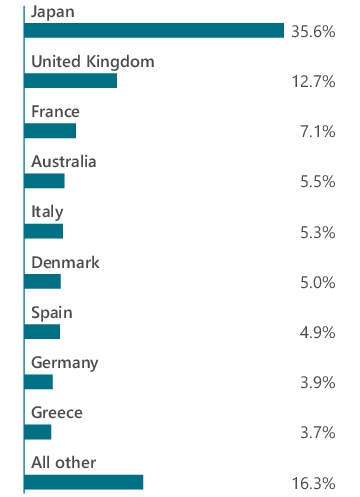
Top ten holdings and portfolio breakdown are shown as a percentage of net assets of the Fund and country allocation is shown as a percentage of total long-term investments of the Fund.
Top Ten Holdings
| Azbil Corp. (Japan) | 2.7% |
| Sopra Steria Group (France) | 2.6% |
| KDX Realty Investment Corp., REIT (Japan) | 2.5% |
| Daiei Kankyo Co., Ltd. (Japan) | 2.4% |
| Organo Corp. (Japan) | 2.4% |
| Alm Brand A/S (Denmark) | 2.4% |
| Greencore Group PLC (Ireland) | 2.1% |
| Siegfried Holding AG (Switzerland) | 2.1% |
| ABC-Mart, Inc. (Japan) | 2.0% |
| Piraeus Financial Holdings, S.A. (Greece) | 2.0% |
| Top Ten as a Group | 23.2% |
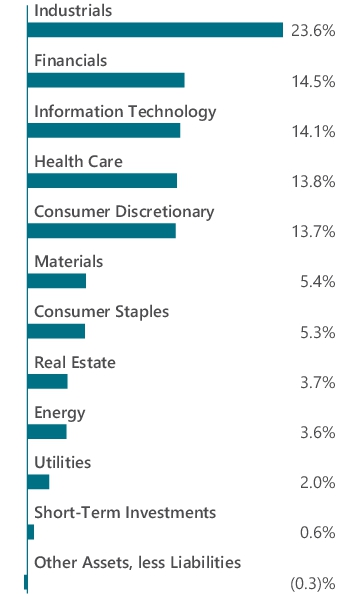
Portfolio Breakdown

Country Allocation

Top Ten Holdings
| Azbil Corp. (Japan) | 2.7% |
| Sopra Steria Group (France) | 2.6% |
| KDX Realty Investment Corp., REIT (Japan) | 2.5% |
| Daiei Kankyo Co., Ltd. (Japan) | 2.4% |
| Organo Corp. (Japan) | 2.4% |
| Alm Brand A/S (Denmark) | 2.4% |
| Greencore Group PLC (Ireland) | 2.1% |
| Siegfried Holding AG (Switzerland) | 2.1% |
| ABC-Mart, Inc. (Japan) | 2.0% |
| Piraeus Financial Holdings, S.A. (Greece) | 2.0% |
| Top Ten as a Group | 23.2% |
Fund Expenses
What were the Fund costs for the last six months?
(Based on a hypothetical $10,000 investment)
| Fund (Class) | Costs of a $10,000 investment | Costs paid as a percentage of a $10,000 investment |
| AMG TimesSquare International Small Cap Fund (Class N/TCMPX) |
$73 | 1.30% |
Key Fund Statistics (as of June 30, 2025)
| Fund net assets | $127,476,525 |
| Total number of portfolio holdings | 84 |
| Net advisory fees paid | $383,040 |
| Portfolio turnover rate as of the end of the reporting period | 30% |
Graphical Representation of Holdings (as of June 30, 2025)
Top ten holdings and portfolio breakdown are shown as a percentage of net assets of the Fund and country allocation is shown as a percentage of total long-term investments of the Fund.
Top Ten Holdings
| Azbil Corp. (Japan) | 2.7% |
| Sopra Steria Group (France) | 2.6% |
| KDX Realty Investment Corp., REIT (Japan) | 2.5% |
| Daiei Kankyo Co., Ltd. (Japan) | 2.4% |
| Organo Corp. (Japan) | 2.4% |
| Alm Brand A/S (Denmark) | 2.4% |
| Greencore Group PLC (Ireland) | 2.1% |
| Siegfried Holding AG (Switzerland) | 2.1% |
| ABC-Mart, Inc. (Japan) | 2.0% |
| Piraeus Financial Holdings, S.A. (Greece) | 2.0% |
| Top Ten as a Group | 23.2% |
Portfolio Breakdown
Country Allocation
Top Ten Holdings
| Azbil Corp. (Japan) | 2.7% |
| Sopra Steria Group (France) | 2.6% |
| KDX Realty Investment Corp., REIT (Japan) | 2.5% |
| Daiei Kankyo Co., Ltd. (Japan) | 2.4% |
| Organo Corp. (Japan) | 2.4% |
| Alm Brand A/S (Denmark) | 2.4% |
| Greencore Group PLC (Ireland) | 2.1% |
| Siegfried Holding AG (Switzerland) | 2.1% |
| ABC-Mart, Inc. (Japan) | 2.0% |
| Piraeus Financial Holdings, S.A. (Greece) | 2.0% |
| Top Ten as a Group | 23.2% |
Fund Expenses
What were the Fund costs for the last six months?
(Based on a hypothetical $10,000 investment)
| Fund (Class) | Costs of a $10,000 investment | Costs paid as a percentage of a $10,000 investment |
| AMG TimesSquare International Small Cap Fund (Class I/TQTIX) |
$62 | 1.10% |
Key Fund Statistics (as of June 30, 2025)
| Fund net assets | $127,476,525 |
| Total number of portfolio holdings | 84 |
| Net advisory fees paid | $383,040 |
| Portfolio turnover rate as of the end of the reporting period | 30% |
Graphical Representation of Holdings (as of June 30, 2025)
Top ten holdings and portfolio breakdown are shown as a percentage of net assets of the Fund and country allocation is shown as a percentage of total long-term investments of the Fund.
Top Ten Holdings
| Azbil Corp. (Japan) | 2.7% |
| Sopra Steria Group (France) | 2.6% |
| KDX Realty Investment Corp., REIT (Japan) | 2.5% |
| Daiei Kankyo Co., Ltd. (Japan) | 2.4% |
| Organo Corp. (Japan) | 2.4% |
| Alm Brand A/S (Denmark) | 2.4% |
| Greencore Group PLC (Ireland) | 2.1% |
| Siegfried Holding AG (Switzerland) | 2.1% |
| ABC-Mart, Inc. (Japan) | 2.0% |
| Piraeus Financial Holdings, S.A. (Greece) | 2.0% |
| Top Ten as a Group | 23.2% |
Portfolio Breakdown

Country Allocation

Top Ten Holdings
| Azbil Corp. (Japan) | 2.7% |
| Sopra Steria Group (France) | 2.6% |
| KDX Realty Investment Corp., REIT (Japan) | 2.5% |
| Daiei Kankyo Co., Ltd. (Japan) | 2.4% |
| Organo Corp. (Japan) | 2.4% |
| Alm Brand A/S (Denmark) | 2.4% |
| Greencore Group PLC (Ireland) | 2.1% |
| Siegfried Holding AG (Switzerland) | 2.1% |
| ABC-Mart, Inc. (Japan) | 2.0% |
| Piraeus Financial Holdings, S.A. (Greece) | 2.0% |
| Top Ten as a Group | 23.2% |
Fund Expenses
What were the Fund costs for the last six months?
(Based on a hypothetical $10,000 investment)
| Fund (Class) | Costs of a $10,000 investment | Costs paid as a percentage of a $10,000 investment |
| AMG Yacktman Global Fund (Class I/YFSIX) |
$50 | 0.93% |
Key Fund Statistics (as of June 30, 2025)
| Fund net assets | $168,285,049 |
| Total number of portfolio holdings | 58 |
| Net advisory fees paid | $484,729 |
| Portfolio turnover rate as of the end of the reporting period | 4% |
Graphical Representation of Holdings (as of June 30, 2025)
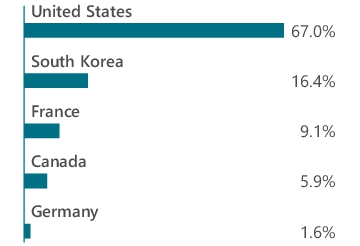
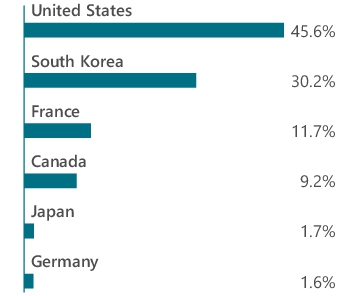
Top ten holdings and portfolio breakdown are shown as a percentage of net assets of the Fund and country allocation is shown as a percentage of total long-term investments of the Fund.
Top Ten Holdings
| Bolloré SE (France) | 9.7% |
| Samsung Electronics Co., Ltd., 2.870% (South Korea) | 9.6% |
| HI-LEX Corp. (Japan) | 5.7% |
| Canadian Natural Resources, Ltd. (Canada) | 5.2% |
| Cie de L'Odet SE (France) | 4.7% |
| Hyundai Mobis Co., Ltd. (South Korea) | 4.4% |
| Total Energy Services, Inc. (Canada) | 4.3% |
| LG H&H Co., Ltd., 2.720% (South Korea) | 3.8% |
| Samsung C&T Corp. (South Korea) | 3.6% |
| Hyundai Motor Co., 7.940% (South Korea) | 3.1% |
| Top Ten as a Group | 54.1% |
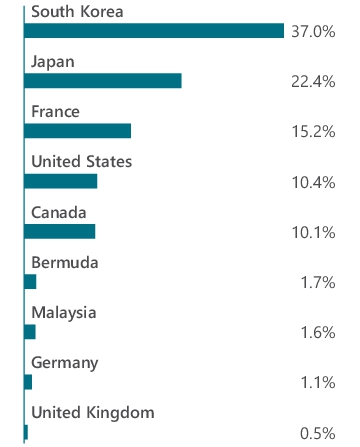
Portfolio Breakdown
Country Allocation

Top Ten Holdings
| Bolloré SE (France) | 9.7% |
| Samsung Electronics Co., Ltd., 2.870% (South Korea) | 9.6% |
| HI-LEX Corp. (Japan) | 5.7% |
| Canadian Natural Resources, Ltd. (Canada) | 5.2% |
| Cie de L'Odet SE (France) | 4.7% |
| Hyundai Mobis Co., Ltd. (South Korea) | 4.4% |
| Total Energy Services, Inc. (Canada) | 4.3% |
| LG H&H Co., Ltd., 2.720% (South Korea) | 3.8% |
| Samsung C&T Corp. (South Korea) | 3.6% |
| Hyundai Motor Co., 7.940% (South Korea) | 3.1% |
| Top Ten as a Group | 54.1% |
Fund Expenses
What were the Fund costs for the last six months?
(Based on a hypothetical $10,000 investment)
| Fund (Class) | Costs of a $10,000 investment | Costs paid as a percentage of a $10,000 investment |
| AMG Yacktman Global Fund (Class N/YFSNX) |
$61 | 1.13% |
Key Fund Statistics (as of June 30, 2025)
| Fund net assets | $168,285,049 |
| Total number of portfolio holdings | 58 |
| Net advisory fees paid | $484,729 |
| Portfolio turnover rate as of the end of the reporting period | 4% |
Graphical Representation of Holdings (as of June 30, 2025)
Top ten holdings and portfolio breakdown are shown as a percentage of net assets of the Fund and country allocation is shown as a percentage of total long-term investments of the Fund.
Top Ten Holdings
| Bolloré SE (France) | 9.7% |
| Samsung Electronics Co., Ltd., 2.870% (South Korea) | 9.6% |
| HI-LEX Corp. (Japan) | 5.7% |
| Canadian Natural Resources, Ltd. (Canada) | 5.2% |
| Cie de L'Odet SE (France) | 4.7% |
| Hyundai Mobis Co., Ltd. (South Korea) | 4.4% |
| Total Energy Services, Inc. (Canada) | 4.3% |
| LG H&H Co., Ltd., 2.720% (South Korea) | 3.8% |
| Samsung C&T Corp. (South Korea) | 3.6% |
| Hyundai Motor Co., 7.940% (South Korea) | 3.1% |
| Top Ten as a Group | 54.1% |
Portfolio Breakdown

Country Allocation
Top Ten Holdings
| Bolloré SE (France) | 9.7% |
| Samsung Electronics Co., Ltd., 2.870% (South Korea) | 9.6% |
| HI-LEX Corp. (Japan) | 5.7% |
| Canadian Natural Resources, Ltd. (Canada) | 5.2% |
| Cie de L'Odet SE (France) | 4.7% |
| Hyundai Mobis Co., Ltd. (South Korea) | 4.4% |
| Total Energy Services, Inc. (Canada) | 4.3% |
| LG H&H Co., Ltd., 2.720% (South Korea) | 3.8% |
| Samsung C&T Corp. (South Korea) | 3.6% |
| Hyundai Motor Co., 7.940% (South Korea) | 3.1% |
| Top Ten as a Group | 54.1% |
Fund Expenses
What were the Fund costs for the last six months?
(Based on a hypothetical $10,000 investment)
| Fund (Class) | Costs of a $10,000 investment | Costs paid as a percentage of a $10,000 investment |
| AMG GW&K Small/Mid Cap Core Fund (Class Z/GWGZX) |
$40 | 0.82% |
Key Fund Statistics (as of June 30, 2025)
| Fund net assets | $758,986,647 |
| Total number of portfolio holdings | 91 |
| Net advisory fees paid | $2,341,049 |
| Portfolio turnover rate as of the end of the reporting period | 12% |
Graphical Representation of Holdings (as of June 30, 2025)
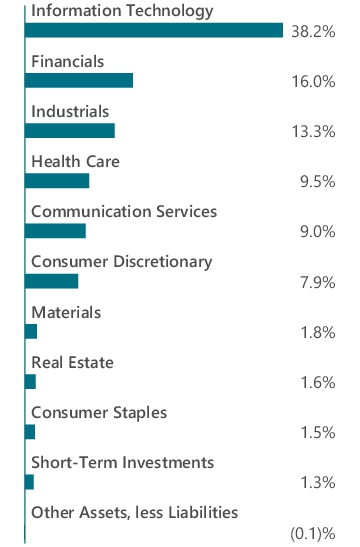
Top ten holdings and portfolio breakdown are shown as a percentage of net assets of the Fund.
Top Ten Holdings
| API Group Corp. | 2.3% |
| CyberArk Software, Ltd. (Israel) | 2.3% |
| Comfort Systems USA, Inc. | 2.1% |
| Performance Food Group Co. | 2.0% |
| Piper Sandler Cos. | 1.9% |
| Texas Roadhouse, Inc. | 1.9% |
| MACOM Technology Solutions Holdings, Inc. | 1.9% |
| RBC Bearings, Inc. | 1.9% |
| Gates Industrial Corp. PLC | 1.8% |
| Federal Signal Corp. | 1.8% |
| Top Ten as a Group | 19.9% |
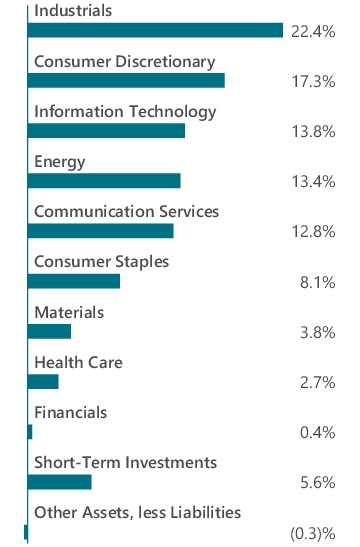
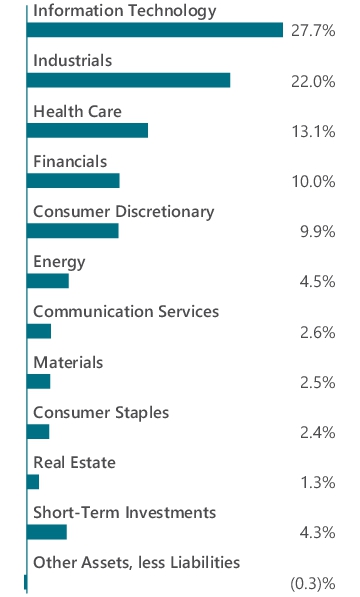
Portfolio Breakdown
Top Ten Holdings
| API Group Corp. | 2.3% |
| CyberArk Software, Ltd. (Israel) | 2.3% |
| Comfort Systems USA, Inc. | 2.1% |
| Performance Food Group Co. | 2.0% |
| Piper Sandler Cos. | 1.9% |
| Texas Roadhouse, Inc. | 1.9% |
| MACOM Technology Solutions Holdings, Inc. | 1.9% |
| RBC Bearings, Inc. | 1.9% |
| Gates Industrial Corp. PLC | 1.8% |
| Federal Signal Corp. | 1.8% |
| Top Ten as a Group | 19.9% |
Fund Expenses
What were the Fund costs for the last six months?
(Based on a hypothetical $10,000 investment)
| Fund (Class) | Costs of a $10,000 investment | Costs paid as a percentage of a $10,000 investment |
| AMG GW&K Small/Mid Cap Core Fund (Class I/GWGIX) |
$42 | 0.87% |
Key Fund Statistics (as of June 30, 2025)
| Fund net assets | $758,986,647 |
| Total number of portfolio holdings | 91 |
| Net advisory fees paid | $2,341,049 |
| Portfolio turnover rate as of the end of the reporting period | 12% |
Graphical Representation of Holdings (as of June 30, 2025)
Top ten holdings and portfolio breakdown are shown as a percentage of net assets of the Fund.
Top Ten Holdings
| API Group Corp. | 2.3% |
| CyberArk Software, Ltd. (Israel) | 2.3% |
| Comfort Systems USA, Inc. | 2.1% |
| Performance Food Group Co. | 2.0% |
| Piper Sandler Cos. | 1.9% |
| Texas Roadhouse, Inc. | 1.9% |
| MACOM Technology Solutions Holdings, Inc. | 1.9% |
| RBC Bearings, Inc. | 1.9% |
| Gates Industrial Corp. PLC | 1.8% |
| Federal Signal Corp. | 1.8% |
| Top Ten as a Group | 19.9% |
Portfolio Breakdown

Top Ten Holdings
| API Group Corp. | 2.3% |
| CyberArk Software, Ltd. (Israel) | 2.3% |
| Comfort Systems USA, Inc. | 2.1% |
| Performance Food Group Co. | 2.0% |
| Piper Sandler Cos. | 1.9% |
| Texas Roadhouse, Inc. | 1.9% |
| MACOM Technology Solutions Holdings, Inc. | 1.9% |
| RBC Bearings, Inc. | 1.9% |
| Gates Industrial Corp. PLC | 1.8% |
| Federal Signal Corp. | 1.8% |
| Top Ten as a Group | 19.9% |
Fund Expenses
What were the Fund costs for the last six months?
(Based on a hypothetical $10,000 investment)
| Fund (Class) | Costs of a $10,000 investment | Costs paid as a percentage of a $10,000 investment |
| AMG GW&K Small/Mid Cap Core Fund (Class N/GWGVX) |
$52 | 1.07% |
Key Fund Statistics (as of June 30, 2025)
| Fund net assets | $758,986,647 |
| Total number of portfolio holdings | 91 |
| Net advisory fees paid | $2,341,049 |
| Portfolio turnover rate as of the end of the reporting period | 12% |
Graphical Representation of Holdings (as of June 30, 2025)
Top ten holdings and portfolio breakdown are shown as a percentage of net assets of the Fund.
Top Ten Holdings
| API Group Corp. | 2.3% |
| CyberArk Software, Ltd. (Israel) | 2.3% |
| Comfort Systems USA, Inc. | 2.1% |
| Performance Food Group Co. | 2.0% |
| Piper Sandler Cos. | 1.9% |
| Texas Roadhouse, Inc. | 1.9% |
| MACOM Technology Solutions Holdings, Inc. | 1.9% |
| RBC Bearings, Inc. | 1.9% |
| Gates Industrial Corp. PLC | 1.8% |
| Federal Signal Corp. | 1.8% |
| Top Ten as a Group | 19.9% |
Portfolio Breakdown

Top Ten Holdings
| API Group Corp. | 2.3% |
| CyberArk Software, Ltd. (Israel) | 2.3% |
| Comfort Systems USA, Inc. | 2.1% |
| Performance Food Group Co. | 2.0% |
| Piper Sandler Cos. | 1.9% |
| Texas Roadhouse, Inc. | 1.9% |
| MACOM Technology Solutions Holdings, Inc. | 1.9% |
| RBC Bearings, Inc. | 1.9% |
| Gates Industrial Corp. PLC | 1.8% |
| Federal Signal Corp. | 1.8% |
| Top Ten as a Group | 19.9% |
Fund Expenses
What were the Fund costs for the last six months?
(Based on a hypothetical $10,000 investment)
| Fund (Class) | Costs of a $10,000 investment | Costs paid as a percentage of a $10,000 investment |
| AMG GW&K Municipal Bond Fund (Class I/GWMIX) |
$19 | 0.39% |
Key Fund Statistics (as of June 30, 2025)
| Fund net assets | $927,463,116 |
| Total number of portfolio holdings | 216 |
| Net advisory fees paid | $674,088 |
| Portfolio turnover rate as of the end of the reporting period | 28% |
Graphical Representation of Holdings (as of June 30, 2025)
Top ten holdings and portfolio breakdown are shown as a percentage of net assets of the Fund and ratings are shown as a percentage of total long-term investments of the Fund.
Top Ten Holdings
| Louisiana Stadium & Exposition District, Series A, 5.000%, 07/01/42 | 1.3% |
| Great Lakes Water Authority Sewage Disposal System Revenue, Series B, 5.000%, 07/01/34 | 1.2% |
| State of Illinois, Series B, 5.000%, 05/01/34 | 1.1% |
| Iowa Finance Authority, State Revolving Fund Green Bond, 5.000%, 08/01/30 | 1.1% |
| New York Transportation Development Corp., 5.000%, 12/01/36 | 1.1% |
| State Board of Administration Finance Corp., Series A, 5.526%, 07/01/34 | 1.1% |
| Chicago O'Hare International Airport, Senior Lien, Series A, Revenue, 5.000%, 01/01/36 | 1.1% |
| Florida Development Finance Corp., Revenue, 4.000%, 11/15/33 | 1.1% |
| New York State Dormitory Authority, Series A, 5.000%, 03/15/41 | 1.1% |
| Illinois State Toll Highway Authority, Senior Revenue, Series A, Revenue, 5.000%, 12/01/31 | 1.1% |
| Top Ten as a Group | 11.3% |
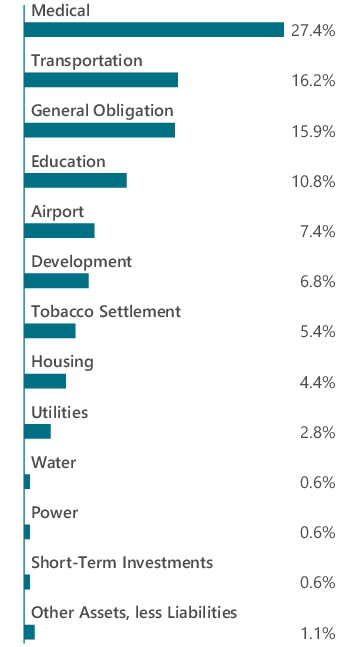
Portfolio Breakdown
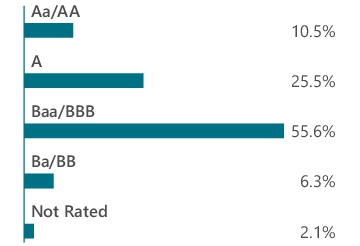
Ratings
Top Ten Holdings
| Louisiana Stadium & Exposition District, Series A, 5.000%, 07/01/42 | 1.3% |
| Great Lakes Water Authority Sewage Disposal System Revenue, Series B, 5.000%, 07/01/34 | 1.2% |
| State of Illinois, Series B, 5.000%, 05/01/34 | 1.1% |
| Iowa Finance Authority, State Revolving Fund Green Bond, 5.000%, 08/01/30 | 1.1% |
| New York Transportation Development Corp., 5.000%, 12/01/36 | 1.1% |
| State Board of Administration Finance Corp., Series A, 5.526%, 07/01/34 | 1.1% |
| Chicago O'Hare International Airport, Senior Lien, Series A, Revenue, 5.000%, 01/01/36 | 1.1% |
| Florida Development Finance Corp., Revenue, 4.000%, 11/15/33 | 1.1% |
| New York State Dormitory Authority, Series A, 5.000%, 03/15/41 | 1.1% |
| Illinois State Toll Highway Authority, Senior Revenue, Series A, Revenue, 5.000%, 12/01/31 | 1.1% |
| Top Ten as a Group | 11.3% |
Fund Expenses
What were the Fund costs for the last six months?
(Based on a hypothetical $10,000 investment)
| Fund (Class) | Costs of a $10,000 investment | Costs paid as a percentage of a $10,000 investment |
| AMG GW&K Municipal Bond Fund (Class N/GWMTX) |
$36 | 0.72% |
Key Fund Statistics (as of June 30, 2025)
| Fund net assets | $927,463,116 |
| Total number of portfolio holdings | 216 |
| Net advisory fees paid | $674,088 |
| Portfolio turnover rate as of the end of the reporting period | 28% |
Graphical Representation of Holdings (as of June 30, 2025)
Top ten holdings and portfolio breakdown are shown as a percentage of net assets of the Fund and ratings are shown as a percentage of total long-term investments of the Fund.
Top Ten Holdings
| Louisiana Stadium & Exposition District, Series A, 5.000%, 07/01/42 | 1.3% |
| Great Lakes Water Authority Sewage Disposal System Revenue, Series B, 5.000%, 07/01/34 | 1.2% |
| State of Illinois, Series B, 5.000%, 05/01/34 | 1.1% |
| Iowa Finance Authority, State Revolving Fund Green Bond, 5.000%, 08/01/30 | 1.1% |
| New York Transportation Development Corp., 5.000%, 12/01/36 | 1.1% |
| State Board of Administration Finance Corp., Series A, 5.526%, 07/01/34 | 1.1% |
| Chicago O'Hare International Airport, Senior Lien, Series A, Revenue, 5.000%, 01/01/36 | 1.1% |
| Florida Development Finance Corp., Revenue, 4.000%, 11/15/33 | 1.1% |
| New York State Dormitory Authority, Series A, 5.000%, 03/15/41 | 1.1% |
| Illinois State Toll Highway Authority, Senior Revenue, Series A, Revenue, 5.000%, 12/01/31 | 1.1% |
| Top Ten as a Group | 11.3% |
Portfolio Breakdown

Ratings

Top Ten Holdings
| Louisiana Stadium & Exposition District, Series A, 5.000%, 07/01/42 | 1.3% |
| Great Lakes Water Authority Sewage Disposal System Revenue, Series B, 5.000%, 07/01/34 | 1.2% |
| State of Illinois, Series B, 5.000%, 05/01/34 | 1.1% |
| Iowa Finance Authority, State Revolving Fund Green Bond, 5.000%, 08/01/30 | 1.1% |
| New York Transportation Development Corp., 5.000%, 12/01/36 | 1.1% |
| State Board of Administration Finance Corp., Series A, 5.526%, 07/01/34 | 1.1% |
| Chicago O'Hare International Airport, Senior Lien, Series A, Revenue, 5.000%, 01/01/36 | 1.1% |
| Florida Development Finance Corp., Revenue, 4.000%, 11/15/33 | 1.1% |
| New York State Dormitory Authority, Series A, 5.000%, 03/15/41 | 1.1% |
| Illinois State Toll Highway Authority, Senior Revenue, Series A, Revenue, 5.000%, 12/01/31 | 1.1% |
| Top Ten as a Group | 11.3% |
Fund Expenses
What were the Fund costs for the last six months?
(Based on a hypothetical $10,000 investment)
| Fund (Class) | Costs of a $10,000 investment | Costs paid as a percentage of a $10,000 investment |
| AMG Renaissance Large Cap Growth Fund (Class N/MRLTX) |
$51 | 1.00% |
Key Fund Statistics (as of June 30, 2025)
| Fund net assets | $138,379,377 |
| Total number of portfolio holdings | 57 |
| Net advisory fees paid | $246,165 |
| Portfolio turnover rate as of the end of the reporting period | 23% |
Graphical Representation of Holdings (as of June 30, 2025)
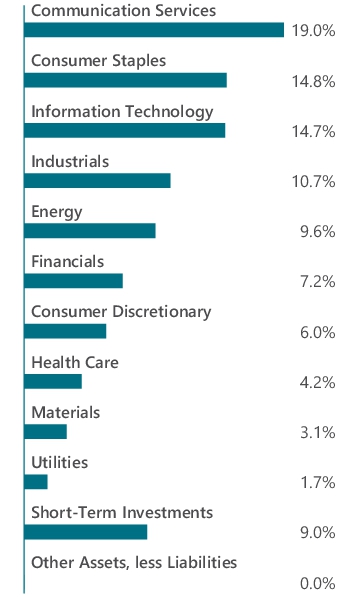
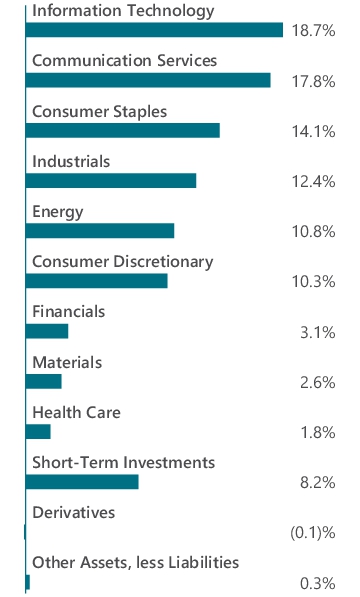
Top ten holdings and portfolio breakdown are shown as a percentage of net assets of the Fund.
Top Ten Holdings
| Microsoft Corp. | 3.2% |
| Apple, Inc. | 2.9% |
| Meta Platforms, Inc., Class A | 2.8% |
| Amazon.com, Inc. | 2.7% |
| Broadcom, Inc. | 2.5% |
| Netflix, Inc. | 2.4% |
| Amphenol Corp., Class A | 2.2% |
| Alphabet, Inc., Class A | 2.2% |
| Jabil, Inc. | 2.1% |
| Royal Caribbean Cruises, Ltd. | 2.0% |
| Top Ten as a Group | 25.0% |
Portfolio Breakdown
Top Ten Holdings
| Microsoft Corp. | 3.2% |
| Apple, Inc. | 2.9% |
| Meta Platforms, Inc., Class A | 2.8% |
| Amazon.com, Inc. | 2.7% |
| Broadcom, Inc. | 2.5% |
| Netflix, Inc. | 2.4% |
| Amphenol Corp., Class A | 2.2% |
| Alphabet, Inc., Class A | 2.2% |
| Jabil, Inc. | 2.1% |
| Royal Caribbean Cruises, Ltd. | 2.0% |
| Top Ten as a Group | 25.0% |
Fund Expenses
What were the Fund costs for the last six months?
(Based on a hypothetical $10,000 investment)
| Fund (Class) | Costs of a $10,000 investment | Costs paid as a percentage of a $10,000 investment |
| AMG Renaissance Large Cap Growth Fund (Class I/MRLSX) |
$37 | 0.73% |
Key Fund Statistics (as of June 30, 2025)
| Fund net assets | $138,379,377 |
| Total number of portfolio holdings | 57 |
| Net advisory fees paid | $246,165 |
| Portfolio turnover rate as of the end of the reporting period | 23% |
Graphical Representation of Holdings (as of June 30, 2025)
Top ten holdings and portfolio breakdown are shown as a percentage of net assets of the Fund.
Top Ten Holdings
| Microsoft Corp. | 3.2% |
| Apple, Inc. | 2.9% |
| Meta Platforms, Inc., Class A | 2.8% |
| Amazon.com, Inc. | 2.7% |
| Broadcom, Inc. | 2.5% |
| Netflix, Inc. | 2.4% |
| Amphenol Corp., Class A | 2.2% |
| Alphabet, Inc., Class A | 2.2% |
| Jabil, Inc. | 2.1% |
| Royal Caribbean Cruises, Ltd. | 2.0% |
| Top Ten as a Group | 25.0% |
Portfolio Breakdown

Top Ten Holdings
| Microsoft Corp. | 3.2% |
| Apple, Inc. | 2.9% |
| Meta Platforms, Inc., Class A | 2.8% |
| Amazon.com, Inc. | 2.7% |
| Broadcom, Inc. | 2.5% |
| Netflix, Inc. | 2.4% |
| Amphenol Corp., Class A | 2.2% |
| Alphabet, Inc., Class A | 2.2% |
| Jabil, Inc. | 2.1% |
| Royal Caribbean Cruises, Ltd. | 2.0% |
| Top Ten as a Group | 25.0% |
Fund Expenses
What were the Fund costs for the last six months?
(Based on a hypothetical $10,000 investment)
| Fund (Class) | Costs of a $10,000 investment | Costs paid as a percentage of a $10,000 investment |
| AMG Renaissance Large Cap Growth Fund (Class Z/MRLIX) |
$34 | 0.66% |
Key Fund Statistics (as of June 30, 2025)
| Fund net assets | $138,379,377 |
| Total number of portfolio holdings | 57 |
| Net advisory fees paid | $246,165 |
| Portfolio turnover rate as of the end of the reporting period | 23% |
Graphical Representation of Holdings (as of June 30, 2025)
Top ten holdings and portfolio breakdown are shown as a percentage of net assets of the Fund.
Top Ten Holdings
| Microsoft Corp. | 3.2% |
| Apple, Inc. | 2.9% |
| Meta Platforms, Inc., Class A | 2.8% |
| Amazon.com, Inc. | 2.7% |
| Broadcom, Inc. | 2.5% |
| Netflix, Inc. | 2.4% |
| Amphenol Corp., Class A | 2.2% |
| Alphabet, Inc., Class A | 2.2% |
| Jabil, Inc. | 2.1% |
| Royal Caribbean Cruises, Ltd. | 2.0% |
| Top Ten as a Group | 25.0% |
Portfolio Breakdown

Top Ten Holdings
| Microsoft Corp. | 3.2% |
| Apple, Inc. | 2.9% |
| Meta Platforms, Inc., Class A | 2.8% |
| Amazon.com, Inc. | 2.7% |
| Broadcom, Inc. | 2.5% |
| Netflix, Inc. | 2.4% |
| Amphenol Corp., Class A | 2.2% |
| Alphabet, Inc., Class A | 2.2% |
| Jabil, Inc. | 2.1% |
| Royal Caribbean Cruises, Ltd. | 2.0% |
| Top Ten as a Group | 25.0% |
Fund Expenses
What were the Fund costs for the last six months?
(Based on a hypothetical $10,000 investment)
| Fund (Class) | Costs of a $10,000 investment | Costs paid as a percentage of a $10,000 investment |
| AMG Yacktman Fund (Class I/YACKX) |
$36 | 0.71% |
Key Fund Statistics (as of June 30, 2025)
| Fund net assets | $6,719,854,242 |
| Total number of portfolio holdings | 62 |
| Net advisory fees paid | $14,532,595 |
| Portfolio turnover rate as of the end of the reporting period | 1% |
Graphical Representation of Holdings (as of June 30, 2025)
Top ten holdings and portfolio breakdown are shown as a percentage of net assets of the Fund and country allocation is shown as a percentage of total long-term investments of the Fund.
Top Ten Holdings
| Bolloré SE (France) | 8.3% |
| Samsung Electronics Co., Ltd., 2.870% (South Korea) | 6.4% |
| Canadian Natural Resources, Ltd. (Canada) | 5.3% |
| Microsoft Corp. | 4.8% |
| The Charles Schwab Corp. | 3.7% |
| Hyundai Mobis Co., Ltd. (South Korea) | 3.2% |
| The Procter & Gamble Co. | 2.9% |
| Cognizant Technology Solutions Corp., Class A | 2.4% |
| U-Haul Holding Co., Non-Voting Shares | 2.4% |
| Reliance, Inc. | 2.4% |
| Top Ten as a Group | 41.8% |
Portfolio Breakdown
Country Allocation
Top Ten Holdings
| Bolloré SE (France) | 8.3% |
| Samsung Electronics Co., Ltd., 2.870% (South Korea) | 6.4% |
| Canadian Natural Resources, Ltd. (Canada) | 5.3% |
| Microsoft Corp. | 4.8% |
| The Charles Schwab Corp. | 3.7% |
| Hyundai Mobis Co., Ltd. (South Korea) | 3.2% |
| The Procter & Gamble Co. | 2.9% |
| Cognizant Technology Solutions Corp., Class A | 2.4% |
| U-Haul Holding Co., Non-Voting Shares | 2.4% |
| Reliance, Inc. | 2.4% |
| Top Ten as a Group | 41.8% |
Fund Expenses
What were the Fund costs for the last six months?
(Based on a hypothetical $10,000 investment)
| Fund (Class) | Costs of a $10,000 investment | Costs paid as a percentage of a $10,000 investment |
| AMG Yacktman Focused Fund (Class I/YAFIX) |
$56 | 1.08% |
Key Fund Statistics (as of June 30, 2025)
| Fund net assets | $2,615,782,769 |
| Total number of portfolio holdings | 49 |
| Net advisory fees paid | $11,429,770 |
| Portfolio turnover rate as of the end of the reporting period | 1% |
Graphical Representation of Holdings (as of June 30, 2025)
Top ten holdings and portfolio breakdown are shown as a percentage of net assets of the Fund and country allocation is shown as a percentage of total long-term investments of the Fund.
Top Ten Holdings
| Samsung Electronics Co., Ltd., 2.870% (South Korea) | 12.5% |
| Bolloré SE (France) | 9.9% |
| Canadian Natural Resources, Ltd. (Canada) | 8.4% |
| Microsoft Corp. | 4.4% |
| Hyundai Mobis Co., Ltd. (South Korea) | 3.6% |
| U-Haul Holding Co., Non-Voting Shares | 3.4% |
| KT&G Corp. (South Korea) | 3.2% |
| The Charles Schwab Corp. | 3.1% |
| Fox Corp., Class B | 3.1% |
| Hyundai Motor Co., 7.940% (South Korea) | 2.8% |
| Top Ten as a Group | 54.4% |
Portfolio Breakdown
Country Allocation
Top Ten Holdings
| Samsung Electronics Co., Ltd., 2.870% (South Korea) | 12.5% |
| Bolloré SE (France) | 9.9% |
| Canadian Natural Resources, Ltd. (Canada) | 8.4% |
| Microsoft Corp. | 4.4% |
| Hyundai Mobis Co., Ltd. (South Korea) | 3.6% |
| U-Haul Holding Co., Non-Voting Shares | 3.4% |
| KT&G Corp. (South Korea) | 3.2% |
| The Charles Schwab Corp. | 3.1% |
| Fox Corp., Class B | 3.1% |
| Hyundai Motor Co., 7.940% (South Korea) | 2.8% |
| Top Ten as a Group | 54.4% |
Fund Expenses
What were the Fund costs for the last six months?
(Based on a hypothetical $10,000 investment)
| Fund (Class) | Costs of a $10,000 investment | Costs paid as a percentage of a $10,000 investment |
| AMG Yacktman Focused Fund (Class N/YAFFX) |
$65 | 1.26% |
Key Fund Statistics (as of June 30, 2025)
| Fund net assets | $2,615,782,769 |
| Total number of portfolio holdings | 49 |
| Net advisory fees paid | $11,429,770 |
| Portfolio turnover rate as of the end of the reporting period | 1% |
Graphical Representation of Holdings (as of June 30, 2025)
Top ten holdings and portfolio breakdown are shown as a percentage of net assets of the Fund and country allocation is shown as a percentage of total long-term investments of the Fund.
Top Ten Holdings
| Samsung Electronics Co., Ltd., 2.870% (South Korea) | 12.5% |
| Bolloré SE (France) | 9.9% |
| Canadian Natural Resources, Ltd. (Canada) | 8.4% |
| Microsoft Corp. | 4.4% |
| Hyundai Mobis Co., Ltd. (South Korea) | 3.6% |
| U-Haul Holding Co., Non-Voting Shares | 3.4% |
| KT&G Corp. (South Korea) | 3.2% |
| The Charles Schwab Corp. | 3.1% |
| Fox Corp., Class B | 3.1% |
| Hyundai Motor Co., 7.940% (South Korea) | 2.8% |
| Top Ten as a Group | 54.4% |
Portfolio Breakdown

Country Allocation

Top Ten Holdings
| Samsung Electronics Co., Ltd., 2.870% (South Korea) | 12.5% |
| Bolloré SE (France) | 9.9% |
| Canadian Natural Resources, Ltd. (Canada) | 8.4% |
| Microsoft Corp. | 4.4% |
| Hyundai Mobis Co., Ltd. (South Korea) | 3.6% |
| U-Haul Holding Co., Non-Voting Shares | 3.4% |
| KT&G Corp. (South Korea) | 3.2% |
| The Charles Schwab Corp. | 3.1% |
| Fox Corp., Class B | 3.1% |
| Hyundai Motor Co., 7.940% (South Korea) | 2.8% |
| Top Ten as a Group | 54.4% |
Fund Expenses
What were the Fund costs for the last six months?
(Based on a hypothetical $10,000 investment)
| Fund (Class) | Costs of a $10,000 investment | Costs paid as a percentage of a $10,000 investment |
| AMG GW&K Small Cap Value Fund (Class N/SKSEX) |
$55 | 1.14% |
Key Fund Statistics (as of June 30, 2025)
| Fund net assets | $199,455,079 |
| Total number of portfolio holdings | 88 |
| Net advisory fees paid | $665,668 |
| Portfolio turnover rate as of the end of the reporting period | 15% |
Graphical Representation of Holdings (as of June 30, 2025)
Top ten holdings and portfolio breakdown are shown as a percentage of net assets of the Fund.
Top Ten Holdings
| TTM Technologies, Inc. | 2.7% |
| Federal Agricultural Mortgage Corp., Class C | 2.3% |
| Integer Holdings Corp. | 2.2% |
| Solaris Energy Infrastructure, Inc., Class A | 2.1% |
| Ameris Bancorp | 2.0% |
| Independence Realty Trust, Inc., REIT | 2.0% |
| Selective Insurance Group, Inc. | 2.0% |
| International Bancshares Corp. | 1.9% |
| IMAX Corp. (Canada) | 1.8% |
| Group 1 Automotive, Inc. | 1.8% |
| Top Ten as a Group | 20.8% |
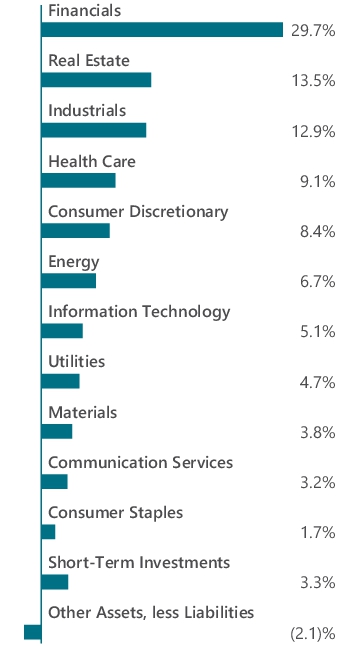
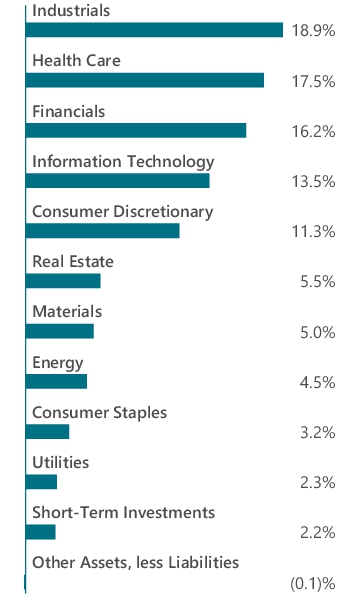
Portfolio Breakdown

Top Ten Holdings
| TTM Technologies, Inc. | 2.7% |
| Federal Agricultural Mortgage Corp., Class C | 2.3% |
| Integer Holdings Corp. | 2.2% |
| Solaris Energy Infrastructure, Inc., Class A | 2.1% |
| Ameris Bancorp | 2.0% |
| Independence Realty Trust, Inc., REIT | 2.0% |
| Selective Insurance Group, Inc. | 2.0% |
| International Bancshares Corp. | 1.9% |
| IMAX Corp. (Canada) | 1.8% |
| Group 1 Automotive, Inc. | 1.8% |
| Top Ten as a Group | 20.8% |
Fund Expenses
What were the Fund costs for the last six months?
(Based on a hypothetical $10,000 investment)
| Fund (Class) | Costs of a $10,000 investment | Costs paid as a percentage of a $10,000 investment |
| AMG GW&K Small Cap Value Fund (Class I/SKSIX) |
$45 | 0.94% |
Key Fund Statistics (as of June 30, 2025)
| Fund net assets | $199,455,079 |
| Total number of portfolio holdings | 88 |
| Net advisory fees paid | $665,668 |
| Portfolio turnover rate as of the end of the reporting period | 15% |
Graphical Representation of Holdings (as of June 30, 2025)
Top ten holdings and portfolio breakdown are shown as a percentage of net assets of the Fund.
Top Ten Holdings
| TTM Technologies, Inc. | 2.7% |
| Federal Agricultural Mortgage Corp., Class C | 2.3% |
| Integer Holdings Corp. | 2.2% |
| Solaris Energy Infrastructure, Inc., Class A | 2.1% |
| Ameris Bancorp | 2.0% |
| Independence Realty Trust, Inc., REIT | 2.0% |
| Selective Insurance Group, Inc. | 2.0% |
| International Bancshares Corp. | 1.9% |
| IMAX Corp. (Canada) | 1.8% |
| Group 1 Automotive, Inc. | 1.8% |
| Top Ten as a Group | 20.8% |
Portfolio Breakdown
Top Ten Holdings
| TTM Technologies, Inc. | 2.7% |
| Federal Agricultural Mortgage Corp., Class C | 2.3% |
| Integer Holdings Corp. | 2.2% |
| Solaris Energy Infrastructure, Inc., Class A | 2.1% |
| Ameris Bancorp | 2.0% |
| Independence Realty Trust, Inc., REIT | 2.0% |
| Selective Insurance Group, Inc. | 2.0% |
| International Bancshares Corp. | 1.9% |
| IMAX Corp. (Canada) | 1.8% |
| Group 1 Automotive, Inc. | 1.8% |
| Top Ten as a Group | 20.8% |
Fund Expenses
What were the Fund costs for the last six months?
(Based on a hypothetical $10,000 investment)
| Fund (Class) | Costs of a $10,000 investment | Costs paid as a percentage of a $10,000 investment |
| AMG GW&K Small Cap Value Fund (Class Z/SKSZX) |
$43 | 0.89% |
Key Fund Statistics (as of June 30, 2025)
| Fund net assets | $199,455,079 |
| Total number of portfolio holdings | 88 |
| Net advisory fees paid | $665,668 |
| Portfolio turnover rate as of the end of the reporting period | 15% |
Graphical Representation of Holdings (as of June 30, 2025)
Top ten holdings and portfolio breakdown are shown as a percentage of net assets of the Fund.
Top Ten Holdings
| TTM Technologies, Inc. | 2.7% |
| Federal Agricultural Mortgage Corp., Class C | 2.3% |
| Integer Holdings Corp. | 2.2% |
| Solaris Energy Infrastructure, Inc., Class A | 2.1% |
| Ameris Bancorp | 2.0% |
| Independence Realty Trust, Inc., REIT | 2.0% |
| Selective Insurance Group, Inc. | 2.0% |
| International Bancshares Corp. | 1.9% |
| IMAX Corp. (Canada) | 1.8% |
| Group 1 Automotive, Inc. | 1.8% |
| Top Ten as a Group | 20.8% |
Portfolio Breakdown

Top Ten Holdings
| TTM Technologies, Inc. | 2.7% |
| Federal Agricultural Mortgage Corp., Class C | 2.3% |
| Integer Holdings Corp. | 2.2% |
| Solaris Energy Infrastructure, Inc., Class A | 2.1% |
| Ameris Bancorp | 2.0% |
| Independence Realty Trust, Inc., REIT | 2.0% |
| Selective Insurance Group, Inc. | 2.0% |
| International Bancshares Corp. | 1.9% |
| IMAX Corp. (Canada) | 1.8% |
| Group 1 Automotive, Inc. | 1.8% |
| Top Ten as a Group | 20.8% |
Fund Expenses
What were the Fund costs for the last six months?
(Based on a hypothetical $10,000 investment)
| Fund (Class) | Costs of a $10,000 investment | Costs paid as a percentage of a $10,000 investment |
| AMG TimesSquare Small Cap Growth Fund (Class Z/TSCIX) |
$46 | 0.93% |
Key Fund Statistics (as of June 30, 2025)
| Fund net assets | $114,013,965 |
| Total number of portfolio holdings | 86 |
| Net advisory fees paid | $365,638 |
| Portfolio turnover rate as of the end of the reporting period | 35% |
Graphical Representation of Holdings (as of June 30, 2025)
Top ten holdings and portfolio breakdown are shown as a percentage of net assets of the Fund.
Top Ten Holdings
| BJ's Wholesale Club Holdings, Inc. | 2.9% |
| JFrog, Ltd. | 2.8% |
| Casella Waste Systems, Inc., Class A | 2.6% |
| Regal Rexnord Corp. | 2.4% |
| Victory Capital Holdings, Inc., Class A | 2.2% |
| Esab Corp. | 2.0% |
| iShares Russell 2000 Growth ETF | 2.0% |
| Addus HomeCare Corp. | 2.0% |
| Safety Insurance Group, Inc. | 2.0% |
| Insmed, Inc. | 1.9% |
| Top Ten as a Group | 22.8% |
Portfolio Breakdown
Top Ten Holdings
| BJ's Wholesale Club Holdings, Inc. | 2.9% |
| JFrog, Ltd. | 2.8% |
| Casella Waste Systems, Inc., Class A | 2.6% |
| Regal Rexnord Corp. | 2.4% |
| Victory Capital Holdings, Inc., Class A | 2.2% |
| Esab Corp. | 2.0% |
| iShares Russell 2000 Growth ETF | 2.0% |
| Addus HomeCare Corp. | 2.0% |
| Safety Insurance Group, Inc. | 2.0% |
| Insmed, Inc. | 1.9% |
| Top Ten as a Group | 22.8% |
Fund Expenses
What were the Fund costs for the last six months?
(Based on a hypothetical $10,000 investment)
| Fund (Class) | Costs of a $10,000 investment | Costs paid as a percentage of a $10,000 investment |
| AMG TimesSquare Small Cap Growth Fund (Class N/TSCPX) |
$56 | 1.13% |
Key Fund Statistics (as of June 30, 2025)
| Fund net assets | $114,013,965 |
| Total number of portfolio holdings | 86 |
| Net advisory fees paid | $365,638 |
| Portfolio turnover rate as of the end of the reporting period | 35% |
Graphical Representation of Holdings (as of June 30, 2025)
Top ten holdings and portfolio breakdown are shown as a percentage of net assets of the Fund.
Top Ten Holdings
| BJ's Wholesale Club Holdings, Inc. | 2.9% |
| JFrog, Ltd. | 2.8% |
| Casella Waste Systems, Inc., Class A | 2.6% |
| Regal Rexnord Corp. | 2.4% |
| Victory Capital Holdings, Inc., Class A | 2.2% |
| Esab Corp. | 2.0% |
| iShares Russell 2000 Growth ETF | 2.0% |
| Addus HomeCare Corp. | 2.0% |
| Safety Insurance Group, Inc. | 2.0% |
| Insmed, Inc. | 1.9% |
| Top Ten as a Group | 22.8% |
Portfolio Breakdown

Top Ten Holdings
| BJ's Wholesale Club Holdings, Inc. | 2.9% |
| JFrog, Ltd. | 2.8% |
| Casella Waste Systems, Inc., Class A | 2.6% |
| Regal Rexnord Corp. | 2.4% |
| Victory Capital Holdings, Inc., Class A | 2.2% |
| Esab Corp. | 2.0% |
| iShares Russell 2000 Growth ETF | 2.0% |
| Addus HomeCare Corp. | 2.0% |
| Safety Insurance Group, Inc. | 2.0% |
| Insmed, Inc. | 1.9% |
| Top Ten as a Group | 22.8% |
Fund Expenses
What were the Fund costs for the last six months?
(Based on a hypothetical $10,000 investment)
| Fund (Class) | Costs of a $10,000 investment | Costs paid as a percentage of a $10,000 investment |
| AMG TimesSquare Small Cap Growth Fund (Class I/TSQIX) |
$49 | 0.99% |
Key Fund Statistics (as of June 30, 2025)
| Fund net assets | $114,013,965 |
| Total number of portfolio holdings | 86 |
| Net advisory fees paid | $365,638 |
| Portfolio turnover rate as of the end of the reporting period | 35% |
Graphical Representation of Holdings (as of June 30, 2025)
Top ten holdings and portfolio breakdown are shown as a percentage of net assets of the Fund.
Top Ten Holdings
| BJ's Wholesale Club Holdings, Inc. | 2.9% |
| JFrog, Ltd. | 2.8% |
| Casella Waste Systems, Inc., Class A | 2.6% |
| Regal Rexnord Corp. | 2.4% |
| Victory Capital Holdings, Inc., Class A | 2.2% |
| Esab Corp. | 2.0% |
| iShares Russell 2000 Growth ETF | 2.0% |
| Addus HomeCare Corp. | 2.0% |
| Safety Insurance Group, Inc. | 2.0% |
| Insmed, Inc. | 1.9% |
| Top Ten as a Group | 22.8% |
Portfolio Breakdown

Top Ten Holdings
| BJ's Wholesale Club Holdings, Inc. | 2.9% |
| JFrog, Ltd. | 2.8% |
| Casella Waste Systems, Inc., Class A | 2.6% |
| Regal Rexnord Corp. | 2.4% |
| Victory Capital Holdings, Inc., Class A | 2.2% |
| Esab Corp. | 2.0% |
| iShares Russell 2000 Growth ETF | 2.0% |
| Addus HomeCare Corp. | 2.0% |
| Safety Insurance Group, Inc. | 2.0% |
| Insmed, Inc. | 1.9% |
| Top Ten as a Group | 22.8% |
Fund Expenses
What were the Fund costs for the last six months?
(Based on a hypothetical $10,000 investment)
| Fund (Class) | Costs of a $10,000 investment | Costs paid as a percentage of a $10,000 investment |
| AMG TimesSquare Mid Cap Growth Fund (Class N/TMDPX) |
$54 | 1.05% |
Key Fund Statistics (as of June 30, 2025)
| Fund net assets | $1,596,496,981 |
| Total number of portfolio holdings | 80 |
| Net advisory fees paid | $4,754,683 |
| Portfolio turnover rate as of the end of the reporting period | 22% |
Graphical Representation of Holdings (as of June 30, 2025)
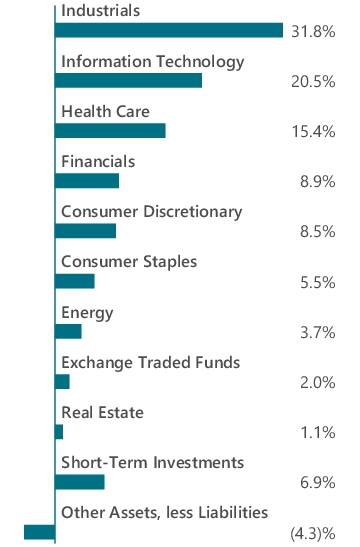
Top ten holdings and portfolio breakdown are shown as a percentage of net assets of the Fund.
Top Ten Holdings
| EMCOR Group, Inc. | 3.0% |
| Cencora, Inc. | 2.8% |
| HubSpot, Inc. | 2.6% |
| Veeva Systems, Inc., Class A | 2.6% |
| Cheniere Energy, Inc. | 2.5% |
| Verisk Analytics, Inc. | 2.4% |
| Axon Enterprise, Inc. | 2.2% |
| IDEXX Laboratories, Inc. | 2.2% |
| Monolithic Power Systems, Inc. | 2.2% |
| CyberArk Software, Ltd. (Israel) | 2.1% |
| Top Ten as a Group | 24.6% |
Portfolio Breakdown

Top Ten Holdings
| EMCOR Group, Inc. | 3.0% |
| Cencora, Inc. | 2.8% |
| HubSpot, Inc. | 2.6% |
| Veeva Systems, Inc., Class A | 2.6% |
| Cheniere Energy, Inc. | 2.5% |
| Verisk Analytics, Inc. | 2.4% |
| Axon Enterprise, Inc. | 2.2% |
| IDEXX Laboratories, Inc. | 2.2% |
| Monolithic Power Systems, Inc. | 2.2% |
| CyberArk Software, Ltd. (Israel) | 2.1% |
| Top Ten as a Group | 24.6% |
Fund Expenses
What were the Fund costs for the last six months?
(Based on a hypothetical $10,000 investment)
| Fund (Class) | Costs of a $10,000 investment | Costs paid as a percentage of a $10,000 investment |
| AMG TimesSquare Mid Cap Growth Fund (Class Z/TMDIX) |
$44 | 0.85% |
Key Fund Statistics (as of June 30, 2025)
| Fund net assets | $1,596,496,981 |
| Total number of portfolio holdings | 80 |
| Net advisory fees paid | $4,754,683 |
| Portfolio turnover rate as of the end of the reporting period | 22% |
Graphical Representation of Holdings (as of June 30, 2025)
Top ten holdings and portfolio breakdown are shown as a percentage of net assets of the Fund.
Top Ten Holdings
| EMCOR Group, Inc. | 3.0% |
| Cencora, Inc. | 2.8% |
| HubSpot, Inc. | 2.6% |
| Veeva Systems, Inc., Class A | 2.6% |
| Cheniere Energy, Inc. | 2.5% |
| Verisk Analytics, Inc. | 2.4% |
| Axon Enterprise, Inc. | 2.2% |
| IDEXX Laboratories, Inc. | 2.2% |
| Monolithic Power Systems, Inc. | 2.2% |
| CyberArk Software, Ltd. (Israel) | 2.1% |
| Top Ten as a Group | 24.6% |
Portfolio Breakdown

Top Ten Holdings
| EMCOR Group, Inc. | 3.0% |
| Cencora, Inc. | 2.8% |
| HubSpot, Inc. | 2.6% |
| Veeva Systems, Inc., Class A | 2.6% |
| Cheniere Energy, Inc. | 2.5% |
| Verisk Analytics, Inc. | 2.4% |
| Axon Enterprise, Inc. | 2.2% |
| IDEXX Laboratories, Inc. | 2.2% |
| Monolithic Power Systems, Inc. | 2.2% |
| CyberArk Software, Ltd. (Israel) | 2.1% |
| Top Ten as a Group | 24.6% |
Fund Expenses
What were the Fund costs for the last six months?
(Based on a hypothetical $10,000 investment)
| Fund (Class) | Costs of a $10,000 investment | Costs paid as a percentage of a $10,000 investment |
| AMG TimesSquare Mid Cap Growth Fund (Class I/TQMIX) |
$47 | 0.90% |
Key Fund Statistics (as of June 30, 2025)
| Fund net assets | $1,596,496,981 |
| Total number of portfolio holdings | 80 |
| Net advisory fees paid | $4,754,683 |
| Portfolio turnover rate as of the end of the reporting period | 22% |
Graphical Representation of Holdings (as of June 30, 2025)
Top ten holdings and portfolio breakdown are shown as a percentage of net assets of the Fund.
Top Ten Holdings
| EMCOR Group, Inc. | 3.0% |
| Cencora, Inc. | 2.8% |
| HubSpot, Inc. | 2.6% |
| Veeva Systems, Inc., Class A | 2.6% |
| Cheniere Energy, Inc. | 2.5% |
| Verisk Analytics, Inc. | 2.4% |
| Axon Enterprise, Inc. | 2.2% |
| IDEXX Laboratories, Inc. | 2.2% |
| Monolithic Power Systems, Inc. | 2.2% |
| CyberArk Software, Ltd. (Israel) | 2.1% |
| Top Ten as a Group | 24.6% |
Portfolio Breakdown
Top Ten Holdings
| EMCOR Group, Inc. | 3.0% |
| Cencora, Inc. | 2.8% |
| HubSpot, Inc. | 2.6% |
| Veeva Systems, Inc., Class A | 2.6% |
| Cheniere Energy, Inc. | 2.5% |
| Verisk Analytics, Inc. | 2.4% |
| Axon Enterprise, Inc. | 2.2% |
| IDEXX Laboratories, Inc. | 2.2% |
| Monolithic Power Systems, Inc. | 2.2% |
| CyberArk Software, Ltd. (Israel) | 2.1% |
| Top Ten as a Group | 24.6% |
Fund Expenses
What were the Fund costs for the last six months?
(Based on a hypothetical $10,000 investment)
| Fund (Class) | Costs of a $10,000 investment | Costs paid as a percentage of a $10,000 investment |
| AMG GW&K Small Cap Core Fund (Class N/GWETX) |
$63 | 1.29% |
Key Fund Statistics (as of June 30, 2025)
| Fund net assets | $586,249,416 |
| Total number of portfolio holdings | 92 |
| Net advisory fees paid | $2,111,207 |
| Portfolio turnover rate as of the end of the reporting period | 8% |
Graphical Representation of Holdings (as of June 30, 2025)
Top ten holdings and portfolio breakdown are shown as a percentage of net assets of the Fund.
Top Ten Holdings
| MACOM Technology Solutions Holdings, Inc. | 2.4% |
| Sterling Infrastructure, Inc. | 2.4% |
| SPX Technologies, Inc. | 2.2% |
| RBC Bearings, Inc. | 2.1% |
| Houlihan Lokey, Inc. | 1.7% |
| Intapp, Inc. | 1.7% |
| Texas Roadhouse, Inc. | 1.6% |
| Silgan Holdings, Inc. | 1.6% |
| STAG Industrial, Inc., REIT | 1.6% |
| CBIZ, Inc. | 1.6% |
| Top Ten as a Group | 18.9% |
Portfolio Breakdown
Top Ten Holdings
| MACOM Technology Solutions Holdings, Inc. | 2.4% |
| Sterling Infrastructure, Inc. | 2.4% |
| SPX Technologies, Inc. | 2.2% |
| RBC Bearings, Inc. | 2.1% |
| Houlihan Lokey, Inc. | 1.7% |
| Intapp, Inc. | 1.7% |
| Texas Roadhouse, Inc. | 1.6% |
| Silgan Holdings, Inc. | 1.6% |
| STAG Industrial, Inc., REIT | 1.6% |
| CBIZ, Inc. | 1.6% |
| Top Ten as a Group | 18.9% |
Fund Expenses
What were the Fund costs for the last six months?
(Based on a hypothetical $10,000 investment)
| Fund (Class) | Costs of a $10,000 investment | Costs paid as a percentage of a $10,000 investment |
| AMG GW&K Municipal Enhanced Yield Fund (Class Z/GWMZX) |
$29 | 0.59% |
Key Fund Statistics (as of June 30, 2025)
| Fund net assets | $166,728,603 |
| Total number of portfolio holdings | 83 |
| Net advisory fees paid | $302,794 |
| Portfolio turnover rate as of the end of the reporting period | 20% |
Graphical Representation of Holdings (as of June 30, 2025)
Top ten holdings and portfolio breakdown are shown as a percentage of net assets of the Fund and ratings are shown as a percentage of total long-term investments of the Fund.
Top Ten Holdings
| Texas Private Activity Bond Surface Transportation Corp., 5.000%, 06/30/58 | 3.9% |
| Public Authority for Colorado Energy Natural Gas Purchase Revenue, 6.500%, 11/15/38 | 3.8% |
| Richland County School District No 2, Series A, 1.875%, 03/01/38 | 3.1% |
| Pennsylvania Economic Development Financing Authority, 5.250%, 06/30/53 | 3.0% |
| Central Plains Energy Project #3, Series A, 5.000%, 09/01/42 | 2.9% |
| City of Chattanooga Electric, 2.000%, 09/01/40 | 2.8% |
| New York Transportation Development Corp., 4.000%, 04/30/53 | 2.8% |
| Rhode Island Health and Educational Building Corp., 5.250%, 05/15/54 | 2.7% |
| Escambia County Health Facilities Authority, 4.000%, 08/15/50 | 2.5% |
| New York Transportation Development Corp., 5.625%, 04/01/40 | 2.5% |
| Top Ten as a Group | 30.0% |
Portfolio Breakdown

Ratings

Top Ten Holdings
| Texas Private Activity Bond Surface Transportation Corp., 5.000%, 06/30/58 | 3.9% |
| Public Authority for Colorado Energy Natural Gas Purchase Revenue, 6.500%, 11/15/38 | 3.8% |
| Richland County School District No 2, Series A, 1.875%, 03/01/38 | 3.1% |
| Pennsylvania Economic Development Financing Authority, 5.250%, 06/30/53 | 3.0% |
| Central Plains Energy Project #3, Series A, 5.000%, 09/01/42 | 2.9% |
| City of Chattanooga Electric, 2.000%, 09/01/40 | 2.8% |
| New York Transportation Development Corp., 4.000%, 04/30/53 | 2.8% |
| Rhode Island Health and Educational Building Corp., 5.250%, 05/15/54 | 2.7% |
| Escambia County Health Facilities Authority, 4.000%, 08/15/50 | 2.5% |
| New York Transportation Development Corp., 5.625%, 04/01/40 | 2.5% |
| Top Ten as a Group | 30.0% |
Fund Expenses
What were the Fund costs for the last six months?
(Based on a hypothetical $10,000 investment)
| Fund (Class) | Costs of a $10,000 investment | Costs paid as a percentage of a $10,000 investment |
| AMG GW&K Small Cap Core Fund (Class I/GWEIX) |
$46 | 0.94% |
Key Fund Statistics (as of June 30, 2025)
| Fund net assets | $586,249,416 |
| Total number of portfolio holdings | 92 |
| Net advisory fees paid | $2,111,207 |
| Portfolio turnover rate as of the end of the reporting period | 8% |
Graphical Representation of Holdings (as of June 30, 2025)
Top ten holdings and portfolio breakdown are shown as a percentage of net assets of the Fund.
Top Ten Holdings
| MACOM Technology Solutions Holdings, Inc. | 2.4% |
| Sterling Infrastructure, Inc. | 2.4% |
| SPX Technologies, Inc. | 2.2% |
| RBC Bearings, Inc. | 2.1% |
| Houlihan Lokey, Inc. | 1.7% |
| Intapp, Inc. | 1.7% |
| Texas Roadhouse, Inc. | 1.6% |
| Silgan Holdings, Inc. | 1.6% |
| STAG Industrial, Inc., REIT | 1.6% |
| CBIZ, Inc. | 1.6% |
| Top Ten as a Group | 18.9% |
Portfolio Breakdown

Top Ten Holdings
| MACOM Technology Solutions Holdings, Inc. | 2.4% |
| Sterling Infrastructure, Inc. | 2.4% |
| SPX Technologies, Inc. | 2.2% |
| RBC Bearings, Inc. | 2.1% |
| Houlihan Lokey, Inc. | 1.7% |
| Intapp, Inc. | 1.7% |
| Texas Roadhouse, Inc. | 1.6% |
| Silgan Holdings, Inc. | 1.6% |
| STAG Industrial, Inc., REIT | 1.6% |
| CBIZ, Inc. | 1.6% |
| Top Ten as a Group | 18.9% |
Fund Expenses
What were the Fund costs for the last six months?
(Based on a hypothetical $10,000 investment)
| Fund (Class) | Costs of a $10,000 investment | Costs paid as a percentage of a $10,000 investment |
| AMG GW&K Small Cap Core Fund (Class Z/GWEZX) |
$43 | 0.89% |
Key Fund Statistics (as of June 30, 2025)
| Fund net assets | $586,249,416 |
| Total number of portfolio holdings | 92 |
| Net advisory fees paid | $2,111,207 |
| Portfolio turnover rate as of the end of the reporting period | 8% |
Graphical Representation of Holdings (as of June 30, 2025)
Top ten holdings and portfolio breakdown are shown as a percentage of net assets of the Fund.
Top Ten Holdings
| MACOM Technology Solutions Holdings, Inc. | 2.4% |
| Sterling Infrastructure, Inc. | 2.4% |
| SPX Technologies, Inc. | 2.2% |
| RBC Bearings, Inc. | 2.1% |
| Houlihan Lokey, Inc. | 1.7% |
| Intapp, Inc. | 1.7% |
| Texas Roadhouse, Inc. | 1.6% |
| Silgan Holdings, Inc. | 1.6% |
| STAG Industrial, Inc., REIT | 1.6% |
| CBIZ, Inc. | 1.6% |
| Top Ten as a Group | 18.9% |
Portfolio Breakdown

Top Ten Holdings
| MACOM Technology Solutions Holdings, Inc. | 2.4% |
| Sterling Infrastructure, Inc. | 2.4% |
| SPX Technologies, Inc. | 2.2% |
| RBC Bearings, Inc. | 2.1% |
| Houlihan Lokey, Inc. | 1.7% |
| Intapp, Inc. | 1.7% |
| Texas Roadhouse, Inc. | 1.6% |
| Silgan Holdings, Inc. | 1.6% |
| STAG Industrial, Inc., REIT | 1.6% |
| CBIZ, Inc. | 1.6% |
| Top Ten as a Group | 18.9% |
Fund Expenses
What were the Fund costs for the last six months?
(Based on a hypothetical $10,000 investment)
| Fund (Class) | Costs of a $10,000 investment | Costs paid as a percentage of a $10,000 investment |
| AMG GW&K Municipal Enhanced Yield Fund (Class N/GWMNX) |
$48 | 0.99% |
Key Fund Statistics (as of June 30, 2025)
| Fund net assets | $166,728,603 |
| Total number of portfolio holdings | 83 |
| Net advisory fees paid | $302,794 |
| Portfolio turnover rate as of the end of the reporting period | 20% |
Graphical Representation of Holdings (as of June 30, 2025)
Top ten holdings and portfolio breakdown are shown as a percentage of net assets of the Fund and ratings are shown as a percentage of total long-term investments of the Fund.
Top Ten Holdings
| Texas Private Activity Bond Surface Transportation Corp., 5.000%, 06/30/58 | 3.9% |
| Public Authority for Colorado Energy Natural Gas Purchase Revenue, 6.500%, 11/15/38 | 3.8% |
| Richland County School District No 2, Series A, 1.875%, 03/01/38 | 3.1% |
| Pennsylvania Economic Development Financing Authority, 5.250%, 06/30/53 | 3.0% |
| Central Plains Energy Project #3, Series A, 5.000%, 09/01/42 | 2.9% |
| City of Chattanooga Electric, 2.000%, 09/01/40 | 2.8% |
| New York Transportation Development Corp., 4.000%, 04/30/53 | 2.8% |
| Rhode Island Health and Educational Building Corp., 5.250%, 05/15/54 | 2.7% |
| Escambia County Health Facilities Authority, 4.000%, 08/15/50 | 2.5% |
| New York Transportation Development Corp., 5.625%, 04/01/40 | 2.5% |
| Top Ten as a Group | 30.0% |
Portfolio Breakdown
Ratings
Top Ten Holdings
| Texas Private Activity Bond Surface Transportation Corp., 5.000%, 06/30/58 | 3.9% |
| Public Authority for Colorado Energy Natural Gas Purchase Revenue, 6.500%, 11/15/38 | 3.8% |
| Richland County School District No 2, Series A, 1.875%, 03/01/38 | 3.1% |
| Pennsylvania Economic Development Financing Authority, 5.250%, 06/30/53 | 3.0% |
| Central Plains Energy Project #3, Series A, 5.000%, 09/01/42 | 2.9% |
| City of Chattanooga Electric, 2.000%, 09/01/40 | 2.8% |
| New York Transportation Development Corp., 4.000%, 04/30/53 | 2.8% |
| Rhode Island Health and Educational Building Corp., 5.250%, 05/15/54 | 2.7% |
| Escambia County Health Facilities Authority, 4.000%, 08/15/50 | 2.5% |
| New York Transportation Development Corp., 5.625%, 04/01/40 | 2.5% |
| Top Ten as a Group | 30.0% |
Fund Expenses
What were the Fund costs for the last six months?
(Based on a hypothetical $10,000 investment)
| Fund (Class) | Costs of a $10,000 investment | Costs paid as a percentage of a $10,000 investment |
| AMG GW&K Municipal Enhanced Yield Fund (Class I/GWMEX) |
$31 | 0.64% |
Key Fund Statistics (as of June 30, 2025)
| Fund net assets | $166,728,603 |
| Total number of portfolio holdings | 83 |
| Net advisory fees paid | $302,794 |
| Portfolio turnover rate as of the end of the reporting period | 20% |
Graphical Representation of Holdings (as of June 30, 2025)
Top ten holdings and portfolio breakdown are shown as a percentage of net assets of the Fund and ratings are shown as a percentage of total long-term investments of the Fund.
Top Ten Holdings
| Texas Private Activity Bond Surface Transportation Corp., 5.000%, 06/30/58 | 3.9% |
| Public Authority for Colorado Energy Natural Gas Purchase Revenue, 6.500%, 11/15/38 | 3.8% |
| Richland County School District No 2, Series A, 1.875%, 03/01/38 | 3.1% |
| Pennsylvania Economic Development Financing Authority, 5.250%, 06/30/53 | 3.0% |
| Central Plains Energy Project #3, Series A, 5.000%, 09/01/42 | 2.9% |
| City of Chattanooga Electric, 2.000%, 09/01/40 | 2.8% |
| New York Transportation Development Corp., 4.000%, 04/30/53 | 2.8% |
| Rhode Island Health and Educational Building Corp., 5.250%, 05/15/54 | 2.7% |
| Escambia County Health Facilities Authority, 4.000%, 08/15/50 | 2.5% |
| New York Transportation Development Corp., 5.625%, 04/01/40 | 2.5% |
| Top Ten as a Group | 30.0% |
Portfolio Breakdown

Ratings

Top Ten Holdings
| Texas Private Activity Bond Surface Transportation Corp., 5.000%, 06/30/58 | 3.9% |
| Public Authority for Colorado Energy Natural Gas Purchase Revenue, 6.500%, 11/15/38 | 3.8% |
| Richland County School District No 2, Series A, 1.875%, 03/01/38 | 3.1% |
| Pennsylvania Economic Development Financing Authority, 5.250%, 06/30/53 | 3.0% |
| Central Plains Energy Project #3, Series A, 5.000%, 09/01/42 | 2.9% |
| City of Chattanooga Electric, 2.000%, 09/01/40 | 2.8% |
| New York Transportation Development Corp., 4.000%, 04/30/53 | 2.8% |
| Rhode Island Health and Educational Building Corp., 5.250%, 05/15/54 | 2.7% |
| Escambia County Health Facilities Authority, 4.000%, 08/15/50 | 2.5% |
| New York Transportation Development Corp., 5.625%, 04/01/40 | 2.5% |
| Top Ten as a Group | 30.0% |