Shareholder Report
|
6 Months Ended |
|
Jun. 30, 2025
USD ($)
Holding
|
|---|
| Shareholder Report [Line Items] |
|
|
| Document Type |
N-CSRS
|
|
| Amendment Flag |
false
|
|
| Registrant Name |
Brighthouse Funds Trust I
|
|
| Entity Central Index Key |
0001126087
|
|
| Entity Investment Company Type |
N-1A
|
|
| Document Period End Date |
Jun. 30, 2025
|
|
| C000100075 |
|
|
| Shareholder Report [Line Items] |
|
|
| Fund Name |
AB Global Dynamic Allocation Portfolio
|
|
| Class Name |
Class B
|
|
| No Trading Symbol [Flag] |
true
|
|
| Annual or Semi-Annual Statement [Text Block] |
This semi-annual shareholder report contains important information about the AB Global Dynamic Allocation Portfolio (the "Portfolio") for the period of January 1, 2025 to June 30, 2025.
|
|
| Shareholder Report Annual or Semi-Annual |
Semi-Annual Shareholder Report
|
|
| Additional Information [Text Block] |
You can find additional information about the Portfolio at https://dfinview.com/BHFT. You can also request this information by contacting us at 1-888-243-1956.
|
|
| Additional Information Phone Number |
1-888-243-1956
|
|
| Additional Information Website |
<span style="box-sizing: border-box; color: rgb(0, 0, 0); display: inline; flex-wrap: nowrap; font-size: 12px; font-weight: 400; grid-area: auto; line-height: 18px; margin: 0px; overflow: visible; text-align: left; text-align-last: auto; white-space-collapse: preserve-breaks;">https://dfinview.com/BHFT</span>
|
|
| Expenses [Text Block] |
What were the Portfolio costs for last six months?This example shows the expenses you would have paid over the reporting period based on a hypothetical $10,000 investment.
Class Name |
Costs of a $10,000 investment |
Costs paid as a percentage of a $10,000 investment |
Class B |
$47 |
0.92%Footnote Reference* |
| Footnote |
Description |
Footnote* |
Annualized. | |
|
| Expenses Paid, Amount |
$ 47
|
|
| Expense Ratio, Percent |
0.92%
|
[1] |
| AssetsNet |
$ 1,746,789,270
|
|
| Holdings Count | Holding |
1,783
|
|
| Advisory Fees Paid, Amount |
$ 5,344,362
|
|
| InvestmentCompanyPortfolioTurnover |
8.00%
|
|
| Additional Fund Statistics [Text Block] |
- Total Net Assets$1,746,789,270
- # of Portfolio Investments1,783
- Portfolio Turnover Rate8%
- Total Advisory Fees Paid$5,344,362
|
|
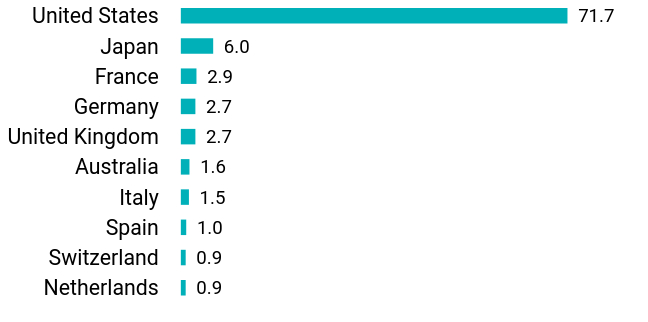
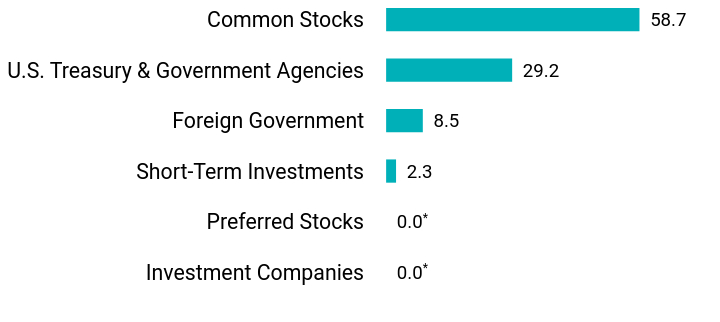
| Holdings [Text Block] |
Top 10 Fixed Income Issuers
U.S. Treasury Notes |
19.3 |
U.S. Treasury Bonds |
7.7 |
French Republic Government Bonds OAT |
1.3 |
Federal National Mortgage Association |
1.2 |
Japan Government Two Year Bonds |
1.0 |
Italy Buoni Poliennali Del Tesoro |
1.0 |
U.K. Gilts |
0.7 |
Bundesrepublik Deutschland Bundesanleihe |
0.6 |
Spain Government Bonds |
0.5 |
Japan Government Twenty Year Bonds |
0.5 |
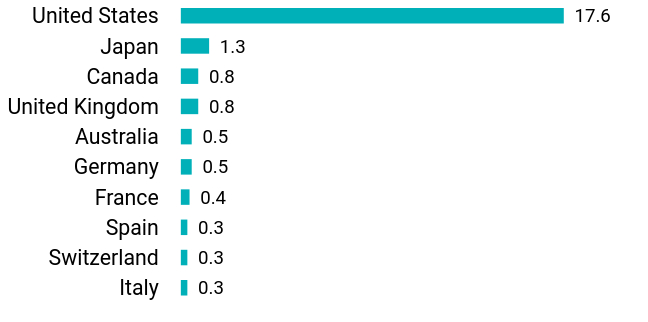
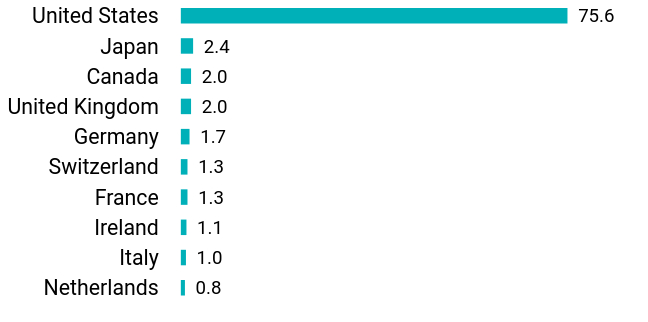
Value |
Value |
Netherlands |
0.9 |
Switzerland |
0.9 |
Spain |
1.0 |
Italy |
1.5 |
Australia |
1.6 |
United Kingdom |
2.7 |
Germany |
2.7 |
France |
2.9 |
Japan |
6.0 |
United States |
71.7 |
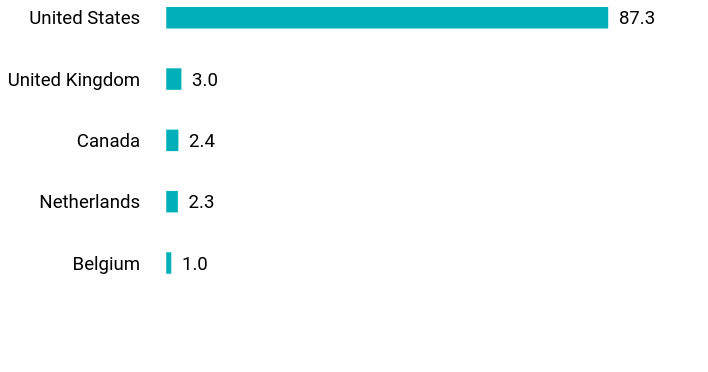
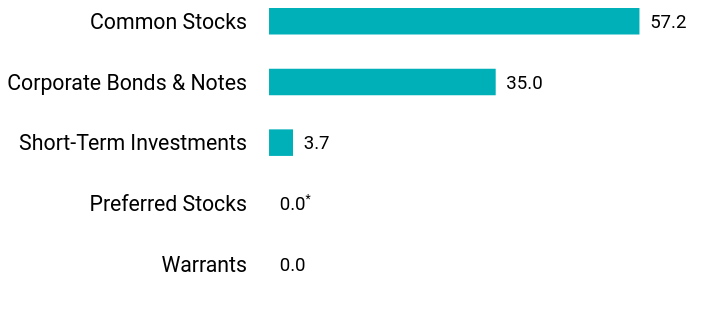
Value |
Value |
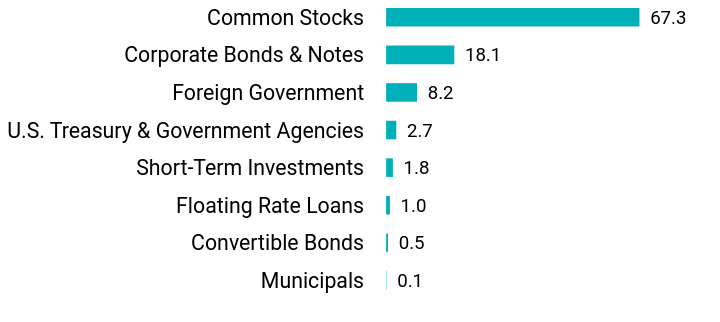
Investment Companies |
0.0Footnote Reference* |
Preferred Stocks |
0.0Footnote Reference* |
Short-Term Investments |
2.3 |
Foreign Government |
8.5 |
U.S. Treasury & Government Agencies |
29.2 |
Common Stocks |
58.7 |
| Footnote |
Description |
Footnote* |
Amount rounds to less than 0.1% | |
|
| Largest Holdings [Text Block] |
NVIDIA Corp. |
2.8 |
Microsoft Corp. |
2.7 |
Apple, Inc. |
2.2 |
Amazon.com, Inc. |
1.5 |
Alphabet, Inc. |
1.3 |
Meta Platforms, Inc. |
1.2 |
Broadcom, Inc. |
0.9 |
Berkshire Hathaway, Inc. |
0.6 |
Tesla, Inc. |
0.6 |
JPMorgan Chase & Co. |
0.6 | |
|
| Updated Prospectus Phone Number |
1-888-243-1956
|
|
| Updated Prospectus Web Address |
<span style="box-sizing: border-box; color: rgb(0, 0, 0); display: inline; flex-wrap: nowrap; font-size: 10.6667px; font-weight: 400; grid-area: auto; line-height: 16px; margin: 0px; overflow: visible; text-align: justify; text-align-last: left; white-space-collapse: preserve-breaks;">https://dfinview.com/BHFT</span>
|
|
| C000210967 |
|
|
| Shareholder Report [Line Items] |
|
|
| Fund Name |
AB International Bond Portfolio
|
|
| Class Name |
Class A
|
|
| No Trading Symbol [Flag] |
true
|
|
| Annual or Semi-Annual Statement [Text Block] |
This semi-annual shareholder report contains important information about the AB International Bond Portfolio (the "Portfolio") for the period of January 1, 2025 to June 30, 2025.
|
|
| Shareholder Report Annual or Semi-Annual |
Semi-Annual Shareholder Report
|
|
| Additional Information [Text Block] |
You can find additional information about the Portfolio at https://dfinview.com/BHFT. You can also request this information by contacting us at 1-888-243-1956.
|
|
| Additional Information Phone Number |
1-888-243-1956
|
|
| Additional Information Website |
<span style="box-sizing: border-box; color: rgb(0, 0, 0); display: inline; flex-wrap: nowrap; font-size: 12px; font-weight: 400; grid-area: auto; line-height: 18px; margin: 0px; overflow: visible; text-align: left; text-align-last: auto; white-space-collapse: preserve-breaks;">https://dfinview.com/BHFT</span>
|
|
| Expenses [Text Block] |
What were the Portfolio costs for last six months?This example shows the expenses you would have paid over the reporting period based on a hypothetical $10,000 investment.
Class Name |
Costs of a $10,000 investment |
Costs paid as a percentage of a $10,000 investment |
Class A |
$31 |
0.62%Footnote Reference* |
| Footnote |
Description |
Footnote* |
Annualized. | |
|
| Expenses Paid, Amount |
$ 31
|
|
| Expense Ratio, Percent |
0.62%
|
[2] |
| AssetsNet |
$ 408,271,086
|
|
| Holdings Count | Holding |
654
|
|
| Advisory Fees Paid, Amount |
$ 1,126,930
|
|
| InvestmentCompanyPortfolioTurnover |
60.00%
|
|
| Additional Fund Statistics [Text Block] |
- Total Net Assets$408,271,086
- # of Portfolio Investments654
- Portfolio Turnover Rate60%
- Total Advisory Fees Paid$1,126,930
|
|
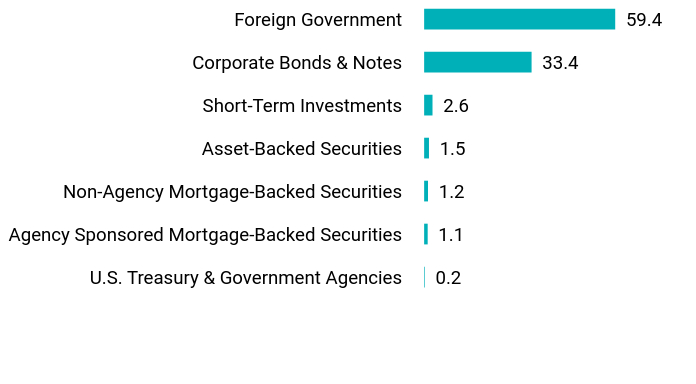
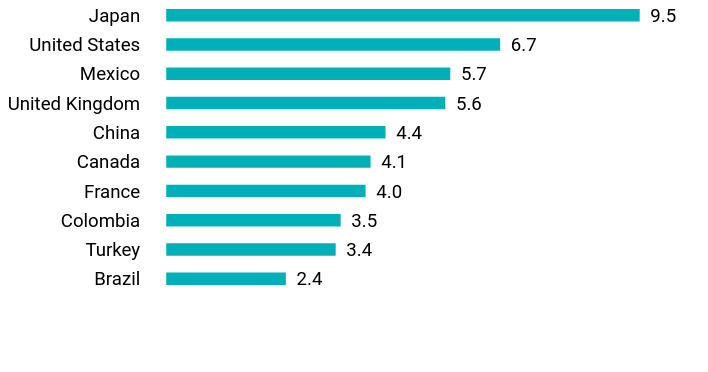
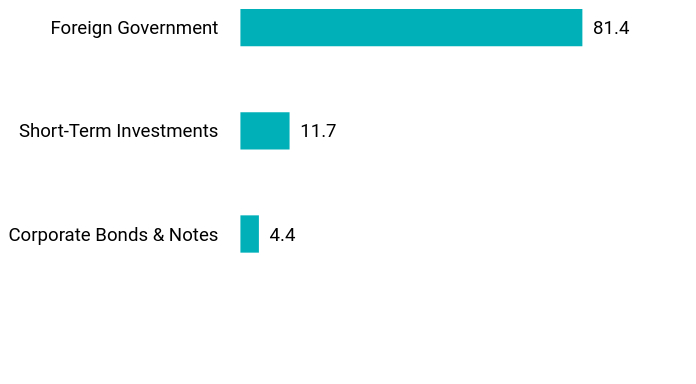
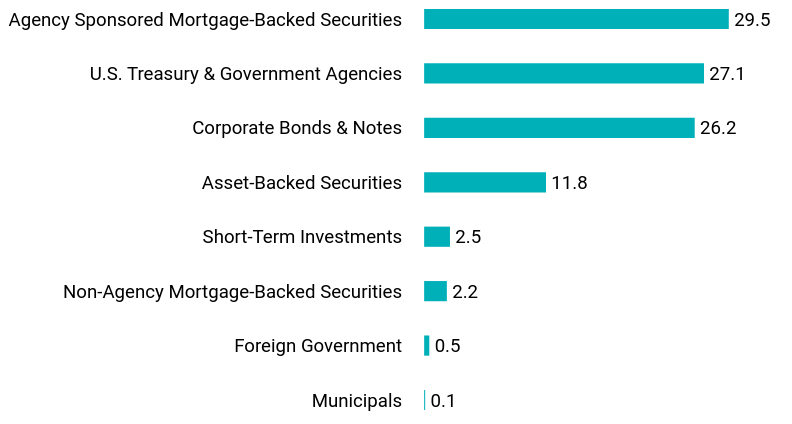
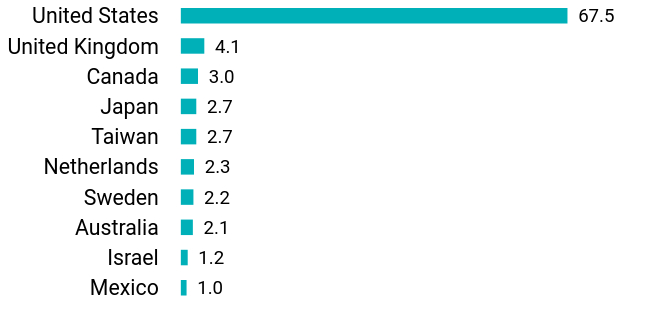
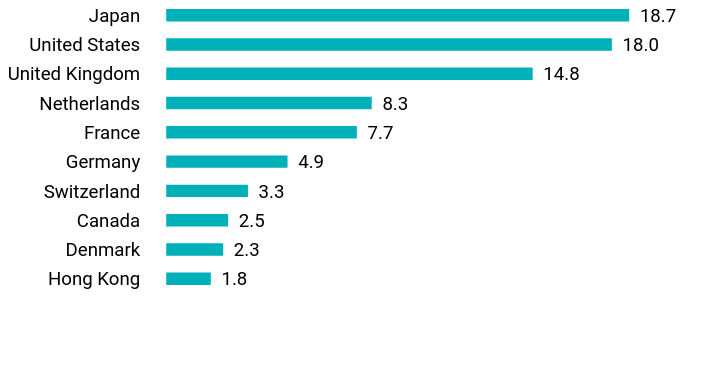
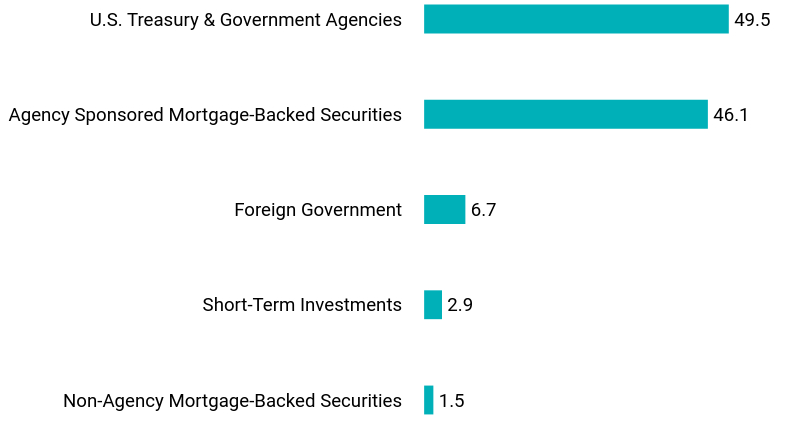
| Holdings [Text Block] |
Value |
Value |
U.S. Treasury & Government Agencies |
0.2 |
Agency Sponsored Mortgage-Backed Securities |
1.1 |
Non-Agency Mortgage-Backed Securities |
1.2 |
Asset-Backed Securities |
1.5 |
Short-Term Investments |
2.6 |
Corporate Bonds & Notes |
33.4 |
Foreign Government |
59.4 |
Value |
Value |
Brazil |
2.4 |
Turkey |
3.4 |
Colombia |
3.5 |
France |
4.0 |
Canada |
4.1 |
China |
4.4 |
United Kingdom |
5.6 |
Mexico |
5.7 |
United States |
6.7 |
Japan |
9.5 | |
|
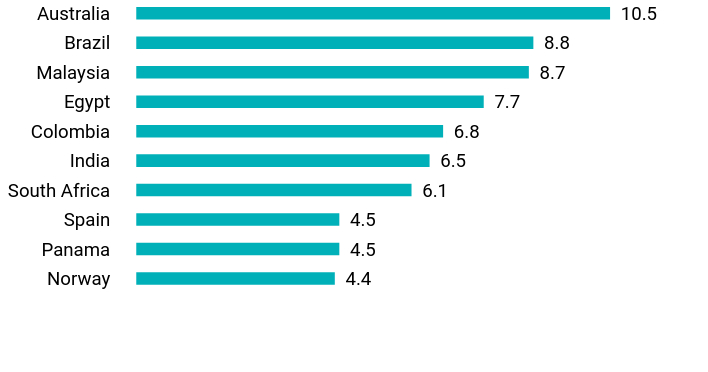
| Largest Holdings [Text Block] |
Top 10 Fixed Income Issuers
Japan Government Two Year Bonds |
3.9 |
Petroleos Mexicanos |
3.6 |
China Government Bonds |
3.4 |
U.K. Gilts |
2.9 |
Dominican Republic International Bonds |
2.3 |
Canada Government Bonds |
2.1 |
Japan Government Five Year Bonds |
1.9 |
Colombia Government International Bonds |
1.9 |
Italy Buoni Poliennali Del Tesoro |
1.9 |
Hungary Government International Bonds |
1.8 | |
|
| Material Fund Change [Text Block] |
|
|
| Updated Prospectus Phone Number |
1-888-243-1956
|
|
| Updated Prospectus Web Address |
<span style="box-sizing: border-box; color: rgb(0, 0, 0); display: inline; flex-wrap: nowrap; font-size: 10.6667px; font-weight: 400; grid-area: auto; line-height: 16px; margin: 0px; overflow: visible; text-align: justify; text-align-last: left; white-space-collapse: preserve-breaks;">https://dfinview.com/BHFT</span>
|
|
| C000210964 |
|
|
| Shareholder Report [Line Items] |
|
|
| Fund Name |
AB International Bond Portfolio
|
|
| Class Name |
Class B
|
|
| No Trading Symbol [Flag] |
true
|
|
| Annual or Semi-Annual Statement [Text Block] |
This semi-annual shareholder report contains important information about the AB International Bond Portfolio (the "Portfolio") for the period of January 1, 2025 to June 30, 2025.
|
|
| Shareholder Report Annual or Semi-Annual |
Semi-Annual Shareholder Report
|
|
| Additional Information [Text Block] |
You can find additional information about the Portfolio at https://dfinview.com/BHFT. You can also request this information by contacting us at 1-888-243-1956.
|
|
| Additional Information Phone Number |
1-888-243-1956
|
|
| Additional Information Website |
<span style="box-sizing: border-box; color: rgb(0, 0, 0); display: inline; flex-wrap: nowrap; font-size: 12px; font-weight: 400; grid-area: auto; line-height: 18px; margin: 0px; overflow: visible; text-align: left; text-align-last: auto; white-space-collapse: preserve-breaks;">https://dfinview.com/BHFT</span>
|
|
| Expenses [Text Block] |
What were the Portfolio costs for last six months?This example shows the expenses you would have paid over the reporting period based on a hypothetical $10,000 investment.
Class Name |
Costs of a $10,000 investment |
Costs paid as a percentage of a $10,000 investment |
Class B |
$44 |
0.87%Footnote Reference* |
| Footnote |
Description |
Footnote* |
Annualized. | |
|
| Expenses Paid, Amount |
$ 44
|
|
| Expense Ratio, Percent |
0.87%
|
[3] |
| AssetsNet |
$ 408,271,086
|
|
| Holdings Count | Holding |
654
|
|
| Advisory Fees Paid, Amount |
$ 1,126,930
|
|
| InvestmentCompanyPortfolioTurnover |
60.00%
|
|
| Additional Fund Statistics [Text Block] |
- Total Net Assets$408,271,086
- # of Portfolio Investments654
- Portfolio Turnover Rate60%
- Total Advisory Fees Paid$1,126,930
|
|
| Holdings [Text Block] |
Value |
Value |
U.S. Treasury & Government Agencies |
0.2 |
Agency Sponsored Mortgage-Backed Securities |
1.1 |
Non-Agency Mortgage-Backed Securities |
1.2 |
Asset-Backed Securities |
1.5 |
Short-Term Investments |
2.6 |
Corporate Bonds & Notes |
33.4 |
Foreign Government |
59.4 |
Value |
Value |
Brazil |
2.4 |
Turkey |
3.4 |
Colombia |
3.5 |
France |
4.0 |
Canada |
4.1 |
China |
4.4 |
United Kingdom |
5.6 |
Mexico |
5.7 |
United States |
6.7 |
Japan |
9.5 | |
|
| Largest Holdings [Text Block] |
Top 10 Fixed Income Issuers
Japan Government Two Year Bonds |
3.9 |
Petroleos Mexicanos |
3.6 |
China Government Bonds |
3.4 |
U.K. Gilts |
2.9 |
Dominican Republic International Bonds |
2.3 |
Canada Government Bonds |
2.1 |
Japan Government Five Year Bonds |
1.9 |
Colombia Government International Bonds |
1.9 |
Italy Buoni Poliennali Del Tesoro |
1.9 |
Hungary Government International Bonds |
1.8 | |
|
| Material Fund Change [Text Block] |
|
|
| Updated Prospectus Phone Number |
1-888-243-1956
|
|
| Updated Prospectus Web Address |
<span style="box-sizing: border-box; color: rgb(0, 0, 0); display: inline; flex-wrap: nowrap; font-size: 10.6667px; font-weight: 400; grid-area: auto; line-height: 16px; margin: 0px; overflow: visible; text-align: justify; text-align-last: left; white-space-collapse: preserve-breaks;">https://dfinview.com/BHFT</span>
|
|
| C000030705 |
|
|
| Shareholder Report [Line Items] |
|
|
| Fund Name |
Allspring Mid Cap Value Portfolio
|
|
| Class Name |
Class A
|
|
| No Trading Symbol [Flag] |
true
|
|
| Annual or Semi-Annual Statement [Text Block] |
This semi-annual shareholder report contains important information about the Allspring Mid Cap Value Portfolio (the "Portfolio") for the period of January 1, 2025 to June 30, 2025.
|
|
| Shareholder Report Annual or Semi-Annual |
Semi-Annual Shareholder Report
|
|
| Additional Information [Text Block] |
You can find additional information about the Portfolio at https://dfinview.com/BHFT. You can also request this information by contacting us at 1-888-243-1956.
|
|
| Additional Information Phone Number |
1-888-243-1956
|
|
| Additional Information Website |
<span style="box-sizing: border-box; color: rgb(0, 0, 0); display: inline; flex-wrap: nowrap; font-size: 12px; font-weight: 400; grid-area: auto; line-height: 18px; margin: 0px; overflow: visible; text-align: left; text-align-last: auto; white-space-collapse: preserve-breaks;">https://dfinview.com/BHFT</span>
|
|
| Expenses [Text Block] |
What were the Portfolio costs for last six months?This example shows the expenses you would have paid over the reporting period based on a hypothetical $10,000 investment.
Class Name |
Costs of a $10,000 investment |
Costs paid as a percentage of a $10,000 investment |
Class A |
$37 |
0.74%Footnote Reference* |
| Footnote |
Description |
Footnote* |
Annualized. | |
|
| Expenses Paid, Amount |
$ 37
|
|
| Expense Ratio, Percent |
0.74%
|
[4] |
| AssetsNet |
$ 308,017,770
|
|
| Holdings Count | Holding |
88
|
|
| Advisory Fees Paid, Amount |
$ 998,133
|
|
| InvestmentCompanyPortfolioTurnover |
19.00%
|
|
| Additional Fund Statistics [Text Block] |
- Total Net Assets$308,017,770
- # of Portfolio Investments88
- Portfolio Turnover Rate19%
- Total Advisory Fees Paid$998,133
|
|
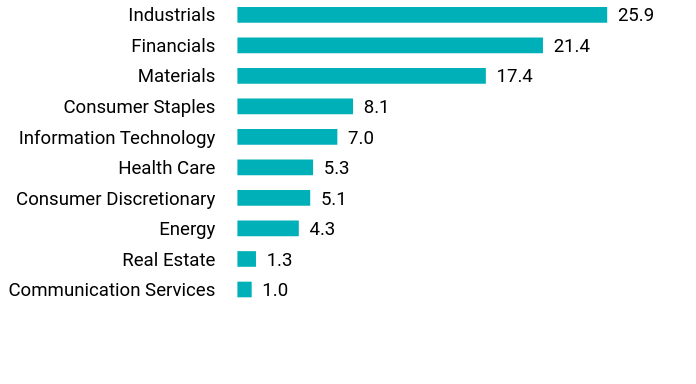
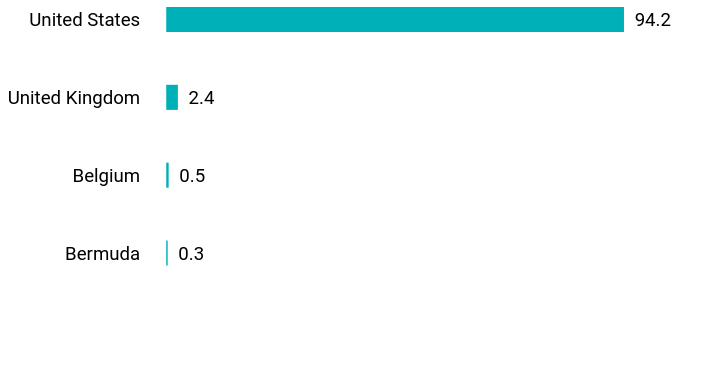
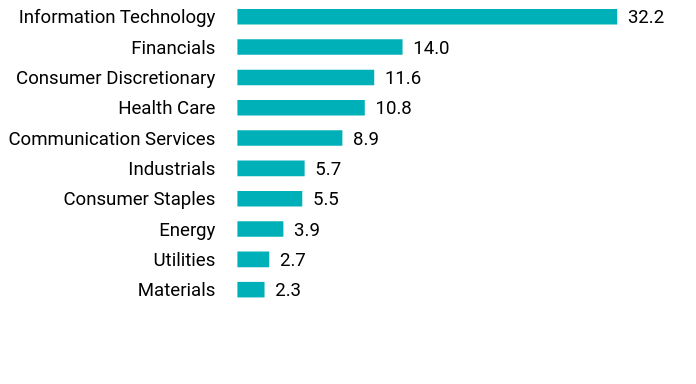
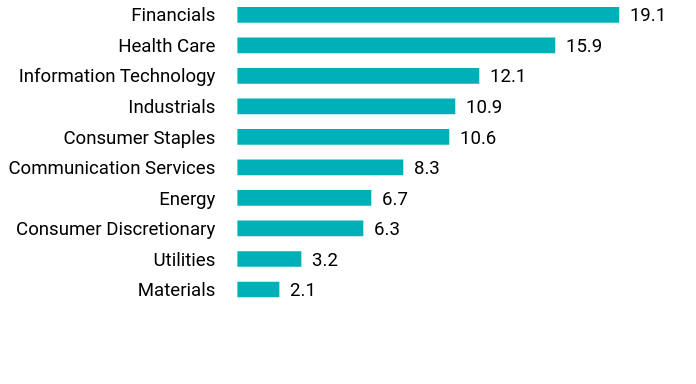
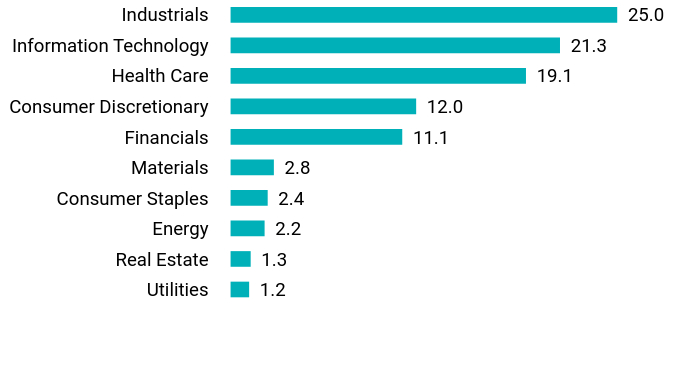
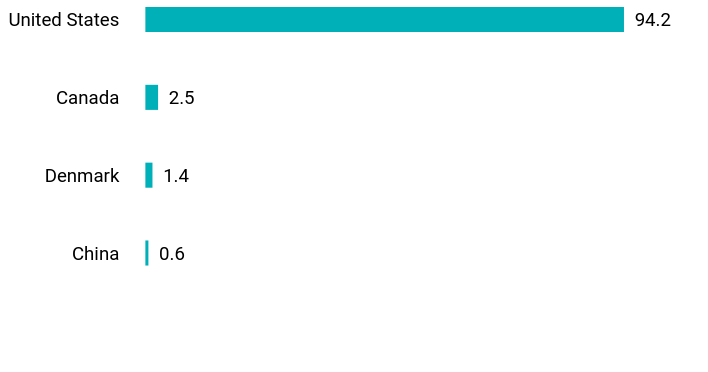
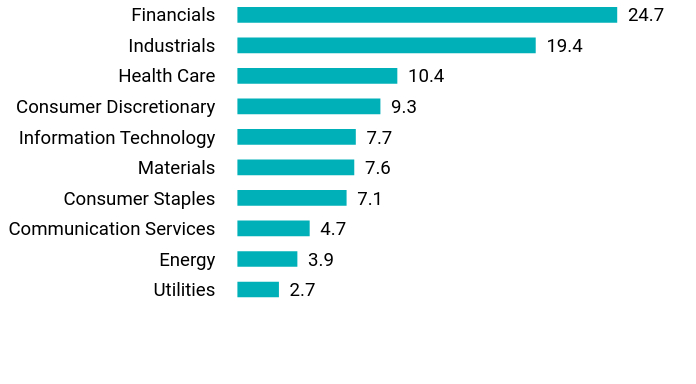
| Holdings [Text Block] |
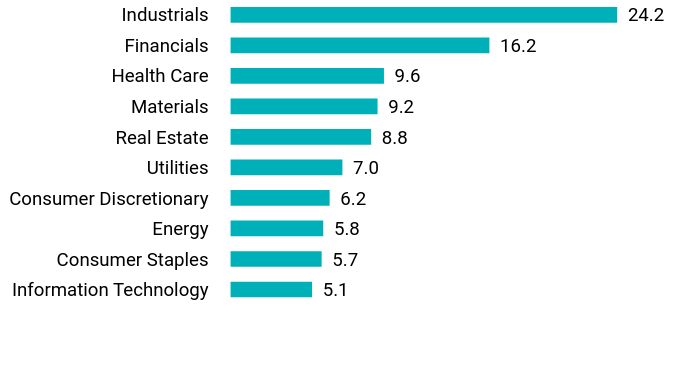
Value |
Value |
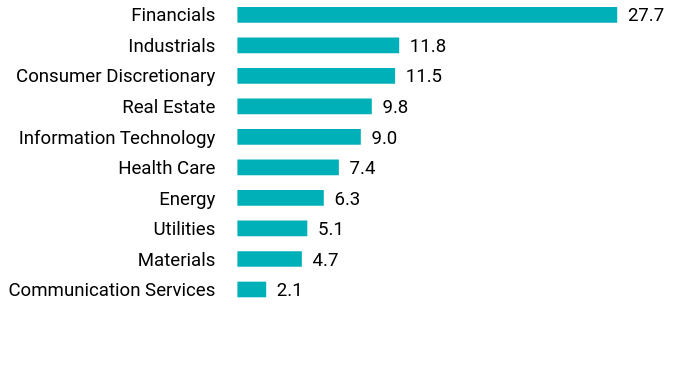
Information Technology |
5.1 |
Consumer Staples |
5.7 |
Energy |
5.8 |
Consumer Discretionary |
6.2 |
Utilities |
7.0 |
Real Estate |
8.8 |
Materials |
9.2 |
Health Care |
9.6 |
Financials |
16.2 |
Industrials |
24.2 |
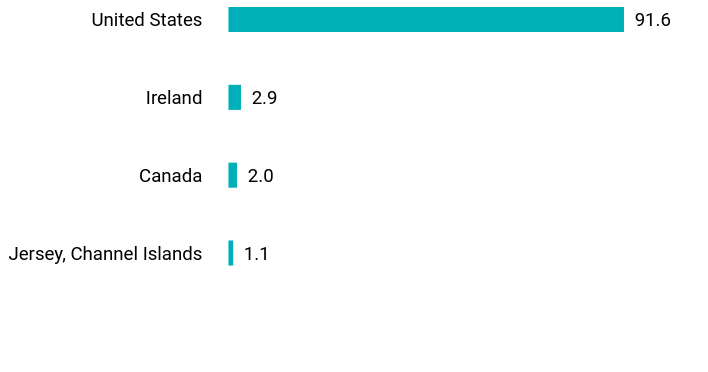
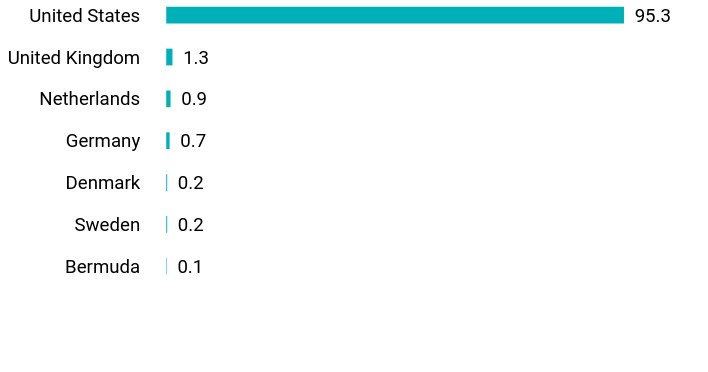
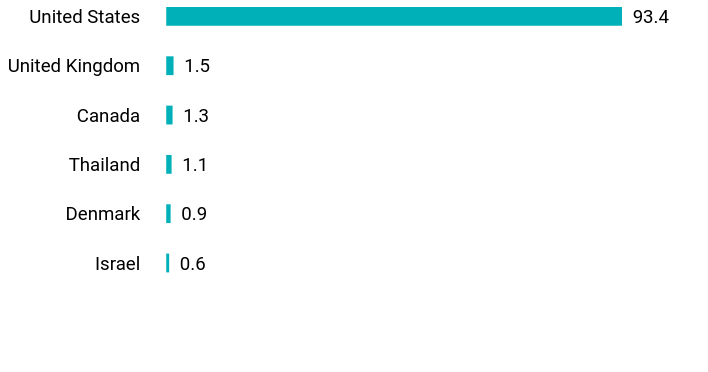
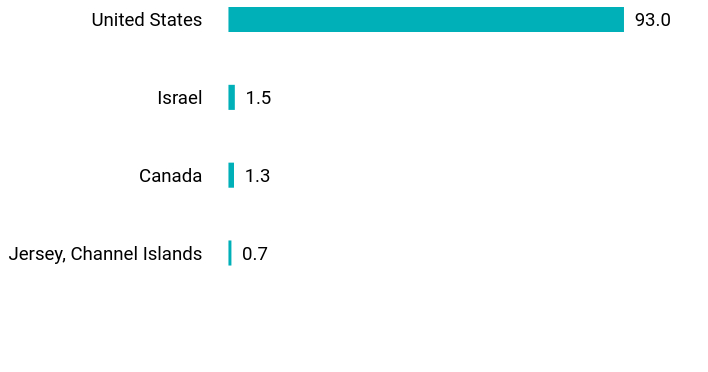
Value |
Value |
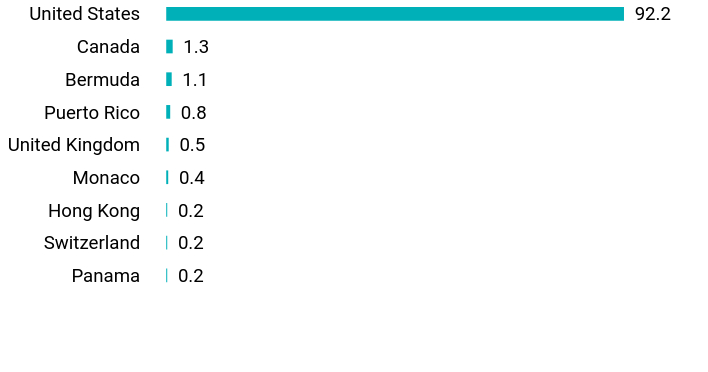
Jersey, Channel Islands |
1.1 |
Canada |
2.0 |
Ireland |
2.9 |
United States |
91.6 | |
|
| Largest Holdings [Text Block] |
Keurig Dr. Pepper, Inc. |
3.1 |
AerCap Holdings NV |
2.9 |
American Electric Power Co., Inc. |
2.9 |
CBRE Group, Inc. |
2.8 |
Labcorp Holdings, Inc. |
2.7 |
Carlisle Cos., Inc. |
2.6 |
Arch Capital Group Ltd. |
2.5 |
Vulcan Materials Co. |
2.4 |
Jefferies Financial Group, Inc. |
2.4 |
Brown & Brown, Inc. |
2.4 | |
|
| Material Fund Change [Text Block] |
|
|
| Updated Prospectus Phone Number |
1-888-243-1956
|
|
| Updated Prospectus Web Address |
<span style="box-sizing: border-box; color: rgb(0, 0, 0); display: inline; flex-wrap: nowrap; font-size: 10.6667px; font-weight: 400; grid-area: auto; line-height: 16px; margin: 0px; overflow: visible; text-align: justify; text-align-last: left; white-space-collapse: preserve-breaks;">https://dfinview.com/BHFT</span>
|
|
| C000030706 |
|
|
| Shareholder Report [Line Items] |
|
|
| Fund Name |
Allspring Mid Cap Value Portfolio
|
|
| Class Name |
Class B
|
|
| No Trading Symbol [Flag] |
true
|
|
| Annual or Semi-Annual Statement [Text Block] |
This semi-annual shareholder report contains important information about the Allspring Mid Cap Value Portfolio (the "Portfolio") for the period of January 1, 2025 to June 30, 2025.
|
|
| Shareholder Report Annual or Semi-Annual |
Semi-Annual Shareholder Report
|
|
| Additional Information [Text Block] |
You can find additional information about the Portfolio at https://dfinview.com/BHFT. You can also request this information by contacting us at 1-888-243-1956.
|
|
| Additional Information Phone Number |
1-888-243-1956
|
|
| Additional Information Website |
<span style="box-sizing: border-box; color: rgb(0, 0, 0); display: inline; flex-wrap: nowrap; font-size: 12px; font-weight: 400; grid-area: auto; line-height: 18px; margin: 0px; overflow: visible; text-align: left; text-align-last: auto; white-space-collapse: preserve-breaks;">https://dfinview.com/BHFT</span>
|
|
| Expenses [Text Block] |
What were the Portfolio costs for last six months?This example shows the expenses you would have paid over the reporting period based on a hypothetical $10,000 investment.
Class Name |
Costs of a $10,000 investment |
Costs paid as a percentage of a $10,000 investment |
Class B |
$49 |
0.99%Footnote Reference* |
| Footnote |
Description |
Footnote* |
Annualized. | |
|
| Expenses Paid, Amount |
$ 49
|
|
| Expense Ratio, Percent |
0.99%
|
[5] |
| AssetsNet |
$ 308,017,770
|
|
| Holdings Count | Holding |
88
|
|
| Advisory Fees Paid, Amount |
$ 998,133
|
|
| InvestmentCompanyPortfolioTurnover |
19.00%
|
|
| Additional Fund Statistics [Text Block] |
- Total Net Assets$308,017,770
- # of Portfolio Investments88
- Portfolio Turnover Rate19%
- Total Advisory Fees Paid$998,133
|
|
| Holdings [Text Block] |
Value |
Value |
Information Technology |
5.1 |
Consumer Staples |
5.7 |
Energy |
5.8 |
Consumer Discretionary |
6.2 |
Utilities |
7.0 |
Real Estate |
8.8 |
Materials |
9.2 |
Health Care |
9.6 |
Financials |
16.2 |
Industrials |
24.2 |
Value |
Value |
Jersey, Channel Islands |
1.1 |
Canada |
2.0 |
Ireland |
2.9 |
United States |
91.6 | |
|
| Largest Holdings [Text Block] |
Keurig Dr. Pepper, Inc. |
3.1 |
AerCap Holdings NV |
2.9 |
American Electric Power Co., Inc. |
2.9 |
CBRE Group, Inc. |
2.8 |
Labcorp Holdings, Inc. |
2.7 |
Carlisle Cos., Inc. |
2.6 |
Arch Capital Group Ltd. |
2.5 |
Vulcan Materials Co. |
2.4 |
Jefferies Financial Group, Inc. |
2.4 |
Brown & Brown, Inc. |
2.4 | |
|
| Material Fund Change [Text Block] |
|
|
| Updated Prospectus Phone Number |
1-888-243-1956
|
|
| Updated Prospectus Web Address |
<span style="box-sizing: border-box; color: rgb(0, 0, 0); display: inline; flex-wrap: nowrap; font-size: 10.6667px; font-weight: 400; grid-area: auto; line-height: 16px; margin: 0px; overflow: visible; text-align: justify; text-align-last: left; white-space-collapse: preserve-breaks;">https://dfinview.com/BHFT</span>
|
|
| C000063063 |
|
|
| Shareholder Report [Line Items] |
|
|
| Fund Name |
American Funds<sup style="box-sizing: border-box; color: rgb(0, 0, 0); display: inline; flex-wrap: nowrap; font-size: 12px; font-weight: 700; grid-area: auto; line-height: 0px; margin: 0px; overflow: visible; position: relative; text-align: left; text-align-last: auto; white-space-collapse: preserve-breaks;">®</sup> Aggressive Allocation Portfolio
|
|
| Class Name |
Class B
|
|
| No Trading Symbol [Flag] |
true
|
|
| Annual or Semi-Annual Statement [Text Block] |
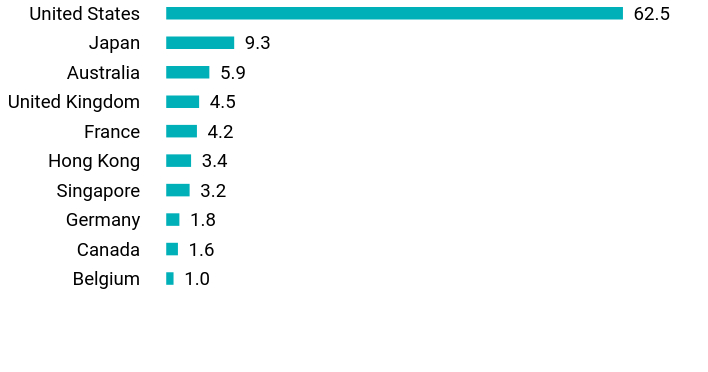
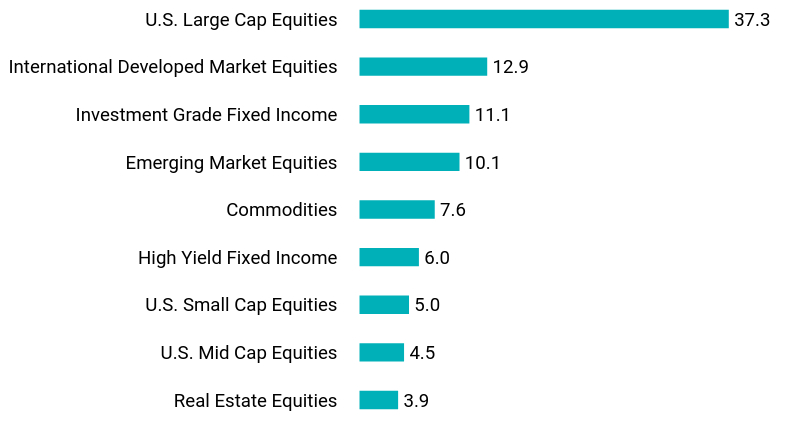
This semi-annual shareholder report contains important information about the American Funds® Aggressive Allocation Portfolio (formerly, American Funds® Growth Allocation Portfolio) (the "Portfolio") for the period of January 1, 2025 to June 30, 2025.
|
|
| Shareholder Report Annual or Semi-Annual |
Semi-Annual Shareholder Report
|
|
| Additional Information [Text Block] |
You can find additional information about the Portfolio at https://dfinview.com/BHFT. You can also request this information by contacting us at 1-888-243-1956.
|
|
| Additional Information Phone Number |
1-888-243-1956
|
|
| Additional Information Website |
<span style="box-sizing: border-box; color: rgb(0, 0, 0); display: inline; flex-wrap: nowrap; font-size: 12px; font-weight: 400; grid-area: auto; line-height: 18px; margin: 0px; overflow: visible; text-align: left; text-align-last: auto; white-space-collapse: preserve-breaks;">https://dfinview.com/BHFT</span>
|
|
| Expenses [Text Block] |
What were the Portfolio costs for last six months?This example shows the expenses you would have paid over the reporting period based on a hypothetical $10,000 investment.
Class Name |
Costs of a $10,000 investment |
Costs paid as a percentage of a $10,000 investment |
Class B |
$17 |
0.32%Footnote Reference* |
| Footnote |
Description |
Footnote* |
Annualized. | |
|
| Expenses Paid, Amount |
$ 17
|
|
| Expense Ratio, Percent |
0.32%
|
[6] |
| AssetsNet |
$ 2,936,659,206
|
|
| Holdings Count | Holding |
14
|
|
| Advisory Fees Paid, Amount |
$ 881,193
|
|
| InvestmentCompanyPortfolioTurnover |
6.00%
|
|
| Additional Fund Statistics [Text Block] |
- Total Net Assets$2,936,659,206
- # of Portfolio Investments14
- Portfolio Turnover Rate6%
- Total Advisory Fees Paid$881,193
|
|
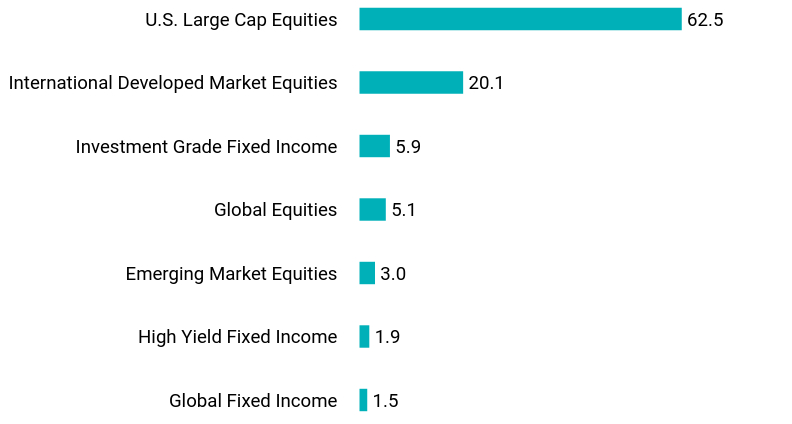
| Holdings [Text Block] |
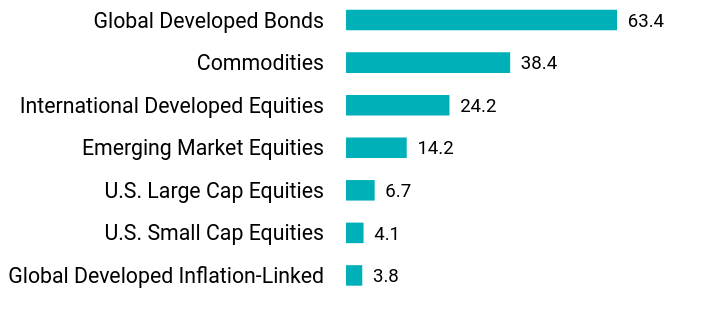
Value |
Value |
Global Fixed Income |
1.5 |
High Yield Fixed Income |
1.9 |
Emerging Market Equities |
3.0 |
Global Equities |
5.1 |
Investment Grade Fixed Income |
5.9 |
International Developed Market Equities |
20.1 |
U.S. Large Cap Equities |
62.5 | |
|
| Largest Holdings [Text Block] |
American Funds AMCAP Fund, Class R-6 |
11.6 |
American Funds Fundamental Investors Fund, Class R-6 |
11.1 |
American Funds International Growth & Income Fund, Class R-6 |
11.0 |
American Funds Growth Fund, Class 1 |
10.6 |
American Funds Growth-Income Fund, Class 1 |
10.1 |
American Funds Washington Mutual Investors Fund, Class 1 |
10.1 |
American Funds International Fund, Class 1 |
9.1 |
American Funds American Mutual Fund, Class R-6 |
9.0 |
American Funds Smallcap World Fund, Inc., Class R6 |
5.1 |
American Funds The Bond Fund of America, Class 1 |
4.5 | |
|
| Updated Prospectus Phone Number |
1-888-243-1956
|
|
| Updated Prospectus Web Address |
<span style="box-sizing: border-box; color: rgb(0, 0, 0); display: inline; flex-wrap: nowrap; font-size: 10.6667px; font-weight: 400; grid-area: auto; line-height: 16px; margin: 0px; overflow: visible; text-align: justify; text-align-last: left; white-space-collapse: preserve-breaks;">https://dfinview.com/BHFT</span>
|
|
| C000063064 |
|
|
| Shareholder Report [Line Items] |
|
|
| Fund Name |
American Funds<sup style="box-sizing: border-box; color: rgb(0, 0, 0); display: inline; flex-wrap: nowrap; font-size: 12px; font-weight: 700; grid-area: auto; line-height: 0px; margin: 0px; overflow: visible; position: relative; text-align: left; text-align-last: auto; white-space-collapse: preserve-breaks;">®</sup> Aggressive Allocation Portfolio
|
|
| Class Name |
Class C
|
|
| No Trading Symbol [Flag] |
true
|
|
| Annual or Semi-Annual Statement [Text Block] |
This semi-annual shareholder report contains important information about the American Funds® Aggressive Allocation Portfolio (formerly, American Funds® Growth Allocation Portfolio) (the "Portfolio") for the period of January 1, 2025 to June 30, 2025.
|
|
| Shareholder Report Annual or Semi-Annual |
Semi-Annual Shareholder Report
|
|
| Additional Information [Text Block] |
You can find additional information about the Portfolio at https://dfinview.com/BHFT. You can also request this information by contacting us at 1-888-243-1956.
|
|
| Additional Information Phone Number |
1-888-243-1956
|
|
| Additional Information Website |
<span style="box-sizing: border-box; color: rgb(0, 0, 0); display: inline; flex-wrap: nowrap; font-size: 12px; font-weight: 400; grid-area: auto; line-height: 18px; margin: 0px; overflow: visible; text-align: left; text-align-last: auto; white-space-collapse: preserve-breaks;">https://dfinview.com/BHFT</span>
|
|
| Expenses [Text Block] |
What were the Portfolio costs for last six months?This example shows the expenses you would have paid over the reporting period based on a hypothetical $10,000 investment.
Class Name |
Costs of a $10,000 investment |
Costs paid as a percentage of a $10,000 investment |
Class C |
$32 |
0.62%Footnote Reference* |
| Footnote |
Description |
Footnote* |
Annualized. | |
|
| Expenses Paid, Amount |
$ 32
|
|
| Expense Ratio, Percent |
0.62%
|
[7] |
| AssetsNet |
$ 2,936,659,206
|
|
| Holdings Count | Holding |
14
|
|
| Advisory Fees Paid, Amount |
$ 881,193
|
|
| InvestmentCompanyPortfolioTurnover |
6.00%
|
|
| Additional Fund Statistics [Text Block] |
- Total Net Assets$2,936,659,206
- # of Portfolio Investments14
- Portfolio Turnover Rate6%
- Total Advisory Fees Paid$881,193
|
|
| Holdings [Text Block] |
Value |
Value |
Global Fixed Income |
1.5 |
High Yield Fixed Income |
1.9 |
Emerging Market Equities |
3.0 |
Global Equities |
5.1 |
Investment Grade Fixed Income |
5.9 |
International Developed Market Equities |
20.1 |
U.S. Large Cap Equities |
62.5 | |
|
| Largest Holdings [Text Block] |
American Funds AMCAP Fund, Class R-6 |
11.6 |
American Funds Fundamental Investors Fund, Class R-6 |
11.1 |
American Funds International Growth & Income Fund, Class R-6 |
11.0 |
American Funds Growth Fund, Class 1 |
10.6 |
American Funds Growth-Income Fund, Class 1 |
10.1 |
American Funds Washington Mutual Investors Fund, Class 1 |
10.1 |
American Funds International Fund, Class 1 |
9.1 |
American Funds American Mutual Fund, Class R-6 |
9.0 |
American Funds Smallcap World Fund, Inc., Class R6 |
5.1 |
American Funds The Bond Fund of America, Class 1 |
4.5 | |
|
| Updated Prospectus Phone Number |
1-888-243-1956
|
|
| Updated Prospectus Web Address |
<span style="box-sizing: border-box; color: rgb(0, 0, 0); display: inline; flex-wrap: nowrap; font-size: 10.6667px; font-weight: 400; grid-area: auto; line-height: 16px; margin: 0px; overflow: visible; text-align: justify; text-align-last: left; white-space-collapse: preserve-breaks;">https://dfinview.com/BHFT</span>
|
|
| C000063060 |
|
|
| Shareholder Report [Line Items] |
|
|
| Fund Name |
American Funds<sup style="box-sizing: border-box; color: rgb(0, 0, 0); display: inline; flex-wrap: nowrap; font-size: 12px; font-weight: 700; grid-area: auto; line-height: 0px; margin: 0px; overflow: visible; position: relative; text-align: left; text-align-last: auto; white-space-collapse: preserve-breaks;">®</sup> Balanced Allocation Portfolio
|
|
| Class Name |
Class B
|
|
| No Trading Symbol [Flag] |
true
|
|
| Annual or Semi-Annual Statement [Text Block] |
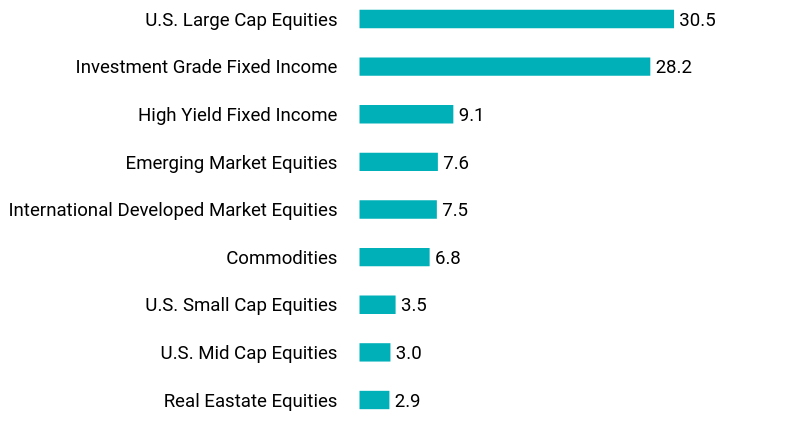
This semi-annual shareholder report contains important information about the American Funds® Balanced Allocation Portfolio (the "Portfolio") for the period of January 1, 2025 to June 30, 2025.
|
|
| Shareholder Report Annual or Semi-Annual |
Semi-Annual Shareholder Report
|
|
| Additional Information [Text Block] |
You can find additional information about the Portfolio at https://dfinview.com/BHFT. You can also request this information by contacting us at 1-888-243-1956.
|
|
| Additional Information Phone Number |
1-888-243-1956
|
|
| Additional Information Website |
<span style="box-sizing: border-box; color: rgb(0, 0, 0); display: inline; flex-wrap: nowrap; font-size: 12px; font-weight: 400; grid-area: auto; line-height: 18px; margin: 0px; overflow: visible; text-align: left; text-align-last: auto; white-space-collapse: preserve-breaks;">https://dfinview.com/BHFT</span>
|
|
| Expenses [Text Block] |
What were the Portfolio costs for last six months?This example shows the expenses you would have paid over the reporting period based on a hypothetical $10,000 investment.
Class Name |
Costs of a $10,000 investment |
Costs paid as a percentage of a $10,000 investment |
Class B |
$17 |
0.32%Footnote Reference* |
| Footnote |
Description |
Footnote* |
Annualized. | |
|
| Expenses Paid, Amount |
$ 17
|
|
| Expense Ratio, Percent |
0.32%
|
[8] |
| AssetsNet |
$ 4,048,959,117
|
|
| Holdings Count | Holding |
14
|
|
| Advisory Fees Paid, Amount |
$ 1,160,181
|
|
| InvestmentCompanyPortfolioTurnover |
5.00%
|
|
| Additional Fund Statistics [Text Block] |
- Total Net Assets$4,048,959,117
- # of Portfolio Investments14
- Portfolio Turnover Rate5%
- Total Advisory Fees Paid$1,160,181
|
|
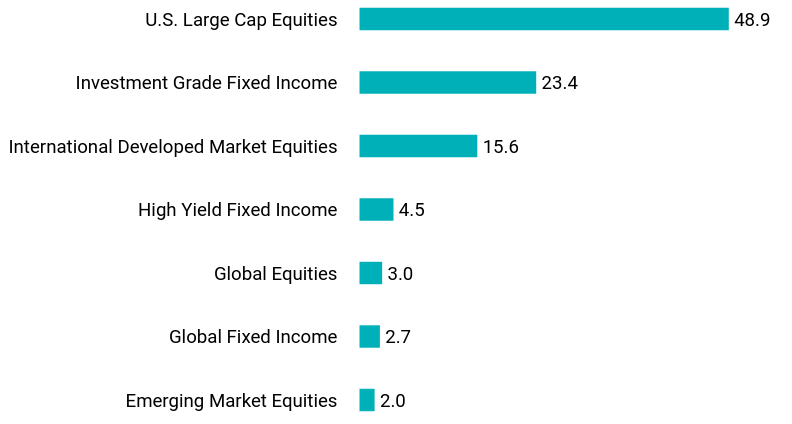
| Holdings [Text Block] |
Value |
Value |
Emerging Market Equities |
2.0 |
Global Fixed Income |
2.7 |
Global Equities |
3.0 |
High Yield Fixed Income |
4.5 |
International Developed Market Equities |
15.6 |
Investment Grade Fixed Income |
23.4 |
U.S. Large Cap Equities |
48.9 | |
|
| Largest Holdings [Text Block] |
American Funds The Bond Fund of America, Class 1 |
13.1 |
American Funds U.S. Government Securities Fund, Class R-6 |
10.3 |
American Funds Growth-Income Fund, Class 1 |
9.1 |
American Funds International Growth & Income Fund, Class R-6 |
8.7 |
American Funds Growth Fund, Class 1 |
8.6 |
American Funds Fundamental Investors Fund, Class R-6 |
8.1 |
American Funds AMCAP Fund, Class R-6 |
8.1 |
American Funds Washington Mutual Investors Fund, Class 1 |
8.0 |
American Funds American Mutual Fund, Class R-6 |
7.0 |
American Funds International Fund, Class 1 |
6.8 | |
|
| Updated Prospectus Phone Number |
1-888-243-1956
|
|
| Updated Prospectus Web Address |
<span style="box-sizing: border-box; color: rgb(0, 0, 0); display: inline; flex-wrap: nowrap; font-size: 10.6667px; font-weight: 400; grid-area: auto; line-height: 16px; margin: 0px; overflow: visible; text-align: justify; text-align-last: left; white-space-collapse: preserve-breaks;">https://dfinview.com/BHFT</span>
|
|
| C000063061 |
|
|
| Shareholder Report [Line Items] |
|
|
| Fund Name |
American Funds<sup style="box-sizing: border-box; color: rgb(0, 0, 0); display: inline; flex-wrap: nowrap; font-size: 12px; font-weight: 700; grid-area: auto; line-height: 0px; margin: 0px; overflow: visible; position: relative; text-align: left; text-align-last: auto; white-space-collapse: preserve-breaks;">®</sup> Balanced Allocation Portfolio
|
|
| Class Name |
Class C
|
|
| No Trading Symbol [Flag] |
true
|
|
| Annual or Semi-Annual Statement [Text Block] |
This semi-annual shareholder report contains important information about the American Funds® Balanced Allocation Portfolio (the "Portfolio") for the period of January 1, 2025 to June 30, 2025.
|
|
| Shareholder Report Annual or Semi-Annual |
Semi-Annual Shareholder Report
|
|
| Additional Information [Text Block] |
You can find additional information about the Portfolio at https://dfinview.com/BHFT. You can also request this information by contacting us at 1-888-243-1956.
|
|
| Additional Information Phone Number |
1-888-243-1956
|
|
| Additional Information Website |
<span style="box-sizing: border-box; color: rgb(0, 0, 0); display: inline; flex-wrap: nowrap; font-size: 12px; font-weight: 400; grid-area: auto; line-height: 18px; margin: 0px; overflow: visible; text-align: left; text-align-last: auto; white-space-collapse: preserve-breaks;">https://dfinview.com/BHFT</span>
|
|
| Expenses [Text Block] |
What were the Portfolio costs for last six months?This example shows the expenses you would have paid over the reporting period based on a hypothetical $10,000 investment.
Class Name |
Costs of a $10,000 investment |
Costs paid as a percentage of a $10,000 investment |
Class C |
$32 |
0.62%Footnote Reference* |
| Footnote |
Description |
Footnote* |
Annualized. | |
|
| Expenses Paid, Amount |
$ 32
|
|
| Expense Ratio, Percent |
0.62%
|
[9] |
| AssetsNet |
$ 4,048,959,117
|
|
| Holdings Count | Holding |
14
|
|
| Advisory Fees Paid, Amount |
$ 1,160,181
|
|
| InvestmentCompanyPortfolioTurnover |
5.00%
|
|
| Additional Fund Statistics [Text Block] |
- Total Net Assets$4,048,959,117
- # of Portfolio Investments14
- Portfolio Turnover Rate5%
- Total Advisory Fees Paid$1,160,181
|
|
| Holdings [Text Block] |
Value |
Value |
Emerging Market Equities |
2.0 |
Global Fixed Income |
2.7 |
Global Equities |
3.0 |
High Yield Fixed Income |
4.5 |
International Developed Market Equities |
15.6 |
Investment Grade Fixed Income |
23.4 |
U.S. Large Cap Equities |
48.9 | |
|
| Largest Holdings [Text Block] |
American Funds The Bond Fund of America, Class 1 |
13.1 |
American Funds U.S. Government Securities Fund, Class R-6 |
10.3 |
American Funds Growth-Income Fund, Class 1 |
9.1 |
American Funds International Growth & Income Fund, Class R-6 |
8.7 |
American Funds Growth Fund, Class 1 |
8.6 |
American Funds Fundamental Investors Fund, Class R-6 |
8.1 |
American Funds AMCAP Fund, Class R-6 |
8.1 |
American Funds Washington Mutual Investors Fund, Class 1 |
8.0 |
American Funds American Mutual Fund, Class R-6 |
7.0 |
American Funds International Fund, Class 1 |
6.8 | |
|
| Updated Prospectus Phone Number |
1-888-243-1956
|
|
| Updated Prospectus Web Address |
<span style="box-sizing: border-box; color: rgb(0, 0, 0); display: inline; flex-wrap: nowrap; font-size: 10.6667px; font-weight: 400; grid-area: auto; line-height: 16px; margin: 0px; overflow: visible; text-align: justify; text-align-last: left; white-space-collapse: preserve-breaks;">https://dfinview.com/BHFT</span>
|
|
| C000030657 |
|
|
| Shareholder Report [Line Items] |
|
|
| Fund Name |
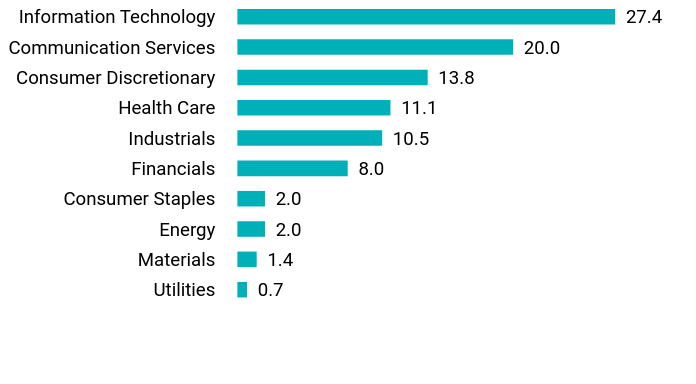
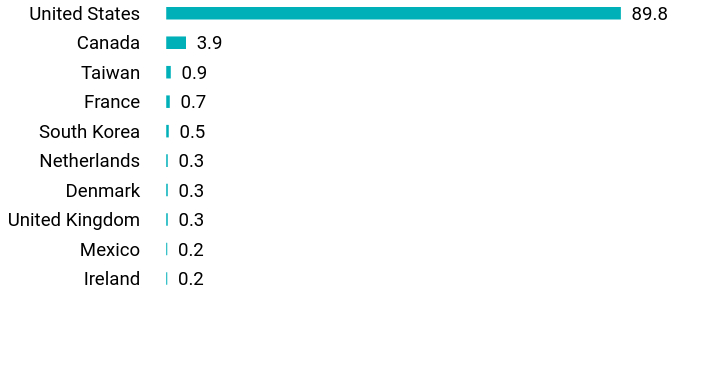
American Funds<sup style="box-sizing: border-box; color: rgb(0, 0, 0); display: inline; flex-wrap: nowrap; font-size: 12px; font-weight: 700; grid-area: auto; line-height: 0px; margin: 0px; overflow: visible; position: relative; text-align: left; text-align-last: auto; white-space-collapse: preserve-breaks;">®</sup> Growth Portfolio
|
|
| Class Name |
Class C
|
|
| No Trading Symbol [Flag] |
true
|
|
| Annual or Semi-Annual Statement [Text Block] |
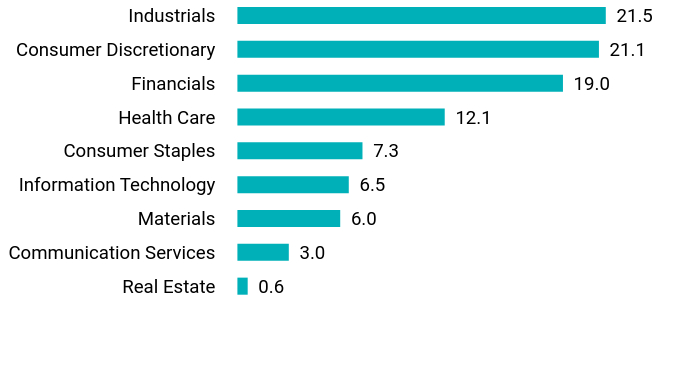
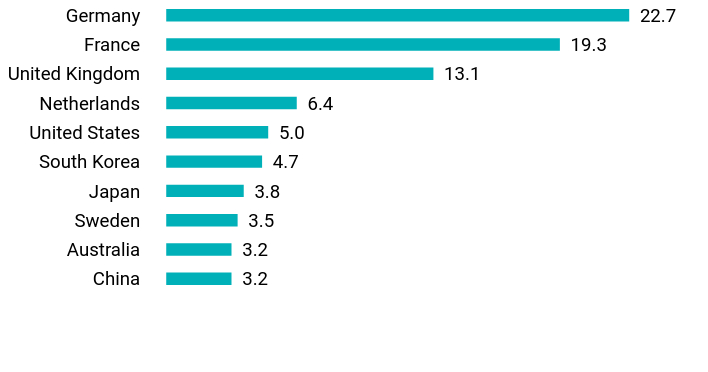
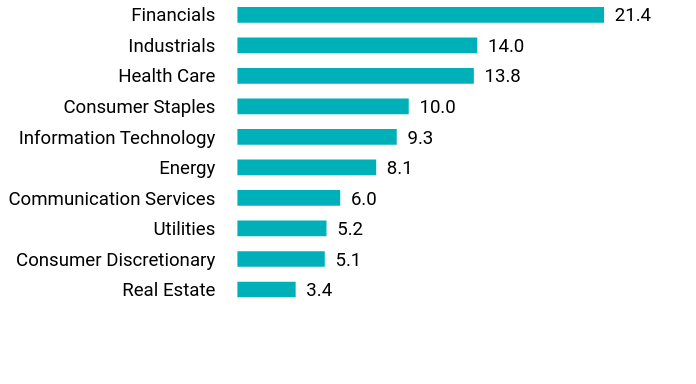
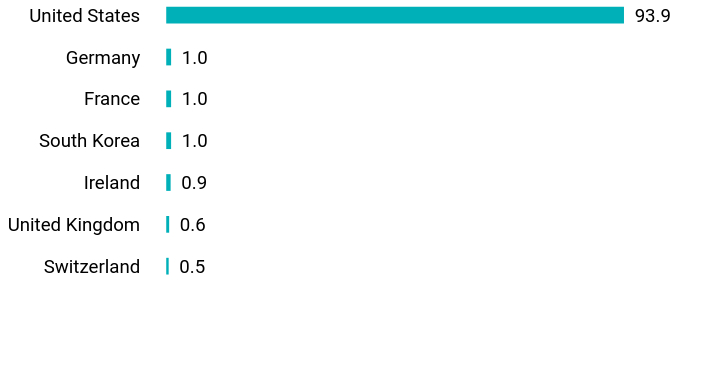
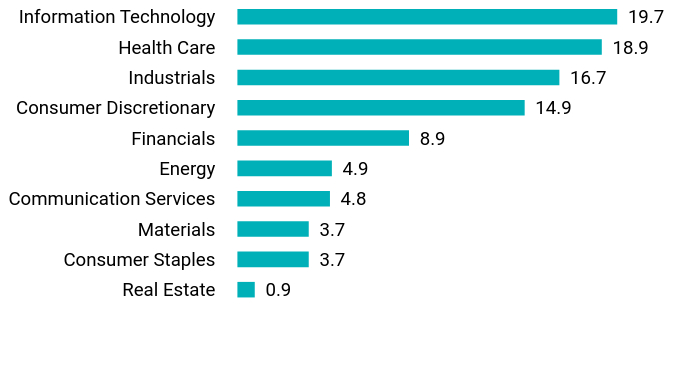
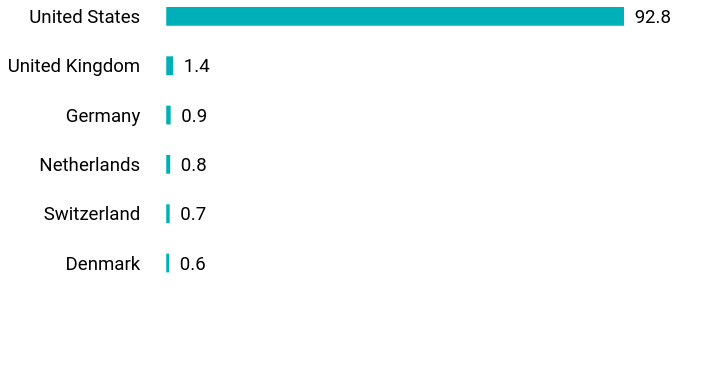
This semi-annual shareholder report contains important information about the American Funds® Growth Portfolio (the "Portfolio") for the period of January 1, 2025 to June 30, 2025.
|
|
| Shareholder Report Annual or Semi-Annual |
Semi-Annual Shareholder Report
|
|
| Additional Information [Text Block] |
You can find additional information about the Portfolio at https://dfinview.com/BHFT. You can also request this information by contacting us at 1-888-243-1956.
|
|
| Additional Information Phone Number |
1-888-243-1956
|
|
| Additional Information Website |
<span style="box-sizing: border-box; color: rgb(0, 0, 0); display: inline; flex-wrap: nowrap; font-size: 12px; font-weight: 400; grid-area: auto; line-height: 18px; margin: 0px; overflow: visible; text-align: left; text-align-last: auto; white-space-collapse: preserve-breaks;">https://dfinview.com/BHFT</span>
|
|
| Expenses [Text Block] |
What were the Portfolio costs for last six months?This example shows the expenses you would have paid over the reporting period based on a hypothetical $10,000 investment. The expense table below reflects the expenses of both the American Funds Growth Portfolio (the "Feeder Fund") and the Master Fund.
Class Name |
Costs of a $10,000 investment |
Costs paid as a percentage of a $10,000 investment |
Class C |
$47 |
0.90%Footnote Reference* |
| Footnote |
Description |
Footnote* |
Annualized. | |
|
| Expenses Paid, Amount |
$ 47
|
|
| Expense Ratio, Percent |
0.90%
|
[10] |
| AssetsNet |
$ 1,974,405,348
|
|
| Holdings Count | Holding |
1
|
|
| Advisory Fees Paid, Amount |
$ 0
|
|
| InvestmentCompanyPortfolioTurnover |
6.00%
|
|
| Additional Fund Statistics [Text Block] |
- Total Net Assets$1,974,405,348
- # of Portfolio Investments1
- Portfolio Turnover Rate6%
- Total Advisory Fees Paid$0
|
|
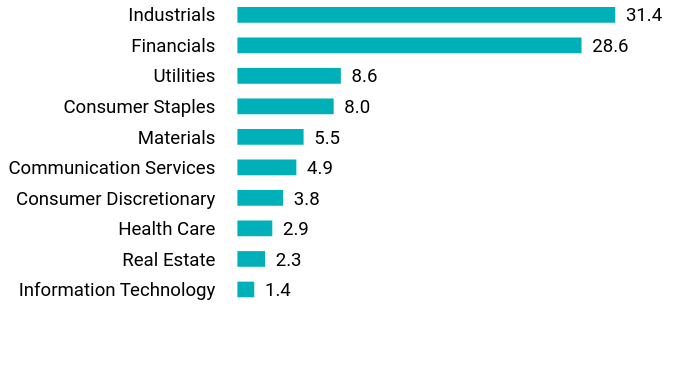
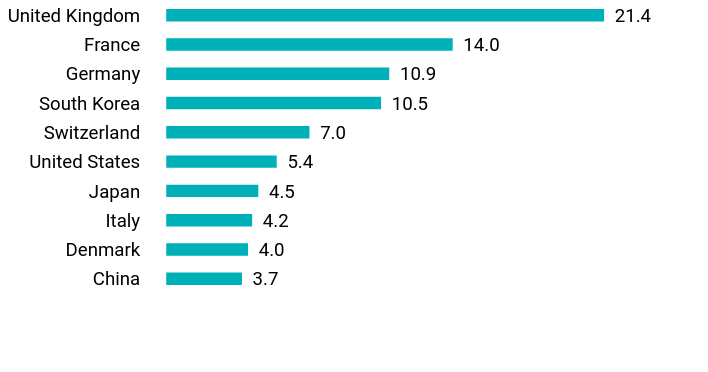
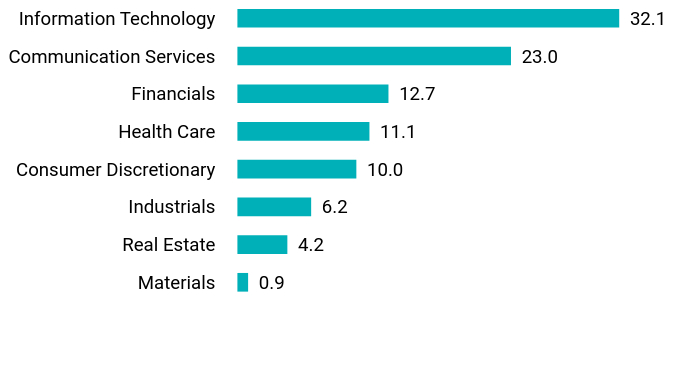
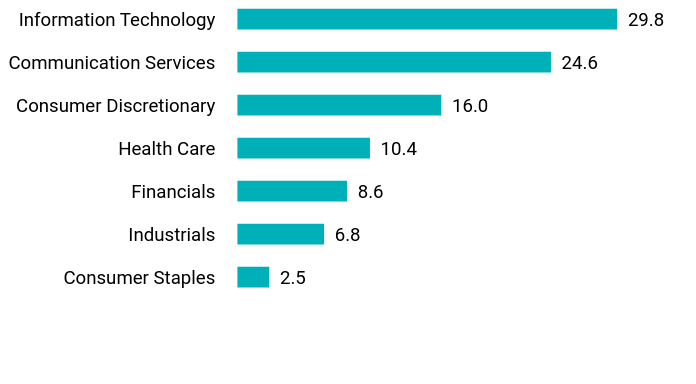
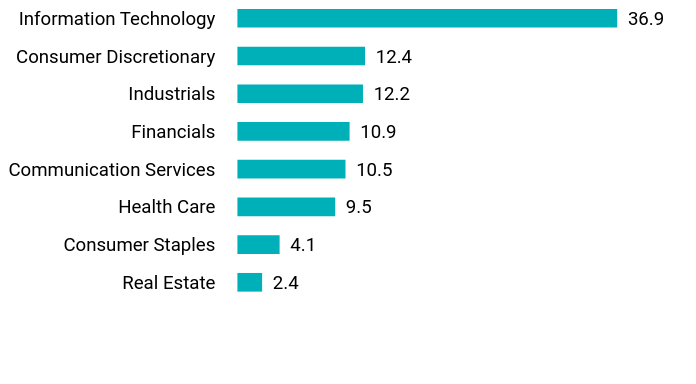
| Holdings [Text Block] |
Value |
Value |
Utilities |
0.7 |
Materials |
1.4 |
Energy |
2.0 |
Consumer Staples |
2.0 |
Financials |
8.0 |
Industrials |
10.5 |
Health Care |
11.1 |
Consumer Discretionary |
13.8 |
Communication Services |
20.0 |
Information Technology |
27.4 |
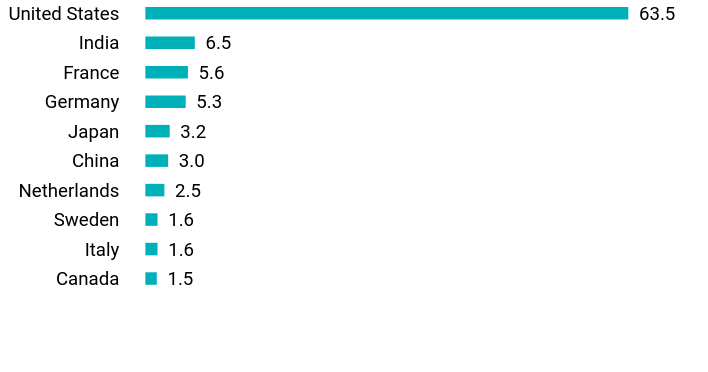
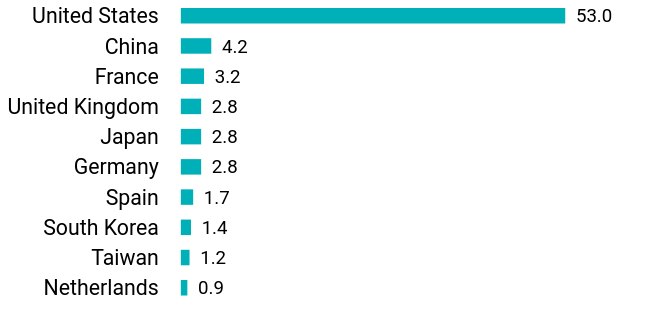
Value |
Value |
Ireland |
0.2 |
Mexico |
0.2 |
United Kingdom |
0.3 |
Denmark |
0.3 |
Netherlands |
0.3 |
South Korea |
0.5 |
France |
0.7 |
Taiwan |
0.9 |
Canada |
3.9 |
United States |
89.8 | |
|
| Largest Holdings [Text Block] |
Meta Platforms, Inc. |
9.3 |
NVIDIA Corp. |
5.1 |
Microsoft Corp. |
4.7 |
Tesla, Inc. |
4.7 |
Netflix, Inc. |
4.4 |
Broadcom, Inc. |
4.2 |
Alphabet, Inc. |
4.0 |
Amazon.com, Inc. |
2.4 |
TransDigm Group, Inc. |
2.1 |
Intuitive Surgical, Inc. |
2.1 | |
|
| Material Fund Change [Text Block] |
|
|
| Updated Prospectus Phone Number |
1-888-243-1956
|
|
| Updated Prospectus Web Address |
<span style="box-sizing: border-box; color: rgb(0, 0, 0); display: inline; flex-wrap: nowrap; font-size: 10.6667px; font-weight: 400; grid-area: auto; line-height: 16px; margin: 0px; overflow: visible; text-align: justify; text-align-last: left; white-space-collapse: preserve-breaks;">https://dfinview.com/BHFT</span>
|
|
| C000063057 |
|
|
| Shareholder Report [Line Items] |
|
|
| Fund Name |
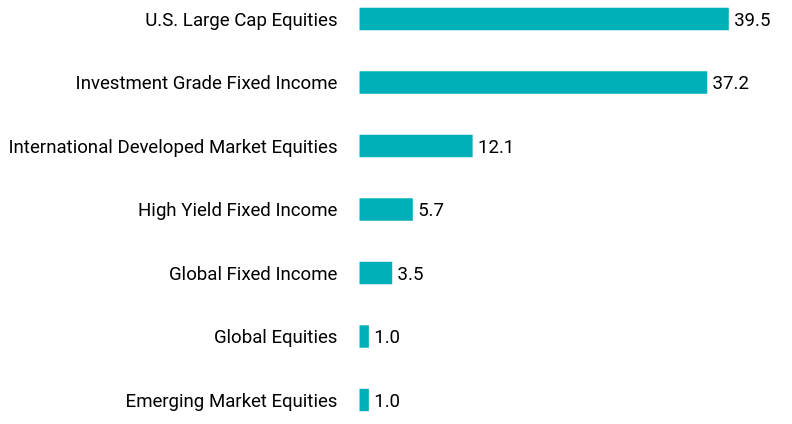
American Funds<sup style="box-sizing: border-box; color: rgb(0, 0, 0); display: inline; flex-wrap: nowrap; font-size: 12px; font-weight: 700; grid-area: auto; line-height: 0px; margin: 0px; overflow: visible; position: relative; text-align: left; text-align-last: auto; white-space-collapse: preserve-breaks;">®</sup> Moderate Allocation Portfolio
|
|
| Class Name |
Class B
|
|
| No Trading Symbol [Flag] |
true
|
|
| Annual or Semi-Annual Statement [Text Block] |
This semi-annual shareholder report contains important information about the American Funds® Moderate Allocation Portfolio (the "Portfolio") for the period of January 1, 2025 to June 30, 2025.
|
|
| Shareholder Report Annual or Semi-Annual |
Semi-Annual Shareholder Report
|
|
| Additional Information [Text Block] |
You can find additional information about the Portfolio at https://dfinview.com/BHFT. You can also request this information by contacting us at 1-888-243-1956.
|
|
| Additional Information Phone Number |
1-888-243-1956
|
|
| Additional Information Website |
<span style="box-sizing: border-box; color: rgb(0, 0, 0); display: inline; flex-wrap: nowrap; font-size: 12px; font-weight: 400; grid-area: auto; line-height: 18px; margin: 0px; overflow: visible; text-align: left; text-align-last: auto; white-space-collapse: preserve-breaks;">https://dfinview.com/BHFT</span>
|
|
| Expenses [Text Block] |
What were the Portfolio costs for last six months?This example shows the expenses you would have paid over the reporting period based on a hypothetical $10,000 investment.
Class Name |
Costs of a $10,000 investment |
Costs paid as a percentage of a $10,000 investment |
Class B |
$17 |
0.33%Footnote Reference* |
| Footnote |
Description |
Footnote* |
Annualized. | |
|
| Expenses Paid, Amount |
$ 17
|
|
| Expense Ratio, Percent |
0.33%
|
[11] |
| AssetsNet |
$ 1,946,674,353
|
|
| Holdings Count | Holding |
14
|
|
| Advisory Fees Paid, Amount |
$ 658,793
|
|
| InvestmentCompanyPortfolioTurnover |
4.00%
|
|
| Additional Fund Statistics [Text Block] |
- Total Net Assets$1,946,674,353
- # of Portfolio Investments14
- Portfolio Turnover Rate4%
- Total Advisory Fees Paid$658,793
|
|
| Holdings [Text Block] |
Value |
Value |
Emerging Market Equities |
1.0 |
Global Equities |
1.0 |
Global Fixed Income |
3.5 |
High Yield Fixed Income |
5.7 |
International Developed Market Equities |
12.1 |
Investment Grade Fixed Income |
37.2 |
U.S. Large Cap Equities |
39.5 | |
|
| Largest Holdings [Text Block] |
American Funds U.S. Government Securities Fund, Class R-6 |
18.8 |
American Funds The Bond Fund of America, Class 1 |
18.3 |
American Funds Growth-Income Fund, Class 1 |
8.1 |
American Funds Washington Mutual Investors Fund, Class 1 |
8.1 |
American Funds American Mutual Fund, Class R-6 |
8.1 |
American Funds International Growth & Income Fund, Class R-6 |
6.5 |
American Funds High-Income Trust Fund, Class R-6 |
5.7 |
American Funds International Fund, Class 1 |
5.6 |
American Funds Growth Fund, Class 1 |
5.1 |
American Funds AMCAP Fund, Class R-6 |
5.1 | |
|
| Updated Prospectus Phone Number |
1-888-243-1956
|
|
| Updated Prospectus Web Address |
<span style="box-sizing: border-box; color: rgb(0, 0, 0); display: inline; flex-wrap: nowrap; font-size: 10.6667px; font-weight: 400; grid-area: auto; line-height: 16px; margin: 0px; overflow: visible; text-align: justify; text-align-last: left; white-space-collapse: preserve-breaks;">https://dfinview.com/BHFT</span>
|
|
| C000063058 |
|
|
| Shareholder Report [Line Items] |
|
|
| Fund Name |
American Funds<sup style="box-sizing: border-box; color: rgb(0, 0, 0); display: inline; flex-wrap: nowrap; font-size: 12px; font-weight: 700; grid-area: auto; line-height: 0px; margin: 0px; overflow: visible; position: relative; text-align: left; text-align-last: auto; white-space-collapse: preserve-breaks;">®</sup> Moderate Allocation Portfolio
|
|
| Class Name |
Class C
|
|
| No Trading Symbol [Flag] |
true
|
|
| Annual or Semi-Annual Statement [Text Block] |
This semi-annual shareholder report contains important information about the American Funds® Moderate Allocation Portfolio (the "Portfolio") for the period of January 1, 2025 to June 30, 2025.
|
|
| Shareholder Report Annual or Semi-Annual |
Semi-Annual Shareholder Report
|
|
| Additional Information [Text Block] |
You can find additional information about the Portfolio at https://dfinview.com/BHFT. You can also request this information by contacting us at 1-888-243-1956.
|
|
| Additional Information Phone Number |
1-888-243-1956
|
|
| Additional Information Website |
<span style="box-sizing: border-box; color: rgb(0, 0, 0); display: inline; flex-wrap: nowrap; font-size: 12px; font-weight: 400; grid-area: auto; line-height: 18px; margin: 0px; overflow: visible; text-align: left; text-align-last: auto; white-space-collapse: preserve-breaks;">https://dfinview.com/BHFT</span>
|
|
| Expenses [Text Block] |
What were the Portfolio costs for last six months?This example shows the expenses you would have paid over the reporting period based on a hypothetical $10,000 investment.
Class Name |
Costs of a $10,000 investment |
Costs paid as a percentage of a $10,000 investment |
Class C |
$32 |
0.63%Footnote Reference* |
| Footnote |
Description |
Footnote* |
Annualized. | |
|
| Expenses Paid, Amount |
$ 32
|
|
| Expense Ratio, Percent |
0.63%
|
[12] |
| AssetsNet |
$ 1,946,674,353
|
|
| Holdings Count | Holding |
14
|
|
| Advisory Fees Paid, Amount |
$ 658,793
|
|
| InvestmentCompanyPortfolioTurnover |
4.00%
|
|
| Additional Fund Statistics [Text Block] |
- Total Net Assets$1,946,674,353
- # of Portfolio Investments14
- Portfolio Turnover Rate4%
- Total Advisory Fees Paid$658,793
|
|
| Holdings [Text Block] |
Value |
Value |
Emerging Market Equities |
1.0 |
Global Equities |
1.0 |
Global Fixed Income |
3.5 |
High Yield Fixed Income |
5.7 |
International Developed Market Equities |
12.1 |
Investment Grade Fixed Income |
37.2 |
U.S. Large Cap Equities |
39.5 | |
|
| Largest Holdings [Text Block] |
American Funds U.S. Government Securities Fund, Class R-6 |
18.8 |
American Funds The Bond Fund of America, Class 1 |
18.3 |
American Funds Growth-Income Fund, Class 1 |
8.1 |
American Funds Washington Mutual Investors Fund, Class 1 |
8.1 |
American Funds American Mutual Fund, Class R-6 |
8.1 |
American Funds International Growth & Income Fund, Class R-6 |
6.5 |
American Funds High-Income Trust Fund, Class R-6 |
5.7 |
American Funds International Fund, Class 1 |
5.6 |
American Funds Growth Fund, Class 1 |
5.1 |
American Funds AMCAP Fund, Class R-6 |
5.1 | |
|
| Updated Prospectus Phone Number |
1-888-243-1956
|
|
| Updated Prospectus Web Address |
<span style="box-sizing: border-box; color: rgb(0, 0, 0); display: inline; flex-wrap: nowrap; font-size: 10.6667px; font-weight: 400; grid-area: auto; line-height: 16px; margin: 0px; overflow: visible; text-align: justify; text-align-last: left; white-space-collapse: preserve-breaks;">https://dfinview.com/BHFT</span>
|
|
| C000100078 |
|
|
| Shareholder Report [Line Items] |
|
|
| Fund Name |
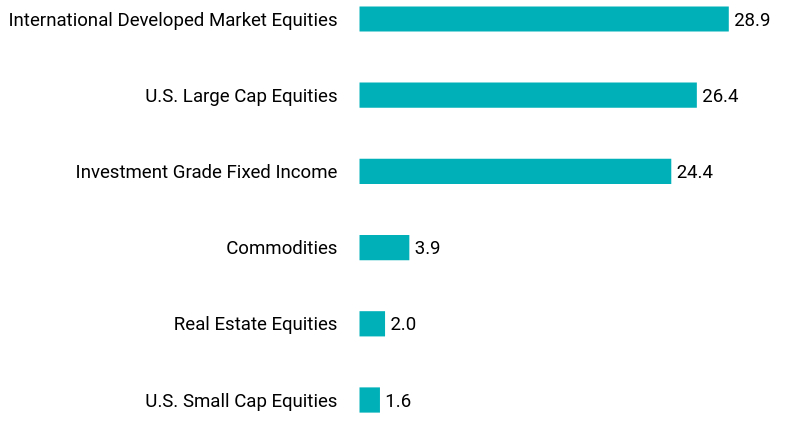
BlackRock Global Tactical Strategies Portfolio
|
|
| Class Name |
Class B
|
|
| No Trading Symbol [Flag] |
true
|
|
| Annual or Semi-Annual Statement [Text Block] |
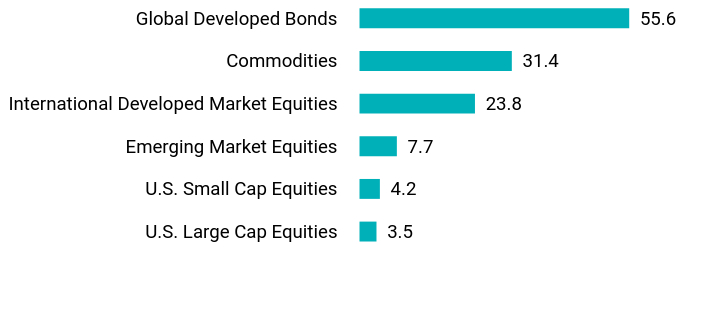
This semi-annual shareholder report contains important information about the BlackRock Global Tactical Strategies Portfolio (the "Portfolio") for the period of January 1, 2025 to June 30, 2025.
|
|
| Shareholder Report Annual or Semi-Annual |
Semi-Annual Shareholder Report
|
|
| Additional Information [Text Block] |
You can find additional information about the Portfolio at https://dfinview.com/BHFT. You can also request this information by contacting us at 1-888-243-1956.
|
|
| Additional Information Phone Number |
1-888-243-1956
|
|
| Additional Information Website |
<span style="box-sizing: border-box; color: rgb(0, 0, 0); display: inline; flex-wrap: nowrap; font-size: 12px; font-weight: 400; grid-area: auto; line-height: 18px; margin: 0px; overflow: visible; text-align: left; text-align-last: auto; white-space-collapse: preserve-breaks;">https://dfinview.com/BHFT</span>
|
|
| Expenses [Text Block] |
What were the Portfolio costs for last six months?This example shows the expenses you would have paid over the reporting period based on a hypothetical $10,000 investment.
Class Name |
Costs of a $10,000 investment |
Costs paid as a percentage of a $10,000 investment |
Class B |
$45 |
0.88%Footnote Reference* |
| Footnote |
Description |
Footnote* |
Annualized. | |
|
| Expenses Paid, Amount |
$ 45
|
|
| Expense Ratio, Percent |
0.88%
|
[13] |
| AssetsNet |
$ 2,910,929,825
|
|
| Holdings Count | Holding |
83
|
|
| Advisory Fees Paid, Amount |
$ 8,790,807
|
|
| InvestmentCompanyPortfolioTurnover |
8.00%
|
|
| Additional Fund Statistics [Text Block] |
- Total Net Assets$2,910,929,825
- # of Portfolio Investments83
- Portfolio Turnover Rate8%
- Total Advisory Fees Paid$8,790,807
|
|
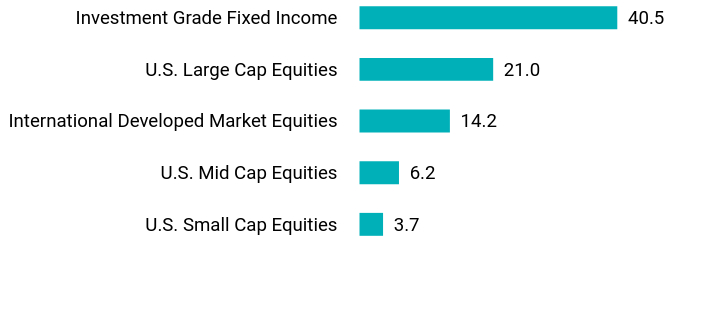
| Holdings [Text Block] |
Value |
Value |
U.S. Small Cap Equities |
1.6 |
Real Estate Equities |
2.0 |
Commodities |
3.9 |
Investment Grade Fixed Income |
24.4 |
U.S. Large Cap Equities |
26.4 |
International Developed Market Equities |
28.9 | |
|
| Largest Holdings [Text Block] |
iShares Core MSCI EAFE ETF |
24.5 |
Vanguard Total Bond Market ETF |
20.0 |
iShares Core S&P 500 ETF |
19.6 |
iShares Core U.S. Aggregate Bond ETF |
15.4 |
Technology Select Sector SPDR Fund |
2.5 |
iShares U.S. Real Estate ETF |
2.0 |
Financial Select Sector SPDR Fund |
1.2 |
Communication Services Select Sector SPDR Fund |
1.0 |
Consumer Discretionary Select Sector SPDR Fund |
0.9 |
Health Care Select Sector SPDR Fund |
0.8 | |
|
| Updated Prospectus Phone Number |
1-888-243-1956
|
|
| Updated Prospectus Web Address |
<span style="box-sizing: border-box; color: rgb(0, 0, 0); display: inline; flex-wrap: nowrap; font-size: 10.6667px; font-weight: 400; grid-area: auto; line-height: 16px; margin: 0px; overflow: visible; text-align: justify; text-align-last: left; white-space-collapse: preserve-breaks;">https://dfinview.com/BHFT</span>
|
|
| C000030750 |
|
|
| Shareholder Report [Line Items] |
|
|
| Fund Name |
BlackRock High Yield Portfolio
|
|
| Class Name |
Class A
|
|
| No Trading Symbol [Flag] |
true
|
|
| Annual or Semi-Annual Statement [Text Block] |
This semi-annual shareholder report contains important information about the BlackRock High Yield Portfolio (the "Portfolio") for the period of January 1, 2025 to June 30, 2025.
|
|
| Shareholder Report Annual or Semi-Annual |
Semi-Annual Shareholder Report
|
|
| Additional Information [Text Block] |
You can find additional information about the Portfolio at https://dfinview.com/BHFT. You can also request this information by contacting us at 1-888-243-1956.
|
|
| Additional Information Phone Number |
1-888-243-1956
|
|
| Additional Information Website |
<span style="box-sizing: border-box; color: rgb(0, 0, 0); display: inline; flex-wrap: nowrap; font-size: 12px; font-weight: 400; grid-area: auto; line-height: 18px; margin: 0px; overflow: visible; text-align: left; text-align-last: auto; white-space-collapse: preserve-breaks;">https://dfinview.com/BHFT</span>
|
|
| Expenses [Text Block] |
What were the Portfolio costs for last six months?This example shows the expenses you would have paid over the reporting period based on a hypothetical $10,000 investment.
Class Name |
Costs of a $10,000 investment |
Costs paid as a percentage of a $10,000 investment |
Class A |
$32 |
0.63%Footnote Reference* |
| Footnote |
Description |
Footnote* |
Annualized. | |
|
| Expenses Paid, Amount |
$ 32
|
|
| Expense Ratio, Percent |
0.63%
|
[14] |
| AssetsNet |
$ 1,013,764,759
|
|
| Holdings Count | Holding |
1,209
|
|
| Advisory Fees Paid, Amount |
$ 2,796,185
|
|
| InvestmentCompanyPortfolioTurnover |
26.00%
|
|
| Additional Fund Statistics [Text Block] |
- Total Net Assets$1,013,764,759
- # of Portfolio Investments1,209
- Portfolio Turnover Rate26%
- Total Advisory Fees Paid$2,796,185
|
|
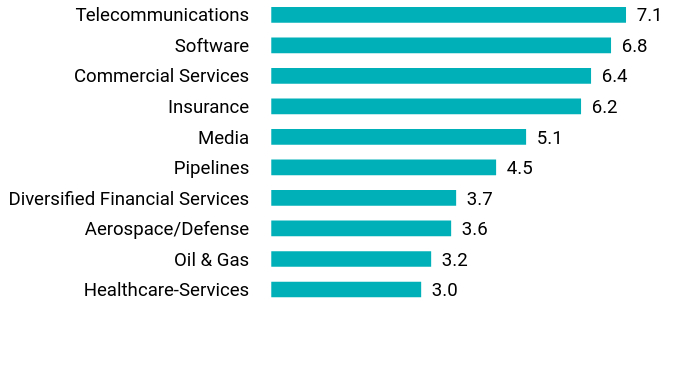
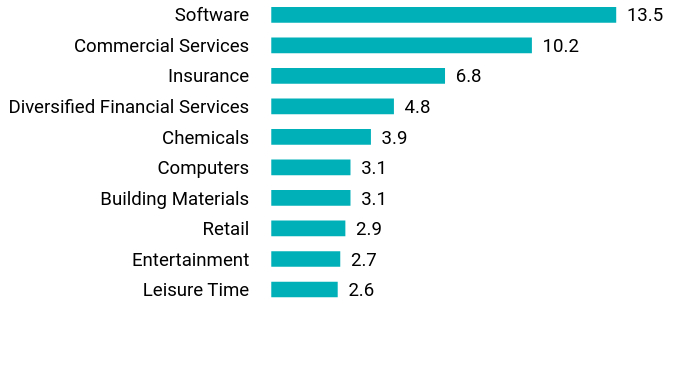
| Holdings [Text Block] |
Value |
Value |
Healthcare-Services |
3.0 |
Oil & Gas |
3.2 |
Aerospace/Defense |
3.6 |
Diversified Financial Services |
3.7 |
Pipelines |
4.5 |
Media |
5.1 |
Insurance |
6.2 |
Commercial Services |
6.4 |
Software |
6.8 |
Telecommunications |
7.1 |
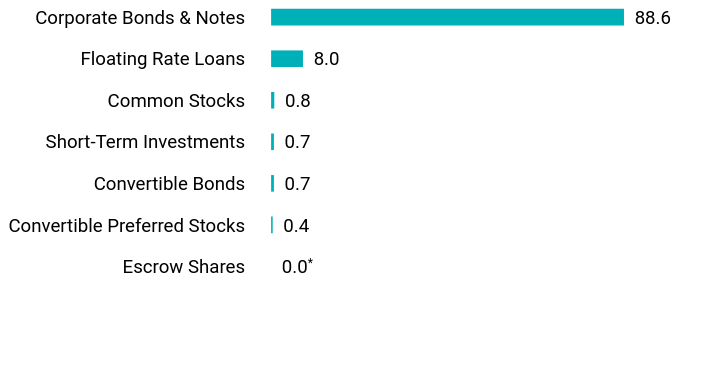
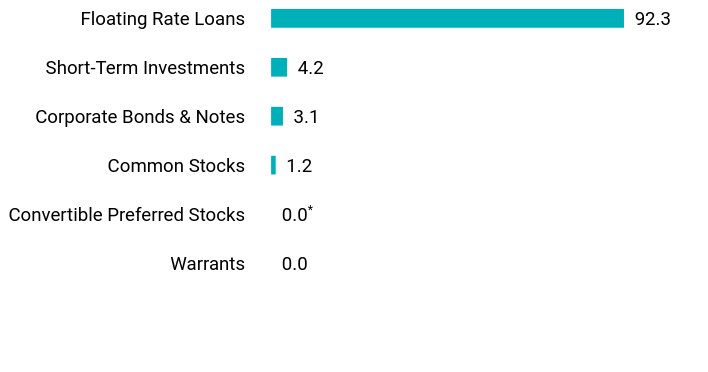
Value |
Value |
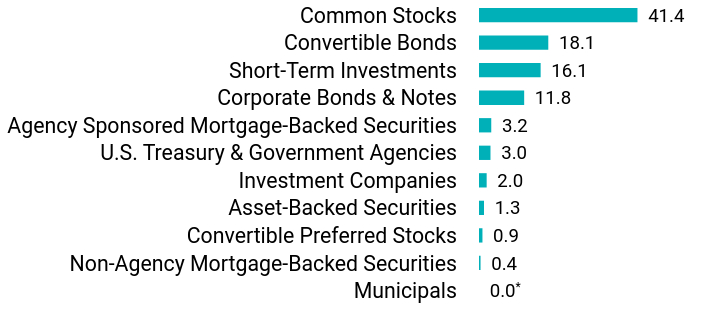
Escrow Shares |
0.0Footnote Reference* |
Convertible Preferred Stocks |
0.4 |
Convertible Bonds |
0.7 |
Short-Term Investments |
0.7 |
Common Stocks |
0.8 |
Floating Rate Loans |
8.0 |
Corporate Bonds & Notes |
88.6 |
| Footnote |
Description |
Footnote* |
Amount rounds to less than 0.1% | |
|
| Largest Holdings [Text Block] |
Top 10 Fixed Income Issuers
Cloud Software Group, Inc. |
2.1 |
HUB International Ltd. |
1.9 |
TransDigm, Inc. |
1.9 |
Venture Global LNG, Inc. |
1.7 |
Level 3 Financing, Inc. |
1.7 |
Alliant Holdings Intermediate LLC/Alliant Holdings Co-Issuer |
1.1 |
AthenaHealth Group, Inc. |
1.1 |
CCO Holdings LLC/CCO Holdings Capital Corp. |
1.1 |
Clear Channel Outdoor Holdings, Inc. |
1.0 |
Fortress Transportation & Infrastructure Investors LLC |
1.0 | |
|
| Material Fund Change [Text Block] |
|
|
| Updated Prospectus Phone Number |
1-888-243-1956
|
|
| Updated Prospectus Web Address |
<span style="box-sizing: border-box; color: rgb(0, 0, 0); display: inline; flex-wrap: nowrap; font-size: 10.6667px; font-weight: 400; grid-area: auto; line-height: 16px; margin: 0px; overflow: visible; text-align: justify; text-align-last: left; white-space-collapse: preserve-breaks;">https://dfinview.com/BHFT</span>
|
|
| C000030751 |
|
|
| Shareholder Report [Line Items] |
|
|
| Fund Name |
BlackRock High Yield Portfolio
|
|
| Class Name |
Class B
|
|
| No Trading Symbol [Flag] |
true
|
|
| Annual or Semi-Annual Statement [Text Block] |
This semi-annual shareholder report contains important information about the BlackRock High Yield Portfolio (the "Portfolio") for the period of January 1, 2025 to June 30, 2025.
|
|
| Shareholder Report Annual or Semi-Annual |
Semi-Annual Shareholder Report
|
|
| Additional Information [Text Block] |
You can find additional information about the Portfolio at https://dfinview.com/BHFT. You can also request this information by contacting us at 1-888-243-1956.
|
|
| Additional Information Phone Number |
1-888-243-1956
|
|
| Additional Information Website |
<span style="box-sizing: border-box; color: rgb(0, 0, 0); display: inline; flex-wrap: nowrap; font-size: 12px; font-weight: 400; grid-area: auto; line-height: 18px; margin: 0px; overflow: visible; text-align: left; text-align-last: auto; white-space-collapse: preserve-breaks;">https://dfinview.com/BHFT</span>
|
|
| Expenses [Text Block] |
What were the Portfolio costs for last six months?This example shows the expenses you would have paid over the reporting period based on a hypothetical $10,000 investment.
Class Name |
Costs of a $10,000 investment |
Costs paid as a percentage of a $10,000 investment |
Class B |
$45 |
0.88%Footnote Reference* |
| Footnote |
Description |
Footnote* |
Annualized. | |
|
| Expenses Paid, Amount |
$ 45
|
|
| Expense Ratio, Percent |
0.88%
|
[15] |
| AssetsNet |
$ 1,013,764,759
|
|
| Holdings Count | Holding |
1,209
|
|
| Advisory Fees Paid, Amount |
$ 2,796,185
|
|
| InvestmentCompanyPortfolioTurnover |
26.00%
|
|
| Additional Fund Statistics [Text Block] |
- Total Net Assets$1,013,764,759
- # of Portfolio Investments1,209
- Portfolio Turnover Rate26%
- Total Advisory Fees Paid$2,796,185
|
|
| Holdings [Text Block] |
Value |
Value |
Healthcare-Services |
3.0 |
Oil & Gas |
3.2 |
Aerospace/Defense |
3.6 |
Diversified Financial Services |
3.7 |
Pipelines |
4.5 |
Media |
5.1 |
Insurance |
6.2 |
Commercial Services |
6.4 |
Software |
6.8 |
Telecommunications |
7.1 |
Value |
Value |
Escrow Shares |
0.0Footnote Reference* |
Convertible Preferred Stocks |
0.4 |
Convertible Bonds |
0.7 |
Short-Term Investments |
0.7 |
Common Stocks |
0.8 |
Floating Rate Loans |
8.0 |
Corporate Bonds & Notes |
88.6 |
| Footnote |
Description |
Footnote* |
Amount rounds to less than 0.1% | |
|
| Largest Holdings [Text Block] |
Top 10 Fixed Income Issuers
Cloud Software Group, Inc. |
2.1 |
HUB International Ltd. |
1.9 |
TransDigm, Inc. |
1.9 |
Venture Global LNG, Inc. |
1.7 |
Level 3 Financing, Inc. |
1.7 |
Alliant Holdings Intermediate LLC/Alliant Holdings Co-Issuer |
1.1 |
AthenaHealth Group, Inc. |
1.1 |
CCO Holdings LLC/CCO Holdings Capital Corp. |
1.1 |
Clear Channel Outdoor Holdings, Inc. |
1.0 |
Fortress Transportation & Infrastructure Investors LLC |
1.0 | |
|
| Material Fund Change [Text Block] |
|
|
| Updated Prospectus Phone Number |
1-888-243-1956
|
|
| Updated Prospectus Web Address |
<span style="box-sizing: border-box; color: rgb(0, 0, 0); display: inline; flex-wrap: nowrap; font-size: 10.6667px; font-weight: 400; grid-area: auto; line-height: 16px; margin: 0px; overflow: visible; text-align: justify; text-align-last: left; white-space-collapse: preserve-breaks;">https://dfinview.com/BHFT</span>
|
|
| C000030680 |
|
|
| Shareholder Report [Line Items] |
|
|
| Fund Name |
Brighthouse Asset Allocation 100 Portfolio
|
|
| Class Name |
Class A
|
|
| No Trading Symbol [Flag] |
true
|
|
| Annual or Semi-Annual Statement [Text Block] |
This semi-annual shareholder report contains important information about the Brighthouse Asset Allocation 100 Portfolio (the "Portfolio") for the period of January 1, 2025 to June 30, 2025.
|
|
| Shareholder Report Annual or Semi-Annual |
Semi-Annual Shareholder Report
|
|
| Additional Information [Text Block] |
You can find additional information about the Portfolio at https://dfinview.com/BHFT. You can also request this information by contacting us at 1-888-243-1956.
|
|
| Additional Information Phone Number |
1-888-243-1956
|
|
| Additional Information Website |
<span style="box-sizing: border-box; color: rgb(0, 0, 0); display: inline; flex-wrap: nowrap; font-size: 12px; font-weight: 400; grid-area: auto; line-height: 18px; margin: 0px; overflow: visible; text-align: left; text-align-last: auto; white-space-collapse: preserve-breaks;">https://dfinview.com/BHFT</span>
|
|
| Expenses [Text Block] |
What were the Portfolio costs for last six months?This example shows the expenses you would have paid over the reporting period based on a hypothetical $10,000 investment.
Class Name |
Costs of a $10,000 investment |
Costs paid as a percentage of a $10,000 investment |
Class A |
$4 |
0.08%Footnote Reference* |
| Footnote |
Description |
Footnote* |
Annualized. | |
|
| Expenses Paid, Amount |
$ 4
|
|
| Expense Ratio, Percent |
0.08%
|
[16] |
| AssetsNet |
$ 1,748,124,832
|
|
| Holdings Count | Holding |
30
|
|
| Advisory Fees Paid, Amount |
$ 601,006
|
|
| InvestmentCompanyPortfolioTurnover |
7.00%
|
|
| Additional Fund Statistics [Text Block] |
- Total Net Assets$1,748,124,832
- # of Portfolio Investments30
- Portfolio Turnover Rate7%
- Total Advisory Fees Paid$601,006
|
|
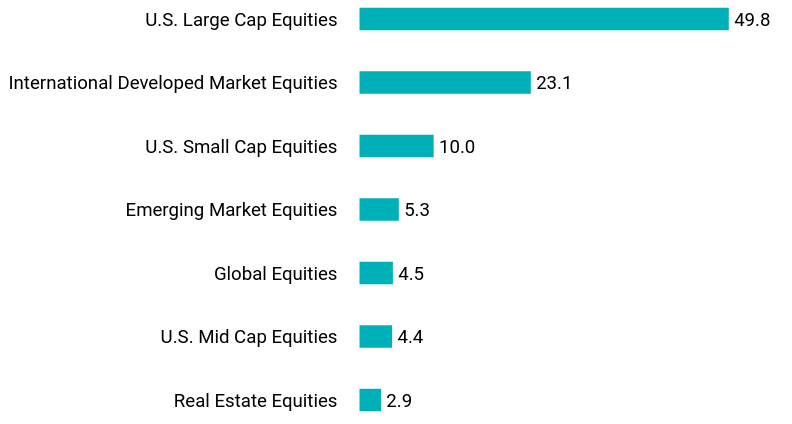
| Holdings [Text Block] |
Value |
Value |
Real Estate Equities |
2.9 |
U.S. Mid Cap Equities |
4.4 |
Global Equities |
4.5 |
Emerging Market Equities |
5.3 |
U.S. Small Cap Equities |
10.0 |
International Developed Market Equities |
23.1 |
U.S. Large Cap Equities |
49.8 | |
|
| Largest Holdings [Text Block] |
Loomis Sayles Growth Portfolio, Class A |
6.3 |
MFS Value Portfolio, Class A |
6.3 |
Jennison Growth Portfolio, Class A |
6.1 |
Invesco Comstock Portfolio, Class A |
6.0 |
T. Rowe Price Large Cap Value Portfolio, Class A |
5.7 |
Harris Oakmark International Portfolio, Class A |
5.6 |
T. Rowe Price Large Cap Growth Portfolio, Class A |
5.5 |
SSGA Emerging Markets Enhanced Index Portfolio, Class A |
5.3 |
Brighthouse/Dimensional International Small Company Portfolio, Class A |
5.1 |
Brighthouse/Wellington Core Equity Opportunities Portfolio, Class A |
5.0 | |
|
| Updated Prospectus Phone Number |
1-888-243-1956
|
|
| Updated Prospectus Web Address |
<span style="box-sizing: border-box; color: rgb(0, 0, 0); display: inline; flex-wrap: nowrap; font-size: 10.6667px; font-weight: 400; grid-area: auto; line-height: 16px; margin: 0px; overflow: visible; text-align: justify; text-align-last: left; white-space-collapse: preserve-breaks;">https://dfinview.com/BHFT</span>
|
|
| C000030681 |
|
|
| Shareholder Report [Line Items] |
|
|
| Fund Name |
Brighthouse Asset Allocation 100 Portfolio
|
|
| Class Name |
Class B
|
|
| No Trading Symbol [Flag] |
true
|
|
| Annual or Semi-Annual Statement [Text Block] |
This semi-annual shareholder report contains important information about the Brighthouse Asset Allocation 100 Portfolio (the "Portfolio") for the period of January 1, 2025 to June 30, 2025.
|
|
| Shareholder Report Annual or Semi-Annual |
Semi-Annual Shareholder Report
|
|
| Additional Information [Text Block] |
You can find additional information about the Portfolio at https://dfinview.com/BHFT. You can also request this information by contacting us at 1-888-243-1956.
|
|
| Additional Information Phone Number |
1-888-243-1956
|
|
| Additional Information Website |
<span style="box-sizing: border-box; color: rgb(0, 0, 0); display: inline; flex-wrap: nowrap; font-size: 12px; font-weight: 400; grid-area: auto; line-height: 18px; margin: 0px; overflow: visible; text-align: left; text-align-last: auto; white-space-collapse: preserve-breaks;">https://dfinview.com/BHFT</span>
|
|
| Expenses [Text Block] |
What were the Portfolio costs for last six months?This example shows the expenses you would have paid over the reporting period based on a hypothetical $10,000 investment.
Class Name |
Costs of a $10,000 investment |
Costs paid as a percentage of a $10,000 investment |
Class B |
$17 |
0.33%Footnote Reference* |
| Footnote |
Description |
Footnote* |
Annualized. | |
|
| Expenses Paid, Amount |
$ 17
|
|
| Expense Ratio, Percent |
0.33%
|
[17] |
| AssetsNet |
$ 1,748,124,832
|
|
| Holdings Count | Holding |
30
|
|
| Advisory Fees Paid, Amount |
$ 601,006
|
|
| InvestmentCompanyPortfolioTurnover |
7.00%
|
|
| Additional Fund Statistics [Text Block] |
- Total Net Assets$1,748,124,832
- # of Portfolio Investments30
- Portfolio Turnover Rate7%
- Total Advisory Fees Paid$601,006
|
|
| Holdings [Text Block] |
Value |
Value |
Real Estate Equities |
2.9 |
U.S. Mid Cap Equities |
4.4 |
Global Equities |
4.5 |
Emerging Market Equities |
5.3 |
U.S. Small Cap Equities |
10.0 |
International Developed Market Equities |
23.1 |
U.S. Large Cap Equities |
49.8 | |
|
| Largest Holdings [Text Block] |
Loomis Sayles Growth Portfolio, Class A |
6.3 |
MFS Value Portfolio, Class A |
6.3 |
Jennison Growth Portfolio, Class A |
6.1 |
Invesco Comstock Portfolio, Class A |
6.0 |
T. Rowe Price Large Cap Value Portfolio, Class A |
5.7 |
Harris Oakmark International Portfolio, Class A |
5.6 |
T. Rowe Price Large Cap Growth Portfolio, Class A |
5.5 |
SSGA Emerging Markets Enhanced Index Portfolio, Class A |
5.3 |
Brighthouse/Dimensional International Small Company Portfolio, Class A |
5.1 |
Brighthouse/Wellington Core Equity Opportunities Portfolio, Class A |
5.0 | |
|
| Updated Prospectus Phone Number |
1-888-243-1956
|
|
| Updated Prospectus Web Address |
<span style="box-sizing: border-box; color: rgb(0, 0, 0); display: inline; flex-wrap: nowrap; font-size: 10.6667px; font-weight: 400; grid-area: auto; line-height: 16px; margin: 0px; overflow: visible; text-align: justify; text-align-last: left; white-space-collapse: preserve-breaks;">https://dfinview.com/BHFT</span>
|
|
| C000100083 |
|
|
| Shareholder Report [Line Items] |
|
|
| Fund Name |
Brighthouse Balanced Plus Portfolio
|
|
| Class Name |
Class B
|
|
| No Trading Symbol [Flag] |
true
|
|
| Annual or Semi-Annual Statement [Text Block] |
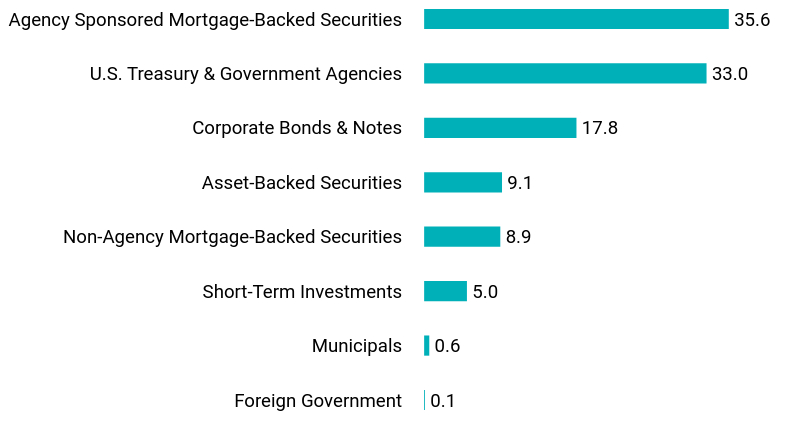
This semi-annual shareholder report contains important information about the Brighthouse Balanced Plus Portfolio (the "Portfolio") for the period of January 1, 2025 to June 30, 2025.
|
|
| Shareholder Report Annual or Semi-Annual |
Semi-Annual Shareholder Report
|
|
| Additional Information [Text Block] |
You can find additional information about the Portfolio at https://dfinview.com/BHFT. You can also request this information by contacting us at 1-888-243-1956.
|
|
| Additional Information Phone Number |
1-888-243-1956
|
|
| Additional Information Website |
<span style="box-sizing: border-box; color: rgb(0, 0, 0); display: inline; flex-wrap: nowrap; font-size: 12px; font-weight: 400; grid-area: auto; line-height: 18px; margin: 0px; overflow: visible; text-align: left; text-align-last: auto; white-space-collapse: preserve-breaks;">https://dfinview.com/BHFT</span>
|
|
| Expenses [Text Block] |
What were the Portfolio costs for last six months?This example shows the expenses you would have paid over the reporting period based on a hypothetical $10,000 investment.
Class Name |
Costs of a $10,000 investment |
Costs paid as a percentage of a $10,000 investment |
Class B |
$37 |
0.73%Footnote Reference* |
| Footnote |
Description |
Footnote* |
Annualized. | |
|
| Expenses Paid, Amount |
$ 37
|
|
| Expense Ratio, Percent |
0.73%
|
[18] |
| AssetsNet |
$ 4,876,581,316
|
|
| Holdings Count | Holding |
119
|
|
| Advisory Fees Paid, Amount |
$ 5,757,684
|
|
| InvestmentCompanyPortfolioTurnover |
32.00%
|
|
| Additional Fund Statistics [Text Block] |
- Total Net Assets$4,876,581,316
- # of Portfolio Investments119
- Portfolio Turnover Rate32%
- Total Advisory Fees Paid$5,757,684
|
|
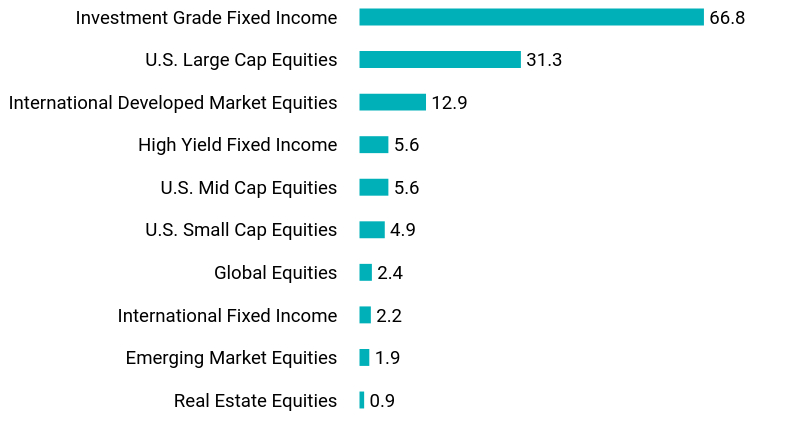
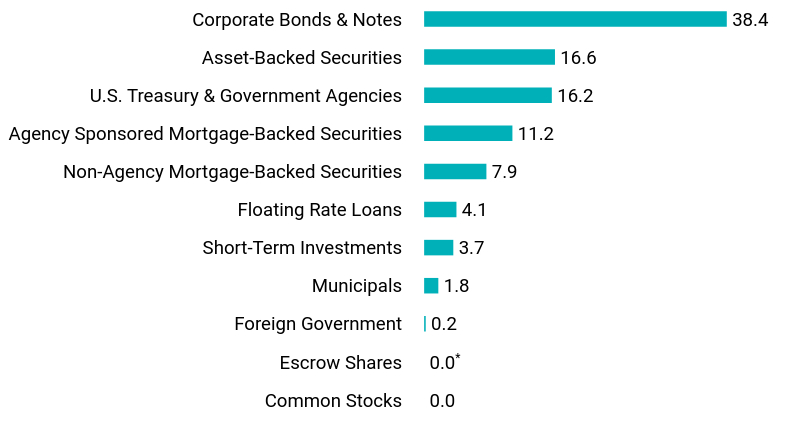
| Holdings [Text Block] |
Value |
Value |
Real Estate Equities |
0.9 |
Emerging Market Equities |
1.9 |
International Fixed Income |
2.2 |
Global Equities |
2.4 |
U.S. Small Cap Equities |
4.9 |
U.S. Mid Cap Equities |
5.6 |
High Yield Fixed Income |
5.6 |
International Developed Market Equities |
12.9 |
U.S. Large Cap Equities |
31.3 |
Investment Grade Fixed Income |
66.8 | |
|
| Largest Holdings [Text Block] |
U.S. Treasury Notes |
18.2 |
U.S. Treasury Bonds |
12.8 |
BlackRock Bond Income Portfolio, Class A |
7.4 |
TCW Core Fixed Income Portfolio, Class A |
6.0 |
PIMCO Total Return Portfolio, Class A |
5.5 |
JPMorgan Core Bond Portfolio, Class A |
4.3 |
Harris Oakmark International Portfolio, Class A |
3.9 |
Western Asset Management U.S. Government Portfolio, Class A |
3.5 |
Western Asset Management Strategic Bond Opportunities Portfolio, Class A |
3.1 |
Baillie Gifford International Stock Portfolio, Class A |
2.9 | |
|
| Updated Prospectus Phone Number |
1-888-243-1956
|
|
| Updated Prospectus Web Address |
<span style="box-sizing: border-box; color: rgb(0, 0, 0); display: inline; flex-wrap: nowrap; font-size: 10.6667px; font-weight: 400; grid-area: auto; line-height: 16px; margin: 0px; overflow: visible; text-align: justify; text-align-last: left; white-space-collapse: preserve-breaks;">https://dfinview.com/BHFT</span>
|
|
| C000030660 |
|
|
| Shareholder Report [Line Items] |
|
|
| Fund Name |
Brighthouse Small Cap Value Portfolio
|
|
| Class Name |
Class A
|
|
| No Trading Symbol [Flag] |
true
|
|
| Annual or Semi-Annual Statement [Text Block] |
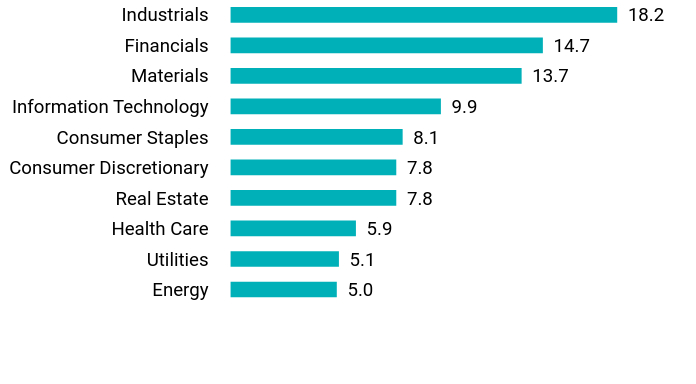
This semi-annual shareholder report contains important information about the Brighthouse Small Cap Value Portfolio (the "Portfolio") for the period of January 1, 2025 to June 30, 2025.
|
|
| Shareholder Report Annual or Semi-Annual |
Semi-Annual Shareholder Report
|
|
| Additional Information [Text Block] |
You can find additional information about the Portfolio at https://dfinview.com/BHFT. You can also request this information by contacting us at 1-888-243-1956.
|
|
| Additional Information Phone Number |
1-888-243-1956
|
|
| Additional Information Website |
<span style="box-sizing: border-box; color: rgb(0, 0, 0); display: inline; flex-wrap: nowrap; font-size: 12px; font-weight: 400; grid-area: auto; line-height: 18px; margin: 0px; overflow: visible; text-align: left; text-align-last: auto; white-space-collapse: preserve-breaks;">https://dfinview.com/BHFT</span>
|
|
| Expenses [Text Block] |
What were the Portfolio costs for last six months?This example shows the expenses you would have paid over the reporting period based on a hypothetical $10,000 investment.
Class Name |
Costs of a $10,000 investment |
Costs paid as a percentage of a $10,000 investment |
Class A |
$37 |
0.77%Footnote Reference* |
| Footnote |
Description |
Footnote* |
Annualized. | |
|
| Expenses Paid, Amount |
$ 37
|
|
| Expense Ratio, Percent |
0.77%
|
[19] |
| AssetsNet |
$ 735,039,458
|
|
| Holdings Count | Holding |
147
|
|
| Advisory Fees Paid, Amount |
$ 2,632,753
|
|
| InvestmentCompanyPortfolioTurnover |
53.00%
|
|
| Additional Fund Statistics [Text Block] |
- Total Net Assets$735,039,458
- # of Portfolio Investments147
- Portfolio Turnover Rate53%
- Total Advisory Fees Paid$2,632,753
|
|
| Holdings [Text Block] |
Value |
Value |
Communication Services |
1.0 |
Real Estate |
1.3 |
Energy |
4.3 |
Consumer Discretionary |
5.1 |
Health Care |
5.3 |
Information Technology |
7.0 |
Consumer Staples |
8.1 |
Materials |
17.4 |
Financials |
21.4 |
Industrials |
25.9 |
Value |
Value |
Bermuda |
0.3 |
Belgium |
0.5 |
United Kingdom |
2.4 |
United States |
94.2 | |
|
| Largest Holdings [Text Block] |
UMB Financial Corp. |
3.4 |
Franklin Electric Co., Inc. |
3.2 |
Mueller Industries, Inc. |
3.1 |
Innospec, Inc. |
3.0 |
J&J Snack Foods Corp. |
2.9 |
Eagle Materials, Inc. |
2.5 |
Silgan Holdings, Inc. |
2.5 |
Alamo Group, Inc. |
2.2 |
UFP Industries, Inc. |
2.0 |
NewMarket Corp. |
2.0 | |
|
| Material Fund Change [Text Block] |
|
|
| Updated Prospectus Phone Number |
1-888-243-1956
|
|
| Updated Prospectus Web Address |
<span style="box-sizing: border-box; color: rgb(0, 0, 0); display: inline; flex-wrap: nowrap; font-size: 10.6667px; font-weight: 400; grid-area: auto; line-height: 16px; margin: 0px; overflow: visible; text-align: justify; text-align-last: left; white-space-collapse: preserve-breaks;">https://dfinview.com/BHFT</span>
|
|
| C000030661 |
|
|
| Shareholder Report [Line Items] |
|
|
| Fund Name |
Brighthouse Small Cap Value Portfolio
|
|
| Class Name |
Class B
|
|
| No Trading Symbol [Flag] |
true
|
|
| Annual or Semi-Annual Statement [Text Block] |
This semi-annual shareholder report contains important information about the Brighthouse Small Cap Value Portfolio (the "Portfolio") for the period of January 1, 2025 to June 30, 2025.
|
|
| Shareholder Report Annual or Semi-Annual |
Semi-Annual Shareholder Report
|
|
| Additional Information [Text Block] |
You can find additional information about the Portfolio at https://dfinview.com/BHFT. You can also request this information by contacting us at 1-888-243-1956.
|
|
| Additional Information Phone Number |
1-888-243-1956
|
|
| Additional Information Website |
<span style="box-sizing: border-box; color: rgb(0, 0, 0); display: inline; flex-wrap: nowrap; font-size: 12px; font-weight: 400; grid-area: auto; line-height: 18px; margin: 0px; overflow: visible; text-align: left; text-align-last: auto; white-space-collapse: preserve-breaks;">https://dfinview.com/BHFT</span>
|
|
| Expenses [Text Block] |
What were the Portfolio costs for last six months?This example shows the expenses you would have paid over the reporting period based on a hypothetical $10,000 investment.
Class Name |
Costs of a $10,000 investment |
Costs paid as a percentage of a $10,000 investment |
Class B |
$49 |
1.02%Footnote Reference* |
| Footnote |
Description |
Footnote* |
Annualized. | |
|
| Expenses Paid, Amount |
$ 49
|
|
| Expense Ratio, Percent |
1.02%
|
[20] |
| AssetsNet |
$ 735,039,458
|
|
| Holdings Count | Holding |
147
|
|
| Advisory Fees Paid, Amount |
$ 2,632,753
|
|
| InvestmentCompanyPortfolioTurnover |
53.00%
|
|
| Additional Fund Statistics [Text Block] |
- Total Net Assets$735,039,458
- # of Portfolio Investments147
- Portfolio Turnover Rate53%
- Total Advisory Fees Paid$2,632,753
|
|
| Holdings [Text Block] |
Value |
Value |
Communication Services |
1.0 |
Real Estate |
1.3 |
Energy |
4.3 |
Consumer Discretionary |
5.1 |
Health Care |
5.3 |
Information Technology |
7.0 |
Consumer Staples |
8.1 |
Materials |
17.4 |
Financials |
21.4 |
Industrials |
25.9 |
Value |
Value |
Bermuda |
0.3 |
Belgium |
0.5 |
United Kingdom |
2.4 |
United States |
94.2 | |
|
| Largest Holdings [Text Block] |
UMB Financial Corp. |
3.4 |
Franklin Electric Co., Inc. |
3.2 |
Mueller Industries, Inc. |
3.1 |
Innospec, Inc. |
3.0 |
J&J Snack Foods Corp. |
2.9 |
Eagle Materials, Inc. |
2.5 |
Silgan Holdings, Inc. |
2.5 |
Alamo Group, Inc. |
2.2 |
UFP Industries, Inc. |
2.0 |
NewMarket Corp. |
2.0 | |
|
| Material Fund Change [Text Block] |
|
|
| Updated Prospectus Phone Number |
1-888-243-1956
|
|
| Updated Prospectus Web Address |
<span style="box-sizing: border-box; color: rgb(0, 0, 0); display: inline; flex-wrap: nowrap; font-size: 10.6667px; font-weight: 400; grid-area: auto; line-height: 16px; margin: 0px; overflow: visible; text-align: justify; text-align-last: left; white-space-collapse: preserve-breaks;">https://dfinview.com/BHFT</span>
|
|
| C000140956 |
|
|
| Shareholder Report [Line Items] |
|
|
| Fund Name |
Brighthouse/Artisan International Portfolio
|
|
| Class Name |
Class A
|
|
| No Trading Symbol [Flag] |
true
|
|
| Annual or Semi-Annual Statement [Text Block] |
This semi-annual shareholder report contains important information about the Brighthouse/Artisan International Portfolio (the "Portfolio") for the period of January 1, 2025 to June 30, 2025.
|
|
| Shareholder Report Annual or Semi-Annual |
Semi-Annual Shareholder Report
|
|
| Additional Information [Text Block] |
You can find additional information about the Portfolio at https://dfinview.com/BHFT. You can also request this information by contacting us at 1-888-243-1956.
|
|
| Additional Information Phone Number |
1-888-243-1956
|
|
| Additional Information Website |
<span style="box-sizing: border-box; color: rgb(0, 0, 0); display: inline; flex-wrap: nowrap; font-size: 12px; font-weight: 400; grid-area: auto; line-height: 18px; margin: 0px; overflow: visible; text-align: left; text-align-last: auto; white-space-collapse: preserve-breaks;">https://dfinview.com/BHFT</span>
|
|
| Expenses [Text Block] |
What were the Portfolio costs for last six months?This example shows the expenses you would have paid over the reporting period based on a hypothetical $10,000 investment.
Class Name |
Costs of a $10,000 investment |
Costs paid as a percentage of a $10,000 investment |
Class A |
$45 |
0.80%Footnote Reference* |
| Footnote |
Description |
Footnote* |
Annualized. | |
|
| Expenses Paid, Amount |
$ 45
|
|
| Expense Ratio, Percent |
0.80%
|
[21] |
| AssetsNet |
$ 838,226,762
|
|
| Holdings Count | Holding |
87
|
|
| Advisory Fees Paid, Amount |
$ 3,087,891
|
|
| InvestmentCompanyPortfolioTurnover |
65.00%
|
|
| Additional Fund Statistics [Text Block] |
- Total Net Assets$838,226,762
- # of Portfolio Investments87
- Portfolio Turnover Rate65%
- Total Advisory Fees Paid$3,087,891
|
|
| Holdings [Text Block] |
Value |
Value |
Information Technology |
1.4 |
Real Estate |
2.3 |
Health Care |
2.9 |
Consumer Discretionary |
3.8 |
Communication Services |
4.9 |
Materials |
5.5 |
Consumer Staples |
8.0 |
Utilities |
8.6 |
Financials |
28.6 |
Industrials |
31.4 |
Value |
Value |
China |
3.7 |
Denmark |
4.0 |
Italy |
4.2 |
Japan |
4.5 |
United States |
5.4 |
Switzerland |
7.0 |
South Korea |
10.5 |
Germany |
10.9 |
France |
14.0 |
United Kingdom |
21.4 | |
|
| Largest Holdings [Text Block] |
LIG Nex1 Co. Ltd. |
5.5 |
National Grid PLC |
4.5 |
UBS Group AG |
4.5 |
Hanwha Aerospace Co. Ltd. |
3.2 |
Melrose Industries PLC |
3.1 |
Tencent Holdings Ltd. |
2.9 |
British American Tobacco PLC |
2.8 |
Air Liquide SA |
2.6 |
Aon PLC |
2.4 |
BNP Paribas SA |
2.4 | |
|
| Material Fund Change [Text Block] |
|
|
| Updated Prospectus Phone Number |
1-888-243-1956
|
|
| Updated Prospectus Web Address |
<span style="box-sizing: border-box; color: rgb(0, 0, 0); display: inline; flex-wrap: nowrap; font-size: 10.6667px; font-weight: 400; grid-area: auto; line-height: 16px; margin: 0px; overflow: visible; text-align: justify; text-align-last: left; white-space-collapse: preserve-breaks;">https://dfinview.com/BHFT</span>
|
|
| C000140957 |
|
|
| Shareholder Report [Line Items] |
|
|
| Fund Name |
Brighthouse/Artisan International Portfolio
|
|
| Class Name |
Class B
|
|
| No Trading Symbol [Flag] |
true
|
|
| Annual or Semi-Annual Statement [Text Block] |
This semi-annual shareholder report contains important information about the Brighthouse/Artisan International Portfolio (the "Portfolio") for the period of January 1, 2025 to June 30, 2025.
|
|
| Shareholder Report Annual or Semi-Annual |
Semi-Annual Shareholder Report
|
|
| Additional Information [Text Block] |
You can find additional information about the Portfolio at https://dfinview.com/BHFT. You can also request this information by contacting us at 1-888-243-1956.
|
|
| Additional Information Phone Number |
1-888-243-1956
|
|
| Additional Information Website |
<span style="box-sizing: border-box; color: rgb(0, 0, 0); display: inline; flex-wrap: nowrap; font-size: 12px; font-weight: 400; grid-area: auto; line-height: 18px; margin: 0px; overflow: visible; text-align: left; text-align-last: auto; white-space-collapse: preserve-breaks;">https://dfinview.com/BHFT</span>
|
|
| Expenses [Text Block] |
What were the Portfolio costs for last six months?This example shows the expenses you would have paid over the reporting period based on a hypothetical $10,000 investment.
Class Name |
Costs of a $10,000 investment |
Costs paid as a percentage of a $10,000 investment |
Class B |
$59 |
1.05%Footnote Reference* |
| Footnote |
Description |
Footnote* |
Annualized. | |
|
| Expenses Paid, Amount |
$ 59
|
|
| Expense Ratio, Percent |
1.05%
|
[22] |
| AssetsNet |
$ 838,226,762
|
|
| Holdings Count | Holding |
87
|
|
| Advisory Fees Paid, Amount |
$ 3,087,891
|
|
| InvestmentCompanyPortfolioTurnover |
65.00%
|
|
| Additional Fund Statistics [Text Block] |
- Total Net Assets$838,226,762
- # of Portfolio Investments87
- Portfolio Turnover Rate65%
- Total Advisory Fees Paid$3,087,891
|
|
| Holdings [Text Block] |
Value |
Value |
Information Technology |
1.4 |
Real Estate |
2.3 |
Health Care |
2.9 |
Consumer Discretionary |
3.8 |
Communication Services |
4.9 |
Materials |
5.5 |
Consumer Staples |
8.0 |
Utilities |
8.6 |
Financials |
28.6 |
Industrials |
31.4 |
Value |
Value |
China |
3.7 |
Denmark |
4.0 |
Italy |
4.2 |
Japan |
4.5 |
United States |
5.4 |
Switzerland |
7.0 |
South Korea |
10.5 |
Germany |
10.9 |
France |
14.0 |
United Kingdom |
21.4 | |
|
| Largest Holdings [Text Block] |
LIG Nex1 Co. Ltd. |
5.5 |
National Grid PLC |
4.5 |
UBS Group AG |
4.5 |
Hanwha Aerospace Co. Ltd. |
3.2 |
Melrose Industries PLC |
3.1 |
Tencent Holdings Ltd. |
2.9 |
British American Tobacco PLC |
2.8 |
Air Liquide SA |
2.6 |
Aon PLC |
2.4 |
BNP Paribas SA |
2.4 | |
|
| Material Fund Change [Text Block] |
|
|
| Updated Prospectus Phone Number |
1-888-243-1956
|
|
| Updated Prospectus Web Address |
<span style="box-sizing: border-box; color: rgb(0, 0, 0); display: inline; flex-wrap: nowrap; font-size: 10.6667px; font-weight: 400; grid-area: auto; line-height: 16px; margin: 0px; overflow: visible; text-align: justify; text-align-last: left; white-space-collapse: preserve-breaks;">https://dfinview.com/BHFT</span>
|
|
| C000088087 |
|
|
| Shareholder Report [Line Items] |
|
|
| Fund Name |
Brighthouse/Eaton Vance Floating Rate Portfolio
|
|
| Class Name |
Class A
|
|
| No Trading Symbol [Flag] |
true
|
|
| Annual or Semi-Annual Statement [Text Block] |
This semi-annual shareholder report contains important information about the Brighthouse/Eaton Vance Floating Rate Portfolio (the "Portfolio") for the period of January 1, 2025 to June 30, 2025.
|
|
| Shareholder Report Annual or Semi-Annual |
Semi-Annual Shareholder Report
|
|
| Additional Information [Text Block] |
You can find additional information about the Portfolio at https://dfinview.com/BHFT. You can also request this information by contacting us at 1-888-243-1956.
|
|
| Additional Information Phone Number |
1-888-243-1956
|
|
| Additional Information Website |
<span style="box-sizing: border-box; color: rgb(0, 0, 0); display: inline; flex-wrap: nowrap; font-size: 12px; font-weight: 400; grid-area: auto; line-height: 18px; margin: 0px; overflow: visible; text-align: left; text-align-last: auto; white-space-collapse: preserve-breaks;">https://dfinview.com/BHFT</span>
|
|
| Expenses [Text Block] |
What were the Portfolio costs for last six months?This example shows the expenses you would have paid over the reporting period based on a hypothetical $10,000 investment.
Class Name |
Costs of a $10,000 investment |
Costs paid as a percentage of a $10,000 investment |
Class A |
$35 |
0.70%Footnote Reference* |
| Footnote |
Description |
Footnote* |
Annualized. | |
|
| Expenses Paid, Amount |
$ 35
|
|
| Expense Ratio, Percent |
0.70%
|
[23] |
| AssetsNet |
$ 526,055,765
|
|
| Holdings Count | Holding |
459
|
|
| Advisory Fees Paid, Amount |
$ 1,586,486
|
|
| InvestmentCompanyPortfolioTurnover |
12.00%
|
|
| Additional Fund Statistics [Text Block] |
- Total Net Assets$526,055,765
- # of Portfolio Investments459
- Portfolio Turnover Rate12%
- Total Advisory Fees Paid$1,586,486
|
|
| Holdings [Text Block] |
Value |
Value |
Leisure Time |
2.6 |
Entertainment |
2.7 |
Retail |
2.9 |
Building Materials |
3.1 |
Computers |
3.1 |
Chemicals |
3.9 |
Diversified Financial Services |
4.8 |
Insurance |
6.8 |
Commercial Services |
10.2 |
Software |
13.5 |
Value |
Value |
Warrants |
0.0 |
Convertible Preferred Stocks |
0.0Footnote Reference* |
Common Stocks |
1.2 |
Corporate Bonds & Notes |
3.1 |
Short-Term Investments |
4.2 |
Floating Rate Loans |
92.3 |
| Footnote |
Description |
Footnote* |
Amount rounds to less than 0.1% | |
|
| Largest Holdings [Text Block] |
Top 10 Fixed Income Issuers
Quikrete Holdings, Inc. |
1.2 |
Cloud Software Group, Inc. |
1.1 |
UKG, Inc. |
1.1 |
Asurion LLC |
1.1 |
AmWINS Group, Inc. |
1.0 |
TransDigm, Inc. |
1.0 |
INEOS U.S. Finance LLC |
1.0 |
Epicor Software Corp. |
0.9 |
USI, Inc. |
0.8 |
Primo Brands Corp. |
0.8 | |
|
| Material Fund Change [Text Block] |
|
|
| Updated Prospectus Phone Number |
1-888-243-1956
|
|
| Updated Prospectus Web Address |
<span style="box-sizing: border-box; color: rgb(0, 0, 0); display: inline; flex-wrap: nowrap; font-size: 10.6667px; font-weight: 400; grid-area: auto; line-height: 16px; margin: 0px; overflow: visible; text-align: justify; text-align-last: left; white-space-collapse: preserve-breaks;">https://dfinview.com/BHFT</span>
|
|
| C000088088 |
|
|
| Shareholder Report [Line Items] |
|
|
| Fund Name |
Brighthouse/Eaton Vance Floating Rate Portfolio
|
|
| Class Name |
Class B
|
|
| No Trading Symbol [Flag] |
true
|
|
| Annual or Semi-Annual Statement [Text Block] |
This semi-annual shareholder report contains important information about the Brighthouse/Eaton Vance Floating Rate Portfolio (the "Portfolio") for the period of January 1, 2025 to June 30, 2025.
|
|
| Shareholder Report Annual or Semi-Annual |
Semi-Annual Shareholder Report
|
|
| Additional Information [Text Block] |
You can find additional information about the Portfolio at https://dfinview.com/BHFT. You can also request this information by contacting us at 1-888-243-1956.
|
|
| Additional Information Phone Number |
1-888-243-1956
|
|
| Additional Information Website |
<span style="box-sizing: border-box; color: rgb(0, 0, 0); display: inline; flex-wrap: nowrap; font-size: 12px; font-weight: 400; grid-area: auto; line-height: 18px; margin: 0px; overflow: visible; text-align: left; text-align-last: auto; white-space-collapse: preserve-breaks;">https://dfinview.com/BHFT</span>
|
|
| Expenses [Text Block] |
What were the Portfolio costs for last six months?This example shows the expenses you would have paid over the reporting period based on a hypothetical $10,000 investment.
Class Name |
Costs of a $10,000 investment |
Costs paid as a percentage of a $10,000 investment |
Class B |
$48 |
0.95%Footnote Reference* |
| Footnote |
Description |
Footnote* |
Annualized. | |
|
| Expenses Paid, Amount |
$ 48
|
|
| Expense Ratio, Percent |
0.95%
|
[24] |
| AssetsNet |
$ 526,055,765
|
|
| Holdings Count | Holding |
459
|
|
| Advisory Fees Paid, Amount |
$ 1,586,486
|
|
| InvestmentCompanyPortfolioTurnover |
12.00%
|
|
| Additional Fund Statistics [Text Block] |
- Total Net Assets$526,055,765
- # of Portfolio Investments459
- Portfolio Turnover Rate12%
- Total Advisory Fees Paid$1,586,486
|
|
| Holdings [Text Block] |
Value |
Value |
Leisure Time |
2.6 |
Entertainment |
2.7 |
Retail |
2.9 |
Building Materials |
3.1 |
Computers |
3.1 |
Chemicals |
3.9 |
Diversified Financial Services |
4.8 |
Insurance |
6.8 |
Commercial Services |
10.2 |
Software |
13.5 |
Value |
Value |
Warrants |
0.0 |
Convertible Preferred Stocks |
0.0Footnote Reference* |
Common Stocks |
1.2 |
Corporate Bonds & Notes |
3.1 |
Short-Term Investments |
4.2 |
Floating Rate Loans |
92.3 |
| Footnote |
Description |
Footnote* |
Amount rounds to less than 0.1% | |
|
| Largest Holdings [Text Block] |
Top 10 Fixed Income Issuers
Quikrete Holdings, Inc. |
1.2 |
Cloud Software Group, Inc. |
1.1 |
UKG, Inc. |
1.1 |
Asurion LLC |
1.1 |
AmWINS Group, Inc. |
1.0 |
TransDigm, Inc. |
1.0 |
INEOS U.S. Finance LLC |
1.0 |
Epicor Software Corp. |
0.9 |
USI, Inc. |
0.8 |
Primo Brands Corp. |
0.8 | |
|
| Material Fund Change [Text Block] |
|
|
| Updated Prospectus Phone Number |
1-888-243-1956
|
|
| Updated Prospectus Web Address |
<span style="box-sizing: border-box; color: rgb(0, 0, 0); display: inline; flex-wrap: nowrap; font-size: 10.6667px; font-weight: 400; grid-area: auto; line-height: 16px; margin: 0px; overflow: visible; text-align: justify; text-align-last: left; white-space-collapse: preserve-breaks;">https://dfinview.com/BHFT</span>
|
|
| C000100086 |
|
|
| Shareholder Report [Line Items] |
|
|
| Fund Name |
Brighthouse/Franklin Low Duration Total Return Portfolio
|
|
| Class Name |
Class A
|
|
| No Trading Symbol [Flag] |
true
|
|
| Annual or Semi-Annual Statement [Text Block] |
This semi-annual shareholder report contains important information about the Brighthouse/Franklin Low Duration Total Return Portfolio (the "Portfolio") for the period of January 1, 2025 to June 30, 2025.
|
|
| Shareholder Report Annual or Semi-Annual |
Semi-Annual Shareholder Report
|
|
| Additional Information [Text Block] |
You can find additional information about the Portfolio at https://dfinview.com/BHFT. You can also request this information by contacting us at 1-888-243-1956.
|
|
| Additional Information Phone Number |
1-888-243-1956
|
|
| Additional Information Website |
<span style="box-sizing: border-box; color: rgb(0, 0, 0); display: inline; flex-wrap: nowrap; font-size: 12px; font-weight: 400; grid-area: auto; line-height: 18px; margin: 0px; overflow: visible; text-align: left; text-align-last: auto; white-space-collapse: preserve-breaks;">https://dfinview.com/BHFT</span>
|
|
| Expenses [Text Block] |
What were the Portfolio costs for last six months?This example shows the expenses you would have paid over the reporting period based on a hypothetical $10,000 investment.
Class Name |
Costs of a $10,000 investment |
Costs paid as a percentage of a $10,000 investment |
Class A |
$25 |
0.49%Footnote Reference* |
| Footnote |
Description |
Footnote* |
Annualized. | |
|
| Expenses Paid, Amount |
$ 25
|
|
| Expense Ratio, Percent |
0.49%
|
[25] |
| AssetsNet |
$ 586,005,986
|
|
| Holdings Count | Holding |
578
|
|
| Advisory Fees Paid, Amount |
$ 1,316,642
|
|
| InvestmentCompanyPortfolioTurnover |
37.00%
|
|
| Additional Fund Statistics [Text Block] |
- Total Net Assets$586,005,986
- # of Portfolio Investments578
- Portfolio Turnover Rate37%
- Total Advisory Fees Paid$1,316,642
|
|
| Holdings [Text Block] |
Value |
Value |
Common Stocks |
0.0 |
Escrow Shares |
0.0Footnote Reference* |
Foreign Government |
0.2 |
Municipals |
1.8 |
Short-Term Investments |
3.7 |
Floating Rate Loans |
4.1 |
Non-Agency Mortgage-Backed Securities |
7.9 |
Agency Sponsored Mortgage-Backed Securities |
11.2 |
U.S. Treasury & Government Agencies |
16.2 |
Asset-Backed Securities |
16.6 |
Corporate Bonds & Notes |
38.4 |
| Footnote |
Description |
Footnote* |
Amount rounds to less than 0.1% | |
|
| Largest Holdings [Text Block] |
Top 10 Fixed Income Issuers
U.S. Treasury Notes |
12.5 |
Federal National Mortgage Association REMICS |
3.3 |
Federal Home Loan Mortgage Corp. REMICS |
3.0 |
Federal Home Loan Mortgage Corp. |
2.5 |
U.S. Treasury STRIPS Coupon |
2.2 |
Discover Card Execution Note Trust |
1.6 |
American Express Credit Account Master Trust |
1.6 |
U.S. Treasury Inflation-Indexed Notes |
1.5 |
Federal National Mortgage Association Connecticut Avenue Securities Trust |
1.4 |
Goldman Sachs Group, Inc. |
1.3 | |
|
| Updated Prospectus Phone Number |
1-888-243-1956
|
|
| Updated Prospectus Web Address |
<span style="box-sizing: border-box; color: rgb(0, 0, 0); display: inline; flex-wrap: nowrap; font-size: 10.6667px; font-weight: 400; grid-area: auto; line-height: 16px; margin: 0px; overflow: visible; text-align: justify; text-align-last: left; white-space-collapse: preserve-breaks;">https://dfinview.com/BHFT</span>
|
|
| C000100087 |
|
|
| Shareholder Report [Line Items] |
|
|
| Fund Name |
Brighthouse/Franklin Low Duration Total Return Portfolio
|
|
| Class Name |
Class B
|
|
| No Trading Symbol [Flag] |
true
|
|
| Annual or Semi-Annual Statement [Text Block] |
This semi-annual shareholder report contains important information about the Brighthouse/Franklin Low Duration Total Return Portfolio (the "Portfolio") for the period of January 1, 2025 to June 30, 2025.
|
|
| Shareholder Report Annual or Semi-Annual |
Semi-Annual Shareholder Report
|
|
| Additional Information [Text Block] |
You can find additional information about the Portfolio at https://dfinview.com/BHFT. You can also request this information by contacting us at 1-888-243-1956.
|
|
| Additional Information Phone Number |
1-888-243-1956
|
|
| Additional Information Website |
<span style="box-sizing: border-box; color: rgb(0, 0, 0); display: inline; flex-wrap: nowrap; font-size: 12px; font-weight: 400; grid-area: auto; line-height: 18px; margin: 0px; overflow: visible; text-align: left; text-align-last: auto; white-space-collapse: preserve-breaks;">https://dfinview.com/BHFT</span>
|
|
| Expenses [Text Block] |
What were the Portfolio costs for last six months?This example shows the expenses you would have paid over the reporting period based on a hypothetical $10,000 investment.
Class Name |
Costs of a $10,000 investment |
Costs paid as a percentage of a $10,000 investment |
Class B |
$37 |
0.74%Footnote Reference* |
| Footnote |
Description |
Footnote* |
Annualized. | |
|
| Expenses Paid, Amount |
$ 37
|
|
| Expense Ratio, Percent |
0.74%
|
[26] |
| AssetsNet |
$ 586,005,986
|
|
| Holdings Count | Holding |
578
|
|
| Advisory Fees Paid, Amount |
$ 1,316,642
|
|
| InvestmentCompanyPortfolioTurnover |
37.00%
|
|
| Additional Fund Statistics [Text Block] |
- Total Net Assets$586,005,986
- # of Portfolio Investments578
- Portfolio Turnover Rate37%
- Total Advisory Fees Paid$1,316,642
|
|
| Holdings [Text Block] |
Value |
Value |
Common Stocks |
0.0 |
Escrow Shares |
0.0Footnote Reference* |
Foreign Government |
0.2 |
Municipals |
1.8 |
Short-Term Investments |
3.7 |
Floating Rate Loans |
4.1 |
Non-Agency Mortgage-Backed Securities |
7.9 |
Agency Sponsored Mortgage-Backed Securities |
11.2 |
U.S. Treasury & Government Agencies |
16.2 |
Asset-Backed Securities |
16.6 |
Corporate Bonds & Notes |
38.4 |
| Footnote |
Description |
Footnote* |
Amount rounds to less than 0.1% | |
|
| Largest Holdings [Text Block] |
Top 10 Fixed Income Issuers
U.S. Treasury Notes |
12.5 |
Federal National Mortgage Association REMICS |
3.3 |
Federal Home Loan Mortgage Corp. REMICS |
3.0 |
Federal Home Loan Mortgage Corp. |
2.5 |
U.S. Treasury STRIPS Coupon |
2.2 |
Discover Card Execution Note Trust |
1.6 |
American Express Credit Account Master Trust |
1.6 |
U.S. Treasury Inflation-Indexed Notes |
1.5 |
Federal National Mortgage Association Connecticut Avenue Securities Trust |
1.4 |
Goldman Sachs Group, Inc. |
1.3 | |
|
| Updated Prospectus Phone Number |
1-888-243-1956
|
|
| Updated Prospectus Web Address |
<span style="box-sizing: border-box; color: rgb(0, 0, 0); display: inline; flex-wrap: nowrap; font-size: 10.6667px; font-weight: 400; grid-area: auto; line-height: 16px; margin: 0px; overflow: visible; text-align: justify; text-align-last: left; white-space-collapse: preserve-breaks;">https://dfinview.com/BHFT</span>
|
|
| C000075557 |
|
|
| Shareholder Report [Line Items] |
|
|
| Fund Name |
Brighthouse/Templeton International Bond Portfolio
|
|
| Class Name |
Class A
|
|
| No Trading Symbol [Flag] |
true
|
|
| Annual or Semi-Annual Statement [Text Block] |
This semi-annual shareholder report contains important information about the Brighthouse/Templeton International Bond Portfolio (the "Portfolio") for the period of January 1, 2025 to June 30, 2025.
|
|
| Shareholder Report Annual or Semi-Annual |
Semi-Annual Shareholder Report
|
|
| Additional Information [Text Block] |
You can find additional information about the Portfolio at https://dfinview.com/BHFT. You can also request this information by contacting us at 1-888-243-1956.
|
|
| Additional Information Phone Number |
1-888-243-1956
|
|
| Additional Information Website |
<span style="box-sizing: border-box; color: rgb(0, 0, 0); display: inline; flex-wrap: nowrap; font-size: 12px; font-weight: 400; grid-area: auto; line-height: 18px; margin: 0px; overflow: visible; text-align: left; text-align-last: auto; white-space-collapse: preserve-breaks;">https://dfinview.com/BHFT</span>
|
|
| Expenses [Text Block] |
What were the Portfolio costs for last six months?This example shows the expenses you would have paid over the reporting period based on a hypothetical $10,000 investment.
Class Name |
Costs of a $10,000 investment |
Costs paid as a percentage of a $10,000 investment |
Class A |
$37 |
0.69%Footnote Reference* |
| Footnote |
Description |
Footnote* |
Annualized. | |
|
| Expenses Paid, Amount |
$ 37
|
|
| Expense Ratio, Percent |
0.69%
|
[27] |
| AssetsNet |
$ 356,874,677
|
|
| Holdings Count | Holding |
133
|
|
| Advisory Fees Paid, Amount |
$ 1,181,552
|
|
| InvestmentCompanyPortfolioTurnover |
16.00%
|
|
| Additional Fund Statistics [Text Block] |
- Total Net Assets$356,874,677
- # of Portfolio Investments133
- Portfolio Turnover Rate16%
- Total Advisory Fees Paid$1,181,552
|
|
| Holdings [Text Block] |
Value |
Value |
Corporate Bonds & Notes |
4.4 |
Short-Term Investments |
11.7 |
Foreign Government |
81.4 |
Value |
Value |
Norway |
4.4 |
Panama |
4.5 |
Spain |
4.5 |
South Africa |
6.1 |
India |
6.5 |
Colombia |
6.8 |
Egypt |
7.7 |
Malaysia |
8.7 |
Brazil |
8.8 |
Australia |
10.5 | |
|
| Largest Holdings [Text Block] |
Top 10 Fixed Income Issuers
Brazil Notas do Tesouro Nacional |
8.8 |
Malaysia Government Bonds |
8.7 |
Colombia TES |
6.8 |
India Government Bonds |
6.6 |
Republic of South Africa Government Bonds |
6.1 |
Egypt Treasury Bills |
5.4 |
Spain Government Bonds |
4.5 |
Panama Government International Bonds |
4.5 |
Norway Government Bonds |
4.5 |
International Bank for Reconstruction & Development |
4.4 | |
|
| Material Fund Change [Text Block] |
|
|
| Updated Prospectus Phone Number |
1-888-243-1956
|
|
| Updated Prospectus Web Address |
<span style="box-sizing: border-box; color: rgb(0, 0, 0); display: inline; flex-wrap: nowrap; font-size: 10.6667px; font-weight: 400; grid-area: auto; line-height: 16px; margin: 0px; overflow: visible; text-align: justify; text-align-last: left; white-space-collapse: preserve-breaks;">https://dfinview.com/BHFT</span>
|
|
| C000075558 |
|
|
| Shareholder Report [Line Items] |
|
|
| Fund Name |
Brighthouse/Templeton International Bond Portfolio
|
|
| Class Name |
Class B
|
|
| No Trading Symbol [Flag] |
true
|
|
| Annual or Semi-Annual Statement [Text Block] |
This semi-annual shareholder report contains important information about the Brighthouse/Templeton International Bond Portfolio (the "Portfolio") for the period of January 1, 2025 to June 30, 2025.
|
|
| Shareholder Report Annual or Semi-Annual |
Semi-Annual Shareholder Report
|
|
| Additional Information [Text Block] |
You can find additional information about the Portfolio at https://dfinview.com/BHFT. You can also request this information by contacting us at 1-888-243-1956.
|
|
| Additional Information Phone Number |
1-888-243-1956
|
|
| Additional Information Website |
<span style="box-sizing: border-box; color: rgb(0, 0, 0); display: inline; flex-wrap: nowrap; font-size: 12px; font-weight: 400; grid-area: auto; line-height: 18px; margin: 0px; overflow: visible; text-align: left; text-align-last: auto; white-space-collapse: preserve-breaks;">https://dfinview.com/BHFT</span>
|
|
| Expenses [Text Block] |
What were the Portfolio costs for last six months?This example shows the expenses you would have paid over the reporting period based on a hypothetical $10,000 investment.
Class Name |
Costs of a $10,000 investment |
Costs paid as a percentage of a $10,000 investment |
Class B |
$50 |
0.94%Footnote Reference* |
| Footnote |
Description |
Footnote* |
Annualized. | |
|
| Expenses Paid, Amount |
$ 50
|
|
| Expense Ratio, Percent |
0.94%
|
[28] |
| AssetsNet |
$ 356,874,677
|
|
| Holdings Count | Holding |
133
|
|
| Advisory Fees Paid, Amount |
$ 1,181,552
|
|
| InvestmentCompanyPortfolioTurnover |
16.00%
|
|
| Additional Fund Statistics [Text Block] |
- Total Net Assets$356,874,677
- # of Portfolio Investments133
- Portfolio Turnover Rate16%
- Total Advisory Fees Paid$1,181,552
|
|
| Holdings [Text Block] |
Value |
Value |
Corporate Bonds & Notes |
4.4 |
Short-Term Investments |
11.7 |
Foreign Government |
81.4 |
Value |
Value |
Norway |
4.4 |
Panama |
4.5 |
Spain |
4.5 |
South Africa |
6.1 |
India |
6.5 |
Colombia |
6.8 |
Egypt |
7.7 |
Malaysia |
8.7 |
Brazil |
8.8 |
Australia |
10.5 | |
|
| Largest Holdings [Text Block] |
Top 10 Fixed Income Issuers
Brazil Notas do Tesouro Nacional |
8.8 |
Malaysia Government Bonds |
8.7 |
Colombia TES |
6.8 |
India Government Bonds |
6.6 |
Republic of South Africa Government Bonds |
6.1 |
Egypt Treasury Bills |
5.4 |
Spain Government Bonds |
4.5 |
Panama Government International Bonds |
4.5 |
Norway Government Bonds |
4.5 |
International Bank for Reconstruction & Development |
4.4 | |
|
| Material Fund Change [Text Block] |
|
|
| Updated Prospectus Phone Number |
1-888-243-1956
|
|
| Updated Prospectus Web Address |
<span style="box-sizing: border-box; color: rgb(0, 0, 0); display: inline; flex-wrap: nowrap; font-size: 10.6667px; font-weight: 400; grid-area: auto; line-height: 16px; margin: 0px; overflow: visible; text-align: justify; text-align-last: left; white-space-collapse: preserve-breaks;">https://dfinview.com/BHFT</span>
|
|
| C000030760 |
|
|
| Shareholder Report [Line Items] |
|
|
| Fund Name |
Brighthouse/Wellington Large Cap Research Portfolio
|
|
| Class Name |
Class A
|
|
| No Trading Symbol [Flag] |
true
|
|
| Annual or Semi-Annual Statement [Text Block] |
This semi-annual shareholder report contains important information about the Brighthouse/Wellington Large Cap Research Portfolio (the "Portfolio") for the period of January 1, 2025 to June 30, 2025.
|
|
| Shareholder Report Annual or Semi-Annual |
Semi-Annual Shareholder Report
|
|
| Additional Information [Text Block] |
You can find additional information about the Portfolio at https://dfinview.com/BHFT. You can also request this information by contacting us at 1-888-243-1956.
|
|
| Additional Information Phone Number |
1-888-243-1956
|
|
| Additional Information Website |
<span style="box-sizing: border-box; color: rgb(0, 0, 0); display: inline; flex-wrap: nowrap; font-size: 12px; font-weight: 400; grid-area: auto; line-height: 18px; margin: 0px; overflow: visible; text-align: left; text-align-last: auto; white-space-collapse: preserve-breaks;">https://dfinview.com/BHFT</span>
|
|
| Expenses [Text Block] |
What were the Portfolio costs for last six months?This example shows the expenses you would have paid over the reporting period based on a hypothetical $10,000 investment.
Class Name |
Costs of a $10,000 investment |
Costs paid as a percentage of a $10,000 investment |
Class A |
$26 |
0.51%Footnote Reference* |
| Footnote |
Description |
Footnote* |
Annualized. | |
|
| Expenses Paid, Amount |
$ 26
|
|
| Expense Ratio, Percent |
0.51%
|
[29] |
| AssetsNet |
$ 2,405,636,481
|
|
| Holdings Count | Holding |
197
|
|
| Advisory Fees Paid, Amount |
$ 5,631,796
|
|
| InvestmentCompanyPortfolioTurnover |
40.00%
|
|
| Additional Fund Statistics [Text Block] |
- Total Net Assets$2,405,636,481
- # of Portfolio Investments197
- Portfolio Turnover Rate40%
- Total Advisory Fees Paid$5,631,796
|
|
| Holdings [Text Block] |
Value |
Value |
Materials |
2.3 |
Utilities |
2.7 |
Energy |
3.9 |
Consumer Staples |
5.5 |
Industrials |
5.7 |
Communication Services |
8.9 |
Health Care |
10.8 |
Consumer Discretionary |
11.6 |
Financials |
14.0 |
Information Technology |
32.2 |
Value |
Value |
Bermuda |
0.1 |
Sweden |
0.2 |
Denmark |
0.2 |
Germany |
0.7 |
Netherlands |
0.9 |
United Kingdom |
1.3 |
United States |
95.3 | |
|
| Largest Holdings [Text Block] |
NVIDIA Corp. |
8.0 |
Microsoft Corp. |
7.4 |
Apple, Inc. |
5.1 |
Alphabet, Inc. |
4.5 |
Amazon.com, Inc. |
4.4 |
Wells Fargo & Co. |
3.4 |
Broadcom, Inc. |
3.2 |
Berkshire Hathaway, Inc. |
1.9 |
Mastercard, Inc. |
1.8 |
Exxon Mobil Corp. |
1.7 | |
|
| Material Fund Change [Text Block] |
|
|
| Updated Prospectus Phone Number |
1-888-243-1956
|
|
| Updated Prospectus Web Address |
<span style="box-sizing: border-box; color: rgb(0, 0, 0); display: inline; flex-wrap: nowrap; font-size: 10.6667px; font-weight: 400; grid-area: auto; line-height: 16px; margin: 0px; overflow: visible; text-align: justify; text-align-last: left; white-space-collapse: preserve-breaks;">https://dfinview.com/BHFT</span>
|
|
| C000030761 |
|
|
| Shareholder Report [Line Items] |
|
|
| Fund Name |
Brighthouse/Wellington Large Cap Research Portfolio
|
|
| Class Name |
Class B
|
|
| No Trading Symbol [Flag] |
true
|
|
| Annual or Semi-Annual Statement [Text Block] |
This semi-annual shareholder report contains important information about the Brighthouse/Wellington Large Cap Research Portfolio (the "Portfolio") for the period of January 1, 2025 to June 30, 2025.
|
|
| Shareholder Report Annual or Semi-Annual |
Semi-Annual Shareholder Report
|
|
| Additional Information [Text Block] |
You can find additional information about the Portfolio at https://dfinview.com/BHFT. You can also request this information by contacting us at 1-888-243-1956.
|
|
| Additional Information Phone Number |
1-888-243-1956
|
|
| Additional Information Website |
<span style="box-sizing: border-box; color: rgb(0, 0, 0); display: inline; flex-wrap: nowrap; font-size: 12px; font-weight: 400; grid-area: auto; line-height: 18px; margin: 0px; overflow: visible; text-align: left; text-align-last: auto; white-space-collapse: preserve-breaks;">https://dfinview.com/BHFT</span>
|
|
| Expenses [Text Block] |
What were the Portfolio costs for last six months?This example shows the expenses you would have paid over the reporting period based on a hypothetical $10,000 investment.
Class Name |
Costs of a $10,000 investment |
Costs paid as a percentage of a $10,000 investment |
Class B |
$39 |
0.76%Footnote Reference* |
| Footnote |
Description |
Footnote* |
Annualized. | |
|
| Expenses Paid, Amount |
$ 39
|
|
| Expense Ratio, Percent |
0.76%
|
[30] |
| AssetsNet |
$ 2,405,636,481
|
|
| Holdings Count | Holding |
197
|
|
| Advisory Fees Paid, Amount |
$ 5,631,796
|
|
| InvestmentCompanyPortfolioTurnover |
40.00%
|
|
| Additional Fund Statistics [Text Block] |
- Total Net Assets$2,405,636,481
- # of Portfolio Investments197
- Portfolio Turnover Rate40%
- Total Advisory Fees Paid$5,631,796
|
|
| Holdings [Text Block] |
Value |
Value |
Materials |
2.3 |
Utilities |
2.7 |
Energy |
3.9 |
Consumer Staples |
5.5 |
Industrials |
5.7 |
Communication Services |
8.9 |
Health Care |
10.8 |
Consumer Discretionary |
11.6 |
Financials |
14.0 |
Information Technology |
32.2 |
Value |
Value |
Bermuda |
0.1 |
Sweden |
0.2 |
Denmark |
0.2 |
Germany |
0.7 |
Netherlands |
0.9 |
United Kingdom |
1.3 |
United States |
95.3 | |
|
| Largest Holdings [Text Block] |
NVIDIA Corp. |
8.0 |
Microsoft Corp. |
7.4 |
Apple, Inc. |
5.1 |
Alphabet, Inc. |
4.5 |
Amazon.com, Inc. |
4.4 |
Wells Fargo & Co. |
3.4 |
Broadcom, Inc. |
3.2 |
Berkshire Hathaway, Inc. |
1.9 |
Mastercard, Inc. |
1.8 |
Exxon Mobil Corp. |
1.7 | |
|
| Material Fund Change [Text Block] |
|
|
| Updated Prospectus Phone Number |
1-888-243-1956
|
|
| Updated Prospectus Web Address |
<span style="box-sizing: border-box; color: rgb(0, 0, 0); display: inline; flex-wrap: nowrap; font-size: 10.6667px; font-weight: 400; grid-area: auto; line-height: 16px; margin: 0px; overflow: visible; text-align: justify; text-align-last: left; white-space-collapse: preserve-breaks;">https://dfinview.com/BHFT</span>
|
|
| C000030763 |
|
|
| Shareholder Report [Line Items] |
|
|
| Fund Name |
Brighthouse/Wellington Large Cap Research Portfolio
|
|
| Class Name |
Class E
|
|
| No Trading Symbol [Flag] |
true
|
|
| Annual or Semi-Annual Statement [Text Block] |
This semi-annual shareholder report contains important information about the Brighthouse/Wellington Large Cap Research Portfolio (the "Portfolio") for the period of January 1, 2025 to June 30, 2025.
|
|
| Shareholder Report Annual or Semi-Annual |
Semi-Annual Shareholder Report
|
|
| Additional Information [Text Block] |
You can find additional information about the Portfolio at https://dfinview.com/BHFT. You can also request this information by contacting us at 1-888-243-1956.
|
|
| Additional Information Phone Number |
1-888-243-1956
|
|
| Additional Information Website |
<span style="box-sizing: border-box; color: rgb(0, 0, 0); display: inline; flex-wrap: nowrap; font-size: 12px; font-weight: 400; grid-area: auto; line-height: 18px; margin: 0px; overflow: visible; text-align: left; text-align-last: auto; white-space-collapse: preserve-breaks;">https://dfinview.com/BHFT</span>
|
|
| Expenses [Text Block] |
What were the Portfolio costs for last six months?This example shows the expenses you would have paid over the reporting period based on a hypothetical $10,000 investment.
Class Name |
Costs of a $10,000 investment |
Costs paid as a percentage of a $10,000 investment |
Class E |
$33 |
0.66%Footnote Reference* |
| Footnote |
Description |
Footnote* |
Annualized. | |
|
| Expenses Paid, Amount |
$ 33
|
|
| Expense Ratio, Percent |
0.66%
|
[31] |
| AssetsNet |
$ 2,405,636,481
|
|
| Holdings Count | Holding |
197
|
|
| Advisory Fees Paid, Amount |
$ 5,631,796
|
|
| InvestmentCompanyPortfolioTurnover |
40.00%
|
|
| Additional Fund Statistics [Text Block] |
- Total Net Assets$2,405,636,481
- # of Portfolio Investments197
- Portfolio Turnover Rate40%
- Total Advisory Fees Paid$5,631,796
|
|
| Holdings [Text Block] |
Value |
Value |
Materials |
2.3 |
Utilities |
2.7 |
Energy |
3.9 |
Consumer Staples |
5.5 |
Industrials |
5.7 |
Communication Services |
8.9 |
Health Care |
10.8 |
Consumer Discretionary |
11.6 |
Financials |
14.0 |
Information Technology |
32.2 |
Value |
Value |
Bermuda |
0.1 |
Sweden |
0.2 |
Denmark |
0.2 |
Germany |
0.7 |
Netherlands |
0.9 |
United Kingdom |
1.3 |
United States |
95.3 | |
|
| Largest Holdings [Text Block] |
NVIDIA Corp. |
8.0 |
Microsoft Corp. |
7.4 |
Apple, Inc. |
5.1 |
Alphabet, Inc. |
4.5 |
Amazon.com, Inc. |
4.4 |
Wells Fargo & Co. |
3.4 |
Broadcom, Inc. |
3.2 |
Berkshire Hathaway, Inc. |
1.9 |
Mastercard, Inc. |
1.8 |
Exxon Mobil Corp. |
1.7 | |
|
| Material Fund Change [Text Block] |
|
|
| Updated Prospectus Phone Number |
1-888-243-1956
|
|
| Updated Prospectus Web Address |
<span style="box-sizing: border-box; color: rgb(0, 0, 0); display: inline; flex-wrap: nowrap; font-size: 10.6667px; font-weight: 400; grid-area: auto; line-height: 16px; margin: 0px; overflow: visible; text-align: justify; text-align-last: left; white-space-collapse: preserve-breaks;">https://dfinview.com/BHFT</span>
|
|
| C000030620 |
|
|
| Shareholder Report [Line Items] |
|
|
| Fund Name |
CBRE Global Real Estate Portfolio
|
|
| Class Name |
Class A
|
|
| No Trading Symbol [Flag] |
true
|
|
| Annual or Semi-Annual Statement [Text Block] |
This semi-annual shareholder report contains important information about the CBRE Global Real Estate Portfolio (the "Portfolio") for the period of January 1, 2025 to June 30, 2025.
|
|
| Shareholder Report Annual or Semi-Annual |
Semi-Annual Shareholder Report
|
|
| Additional Information [Text Block] |
You can find additional information about the Portfolio at https://dfinview.com/BHFT. You can also request this information by contacting us at 1-888-243-1956.
|
|
| Additional Information Phone Number |
1-888-243-1956
|
|
| Additional Information Website |
<span style="box-sizing: border-box; color: rgb(0, 0, 0); display: inline; flex-wrap: nowrap; font-size: 12px; font-weight: 400; grid-area: auto; line-height: 18px; margin: 0px; overflow: visible; text-align: left; text-align-last: auto; white-space-collapse: preserve-breaks;">https://dfinview.com/BHFT</span>
|
|
| Expenses [Text Block] |
What were the Portfolio costs for last six months?This example shows the expenses you would have paid over the reporting period based on a hypothetical $10,000 investment.
Class Name |
Costs of a $10,000 investment |
Costs paid as a percentage of a $10,000 investment |
Class A |
$34 |
0.66%Footnote Reference* |
| Footnote |
Description |
Footnote* |
Annualized. | |
|
| Expenses Paid, Amount |
$ 34
|
|
| Expense Ratio, Percent |
0.66%
|
[32] |
| AssetsNet |
$ 862,369,998
|
|
| Holdings Count | Holding |
98
|
|
| Advisory Fees Paid, Amount |
$ 2,574,048
|
|
| InvestmentCompanyPortfolioTurnover |
55.00%
|
|
| Additional Fund Statistics [Text Block] |
- Total Net Assets$862,369,998
- # of Portfolio Investments98
- Portfolio Turnover Rate55%
- Total Advisory Fees Paid$2,574,048
|
|
| Holdings [Text Block] |
Value |
Value |
Hotels, Restaurants & Leisure |
1.0 |
Hotel & Resort REITs |
1.7 |
Office REITs |
4.1 |
Diversified REITs |
6.0 |
Health Care REITs |
9.3 |
Residential REITs |
9.4 |
Real Estate Management & Development |
9.5 |
Industrial REITs |
13.3 |
Specialized REITs |
20.9 |
Retail REITs |
23.9 |
Value |
Value |
Belgium |
1.0 |
Canada |
1.6 |
Germany |
1.8 |
Singapore |
3.2 |
Hong Kong |
3.4 |
France |
4.2 |
United Kingdom |
4.5 |
Australia |
5.9 |
Japan |
9.3 |
United States |
62.5 | |
|
| Largest Holdings [Text Block] |
Welltower, Inc. |
7.1 |
Simon Property Group, Inc. |
5.2 |
Equinix, Inc. |
4.9 |
Realty Income Corp. |
4.6 |
Extra Space Storage, Inc. |
3.0 |
VICI Properties, Inc. |
2.9 |
Public Storage |
2.9 |
Digital Realty Trust, Inc. |
2.9 |
Goodman Group |
2.7 |
Iron Mountain, Inc. |
2.2 | |
|
| Material Fund Change [Text Block] |
|
|
| Updated Prospectus Phone Number |
1-888-243-1956
|
|
| Updated Prospectus Web Address |
<span style="box-sizing: border-box; color: rgb(0, 0, 0); display: inline; flex-wrap: nowrap; font-size: 10.6667px; font-weight: 400; grid-area: auto; line-height: 16px; margin: 0px; overflow: visible; text-align: justify; text-align-last: left; white-space-collapse: preserve-breaks;">https://dfinview.com/BHFT</span>
|
|
| C000030621 |
|
|
| Shareholder Report [Line Items] |
|
|
| Fund Name |
CBRE Global Real Estate Portfolio
|
|
| Class Name |
Class B
|
|
| No Trading Symbol [Flag] |
true
|
|
| Annual or Semi-Annual Statement [Text Block] |
This semi-annual shareholder report contains important information about the CBRE Global Real Estate Portfolio (the "Portfolio") for the period of January 1, 2025 to June 30, 2025.
|
|
| Shareholder Report Annual or Semi-Annual |
Semi-Annual Shareholder Report
|
|
| Additional Information [Text Block] |
You can find additional information about the Portfolio at https://dfinview.com/BHFT. You can also request this information by contacting us at 1-888-243-1956.
|
|
| Additional Information Phone Number |
1-888-243-1956
|
|
| Additional Information Website |
<span style="box-sizing: border-box; color: rgb(0, 0, 0); display: inline; flex-wrap: nowrap; font-size: 12px; font-weight: 400; grid-area: auto; line-height: 18px; margin: 0px; overflow: visible; text-align: left; text-align-last: auto; white-space-collapse: preserve-breaks;">https://dfinview.com/BHFT</span>
|
|
| Expenses [Text Block] |
What were the Portfolio costs for last six months?This example shows the expenses you would have paid over the reporting period based on a hypothetical $10,000 investment.
Class Name |
Costs of a $10,000 investment |
Costs paid as a percentage of a $10,000 investment |
Class B |
$46 |
0.91%Footnote Reference* |
| Footnote |
Description |
Footnote* |
Annualized. | |
|
| Expenses Paid, Amount |
$ 46
|
|
| Expense Ratio, Percent |
0.91%
|
[33] |
| AssetsNet |
$ 862,369,998
|
|
| Holdings Count | Holding |
98
|
|
| Advisory Fees Paid, Amount |
$ 2,574,048
|
|
| InvestmentCompanyPortfolioTurnover |
55.00%
|
|
| Additional Fund Statistics [Text Block] |
- Total Net Assets$862,369,998
- # of Portfolio Investments98
- Portfolio Turnover Rate55%
- Total Advisory Fees Paid$2,574,048
|
|
| Holdings [Text Block] |
Value |
Value |
Hotels, Restaurants & Leisure |
1.0 |
Hotel & Resort REITs |
1.7 |
Office REITs |
4.1 |
Diversified REITs |
6.0 |
Health Care REITs |
9.3 |
Residential REITs |
9.4 |
Real Estate Management & Development |
9.5 |
Industrial REITs |
13.3 |
Specialized REITs |
20.9 |
Retail REITs |
23.9 |
Value |
Value |
Belgium |
1.0 |
Canada |
1.6 |
Germany |
1.8 |
Singapore |
3.2 |
Hong Kong |
3.4 |
France |
4.2 |
United Kingdom |
4.5 |
Australia |
5.9 |
Japan |
9.3 |
United States |
62.5 | |
|
| Largest Holdings [Text Block] |
Welltower, Inc. |
7.1 |
Simon Property Group, Inc. |
5.2 |
Equinix, Inc. |
4.9 |
Realty Income Corp. |
4.6 |
Extra Space Storage, Inc. |
3.0 |
VICI Properties, Inc. |
2.9 |
Public Storage |
2.9 |
Digital Realty Trust, Inc. |
2.9 |
Goodman Group |
2.7 |
Iron Mountain, Inc. |
2.2 | |
|
| Material Fund Change [Text Block] |
|
|
| Updated Prospectus Phone Number |
1-888-243-1956
|
|
| Updated Prospectus Web Address |
<span style="box-sizing: border-box; color: rgb(0, 0, 0); display: inline; flex-wrap: nowrap; font-size: 10.6667px; font-weight: 400; grid-area: auto; line-height: 16px; margin: 0px; overflow: visible; text-align: justify; text-align-last: left; white-space-collapse: preserve-breaks;">https://dfinview.com/BHFT</span>
|
|
| C000030623 |
|
|
| Shareholder Report [Line Items] |
|
|
| Fund Name |
CBRE Global Real Estate Portfolio
|
|
| Class Name |
Class E
|
|
| No Trading Symbol [Flag] |
true
|
|
| Annual or Semi-Annual Statement [Text Block] |
This semi-annual shareholder report contains important information about the CBRE Global Real Estate Portfolio (the "Portfolio") for the period of January 1, 2025 to June 30, 2025.
|
|
| Shareholder Report Annual or Semi-Annual |
Semi-Annual Shareholder Report
|
|
| Additional Information [Text Block] |
You can find additional information about the Portfolio at https://dfinview.com/BHFT. You can also request this information by contacting us at 1-888-243-1956.
|
|
| Additional Information Phone Number |
1-888-243-1956
|
|
| Additional Information Website |
<span style="box-sizing: border-box; color: rgb(0, 0, 0); display: inline; flex-wrap: nowrap; font-size: 12px; font-weight: 400; grid-area: auto; line-height: 18px; margin: 0px; overflow: visible; text-align: left; text-align-last: auto; white-space-collapse: preserve-breaks;">https://dfinview.com/BHFT</span>
|
|
| Expenses [Text Block] |
What were the Portfolio costs for last six months?This example shows the expenses you would have paid over the reporting period based on a hypothetical $10,000 investment.
Class Name |
Costs of a $10,000 investment |
Costs paid as a percentage of a $10,000 investment |
Class E |
$41 |
0.81%Footnote Reference* |
| Footnote |
Description |
Footnote* |
Annualized. | |
|
| Expenses Paid, Amount |
$ 41
|
|
| Expense Ratio, Percent |
0.81%
|
[34] |
| AssetsNet |
$ 862,369,998
|
|
| Holdings Count | Holding |
98
|
|
| Advisory Fees Paid, Amount |
$ 2,574,048
|
|
| InvestmentCompanyPortfolioTurnover |
55.00%
|
|
| Additional Fund Statistics [Text Block] |
- Total Net Assets$862,369,998
- # of Portfolio Investments98
- Portfolio Turnover Rate55%
- Total Advisory Fees Paid$2,574,048
|
|
| Holdings [Text Block] |
Value |
Value |
Hotels, Restaurants & Leisure |
1.0 |
Hotel & Resort REITs |
1.7 |
Office REITs |
4.1 |
Diversified REITs |
6.0 |
Health Care REITs |
9.3 |
Residential REITs |
9.4 |
Real Estate Management & Development |
9.5 |
Industrial REITs |
13.3 |
Specialized REITs |
20.9 |
Retail REITs |
23.9 |
Value |
Value |
Belgium |
1.0 |
Canada |
1.6 |
Germany |
1.8 |
Singapore |
3.2 |
Hong Kong |
3.4 |
France |
4.2 |
United Kingdom |
4.5 |
Australia |
5.9 |
Japan |
9.3 |
United States |
62.5 | |
|
| Largest Holdings [Text Block] |
Welltower, Inc. |
7.1 |
Simon Property Group, Inc. |
5.2 |
Equinix, Inc. |
4.9 |
Realty Income Corp. |
4.6 |
Extra Space Storage, Inc. |
3.0 |
VICI Properties, Inc. |
2.9 |
Public Storage |
2.9 |
Digital Realty Trust, Inc. |
2.9 |
Goodman Group |
2.7 |
Iron Mountain, Inc. |
2.2 | |
|
| Material Fund Change [Text Block] |
|
|
| Updated Prospectus Phone Number |
1-888-243-1956
|
|
| Updated Prospectus Web Address |
<span style="box-sizing: border-box; color: rgb(0, 0, 0); display: inline; flex-wrap: nowrap; font-size: 10.6667px; font-weight: 400; grid-area: auto; line-height: 16px; margin: 0px; overflow: visible; text-align: justify; text-align-last: left; white-space-collapse: preserve-breaks;">https://dfinview.com/BHFT</span>
|
|
| C000030710 |
|
|
| Shareholder Report [Line Items] |
|
|
| Fund Name |
Harris Oakmark International Portfolio
|
|
| Class Name |
Class A
|
|
| No Trading Symbol [Flag] |
true
|
|
| Annual or Semi-Annual Statement [Text Block] |
This semi-annual shareholder report contains important information about the Harris Oakmark International Portfolio (the "Portfolio") for the period of January 1, 2025 to June 30, 2025.
|
|
| Shareholder Report Annual or Semi-Annual |
Semi-Annual Shareholder Report
|
|
| Additional Information [Text Block] |
You can find additional information about the Portfolio at https://dfinview.com/BHFT. You can also request this information by contacting us at 1-888-243-1956.
|
|
| Additional Information Phone Number |
1-888-243-1956
|
|
| Additional Information Website |
<span style="box-sizing: border-box; color: rgb(0, 0, 0); display: inline; flex-wrap: nowrap; font-size: 12px; font-weight: 400; grid-area: auto; line-height: 18px; margin: 0px; overflow: visible; text-align: left; text-align-last: auto; white-space-collapse: preserve-breaks;">https://dfinview.com/BHFT</span>
|
|
| Expenses [Text Block] |
What were the Portfolio costs for last six months?This example shows the expenses you would have paid over the reporting period based on a hypothetical $10,000 investment.
Class Name |
Costs of a $10,000 investment |
Costs paid as a percentage of a $10,000 investment |
Class A |
$40 |
0.72%Footnote Reference* |
| Footnote |
Description |
Footnote* |
Annualized. | |
|
| Expenses Paid, Amount |
$ 40
|
|
| Expense Ratio, Percent |
0.72%
|
[35] |
| AssetsNet |
$ 2,091,295,892
|
|
| Holdings Count | Holding |
78
|
|
| Advisory Fees Paid, Amount |
$ 6,954,756
|
|
| InvestmentCompanyPortfolioTurnover |
23.00%
|
|
| Additional Fund Statistics [Text Block] |
- Total Net Assets$2,091,295,892
- # of Portfolio Investments78
- Portfolio Turnover Rate23%
- Total Advisory Fees Paid$6,954,756
|
|
| Holdings [Text Block] |
Value |
Value |
Real Estate |
0.6 |
Communication Services |
3.0 |
Materials |
6.0 |
Information Technology |
6.5 |
Consumer Staples |
7.3 |
Health Care |
12.1 |
Financials |
19.0 |
Consumer Discretionary |
21.1 |
Industrials |
21.5 |
Value |
Value |
China |
3.2 |
Australia |
3.2 |
Sweden |
3.5 |
Japan |
3.8 |
South Korea |
4.7 |
United States |
5.0 |
Netherlands |
6.4 |
United Kingdom |
13.1 |
France |
19.3 |
Germany |
22.7 | |
|
| Largest Holdings [Text Block] |
Glencore PLC |
3.2 |
BNP Paribas SA |
3.0 |
Kering SA |
3.0 |
Continental AG |
2.8 |
CNH Industrial NV |
2.8 |
Bayer AG |
2.6 |
Fresenius Medical Care AG |
2.4 |
Ashtead Group PLC |
2.4 |
Bayerische Motoren Werke AG |
2.4 |
KB Financial Group, Inc. |
2.3 | |
|
| Material Fund Change [Text Block] |
|
|
| Updated Prospectus Phone Number |
1-888-243-1956
|
|
| Updated Prospectus Web Address |
<span style="box-sizing: border-box; color: rgb(0, 0, 0); display: inline; flex-wrap: nowrap; font-size: 10.6667px; font-weight: 400; grid-area: auto; line-height: 16px; margin: 0px; overflow: visible; text-align: justify; text-align-last: left; white-space-collapse: preserve-breaks;">https://dfinview.com/BHFT</span>
|
|
| C000030711 |
|
|
| Shareholder Report [Line Items] |
|
|
| Fund Name |
Harris Oakmark International Portfolio
|
|
| Class Name |
Class B
|
|
| No Trading Symbol [Flag] |
true
|
|
| Annual or Semi-Annual Statement [Text Block] |
This semi-annual shareholder report contains important information about the Harris Oakmark International Portfolio (the "Portfolio") for the period of January 1, 2025 to June 30, 2025.
|
|
| Shareholder Report Annual or Semi-Annual |
Semi-Annual Shareholder Report
|
|
| Additional Information [Text Block] |
You can find additional information about the Portfolio at https://dfinview.com/BHFT. You can also request this information by contacting us at 1-888-243-1956.
|
|
| Additional Information Phone Number |
1-888-243-1956
|
|
| Additional Information Website |
<span style="box-sizing: border-box; color: rgb(0, 0, 0); display: inline; flex-wrap: nowrap; font-size: 12px; font-weight: 400; grid-area: auto; line-height: 18px; margin: 0px; overflow: visible; text-align: left; text-align-last: auto; white-space-collapse: preserve-breaks;">https://dfinview.com/BHFT</span>
|
|
| Expenses [Text Block] |
What were the Portfolio costs for last six months?This example shows the expenses you would have paid over the reporting period based on a hypothetical $10,000 investment.
Class Name |
Costs of a $10,000 investment |
Costs paid as a percentage of a $10,000 investment |
Class B |
$53 |
0.97%Footnote Reference* |
| Footnote |
Description |
Footnote* |
Annualized. | |
|
| Expenses Paid, Amount |
$ 53
|
|
| Expense Ratio, Percent |
0.97%
|
[36] |
| AssetsNet |
$ 2,091,295,892
|
|
| Holdings Count | Holding |
78
|
|
| Advisory Fees Paid, Amount |
$ 6,954,756
|
|
| InvestmentCompanyPortfolioTurnover |
23.00%
|
|
| Additional Fund Statistics [Text Block] |
- Total Net Assets$2,091,295,892
- # of Portfolio Investments78
- Portfolio Turnover Rate23%
- Total Advisory Fees Paid$6,954,756
|
|
| Holdings [Text Block] |
Value |
Value |
Real Estate |
0.6 |
Communication Services |
3.0 |
Materials |
6.0 |
Information Technology |
6.5 |
Consumer Staples |
7.3 |
Health Care |
12.1 |
Financials |
19.0 |
Consumer Discretionary |
21.1 |
Industrials |
21.5 |
Value |
Value |
China |
3.2 |
Australia |
3.2 |
Sweden |
3.5 |
Japan |
3.8 |
South Korea |
4.7 |
United States |
5.0 |
Netherlands |
6.4 |
United Kingdom |
13.1 |
France |
19.3 |
Germany |
22.7 | |
|
| Largest Holdings [Text Block] |
Glencore PLC |
3.2 |
BNP Paribas SA |
3.0 |
Kering SA |
3.0 |
Continental AG |
2.8 |
CNH Industrial NV |
2.8 |
Bayer AG |
2.6 |
Fresenius Medical Care AG |
2.4 |
Ashtead Group PLC |
2.4 |
Bayerische Motoren Werke AG |
2.4 |
KB Financial Group, Inc. |
2.3 | |
|
| Material Fund Change [Text Block] |
|
|
| Updated Prospectus Phone Number |
1-888-243-1956
|
|
| Updated Prospectus Web Address |
<span style="box-sizing: border-box; color: rgb(0, 0, 0); display: inline; flex-wrap: nowrap; font-size: 10.6667px; font-weight: 400; grid-area: auto; line-height: 16px; margin: 0px; overflow: visible; text-align: justify; text-align-last: left; white-space-collapse: preserve-breaks;">https://dfinview.com/BHFT</span>
|
|
| C000030713 |
|
|
| Shareholder Report [Line Items] |
|
|
| Fund Name |
Harris Oakmark International Portfolio
|
|
| Class Name |
Class E
|
|
| No Trading Symbol [Flag] |
true
|
|
| Annual or Semi-Annual Statement [Text Block] |
This semi-annual shareholder report contains important information about the Harris Oakmark International Portfolio (the "Portfolio") for the period of January 1, 2025 to June 30, 2025.
|
|
| Shareholder Report Annual or Semi-Annual |
Semi-Annual Shareholder Report
|
|
| Additional Information [Text Block] |
You can find additional information about the Portfolio at https://dfinview.com/BHFT. You can also request this information by contacting us at 1-888-243-1956.
|
|
| Additional Information Phone Number |
1-888-243-1956
|
|
| Additional Information Website |
<span style="box-sizing: border-box; color: rgb(0, 0, 0); display: inline; flex-wrap: nowrap; font-size: 12px; font-weight: 400; grid-area: auto; line-height: 18px; margin: 0px; overflow: visible; text-align: left; text-align-last: auto; white-space-collapse: preserve-breaks;">https://dfinview.com/BHFT</span>
|
|
| Expenses [Text Block] |
What were the Portfolio costs for last six months?This example shows the expenses you would have paid over the reporting period based on a hypothetical $10,000 investment.
Class Name |
Costs of a $10,000 investment |
Costs paid as a percentage of a $10,000 investment |
Class E |
$48 |
0.87%Footnote Reference* |
| Footnote |
Description |
Footnote* |
Annualized. | |
|
| Expenses Paid, Amount |
$ 48
|
|
| Expense Ratio, Percent |
0.87%
|
[37] |
| AssetsNet |
$ 2,091,295,892
|
|
| Holdings Count | Holding |
78
|
|
| Advisory Fees Paid, Amount |
$ 6,954,756
|
|
| InvestmentCompanyPortfolioTurnover |
23.00%
|
|
| Additional Fund Statistics [Text Block] |
- Total Net Assets$2,091,295,892
- # of Portfolio Investments78
- Portfolio Turnover Rate23%
- Total Advisory Fees Paid$6,954,756
|
|
| Holdings [Text Block] |
Value |
Value |
Real Estate |
0.6 |
Communication Services |
3.0 |
Materials |
6.0 |
Information Technology |
6.5 |
Consumer Staples |
7.3 |
Health Care |
12.1 |
Financials |
19.0 |
Consumer Discretionary |
21.1 |
Industrials |
21.5 |
Value |
Value |
China |
3.2 |
Australia |
3.2 |
Sweden |
3.5 |
Japan |
3.8 |
South Korea |
4.7 |
United States |
5.0 |
Netherlands |
6.4 |
United Kingdom |
13.1 |
France |
19.3 |
Germany |
22.7 | |
|
| Largest Holdings [Text Block] |
Glencore PLC |
3.2 |
BNP Paribas SA |
3.0 |
Kering SA |
3.0 |
Continental AG |
2.8 |
CNH Industrial NV |
2.8 |
Bayer AG |
2.6 |
Fresenius Medical Care AG |
2.4 |
Ashtead Group PLC |
2.4 |
Bayerische Motoren Werke AG |
2.4 |
KB Financial Group, Inc. |
2.3 | |
|
| Material Fund Change [Text Block] |
|
|
| Updated Prospectus Phone Number |
1-888-243-1956
|
|
| Updated Prospectus Web Address |
<span style="box-sizing: border-box; color: rgb(0, 0, 0); display: inline; flex-wrap: nowrap; font-size: 10.6667px; font-weight: 400; grid-area: auto; line-height: 16px; margin: 0px; overflow: visible; text-align: justify; text-align-last: left; white-space-collapse: preserve-breaks;">https://dfinview.com/BHFT</span>
|
|
| C000112664 |
|
|
| Shareholder Report [Line Items] |
|
|
| Fund Name |
Invesco Balanced-Risk Allocation Portfolio
|
|
| Class Name |
Class B
|
|
| No Trading Symbol [Flag] |
true
|
|
| Annual or Semi-Annual Statement [Text Block] |
This semi-annual shareholder report contains important information about the Invesco Balanced-Risk Allocation Portfolio (the "Portfolio") for the period of January 1, 2025 to June 30, 2025.
|
|
| Shareholder Report Annual or Semi-Annual |
Semi-Annual Shareholder Report
|
|
| Additional Information [Text Block] |
You can find additional information about the Portfolio at https://dfinview.com/BHFT. You can also request this information by contacting us at 1-888-243-1956.
|
|
| Additional Information Phone Number |
1-888-243-1956
|
|
| Additional Information Website |
<span style="box-sizing: border-box; color: rgb(0, 0, 0); display: inline; flex-wrap: nowrap; font-size: 12px; font-weight: 400; grid-area: auto; line-height: 18px; margin: 0px; overflow: visible; text-align: left; text-align-last: auto; white-space-collapse: preserve-breaks;">https://dfinview.com/BHFT</span>
|
|
| Expenses [Text Block] |
What were the Portfolio costs for last six months?This example shows the expenses you would have paid over the reporting period based on a hypothetical $10,000 investment.
Class Name |
Costs of a $10,000 investment |
Costs paid as a percentage of a $10,000 investment |
Class B |
$48 |
0.95%Footnote Reference* |
| Footnote |
Description |
Footnote* |
Annualized. | |
|
| Expenses Paid, Amount |
$ 48
|
|
| Expense Ratio, Percent |
0.95%
|
[38] |
| AssetsNet |
$ 705,304,005
|
|
| Holdings Count | Holding |
92
|
|
| Advisory Fees Paid, Amount |
$ 2,296,606
|
|
| InvestmentCompanyPortfolioTurnover |
9.00%
|
|
| Additional Fund Statistics [Text Block] |
- Total Net Assets$705,304,005
- # of Portfolio Investments92
- Portfolio Turnover Rate9%
- Total Advisory Fees Paid$2,296,606
|
|
| Holdings [Text Block] |
Value |
Value |
U.S. Large Cap Equities |
3.5 |
U.S. Small Cap Equities |
4.2 |
Emerging Market Equities |
7.7 |
International Developed Market Equities |
23.8 |
Commodities |
31.4 |
Global Developed Bonds |
55.6 | |
|
| Updated Prospectus Phone Number |
1-888-243-1956
|
|
| Updated Prospectus Web Address |
<span style="box-sizing: border-box; color: rgb(0, 0, 0); display: inline; flex-wrap: nowrap; font-size: 10.6667px; font-weight: 400; grid-area: auto; line-height: 16px; margin: 0px; overflow: visible; text-align: justify; text-align-last: left; white-space-collapse: preserve-breaks;">https://dfinview.com/BHFT</span>
|
|
| C000030670 |
|
|
| Shareholder Report [Line Items] |
|
|
| Fund Name |
Invesco Comstock Portfolio
|
|
| Class Name |
Class A
|
|
| No Trading Symbol [Flag] |
true
|
|
| Annual or Semi-Annual Statement [Text Block] |
This semi-annual shareholder report contains important information about the Invesco Comstock Portfolio (the "Portfolio") for the period of January 1, 2025 to June 30, 2025.
|
|
| Shareholder Report Annual or Semi-Annual |
Semi-Annual Shareholder Report
|
|
| Additional Information [Text Block] |
You can find additional information about the Portfolio at https://dfinview.com/BHFT. You can also request this information by contacting us at 1-888-243-1956.
|
|
| Additional Information Phone Number |
1-888-243-1956
|
|
| Additional Information Website |
<span style="box-sizing: border-box; color: rgb(0, 0, 0); display: inline; flex-wrap: nowrap; font-size: 12px; font-weight: 400; grid-area: auto; line-height: 18px; margin: 0px; overflow: visible; text-align: left; text-align-last: auto; white-space-collapse: preserve-breaks;">https://dfinview.com/BHFT</span>
|
|
| Expenses [Text Block] |
What were the Portfolio costs for last six months?This example shows the expenses you would have paid over the reporting period based on a hypothetical $10,000 investment.
Class Name |
Costs of a $10,000 investment |
Costs paid as a percentage of a $10,000 investment |
Class A |
$29 |
0.56%Footnote Reference* |
| Footnote |
Description |
Footnote* |
Annualized. | |
|
| Expenses Paid, Amount |
$ 29
|
|
| Expense Ratio, Percent |
0.56%
|
[39] |
| AssetsNet |
$ 1,894,924,923
|
|
| Holdings Count | Holding |
110
|
|
| Advisory Fees Paid, Amount |
$ 4,930,295
|
|
| InvestmentCompanyPortfolioTurnover |
12.00%
|
|
| Additional Fund Statistics [Text Block] |
- Total Net Assets$1,894,924,923
- # of Portfolio Investments110
- Portfolio Turnover Rate12%
- Total Advisory Fees Paid$4,930,295
|
|
| Holdings [Text Block] |
Value |
Value |
Materials |
2.1 |
Utilities |
3.2 |
Consumer Discretionary |
6.3 |
Energy |
6.7 |
Communication Services |
8.3 |
Consumer Staples |
10.6 |
Industrials |
10.9 |
Information Technology |
12.1 |
Health Care |
15.9 |
Financials |
19.1 |
Value |
Value |
Belgium |
1.0 |
Netherlands |
2.3 |
Canada |
2.4 |
United Kingdom |
3.0 |
United States |
87.3 | |
|
| Largest Holdings [Text Block] |
Bank of America Corp. |
3.3 |
Microsoft Corp. |
3.1 |
Wells Fargo & Co. |
2.9 |
Cisco Systems, Inc. |
2.8 |
CVS Health Corp. |
2.4 |
State Street Corp. |
2.2 |
Alphabet, Inc. |
2.1 |
Meta Platforms, Inc. |
2.1 |
Johnson Controls International PLC |
2.0 |
Philip Morris International, Inc. |
1.9 | |
|
| Material Fund Change [Text Block] |
|
|
| Updated Prospectus Phone Number |
1-888-243-1956
|
|
| Updated Prospectus Web Address |
<span style="box-sizing: border-box; color: rgb(0, 0, 0); display: inline; flex-wrap: nowrap; font-size: 10.6667px; font-weight: 400; grid-area: auto; line-height: 16px; margin: 0px; overflow: visible; text-align: justify; text-align-last: left; white-space-collapse: preserve-breaks;">https://dfinview.com/BHFT</span>
|
|
| C000030671 |
|
|
| Shareholder Report [Line Items] |
|
|
| Fund Name |
Invesco Comstock Portfolio
|
|
| Class Name |
Class B
|
|
| No Trading Symbol [Flag] |
true
|
|
| Annual or Semi-Annual Statement [Text Block] |
This semi-annual shareholder report contains important information about the Invesco Comstock Portfolio (the "Portfolio") for the period of January 1, 2025 to June 30, 2025.
|
|
| Shareholder Report Annual or Semi-Annual |
Semi-Annual Shareholder Report
|
|
| Additional Information [Text Block] |
You can find additional information about the Portfolio at https://dfinview.com/BHFT. You can also request this information by contacting us at 1-888-243-1956.
|
|
| Additional Information Phone Number |
1-888-243-1956
|
|
| Additional Information Website |
<span style="box-sizing: border-box; color: rgb(0, 0, 0); display: inline; flex-wrap: nowrap; font-size: 12px; font-weight: 400; grid-area: auto; line-height: 18px; margin: 0px; overflow: visible; text-align: left; text-align-last: auto; white-space-collapse: preserve-breaks;">https://dfinview.com/BHFT</span>
|
|
| Expenses [Text Block] |
What were the Portfolio costs for last six months?This example shows the expenses you would have paid over the reporting period based on a hypothetical $10,000 investment.
Class Name |
Costs of a $10,000 investment |
Costs paid as a percentage of a $10,000 investment |
Class B |
$42 |
0.81%Footnote Reference* |
| Footnote |
Description |
Footnote* |
Annualized. | |
|
| Expenses Paid, Amount |
$ 42
|
|
| Expense Ratio, Percent |
0.81%
|
[40] |
| AssetsNet |
$ 1,894,924,923
|
|
| Holdings Count | Holding |
110
|
|
| Advisory Fees Paid, Amount |
$ 4,930,295
|
|
| InvestmentCompanyPortfolioTurnover |
12.00%
|
|
| Additional Fund Statistics [Text Block] |
- Total Net Assets$1,894,924,923
- # of Portfolio Investments110
- Portfolio Turnover Rate12%
- Total Advisory Fees Paid$4,930,295
|
|
| Holdings [Text Block] |
Value |
Value |
Materials |
2.1 |
Utilities |
3.2 |
Consumer Discretionary |
6.3 |
Energy |
6.7 |
Communication Services |
8.3 |
Consumer Staples |
10.6 |
Industrials |
10.9 |
Information Technology |
12.1 |
Health Care |
15.9 |
Financials |
19.1 |
Value |
Value |
Belgium |
1.0 |
Netherlands |
2.3 |
Canada |
2.4 |
United Kingdom |
3.0 |
United States |
87.3 | |
|
| Largest Holdings [Text Block] |
Bank of America Corp. |
3.3 |
Microsoft Corp. |
3.1 |
Wells Fargo & Co. |
2.9 |
Cisco Systems, Inc. |
2.8 |
CVS Health Corp. |
2.4 |
State Street Corp. |
2.2 |
Alphabet, Inc. |
2.1 |
Meta Platforms, Inc. |
2.1 |
Johnson Controls International PLC |
2.0 |
Philip Morris International, Inc. |
1.9 | |
|
| Material Fund Change [Text Block] |
|
|
| Updated Prospectus Phone Number |
1-888-243-1956
|
|
| Updated Prospectus Web Address |
<span style="box-sizing: border-box; color: rgb(0, 0, 0); display: inline; flex-wrap: nowrap; font-size: 10.6667px; font-weight: 400; grid-area: auto; line-height: 16px; margin: 0px; overflow: visible; text-align: justify; text-align-last: left; white-space-collapse: preserve-breaks;">https://dfinview.com/BHFT</span>
|
|
| C000063051 |
|
|
| Shareholder Report [Line Items] |
|
|
| Fund Name |
Invesco Global Equity Portfolio
|
|
| Class Name |
Class A
|
|
| No Trading Symbol [Flag] |
true
|
|
| Annual or Semi-Annual Statement [Text Block] |
This semi-annual shareholder report contains important information about the Invesco Global Equity Portfolio (the "Portfolio") for the period of January 1, 2025 to June 30, 2025.
|
|
| Shareholder Report Annual or Semi-Annual |
Semi-Annual Shareholder Report
|
|
| Additional Information [Text Block] |
You can find additional information about the Portfolio at https://dfinview.com/BHFT. You can also request this information by contacting us at 1-888-243-1956.
|
|
| Additional Information Phone Number |
1-888-243-1956
|
|
| Additional Information Website |
<span style="box-sizing: border-box; color: rgb(0, 0, 0); display: inline; flex-wrap: nowrap; font-size: 12px; font-weight: 400; grid-area: auto; line-height: 18px; margin: 0px; overflow: visible; text-align: left; text-align-last: auto; white-space-collapse: preserve-breaks;">https://dfinview.com/BHFT</span>
|
|
| Expenses [Text Block] |
What were the Portfolio costs for last six months?This example shows the expenses you would have paid over the reporting period based on a hypothetical $10,000 investment.
Class Name |
Costs of a $10,000 investment |
Costs paid as a percentage of a $10,000 investment |
Class A |
$29 |
0.57%Footnote Reference* |
| Footnote |
Description |
Footnote* |
Annualized. | |
|
| Expenses Paid, Amount |
$ 29
|
|
| Expense Ratio, Percent |
0.57%
|
[41] |
| AssetsNet |
$ 1,134,903,578
|
|
| Holdings Count | Holding |
71
|
|
| Advisory Fees Paid, Amount |
$ 2,826,774
|
|
| InvestmentCompanyPortfolioTurnover |
10.00%
|
|
| Additional Fund Statistics [Text Block] |
- Total Net Assets$1,134,903,578
- # of Portfolio Investments71
- Portfolio Turnover Rate10%
- Total Advisory Fees Paid$2,826,774
|
|
| Holdings [Text Block] |
Value |
Value |
Materials |
0.9 |
Real Estate |
4.2 |
Industrials |
6.2 |
Consumer Discretionary |
10.0 |
Health Care |
11.1 |
Financials |
12.7 |
Communication Services |
23.0 |
Information Technology |
32.1 |
Value |
Value |
Canada |
1.5 |
Italy |
1.6 |
Sweden |
1.6 |
Netherlands |
2.5 |
China |
3.0 |
Japan |
3.2 |
Germany |
5.3 |
France |
5.6 |
India |
6.5 |
United States |
63.5 | |
|
| Largest Holdings [Text Block] |
Meta Platforms, Inc. |
9.2 |
Alphabet, Inc. |
8.5 |
SAP SE |
4.6 |
NVIDIA Corp. |
4.3 |
DLF Ltd. |
4.2 |
S&P Global, Inc. |
4.1 |
Intuit, Inc. |
3.5 |
Airbus SE |
3.3 |
Analog Devices, Inc. |
3.2 |
Visa, Inc. |
3.2 | |
|
| Material Fund Change [Text Block] |
|
|
| Updated Prospectus Phone Number |
1-888-243-1956
|
|
| Updated Prospectus Web Address |
<span style="box-sizing: border-box; color: rgb(0, 0, 0); display: inline; flex-wrap: nowrap; font-size: 10.6667px; font-weight: 400; grid-area: auto; line-height: 16px; margin: 0px; overflow: visible; text-align: justify; text-align-last: left; white-space-collapse: preserve-breaks;">https://dfinview.com/BHFT</span>
|
|
| C000063048 |
|
|
| Shareholder Report [Line Items] |
|
|
| Fund Name |
Invesco Global Equity Portfolio
|
|
| Class Name |
Class B
|
|
| No Trading Symbol [Flag] |
true
|
|
| Annual or Semi-Annual Statement [Text Block] |
This semi-annual shareholder report contains important information about the Invesco Global Equity Portfolio (the "Portfolio") for the period of January 1, 2025 to June 30, 2025.
|
|
| Shareholder Report Annual or Semi-Annual |
Semi-Annual Shareholder Report
|
|
| Additional Information [Text Block] |
You can find additional information about the Portfolio at https://dfinview.com/BHFT. You can also request this information by contacting us at 1-888-243-1956.
|
|
| Additional Information Phone Number |
1-888-243-1956
|
|
| Additional Information Website |
<span style="box-sizing: border-box; color: rgb(0, 0, 0); display: inline; flex-wrap: nowrap; font-size: 12px; font-weight: 400; grid-area: auto; line-height: 18px; margin: 0px; overflow: visible; text-align: left; text-align-last: auto; white-space-collapse: preserve-breaks;">https://dfinview.com/BHFT</span>
|
|
| Expenses [Text Block] |
What were the Portfolio costs for last six months?This example shows the expenses you would have paid over the reporting period based on a hypothetical $10,000 investment.
Class Name |
Costs of a $10,000 investment |
Costs paid as a percentage of a $10,000 investment |
Class B |
$42 |
0.82%Footnote Reference* |
| Footnote |
Description |
Footnote* |
Annualized. | |
|
| Expenses Paid, Amount |
$ 42
|
|
| Expense Ratio, Percent |
0.82%
|
[42] |
| AssetsNet |
$ 1,134,903,578
|
|
| Holdings Count | Holding |
71
|
|
| Advisory Fees Paid, Amount |
$ 2,826,774
|
|
| InvestmentCompanyPortfolioTurnover |
10.00%
|
|
| Additional Fund Statistics [Text Block] |
- Total Net Assets$1,134,903,578
- # of Portfolio Investments71
- Portfolio Turnover Rate10%
- Total Advisory Fees Paid$2,826,774
|
|
| Holdings [Text Block] |
Value |
Value |
Materials |
0.9 |
Real Estate |
4.2 |
Industrials |
6.2 |
Consumer Discretionary |
10.0 |
Health Care |
11.1 |
Financials |
12.7 |
Communication Services |
23.0 |
Information Technology |
32.1 |
Value |
Value |
Canada |
1.5 |
Italy |
1.6 |
Sweden |
1.6 |
Netherlands |
2.5 |
China |
3.0 |
Japan |
3.2 |
Germany |
5.3 |
France |
5.6 |
India |
6.5 |
United States |
63.5 | |
|
| Largest Holdings [Text Block] |
Meta Platforms, Inc. |
9.2 |
Alphabet, Inc. |
8.5 |
SAP SE |
4.6 |
NVIDIA Corp. |
4.3 |
DLF Ltd. |
4.2 |
S&P Global, Inc. |
4.1 |
Intuit, Inc. |
3.5 |
Airbus SE |
3.3 |
Analog Devices, Inc. |
3.2 |
Visa, Inc. |
3.2 | |
|
| Material Fund Change [Text Block] |
|
|
| Updated Prospectus Phone Number |
1-888-243-1956
|
|
| Updated Prospectus Web Address |
<span style="box-sizing: border-box; color: rgb(0, 0, 0); display: inline; flex-wrap: nowrap; font-size: 10.6667px; font-weight: 400; grid-area: auto; line-height: 16px; margin: 0px; overflow: visible; text-align: justify; text-align-last: left; white-space-collapse: preserve-breaks;">https://dfinview.com/BHFT</span>
|
|
| C000063050 |
|
|
| Shareholder Report [Line Items] |
|
|
| Fund Name |
Invesco Global Equity Portfolio
|
|
| Class Name |
Class E
|
|
| No Trading Symbol [Flag] |
true
|
|
| Annual or Semi-Annual Statement [Text Block] |
This semi-annual shareholder report contains important information about the Invesco Global Equity Portfolio (the "Portfolio") for the period of January 1, 2025 to June 30, 2025.
|
|
| Shareholder Report Annual or Semi-Annual |
Semi-Annual Shareholder Report
|
|
| Additional Information [Text Block] |
You can find additional information about the Portfolio at https://dfinview.com/BHFT. You can also request this information by contacting us at 1-888-243-1956.
|
|
| Additional Information Phone Number |
1-888-243-1956
|
|
| Additional Information Website |
<span style="box-sizing: border-box; color: rgb(0, 0, 0); display: inline; flex-wrap: nowrap; font-size: 12px; font-weight: 400; grid-area: auto; line-height: 18px; margin: 0px; overflow: visible; text-align: left; text-align-last: auto; white-space-collapse: preserve-breaks;">https://dfinview.com/BHFT</span>
|
|
| Expenses [Text Block] |
What were the Portfolio costs for last six months?This example shows the expenses you would have paid over the reporting period based on a hypothetical $10,000 investment.
Class Name |
Costs of a $10,000 investment |
Costs paid as a percentage of a $10,000 investment |
Class E |
$37 |
0.72%Footnote Reference* |
| Footnote |
Description |
Footnote* |
Annualized. | |
|
| Expenses Paid, Amount |
$ 37
|
|
| Expense Ratio, Percent |
0.72%
|
[43] |
| AssetsNet |
$ 1,134,903,578
|
|
| Holdings Count | Holding |
71
|
|
| Advisory Fees Paid, Amount |
$ 2,826,774
|
|
| InvestmentCompanyPortfolioTurnover |
10.00%
|
|
| Additional Fund Statistics [Text Block] |
- Total Net Assets$1,134,903,578
- # of Portfolio Investments71
- Portfolio Turnover Rate10%
- Total Advisory Fees Paid$2,826,774
|
|
| Holdings [Text Block] |
Value |
Value |
Materials |
0.9 |
Real Estate |
4.2 |
Industrials |
6.2 |
Consumer Discretionary |
10.0 |
Health Care |
11.1 |
Financials |
12.7 |
Communication Services |
23.0 |
Information Technology |
32.1 |
Value |
Value |
Canada |
1.5 |
Italy |
1.6 |
Sweden |
1.6 |
Netherlands |
2.5 |
China |
3.0 |
Japan |
3.2 |
Germany |
5.3 |
France |
5.6 |
India |
6.5 |
United States |
63.5 | |
|
| Largest Holdings [Text Block] |
Meta Platforms, Inc. |
9.2 |
Alphabet, Inc. |
8.5 |
SAP SE |
4.6 |
NVIDIA Corp. |
4.3 |
DLF Ltd. |
4.2 |
S&P Global, Inc. |
4.1 |
Intuit, Inc. |
3.5 |
Airbus SE |
3.3 |
Analog Devices, Inc. |
3.2 |
Visa, Inc. |
3.2 | |
|
| Material Fund Change [Text Block] |
|
|
| Updated Prospectus Phone Number |
1-888-243-1956
|
|
| Updated Prospectus Web Address |
<span style="box-sizing: border-box; color: rgb(0, 0, 0); display: inline; flex-wrap: nowrap; font-size: 10.6667px; font-weight: 400; grid-area: auto; line-height: 16px; margin: 0px; overflow: visible; text-align: justify; text-align-last: left; white-space-collapse: preserve-breaks;">https://dfinview.com/BHFT</span>
|
|
| C000030546 |
|
|
| Shareholder Report [Line Items] |
|
|
| Fund Name |
Invesco Small Cap Growth Portfolio
|
|
| Class Name |
Class A
|
|
| No Trading Symbol [Flag] |
true
|
|
| Annual or Semi-Annual Statement [Text Block] |
This semi-annual shareholder report contains important information about the Invesco Small Cap Growth Portfolio (the "Portfolio") for the period of January 1, 2025 to June 30, 2025.
|
|
| Shareholder Report Annual or Semi-Annual |
Semi-Annual Shareholder Report
|
|
| Additional Information [Text Block] |
You can find additional information about the Portfolio at https://dfinview.com/BHFT. You can also request this information by contacting us at 1-888-243-1956.
|
|
| Additional Information Phone Number |
1-888-243-1956
|
|
| Additional Information Website |
<span style="box-sizing: border-box; color: rgb(0, 0, 0); display: inline; flex-wrap: nowrap; font-size: 12px; font-weight: 400; grid-area: auto; line-height: 18px; margin: 0px; overflow: visible; text-align: left; text-align-last: auto; white-space-collapse: preserve-breaks;">https://dfinview.com/BHFT</span>
|
|
| Expenses [Text Block] |
What were the Portfolio costs for last six months?This example shows the expenses you would have paid over the reporting period based on a hypothetical $10,000 investment.
Class Name |
Costs of a $10,000 investment |
Costs paid as a percentage of a $10,000 investment |
Class A |
$40 |
0.81%Footnote Reference* |
| Footnote |
Description |
Footnote* |
Annualized. | |
|
| Expenses Paid, Amount |
$ 40
|
|
| Expense Ratio, Percent |
0.81%
|
[44] |
| AssetsNet |
$ 838,414,091
|
|
| Holdings Count | Holding |
133
|
|
| Advisory Fees Paid, Amount |
$ 3,051,681
|
|
| InvestmentCompanyPortfolioTurnover |
52.00%
|
|
| Additional Fund Statistics [Text Block] |
- Total Net Assets$838,414,091
- # of Portfolio Investments133
- Portfolio Turnover Rate52%
- Total Advisory Fees Paid$3,051,681
|
|
| Holdings [Text Block] |
Value |
Value |
Utilities |
1.2 |
Real Estate |
1.3 |
Energy |
2.2 |
Consumer Staples |
2.4 |
Materials |
2.8 |
Financials |
11.1 |
Consumer Discretionary |
12.0 |
Health Care |
19.1 |
Information Technology |
21.3 |
Industrials |
25.0 |
Value |
Value |
Israel |
0.6 |
Denmark |
0.9 |
Thailand |
1.1 |
Canada |
1.3 |
United Kingdom |
1.5 |
United States |
93.4 | |
|
| Largest Holdings [Text Block] |
Carpenter Technology Corp. |
1.8 |
Encompass Health Corp. |
1.6 |
MACOM Technology Solutions Holdings, Inc. |
1.5 |
CyberArk Software Ltd. |
1.5 |
Clean Harbors, Inc. |
1.4 |
Q2 Holdings, Inc. |
1.4 |
Ollie's Bargain Outlet Holdings, Inc. |
1.4 |
RBC Bearings, Inc. |
1.4 |
Insmed, Inc. |
1.3 |
Shake Shack, Inc. |
1.3 | |
|
| Material Fund Change [Text Block] |
|
|
| Updated Prospectus Phone Number |
1-888-243-1956
|
|
| Updated Prospectus Web Address |
<span style="box-sizing: border-box; color: rgb(0, 0, 0); display: inline; flex-wrap: nowrap; font-size: 10.6667px; font-weight: 400; grid-area: auto; line-height: 16px; margin: 0px; overflow: visible; text-align: justify; text-align-last: left; white-space-collapse: preserve-breaks;">https://dfinview.com/BHFT</span>
|
|
| C000030547 |
|
|
| Shareholder Report [Line Items] |
|
|
| Fund Name |
Invesco Small Cap Growth Portfolio
|
|
| Class Name |
Class B
|
|
| No Trading Symbol [Flag] |
true
|
|
| Annual or Semi-Annual Statement [Text Block] |
This semi-annual shareholder report contains important information about the Invesco Small Cap Growth Portfolio (the "Portfolio") for the period of January 1, 2025 to June 30, 2025.
|
|
| Shareholder Report Annual or Semi-Annual |
Semi-Annual Shareholder Report
|
|
| Additional Information [Text Block] |
You can find additional information about the Portfolio at https://dfinview.com/BHFT. You can also request this information by contacting us at 1-888-243-1956.
|
|
| Additional Information Phone Number |
1-888-243-1956
|
|
| Additional Information Website |
<span style="box-sizing: border-box; color: rgb(0, 0, 0); display: inline; flex-wrap: nowrap; font-size: 12px; font-weight: 400; grid-area: auto; line-height: 18px; margin: 0px; overflow: visible; text-align: left; text-align-last: auto; white-space-collapse: preserve-breaks;">https://dfinview.com/BHFT</span>
|
|
| Expenses [Text Block] |
What were the Portfolio costs for last six months?This example shows the expenses you would have paid over the reporting period based on a hypothetical $10,000 investment.
Class Name |
Costs of a $10,000 investment |
Costs paid as a percentage of a $10,000 investment |
Class B |
$52 |
1.06%Footnote Reference* |
| Footnote |
Description |
Footnote* |
Annualized. | |
|
| Expenses Paid, Amount |
$ 52
|
|
| Expense Ratio, Percent |
1.06%
|
[45] |
| AssetsNet |
$ 838,414,091
|
|
| Holdings Count | Holding |
133
|
|
| Advisory Fees Paid, Amount |
$ 3,051,681
|
|
| InvestmentCompanyPortfolioTurnover |
52.00%
|
|
| Additional Fund Statistics [Text Block] |
- Total Net Assets$838,414,091
- # of Portfolio Investments133
- Portfolio Turnover Rate52%
- Total Advisory Fees Paid$3,051,681
|
|
| Holdings [Text Block] |
Value |
Value |
Utilities |
1.2 |
Real Estate |
1.3 |
Energy |
2.2 |
Consumer Staples |
2.4 |
Materials |
2.8 |
Financials |
11.1 |
Consumer Discretionary |
12.0 |
Health Care |
19.1 |
Information Technology |
21.3 |
Industrials |
25.0 |
Value |
Value |
Israel |
0.6 |
Denmark |
0.9 |
Thailand |
1.1 |
Canada |
1.3 |
United Kingdom |
1.5 |
United States |
93.4 | |
|
| Largest Holdings [Text Block] |
Carpenter Technology Corp. |
1.8 |
Encompass Health Corp. |
1.6 |
MACOM Technology Solutions Holdings, Inc. |
1.5 |
CyberArk Software Ltd. |
1.5 |
Clean Harbors, Inc. |
1.4 |
Q2 Holdings, Inc. |
1.4 |
Ollie's Bargain Outlet Holdings, Inc. |
1.4 |
RBC Bearings, Inc. |
1.4 |
Insmed, Inc. |
1.3 |
Shake Shack, Inc. |
1.3 | |
|
| Material Fund Change [Text Block] |
|
|
| Updated Prospectus Phone Number |
1-888-243-1956
|
|
| Updated Prospectus Web Address |
<span style="box-sizing: border-box; color: rgb(0, 0, 0); display: inline; flex-wrap: nowrap; font-size: 10.6667px; font-weight: 400; grid-area: auto; line-height: 16px; margin: 0px; overflow: visible; text-align: justify; text-align-last: left; white-space-collapse: preserve-breaks;">https://dfinview.com/BHFT</span>
|
|
| C000030549 |
|
|
| Shareholder Report [Line Items] |
|
|
| Fund Name |
Invesco Small Cap Growth Portfolio
|
|
| Class Name |
Class E
|
|
| No Trading Symbol [Flag] |
true
|
|
| Annual or Semi-Annual Statement [Text Block] |
This semi-annual shareholder report contains important information about the Invesco Small Cap Growth Portfolio (the "Portfolio") for the period of January 1, 2025 to June 30, 2025.
|
|
| Shareholder Report Annual or Semi-Annual |
Semi-Annual Shareholder Report
|
|
| Additional Information [Text Block] |
You can find additional information about the Portfolio at https://dfinview.com/BHFT. You can also request this information by contacting us at 1-888-243-1956.
|
|
| Additional Information Phone Number |
1-888-243-1956
|
|
| Additional Information Website |
<span style="box-sizing: border-box; color: rgb(0, 0, 0); display: inline; flex-wrap: nowrap; font-size: 12px; font-weight: 400; grid-area: auto; line-height: 18px; margin: 0px; overflow: visible; text-align: left; text-align-last: auto; white-space-collapse: preserve-breaks;">https://dfinview.com/BHFT</span>
|
|
| Expenses [Text Block] |
What were the Portfolio costs for last six months?This example shows the expenses you would have paid over the reporting period based on a hypothetical $10,000 investment.
Class Name |
Costs of a $10,000 investment |
Costs paid as a percentage of a $10,000 investment |
Class E |
$47 |
0.96%Footnote Reference* |
| Footnote |
Description |
Footnote* |
Annualized. | |
|
| Expenses Paid, Amount |
$ 47
|
|
| Expense Ratio, Percent |
0.96%
|
[46] |
| AssetsNet |
$ 838,414,091
|
|
| Holdings Count | Holding |
133
|
|
| Advisory Fees Paid, Amount |
$ 3,051,681
|
|
| InvestmentCompanyPortfolioTurnover |
52.00%
|
|
| Additional Fund Statistics [Text Block] |
- Total Net Assets$838,414,091
- # of Portfolio Investments133
- Portfolio Turnover Rate52%
- Total Advisory Fees Paid$3,051,681
|
|
| Holdings [Text Block] |
Value |
Value |
Utilities |
1.2 |
Real Estate |
1.3 |
Energy |
2.2 |
Consumer Staples |
2.4 |
Materials |
2.8 |
Financials |
11.1 |
Consumer Discretionary |
12.0 |
Health Care |
19.1 |
Information Technology |
21.3 |
Industrials |
25.0 |
Value |
Value |
Israel |
0.6 |
Denmark |
0.9 |
Thailand |
1.1 |
Canada |
1.3 |
United Kingdom |
1.5 |
United States |
93.4 | |
|
| Largest Holdings [Text Block] |
Carpenter Technology Corp. |
1.8 |
Encompass Health Corp. |
1.6 |
MACOM Technology Solutions Holdings, Inc. |
1.5 |
CyberArk Software Ltd. |
1.5 |
Clean Harbors, Inc. |
1.4 |
Q2 Holdings, Inc. |
1.4 |
Ollie's Bargain Outlet Holdings, Inc. |
1.4 |
RBC Bearings, Inc. |
1.4 |
Insmed, Inc. |
1.3 |
Shake Shack, Inc. |
1.3 | |
|
| Material Fund Change [Text Block] |
|
|
| Updated Prospectus Phone Number |
1-888-243-1956
|
|
| Updated Prospectus Web Address |
<span style="box-sizing: border-box; color: rgb(0, 0, 0); display: inline; flex-wrap: nowrap; font-size: 10.6667px; font-weight: 400; grid-area: auto; line-height: 16px; margin: 0px; overflow: visible; text-align: justify; text-align-last: left; white-space-collapse: preserve-breaks;">https://dfinview.com/BHFT</span>
|
|
| C000030600 |
|
|
| Shareholder Report [Line Items] |
|
|
| Fund Name |
JPMorgan Core Bond Portfolio
|
|
| Class Name |
Class A
|
|
| No Trading Symbol [Flag] |
true
|
|
| Annual or Semi-Annual Statement [Text Block] |
This semi-annual shareholder report contains important information about the JPMorgan Core Bond Portfolio (the "Portfolio") for the period of January 1, 2025 to June 30, 2025.
|
|
| Shareholder Report Annual or Semi-Annual |
Semi-Annual Shareholder Report
|
|
| Additional Information [Text Block] |
You can find additional information about the Portfolio at https://dfinview.com/BHFT. You can also request this information by contacting us at 1-888-243-1956.
|
|
| Additional Information Phone Number |
1-888-243-1956
|
|
| Additional Information Website |
<span style="box-sizing: border-box; color: rgb(0, 0, 0); display: inline; flex-wrap: nowrap; font-size: 12px; font-weight: 400; grid-area: auto; line-height: 18px; margin: 0px; overflow: visible; text-align: left; text-align-last: auto; white-space-collapse: preserve-breaks;">https://dfinview.com/BHFT</span>
|
|
| Expenses [Text Block] |
What were the Portfolio costs for last six months?This example shows the expenses you would have paid over the reporting period based on a hypothetical $10,000 investment.
Class Name |
Costs of a $10,000 investment |
Costs paid as a percentage of a $10,000 investment |
Class A |
$23 |
0.45%Footnote Reference* |
| Footnote |
Description |
Footnote* |
Annualized. | |
|
| Expenses Paid, Amount |
$ 23
|
|
| Expense Ratio, Percent |
0.45%
|
[47] |
| AssetsNet |
$ 1,215,528,709
|
|
| Holdings Count | Holding |
1,000
|
|
| Advisory Fees Paid, Amount |
$ 2,464,369
|
|
| InvestmentCompanyPortfolioTurnover |
17.00%
|
|
| Additional Fund Statistics [Text Block] |
- Total Net Assets$1,215,528,709
- # of Portfolio Investments1,000
- Portfolio Turnover Rate17%
- Total Advisory Fees Paid$2,464,369
|
|
| Holdings [Text Block] |
Value |
Value |
Municipals |
0.1 |
Foreign Government |
0.5 |
Non-Agency Mortgage-Backed Securities |
2.2 |
Short-Term Investments |
2.5 |
Asset-Backed Securities |
11.8 |
Corporate Bonds & Notes |
26.2 |
U.S. Treasury & Government Agencies |
27.1 |
Agency Sponsored Mortgage-Backed Securities |
29.5 | |
|
| Largest Holdings [Text Block] |
Top 10 Fixed Income Issuers
Federal National Mortgage Association |
14.3 |
U.S. Treasury Notes |
12.0 |
U.S. Treasury Bonds |
11.6 |
Government National Mortgage Association |
3.9 |
U.S. Treasury STRIPS Coupon |
3.3 |
Federal Home Loan Mortgage Corp. |
3.1 |
Federal National Mortgage Association-ACES |
2.3 |
Federal Home Loan Mortgage Corp. Seasoned Credit Risk Transfer Trust |
1.4 |
Government National Mortgage Association REMICS |
1.3 |
Federal Home Loan Mortgage Corp. Multifamily Structured Pass-Through Certificates |
1.1 | |
|
| Updated Prospectus Phone Number |
1-888-243-1956
|
|
| Updated Prospectus Web Address |
<span style="box-sizing: border-box; color: rgb(0, 0, 0); display: inline; flex-wrap: nowrap; font-size: 10.6667px; font-weight: 400; grid-area: auto; line-height: 16px; margin: 0px; overflow: visible; text-align: justify; text-align-last: left; white-space-collapse: preserve-breaks;">https://dfinview.com/BHFT</span>
|
|
| C000030601 |
|
|
| Shareholder Report [Line Items] |
|
|
| Fund Name |
JPMorgan Core Bond Portfolio
|
|
| Class Name |
Class B
|
|
| No Trading Symbol [Flag] |
true
|
|
| Annual or Semi-Annual Statement [Text Block] |
This semi-annual shareholder report contains important information about the JPMorgan Core Bond Portfolio (the "Portfolio") for the period of January 1, 2025 to June 30, 2025.
|
|
| Shareholder Report Annual or Semi-Annual |
Semi-Annual Shareholder Report
|
|
| Additional Information [Text Block] |
You can find additional information about the Portfolio at https://dfinview.com/BHFT. You can also request this information by contacting us at 1-888-243-1956.
|
|
| Additional Information Phone Number |
1-888-243-1956
|
|
| Additional Information Website |
<span style="box-sizing: border-box; color: rgb(0, 0, 0); display: inline; flex-wrap: nowrap; font-size: 12px; font-weight: 400; grid-area: auto; line-height: 18px; margin: 0px; overflow: visible; text-align: left; text-align-last: auto; white-space-collapse: preserve-breaks;">https://dfinview.com/BHFT</span>
|
|
| Expenses [Text Block] |
What were the Portfolio costs for last six months?This example shows the expenses you would have paid over the reporting period based on a hypothetical $10,000 investment.
Class Name |
Costs of a $10,000 investment |
Costs paid as a percentage of a $10,000 investment |
Class B |
$35 |
0.70%Footnote Reference* |
| Footnote |
Description |
Footnote* |
Annualized. | |
|
| Expenses Paid, Amount |
$ 35
|
|
| Expense Ratio, Percent |
0.70%
|
[48] |
| AssetsNet |
$ 1,215,528,709
|
|
| Holdings Count | Holding |
1,000
|
|
| Advisory Fees Paid, Amount |
$ 2,464,369
|
|
| InvestmentCompanyPortfolioTurnover |
17.00%
|
|
| Additional Fund Statistics [Text Block] |
- Total Net Assets$1,215,528,709
- # of Portfolio Investments1,000
- Portfolio Turnover Rate17%
- Total Advisory Fees Paid$2,464,369
|
|
| Holdings [Text Block] |
Value |
Value |
Municipals |
0.1 |
Foreign Government |
0.5 |
Non-Agency Mortgage-Backed Securities |
2.2 |
Short-Term Investments |
2.5 |
Asset-Backed Securities |
11.8 |
Corporate Bonds & Notes |
26.2 |
U.S. Treasury & Government Agencies |
27.1 |
Agency Sponsored Mortgage-Backed Securities |
29.5 | |
|
| Largest Holdings [Text Block] |
Top 10 Fixed Income Issuers
Federal National Mortgage Association |
14.3 |
U.S. Treasury Notes |
12.0 |
U.S. Treasury Bonds |
11.6 |
Government National Mortgage Association |
3.9 |
U.S. Treasury STRIPS Coupon |
3.3 |
Federal Home Loan Mortgage Corp. |
3.1 |
Federal National Mortgage Association-ACES |
2.3 |
Federal Home Loan Mortgage Corp. Seasoned Credit Risk Transfer Trust |
1.4 |
Government National Mortgage Association REMICS |
1.3 |
Federal Home Loan Mortgage Corp. Multifamily Structured Pass-Through Certificates |
1.1 | |
|
| Updated Prospectus Phone Number |
1-888-243-1956
|
|
| Updated Prospectus Web Address |
<span style="box-sizing: border-box; color: rgb(0, 0, 0); display: inline; flex-wrap: nowrap; font-size: 10.6667px; font-weight: 400; grid-area: auto; line-height: 16px; margin: 0px; overflow: visible; text-align: justify; text-align-last: left; white-space-collapse: preserve-breaks;">https://dfinview.com/BHFT</span>
|
|
| C000112668 |
|
|
| Shareholder Report [Line Items] |
|
|
| Fund Name |
JPMorgan Global Active Allocation Portfolio
|
|
| Class Name |
Class B
|
|
| No Trading Symbol [Flag] |
true
|
|
| Annual or Semi-Annual Statement [Text Block] |
This semi-annual shareholder report contains important information about the JPMorgan Global Active Allocation Portfolio (the "Portfolio") for the period of January 1, 2025 to June 30, 2025.
|
|
| Shareholder Report Annual or Semi-Annual |
Semi-Annual Shareholder Report
|
|
| Additional Information [Text Block] |
You can find additional information about the Portfolio at https://dfinview.com/BHFT. You can also request this information by contacting us at 1-888-243-1956.
|
|
| Additional Information Phone Number |
1-888-243-1956
|
|
| Additional Information Website |
<span style="box-sizing: border-box; color: rgb(0, 0, 0); display: inline; flex-wrap: nowrap; font-size: 12px; font-weight: 400; grid-area: auto; line-height: 18px; margin: 0px; overflow: visible; text-align: left; text-align-last: auto; white-space-collapse: preserve-breaks;">https://dfinview.com/BHFT</span>
|
|
| Expenses [Text Block] |
What were the Portfolio costs for last six months?This example shows the expenses you would have paid over the reporting period based on a hypothetical $10,000 investment.
Class Name |
Costs of a $10,000 investment |
Costs paid as a percentage of a $10,000 investment |
Class B |
$50 |
0.97%Footnote Reference* |
| Footnote |
Description |
Footnote* |
Annualized. | |
|
| Expenses Paid, Amount |
$ 50
|
|
| Expense Ratio, Percent |
0.97%
|
[49] |
| AssetsNet |
$ 1,381,351,936
|
|
| Holdings Count | Holding |
1,489
|
|
| Advisory Fees Paid, Amount |
$ 4,454,257
|
|
| InvestmentCompanyPortfolioTurnover |
36.00%
|
|
| Additional Fund Statistics [Text Block] |
- Total Net Assets$1,381,351,936
- # of Portfolio Investments1,489
- Portfolio Turnover Rate36%
- Total Advisory Fees Paid$4,454,257
|
|
| Holdings [Text Block] |
Top 10 Fixed Income Issuers
U.S. Treasury Notes |
1.8 |
Federal National Mortgage Association |
1.5 |
U.S. Treasury Bonds |
1.0 |
SK Hynix, Inc. |
0.9 |
Southern Co. |
0.9 |
Cellnex Telecom SA |
0.8 |
Uber Technologies, Inc. |
0.8 |
Akamai Technologies, Inc. |
0.7 |
Alibaba Group Holding Ltd. |
0.7 |
Welltower OP LLC |
0.6 |
Value |
Value |
Netherlands |
0.9 |
Taiwan |
1.2 |
South Korea |
1.4 |
Spain |
1.7 |
Germany |
2.8 |
Japan |
2.8 |
United Kingdom |
2.8 |
France |
3.2 |
China |
4.2 |
United States |
53.0 |
Value |
Value |
Municipals |
0.0Footnote Reference* |
Non-Agency Mortgage-Backed Securities |
0.4 |
Convertible Preferred Stocks |
0.9 |
Asset-Backed Securities |
1.3 |
Investment Companies |
2.0 |
U.S. Treasury & Government Agencies |
3.0 |
Agency Sponsored Mortgage-Backed Securities |
3.2 |
Corporate Bonds & Notes |
11.8 |
Short-Term Investments |
16.1 |
Convertible Bonds |
18.1 |
Common Stocks |
41.4 |
| Footnote |
Description |
Footnote* |
Amount rounds to less than 0.1% | |
|
| Largest Holdings [Text Block] |
SPDR Bloomberg High Yield Bond ETF |
2.0 |
Microsoft Corp. |
1.8 |
NVIDIA Corp. |
1.5 |
Amazon.com, Inc. |
1.2 |
Bank of America Corp. |
1.1 |
Meta Platforms, Inc. |
1.1 |
Apple, Inc. |
1.0 |
Taiwan Semiconductor Manufacturing Co. Ltd. |
0.7 |
Walt Disney Co. |
0.5 |
Safran SA |
0.4 | |
|
| Updated Prospectus Phone Number |
1-888-243-1956
|
|
| Updated Prospectus Web Address |
<span style="box-sizing: border-box; color: rgb(0, 0, 0); display: inline; flex-wrap: nowrap; font-size: 10.6667px; font-weight: 400; grid-area: auto; line-height: 16px; margin: 0px; overflow: visible; text-align: justify; text-align-last: left; white-space-collapse: preserve-breaks;">https://dfinview.com/BHFT</span>
|
|
| C000030725 |
|
|
| Shareholder Report [Line Items] |
|
|
| Fund Name |
JPMorgan Small Cap Value Portfolio
|
|
| Class Name |
Class A
|
|
| No Trading Symbol [Flag] |
true
|
|
| Annual or Semi-Annual Statement [Text Block] |
This semi-annual shareholder report contains important information about the JPMorgan Small Cap Value Portfolio (the "Portfolio") for the period of January 1, 2025 to June 30, 2025.
|
|
| Shareholder Report Annual or Semi-Annual |
Semi-Annual Shareholder Report
|
|
| Additional Information [Text Block] |
You can find additional information about the Portfolio at https://dfinview.com/BHFT. You can also request this information by contacting us at 1-888-243-1956.
|
|
| Additional Information Phone Number |
1-888-243-1956
|
|
| Additional Information Website |
<span style="box-sizing: border-box; color: rgb(0, 0, 0); display: inline; flex-wrap: nowrap; font-size: 12px; font-weight: 400; grid-area: auto; line-height: 18px; margin: 0px; overflow: visible; text-align: left; text-align-last: auto; white-space-collapse: preserve-breaks;">https://dfinview.com/BHFT</span>
|
|
| Expenses [Text Block] |
What were the Portfolio costs for last six months?This example shows the expenses you would have paid over the reporting period based on a hypothetical $10,000 investment.
Class Name |
Costs of a $10,000 investment |
Costs paid as a percentage of a $10,000 investment |
Class A |
$38 |
0.78%Footnote Reference* |
| Footnote |
Description |
Footnote* |
Annualized. | |
|
| Expenses Paid, Amount |
$ 38
|
|
| Expense Ratio, Percent |
0.78%
|
[50] |
| AssetsNet |
$ 319,789,215
|
|
| Holdings Count | Holding |
433
|
|
| Advisory Fees Paid, Amount |
$ 1,042,587
|
|
| InvestmentCompanyPortfolioTurnover |
44.00%
|
|
| Additional Fund Statistics [Text Block] |
- Total Net Assets$319,789,215
- # of Portfolio Investments433
- Portfolio Turnover Rate44%
- Total Advisory Fees Paid$1,042,587
|
|
| Holdings [Text Block] |
Value |
Value |
Communication Services |
2.1 |
Materials |
4.7 |
Utilities |
5.1 |
Energy |
6.3 |
Health Care |
7.4 |
Information Technology |
9.0 |
Real Estate |
9.8 |
Consumer Discretionary |
11.5 |
Industrials |
11.8 |
Financials |
27.7 |
Value |
Value |
Panama |
0.2 |
Switzerland |
0.2 |
Hong Kong |
0.2 |
Monaco |
0.4 |
United Kingdom |
0.5 |
Puerto Rico |
0.8 |
Bermuda |
1.1 |
Canada |
1.3 |
United States |
92.2 | |
|
| Largest Holdings [Text Block] |
Southwest Gas Holdings, Inc. |
1.1 |
Old National Bancorp |
0.9 |
Sanmina Corp. |
0.9 |
PotlatchDeltic Corp. |
0.8 |
Ladder Capital Corp. |
0.7 |
Bank of NT Butterfield & Son Ltd. |
0.7 |
ABM Industries, Inc. |
0.7 |
Jackson Financial, Inc. |
0.7 |
Essent Group Ltd. |
0.7 |
Enterprise Financial Services Corp. |
0.7 | |
|
| Material Fund Change [Text Block] |
|
|
| Updated Prospectus Phone Number |
1-888-243-1956
|
|
| Updated Prospectus Web Address |
<span style="box-sizing: border-box; color: rgb(0, 0, 0); display: inline; flex-wrap: nowrap; font-size: 10.6667px; font-weight: 400; grid-area: auto; line-height: 16px; margin: 0px; overflow: visible; text-align: justify; text-align-last: left; white-space-collapse: preserve-breaks;">https://dfinview.com/BHFT</span>
|
|
| C000030726 |
|
|
| Shareholder Report [Line Items] |
|
|
| Fund Name |
JPMorgan Small Cap Value Portfolio
|
|
| Class Name |
Class B
|
|
| No Trading Symbol [Flag] |
true
|
|
| Annual or Semi-Annual Statement [Text Block] |
This semi-annual shareholder report contains important information about the JPMorgan Small Cap Value Portfolio (the "Portfolio") for the period of January 1, 2025 to June 30, 2025.
|
|
| Shareholder Report Annual or Semi-Annual |
Semi-Annual Shareholder Report
|
|
| Additional Information [Text Block] |
You can find additional information about the Portfolio at https://dfinview.com/BHFT. You can also request this information by contacting us at 1-888-243-1956.
|
|
| Additional Information Phone Number |
1-888-243-1956
|
|
| Additional Information Website |
<span style="box-sizing: border-box; color: rgb(0, 0, 0); display: inline; flex-wrap: nowrap; font-size: 12px; font-weight: 400; grid-area: auto; line-height: 18px; margin: 0px; overflow: visible; text-align: left; text-align-last: auto; white-space-collapse: preserve-breaks;">https://dfinview.com/BHFT</span>
|
|
| Expenses [Text Block] |
What were the Portfolio costs for last six months?This example shows the expenses you would have paid over the reporting period based on a hypothetical $10,000 investment.
Class Name |
Costs of a $10,000 investment |
Costs paid as a percentage of a $10,000 investment |
Class B |
$50 |
1.03%Footnote Reference* |
| Footnote |
Description |
Footnote* |
Annualized. | |
|
| Expenses Paid, Amount |
$ 50
|
|
| Expense Ratio, Percent |
1.03%
|
[51] |
| AssetsNet |
$ 319,789,215
|
|
| Holdings Count | Holding |
433
|
|
| Advisory Fees Paid, Amount |
$ 1,042,587
|
|
| InvestmentCompanyPortfolioTurnover |
44.00%
|
|
| Additional Fund Statistics [Text Block] |
- Total Net Assets$319,789,215
- # of Portfolio Investments433
- Portfolio Turnover Rate44%
- Total Advisory Fees Paid$1,042,587
|
|
| Holdings [Text Block] |
Value |
Value |
Communication Services |
2.1 |
Materials |
4.7 |
Utilities |
5.1 |
Energy |
6.3 |
Health Care |
7.4 |
Information Technology |
9.0 |
Real Estate |
9.8 |
Consumer Discretionary |
11.5 |
Industrials |
11.8 |
Financials |
27.7 |
Value |
Value |
Panama |
0.2 |
Switzerland |
0.2 |
Hong Kong |
0.2 |
Monaco |
0.4 |
United Kingdom |
0.5 |
Puerto Rico |
0.8 |
Bermuda |
1.1 |
Canada |
1.3 |
United States |
92.2 | |
|
| Largest Holdings [Text Block] |
Southwest Gas Holdings, Inc. |
1.1 |
Old National Bancorp |
0.9 |
Sanmina Corp. |
0.9 |
PotlatchDeltic Corp. |
0.8 |
Ladder Capital Corp. |
0.7 |
Bank of NT Butterfield & Son Ltd. |
0.7 |
ABM Industries, Inc. |
0.7 |
Jackson Financial, Inc. |
0.7 |
Essent Group Ltd. |
0.7 |
Enterprise Financial Services Corp. |
0.7 | |
|
| Material Fund Change [Text Block] |
|
|
| Updated Prospectus Phone Number |
1-888-243-1956
|
|
| Updated Prospectus Web Address |
<span style="box-sizing: border-box; color: rgb(0, 0, 0); display: inline; flex-wrap: nowrap; font-size: 10.6667px; font-weight: 400; grid-area: auto; line-height: 16px; margin: 0px; overflow: visible; text-align: justify; text-align-last: left; white-space-collapse: preserve-breaks;">https://dfinview.com/BHFT</span>
|
|
| C000030755 |
|
|
| Shareholder Report [Line Items] |
|
|
| Fund Name |
Loomis Sayles Global Allocation Portfolio
|
|
| Class Name |
Class A
|
|
| No Trading Symbol [Flag] |
true
|
|
| Annual or Semi-Annual Statement [Text Block] |
This semi-annual shareholder report contains important information about the Loomis Sayles Global Allocation Portfolio (the "Portfolio") for the period of January 1, 2025 to June 30, 2025.
|
|
| Shareholder Report Annual or Semi-Annual |
Semi-Annual Shareholder Report
|
|
| Additional Information [Text Block] |
You can find additional information about the Portfolio at https://dfinview.com/BHFT. You can also request this information by contacting us at 1-888-243-1956.
|
|
| Additional Information Phone Number |
1-888-243-1956
|
|
| Additional Information Website |
<span style="box-sizing: border-box; color: rgb(0, 0, 0); display: inline; flex-wrap: nowrap; font-size: 12px; font-weight: 400; grid-area: auto; line-height: 18px; margin: 0px; overflow: visible; text-align: left; text-align-last: auto; white-space-collapse: preserve-breaks;">https://dfinview.com/BHFT</span>
|
|
| Expenses [Text Block] |
What were the Portfolio costs for last six months?This example shows the expenses you would have paid over the reporting period based on a hypothetical $10,000 investment.
Class Name |
Costs of a $10,000 investment |
Costs paid as a percentage of a $10,000 investment |
Class A |
$40 |
0.79%Footnote Reference* |
| Footnote |
Description |
Footnote* |
Annualized. | |
|
| Expenses Paid, Amount |
$ 40
|
|
| Expense Ratio, Percent |
0.79%
|
[52] |
| AssetsNet |
$ 371,341,994
|
|
| Holdings Count | Holding |
457
|
|
| Advisory Fees Paid, Amount |
$ 1,246,698
|
|
| InvestmentCompanyPortfolioTurnover |
17.00%
|
|
| Additional Fund Statistics [Text Block] |
- Total Net Assets$371,341,994
- # of Portfolio Investments457
- Portfolio Turnover Rate17%
- Total Advisory Fees Paid$1,246,698
|
|
| Holdings [Text Block] |
Top 10 Fixed Income Issuers
U.S. Treasury Notes |
2.1 |
Glencore Funding LLC |
1.3 |
EchoStar Corp. |
1.2 |
Boeing Co. |
0.9 |
Teva Pharmaceutical Finance Netherlands III BV |
0.8 |
CSC Holdings LLC |
0.8 |
Broadcom, Inc. |
0.8 |
U.K. Gilts |
0.7 |
Rocket Mortgage LLC/Rocket Mortgage Co-Issuer, Inc. |
0.7 |
Canada Government Bonds |
0.7 |
Value |
Value |
Mexico |
1.0 |
Israel |
1.2 |
Australia |
2.1 |
Sweden |
2.2 |
Netherlands |
2.3 |
Taiwan |
2.7 |
Japan |
2.7 |
Canada |
3.0 |
United Kingdom |
4.1 |
United States |
67.5 |
Value |
Value |
Municipals |
0.1 |
Convertible Bonds |
0.5 |
Floating Rate Loans |
1.0 |
Short-Term Investments |
1.8 |
U.S. Treasury & Government Agencies |
2.7 |
Foreign Government |
8.2 |
Corporate Bonds & Notes |
18.1 |
Common Stocks |
67.3 | |
|
| Largest Holdings [Text Block] |
NVIDIA Corp. |
4.3 |
Amazon.com, Inc. |
3.5 |
S&P Global, Inc. |
3.3 |
Mastercard, Inc. |
3.1 |
Taiwan Semiconductor Manufacturing Co. Ltd. |
2.7 |
Parker-Hannifin Corp. |
2.5 |
Blackrock, Inc. |
2.5 |
Roper Technologies, Inc. |
2.2 |
O'Reilly Automotive, Inc. |
2.1 |
Linde PLC |
2.1 | |
|
| Updated Prospectus Phone Number |
1-888-243-1956
|
|
| Updated Prospectus Web Address |
<span style="box-sizing: border-box; color: rgb(0, 0, 0); display: inline; flex-wrap: nowrap; font-size: 10.6667px; font-weight: 400; grid-area: auto; line-height: 16px; margin: 0px; overflow: visible; text-align: justify; text-align-last: left; white-space-collapse: preserve-breaks;">https://dfinview.com/BHFT</span>
|
|
| C000030756 |
|
|
| Shareholder Report [Line Items] |
|
|
| Fund Name |
Loomis Sayles Global Allocation Portfolio
|
|
| Class Name |
Class B
|
|
| No Trading Symbol [Flag] |
true
|
|
| Annual or Semi-Annual Statement [Text Block] |
This semi-annual shareholder report contains important information about the Loomis Sayles Global Allocation Portfolio (the "Portfolio") for the period of January 1, 2025 to June 30, 2025.
|
|
| Shareholder Report Annual or Semi-Annual |
Semi-Annual Shareholder Report
|
|
| Additional Information [Text Block] |
You can find additional information about the Portfolio at https://dfinview.com/BHFT. You can also request this information by contacting us at 1-888-243-1956.
|
|
| Additional Information Phone Number |
1-888-243-1956
|
|
| Additional Information Website |
<span style="box-sizing: border-box; color: rgb(0, 0, 0); display: inline; flex-wrap: nowrap; font-size: 12px; font-weight: 400; grid-area: auto; line-height: 18px; margin: 0px; overflow: visible; text-align: left; text-align-last: auto; white-space-collapse: preserve-breaks;">https://dfinview.com/BHFT</span>
|
|
| Expenses [Text Block] |
What were the Portfolio costs for last six months?This example shows the expenses you would have paid over the reporting period based on a hypothetical $10,000 investment.
Class Name |
Costs of a $10,000 investment |
Costs paid as a percentage of a $10,000 investment |
Class B |
$53 |
1.04%Footnote Reference* |
| Footnote |
Description |
Footnote* |
Annualized. | |
|
| Expenses Paid, Amount |
$ 53
|
|
| Expense Ratio, Percent |
1.04%
|
[53] |
| AssetsNet |
$ 371,341,994
|
|
| Holdings Count | Holding |
457
|
|
| Advisory Fees Paid, Amount |
$ 1,246,698
|
|
| InvestmentCompanyPortfolioTurnover |
17.00%
|
|
| Additional Fund Statistics [Text Block] |
- Total Net Assets$371,341,994
- # of Portfolio Investments457
- Portfolio Turnover Rate17%
- Total Advisory Fees Paid$1,246,698
|
|
| Holdings [Text Block] |
Top 10 Fixed Income Issuers
U.S. Treasury Notes |
2.1 |
Glencore Funding LLC |
1.3 |
EchoStar Corp. |
1.2 |
Boeing Co. |
0.9 |
Teva Pharmaceutical Finance Netherlands III BV |
0.8 |
CSC Holdings LLC |
0.8 |
Broadcom, Inc. |
0.8 |
U.K. Gilts |
0.7 |
Rocket Mortgage LLC/Rocket Mortgage Co-Issuer, Inc. |
0.7 |
Canada Government Bonds |
0.7 |
Value |
Value |
Mexico |
1.0 |
Israel |
1.2 |
Australia |
2.1 |
Sweden |
2.2 |
Netherlands |
2.3 |
Taiwan |
2.7 |
Japan |
2.7 |
Canada |
3.0 |
United Kingdom |
4.1 |
United States |
67.5 |
Value |
Value |
Municipals |
0.1 |
Convertible Bonds |
0.5 |
Floating Rate Loans |
1.0 |
Short-Term Investments |
1.8 |
U.S. Treasury & Government Agencies |
2.7 |
Foreign Government |
8.2 |
Corporate Bonds & Notes |
18.1 |
Common Stocks |
67.3 | |
|
| Largest Holdings [Text Block] |
NVIDIA Corp. |
4.3 |
Amazon.com, Inc. |
3.5 |
S&P Global, Inc. |
3.3 |
Mastercard, Inc. |
3.1 |
Taiwan Semiconductor Manufacturing Co. Ltd. |
2.7 |
Parker-Hannifin Corp. |
2.5 |
Blackrock, Inc. |
2.5 |
Roper Technologies, Inc. |
2.2 |
O'Reilly Automotive, Inc. |
2.1 |
Linde PLC |
2.1 | |
|
| Updated Prospectus Phone Number |
1-888-243-1956
|
|
| Updated Prospectus Web Address |
<span style="box-sizing: border-box; color: rgb(0, 0, 0); display: inline; flex-wrap: nowrap; font-size: 10.6667px; font-weight: 400; grid-area: auto; line-height: 16px; margin: 0px; overflow: visible; text-align: justify; text-align-last: left; white-space-collapse: preserve-breaks;">https://dfinview.com/BHFT</span>
|
|
| C000030551 |
|
|
| Shareholder Report [Line Items] |
|
|
| Fund Name |
Loomis Sayles Growth Portfolio
|
|
| Class Name |
Class A
|
|
| No Trading Symbol [Flag] |
true
|
|
| Annual or Semi-Annual Statement [Text Block] |
This semi-annual shareholder report contains important information about the Loomis Sayles Growth Portfolio (the "Portfolio") for the period of January 1, 2025 to June 30, 2025.
|
|
| Shareholder Report Annual or Semi-Annual |
Semi-Annual Shareholder Report
|
|
| Additional Information [Text Block] |
You can find additional information about the Portfolio at https://dfinview.com/BHFT. You can also request this information by contacting us at 1-888-243-1956.
|
|
| Additional Information Phone Number |
1-888-243-1956
|
|
| Additional Information Website |
<span style="box-sizing: border-box; color: rgb(0, 0, 0); display: inline; flex-wrap: nowrap; font-size: 12px; font-weight: 400; grid-area: auto; line-height: 18px; margin: 0px; overflow: visible; text-align: left; text-align-last: auto; white-space-collapse: preserve-breaks;">https://dfinview.com/BHFT</span>
|
|
| Expenses [Text Block] |
What were the Portfolio costs for last six months?This example shows the expenses you would have paid over the reporting period based on a hypothetical $10,000 investment.
Class Name |
Costs of a $10,000 investment |
Costs paid as a percentage of a $10,000 investment |
Class A |
$28 |
0.55%Footnote Reference* |
| Footnote |
Description |
Footnote* |
Annualized. | |
|
| Expenses Paid, Amount |
$ 28
|
|
| Expense Ratio, Percent |
0.55%
|
[54] |
| AssetsNet |
$ 3,217,294,687
|
|
| Holdings Count | Holding |
56
|
|
| Advisory Fees Paid, Amount |
$ 7,992,404
|
|
| InvestmentCompanyPortfolioTurnover |
1.00%
|
|
| Additional Fund Statistics [Text Block] |
- Total Net Assets$3,217,294,687
- # of Portfolio Investments56
- Portfolio Turnover Rate1%
- Total Advisory Fees Paid$7,992,404
|
|
| Holdings [Text Block] |
Value |
Value |
Consumer Staples |
2.5 |
Industrials |
6.8 |
Financials |
8.6 |
Health Care |
10.4 |
Consumer Discretionary |
16.0 |
Communication Services |
24.6 |
Information Technology |
29.8 |
Value |
Value |
China |
0.6 |
Denmark |
1.4 |
Canada |
2.5 |
United States |
94.2 | |
|
| Largest Holdings [Text Block] |
NVIDIA Corp. |
10.1 |
Meta Platforms, Inc. |
8.5 |
Netflix, Inc. |
8.0 |
Tesla, Inc. |
6.4 |
Amazon.com, Inc. |
5.9 |
Oracle Corp. |
5.6 |
Alphabet, Inc. |
5.3 |
Visa, Inc. |
4.9 |
Boeing Co. |
4.8 |
Microsoft Corp. |
4.7 | |
|
| Material Fund Change [Text Block] |
|
|
| Updated Prospectus Phone Number |
1-888-243-1956
|
|
| Updated Prospectus Web Address |
<span style="box-sizing: border-box; color: rgb(0, 0, 0); display: inline; flex-wrap: nowrap; font-size: 10.6667px; font-weight: 400; grid-area: auto; line-height: 16px; margin: 0px; overflow: visible; text-align: justify; text-align-last: left; white-space-collapse: preserve-breaks;">https://dfinview.com/BHFT</span>
|
|
| C000030552 |
|
|
| Shareholder Report [Line Items] |
|
|
| Fund Name |
Loomis Sayles Growth Portfolio
|
|
| Class Name |
Class B
|
|
| No Trading Symbol [Flag] |
true
|
|
| Annual or Semi-Annual Statement [Text Block] |
This semi-annual shareholder report contains important information about the Loomis Sayles Growth Portfolio (the "Portfolio") for the period of January 1, 2025 to June 30, 2025.
|
|
| Shareholder Report Annual or Semi-Annual |
Semi-Annual Shareholder Report
|
|
| Additional Information [Text Block] |
You can find additional information about the Portfolio at https://dfinview.com/BHFT. You can also request this information by contacting us at 1-888-243-1956.
|
|
| Additional Information Phone Number |
1-888-243-1956
|
|
| Additional Information Website |
<span style="box-sizing: border-box; color: rgb(0, 0, 0); display: inline; flex-wrap: nowrap; font-size: 12px; font-weight: 400; grid-area: auto; line-height: 18px; margin: 0px; overflow: visible; text-align: left; text-align-last: auto; white-space-collapse: preserve-breaks;">https://dfinview.com/BHFT</span>
|
|
| Expenses [Text Block] |
What were the Portfolio costs for last six months?This example shows the expenses you would have paid over the reporting period based on a hypothetical $10,000 investment.
Class Name |
Costs of a $10,000 investment |
Costs paid as a percentage of a $10,000 investment |
Class B |
$41 |
0.80%Footnote Reference* |
| Footnote |
Description |
Footnote* |
Annualized. | |
|
| Expenses Paid, Amount |
$ 41
|
|
| Expense Ratio, Percent |
0.80%
|
[55] |
| AssetsNet |
$ 3,217,294,687
|
|
| Holdings Count | Holding |
56
|
|
| Advisory Fees Paid, Amount |
$ 7,992,404
|
|
| InvestmentCompanyPortfolioTurnover |
1.00%
|
|
| Additional Fund Statistics [Text Block] |
- Total Net Assets$3,217,294,687
- # of Portfolio Investments56
- Portfolio Turnover Rate1%
- Total Advisory Fees Paid$7,992,404
|
|
| Holdings [Text Block] |
Value |
Value |
Consumer Staples |
2.5 |
Industrials |
6.8 |
Financials |
8.6 |
Health Care |
10.4 |
Consumer Discretionary |
16.0 |
Communication Services |
24.6 |
Information Technology |
29.8 |
Value |
Value |
China |
0.6 |
Denmark |
1.4 |
Canada |
2.5 |
United States |
94.2 | |
|
| Largest Holdings [Text Block] |
NVIDIA Corp. |
10.1 |
Meta Platforms, Inc. |
8.5 |
Netflix, Inc. |
8.0 |
Tesla, Inc. |
6.4 |
Amazon.com, Inc. |
5.9 |
Oracle Corp. |
5.6 |
Alphabet, Inc. |
5.3 |
Visa, Inc. |
4.9 |
Boeing Co. |
4.8 |
Microsoft Corp. |
4.7 | |
|
| Material Fund Change [Text Block] |
|
|
| Updated Prospectus Phone Number |
1-888-243-1956
|
|
| Updated Prospectus Web Address |
<span style="box-sizing: border-box; color: rgb(0, 0, 0); display: inline; flex-wrap: nowrap; font-size: 10.6667px; font-weight: 400; grid-area: auto; line-height: 16px; margin: 0px; overflow: visible; text-align: justify; text-align-last: left; white-space-collapse: preserve-breaks;">https://dfinview.com/BHFT</span>
|
|
| C000030554 |
|
|
| Shareholder Report [Line Items] |
|
|
| Fund Name |
Loomis Sayles Growth Portfolio
|
|
| Class Name |
Class E
|
|
| No Trading Symbol [Flag] |
true
|
|
| Annual or Semi-Annual Statement [Text Block] |
This semi-annual shareholder report contains important information about the Loomis Sayles Growth Portfolio (the "Portfolio") for the period of January 1, 2025 to June 30, 2025.
|
|
| Shareholder Report Annual or Semi-Annual |
Semi-Annual Shareholder Report
|
|
| Additional Information [Text Block] |
You can find additional information about the Portfolio at https://dfinview.com/BHFT. You can also request this information by contacting us at 1-888-243-1956.
|
|
| Additional Information Phone Number |
1-888-243-1956
|
|
| Additional Information Website |
<span style="box-sizing: border-box; color: rgb(0, 0, 0); display: inline; flex-wrap: nowrap; font-size: 12px; font-weight: 400; grid-area: auto; line-height: 18px; margin: 0px; overflow: visible; text-align: left; text-align-last: auto; white-space-collapse: preserve-breaks;">https://dfinview.com/BHFT</span>
|
|
| Expenses [Text Block] |
What were the Portfolio costs for last six months?This example shows the expenses you would have paid over the reporting period based on a hypothetical $10,000 investment.
Class Name |
Costs of a $10,000 investment |
Costs paid as a percentage of a $10,000 investment |
Class E |
$36 |
0.70%Footnote Reference* |
| Footnote |
Description |
Footnote* |
Annualized. | |
|
| Expenses Paid, Amount |
$ 36
|
|
| Expense Ratio, Percent |
0.70%
|
[56] |
| AssetsNet |
$ 3,217,294,687
|
|
| Holdings Count | Holding |
56
|
|
| Advisory Fees Paid, Amount |
$ 7,992,404
|
|
| InvestmentCompanyPortfolioTurnover |
1.00%
|
|
| Additional Fund Statistics [Text Block] |
- Total Net Assets$3,217,294,687
- # of Portfolio Investments56
- Portfolio Turnover Rate1%
- Total Advisory Fees Paid$7,992,404
|
|
| Holdings [Text Block] |
Value |
Value |
Consumer Staples |
2.5 |
Industrials |
6.8 |
Financials |
8.6 |
Health Care |
10.4 |
Consumer Discretionary |
16.0 |
Communication Services |
24.6 |
Information Technology |
29.8 |
Value |
Value |
China |
0.6 |
Denmark |
1.4 |
Canada |
2.5 |
United States |
94.2 | |
|
| Largest Holdings [Text Block] |
NVIDIA Corp. |
10.1 |
Meta Platforms, Inc. |
8.5 |
Netflix, Inc. |
8.0 |
Tesla, Inc. |
6.4 |
Amazon.com, Inc. |
5.9 |
Oracle Corp. |
5.6 |
Alphabet, Inc. |
5.3 |
Visa, Inc. |
4.9 |
Boeing Co. |
4.8 |
Microsoft Corp. |
4.7 | |
|
| Material Fund Change [Text Block] |
|
|
| Updated Prospectus Phone Number |
1-888-243-1956
|
|
| Updated Prospectus Web Address |
<span style="box-sizing: border-box; color: rgb(0, 0, 0); display: inline; flex-wrap: nowrap; font-size: 10.6667px; font-weight: 400; grid-area: auto; line-height: 16px; margin: 0px; overflow: visible; text-align: justify; text-align-last: left; white-space-collapse: preserve-breaks;">https://dfinview.com/BHFT</span>
|
|
| C000119619 |
|
|
| Shareholder Report [Line Items] |
|
|
| Fund Name |
MetLife Multi-Index Targeted Risk Portfolio
|
|
| Class Name |
Class B
|
|
| No Trading Symbol [Flag] |
true
|
|
| Annual or Semi-Annual Statement [Text Block] |
This semi-annual shareholder report contains important information about the MetLife Multi-Index Targeted Risk Portfolio (the "Portfolio") for the period of January 1, 2025 to June 30, 2025.
|
|
| Shareholder Report Annual or Semi-Annual |
Semi-Annual Shareholder Report
|
|
| Additional Information [Text Block] |
You can find additional information about the Portfolio at https://dfinview.com/BHFT. You can also request this information by contacting us at 1-888-243-1956.
|
|
| Additional Information Phone Number |
1-888-243-1956
|
|
| Additional Information Website |
<span style="box-sizing: border-box; color: rgb(0, 0, 0); display: inline; flex-wrap: nowrap; font-size: 12px; font-weight: 400; grid-area: auto; line-height: 18px; margin: 0px; overflow: visible; text-align: left; text-align-last: auto; white-space-collapse: preserve-breaks;">https://dfinview.com/BHFT</span>
|
|
| Expenses [Text Block] |
What were the Portfolio costs for last six months?This example shows the expenses you would have paid over the reporting period based on a hypothetical $10,000 investment.
Class Name |
Costs of a $10,000 investment |
Costs paid as a percentage of a $10,000 investment |
Class B |
$20 |
0.41%Footnote Reference* |
| Footnote |
Description |
Footnote* |
Annualized. | |
|
| Expenses Paid, Amount |
$ 20
|
|
| Expense Ratio, Percent |
0.41%
|
[57] |
| AssetsNet |
$ 5,383,256,490
|
|
| Holdings Count | Holding |
31
|
|
| Advisory Fees Paid, Amount |
$ 4,166,843
|
|
| InvestmentCompanyPortfolioTurnover |
4.00%
|
|
| Additional Fund Statistics [Text Block] |
- Total Net Assets$5,383,256,490
- # of Portfolio Investments31
- Portfolio Turnover Rate4%
- Total Advisory Fees Paid$4,166,843
|
|
| Holdings [Text Block] |
Value |
Value |
U.S. Small Cap Equities |
3.7 |
U.S. Mid Cap Equities |
6.2 |
International Developed Market Equities |
14.2 |
U.S. Large Cap Equities |
21.0 |
Investment Grade Fixed Income |
40.5 | |
|
| Updated Prospectus Phone Number |
1-888-243-1956
|
|
| Updated Prospectus Web Address |
<span style="box-sizing: border-box; color: rgb(0, 0, 0); display: inline; flex-wrap: nowrap; font-size: 10.6667px; font-weight: 400; grid-area: auto; line-height: 16px; margin: 0px; overflow: visible; text-align: justify; text-align-last: left; white-space-collapse: preserve-breaks;">https://dfinview.com/BHFT</span>
|
|
| C000030615 |
|
|
| Shareholder Report [Line Items] |
|
|
| Fund Name |
MFS<sup style="box-sizing: border-box; color: rgb(0, 0, 0); display: inline; flex-wrap: nowrap; font-size: 12px; font-weight: 700; grid-area: auto; line-height: 0px; margin: 0px; overflow: visible; position: relative; text-align: left; text-align-last: auto; white-space-collapse: preserve-breaks;">®</sup> Research International Portfolio
|
|
| Class Name |
Class A
|
|
| No Trading Symbol [Flag] |
true
|
|
| Annual or Semi-Annual Statement [Text Block] |
This semi-annual shareholder report contains important information about the MFS® Research International Portfolio (the "Portfolio") for the period of January 1, 2025 to June 30, 2025.
|
|
| Shareholder Report Annual or Semi-Annual |
Semi-Annual Shareholder Report
|
|
| Additional Information [Text Block] |
You can find additional information about the Portfolio at https://dfinview.com/BHFT. You can also request this information by contacting us at 1-888-243-1956.
|
|
| Additional Information Phone Number |
1-888-243-1956
|
|
| Additional Information Website |
<span style="box-sizing: border-box; color: rgb(0, 0, 0); display: inline; flex-wrap: nowrap; font-size: 12px; font-weight: 400; grid-area: auto; line-height: 18px; margin: 0px; overflow: visible; text-align: left; text-align-last: auto; white-space-collapse: preserve-breaks;">https://dfinview.com/BHFT</span>
|
|
| Expenses [Text Block] |
What were the Portfolio costs for last six months?This example shows the expenses you would have paid over the reporting period based on a hypothetical $10,000 investment.
Class Name |
Costs of a $10,000 investment |
Costs paid as a percentage of a $10,000 investment |
Class A |
$34 |
0.64%Footnote Reference* |
| Footnote |
Description |
Footnote* |
Annualized. | |
|
| Expenses Paid, Amount |
$ 34
|
|
| Expense Ratio, Percent |
0.64%
|
[58] |
| AssetsNet |
$ 1,422,821,560
|
|
| Holdings Count | Holding |
127
|
|
| Advisory Fees Paid, Amount |
$ 4,103,576
|
|
| InvestmentCompanyPortfolioTurnover |
15.00%
|
|
| Additional Fund Statistics [Text Block] |
- Total Net Assets$1,422,821,560
- # of Portfolio Investments127
- Portfolio Turnover Rate15%
- Total Advisory Fees Paid$4,103,576
|
|
| Holdings [Text Block] |
Value |
Value |
Utilities |
2.7 |
Energy |
3.9 |
Communication Services |
4.7 |
Consumer Staples |
7.1 |
Materials |
7.6 |
Information Technology |
7.7 |
Consumer Discretionary |
9.3 |
Health Care |
10.4 |
Industrials |
19.4 |
Financials |
24.7 |
Value |
Value |
Hong Kong |
1.8 |
Denmark |
2.3 |
Canada |
2.5 |
Switzerland |
3.3 |
Germany |
4.9 |
France |
7.7 |
Netherlands |
8.3 |
United Kingdom |
14.8 |
United States |
18.0 |
Japan |
18.7 | |
|
| Largest Holdings [Text Block] |
Schneider Electric SE |
2.8 |
Roche Holding AG |
2.6 |
Hitachi Ltd. |
2.5 |
Linde PLC |
2.1 |
Nestle SA |
2.1 |
Euronext NV |
2.0 |
Barclays PLC |
2.0 |
NatWest Group PLC |
1.9 |
Novo Nordisk AS |
1.7 |
BNP Paribas SA |
1.6 | |
|
| Material Fund Change [Text Block] |
|
|
| Updated Prospectus Phone Number |
1-888-243-1956
|
|
| Updated Prospectus Web Address |
<span style="box-sizing: border-box; color: rgb(0, 0, 0); display: inline; flex-wrap: nowrap; font-size: 10.6667px; font-weight: 400; grid-area: auto; line-height: 16px; margin: 0px; overflow: visible; text-align: justify; text-align-last: left; white-space-collapse: preserve-breaks;">https://dfinview.com/BHFT</span>
|
|
| C000030616 |
|
|
| Shareholder Report [Line Items] |
|
|
| Fund Name |
MFS<sup style="box-sizing: border-box; color: rgb(0, 0, 0); display: inline; flex-wrap: nowrap; font-size: 12px; font-weight: 700; grid-area: auto; line-height: 0px; margin: 0px; overflow: visible; position: relative; text-align: left; text-align-last: auto; white-space-collapse: preserve-breaks;">®</sup> Research International Portfolio
|
|
| Class Name |
Class B
|
|
| No Trading Symbol [Flag] |
true
|
|
| Annual or Semi-Annual Statement [Text Block] |
This semi-annual shareholder report contains important information about the MFS® Research International Portfolio (the "Portfolio") for the period of January 1, 2025 to June 30, 2025.
|
|
| Shareholder Report Annual or Semi-Annual |
Semi-Annual Shareholder Report
|
|
| Additional Information [Text Block] |
You can find additional information about the Portfolio at https://dfinview.com/BHFT. You can also request this information by contacting us at 1-888-243-1956.
|
|
| Additional Information Phone Number |
1-888-243-1956
|
|
| Additional Information Website |
<span style="box-sizing: border-box; color: rgb(0, 0, 0); display: inline; flex-wrap: nowrap; font-size: 12px; font-weight: 400; grid-area: auto; line-height: 18px; margin: 0px; overflow: visible; text-align: left; text-align-last: auto; white-space-collapse: preserve-breaks;">https://dfinview.com/BHFT</span>
|
|
| Expenses [Text Block] |
What were the Portfolio costs for last six months?This example shows the expenses you would have paid over the reporting period based on a hypothetical $10,000 investment.
Class Name |
Costs of a $10,000 investment |
Costs paid as a percentage of a $10,000 investment |
Class B |
$48 |
0.89%Footnote Reference* |
| Footnote |
Description |
Footnote* |
Annualized. | |
|
| Expenses Paid, Amount |
$ 48
|
|
| Expense Ratio, Percent |
0.89%
|
[59] |
| AssetsNet |
$ 1,422,821,560
|
|
| Holdings Count | Holding |
127
|
|
| Advisory Fees Paid, Amount |
$ 4,103,576
|
|
| InvestmentCompanyPortfolioTurnover |
15.00%
|
|
| Additional Fund Statistics [Text Block] |
- Total Net Assets$1,422,821,560
- # of Portfolio Investments127
- Portfolio Turnover Rate15%
- Total Advisory Fees Paid$4,103,576
|
|
| Holdings [Text Block] |
Value |
Value |
Utilities |
2.7 |
Energy |
3.9 |
Communication Services |
4.7 |
Consumer Staples |
7.1 |
Materials |
7.6 |
Information Technology |
7.7 |
Consumer Discretionary |
9.3 |
Health Care |
10.4 |
Industrials |
19.4 |
Financials |
24.7 |
Value |
Value |
Hong Kong |
1.8 |
Denmark |
2.3 |
Canada |
2.5 |
Switzerland |
3.3 |
Germany |
4.9 |
France |
7.7 |
Netherlands |
8.3 |
United Kingdom |
14.8 |
United States |
18.0 |
Japan |
18.7 | |
|
| Largest Holdings [Text Block] |
Schneider Electric SE |
2.8 |
Roche Holding AG |
2.6 |
Hitachi Ltd. |
2.5 |
Linde PLC |
2.1 |
Nestle SA |
2.1 |
Euronext NV |
2.0 |
Barclays PLC |
2.0 |
NatWest Group PLC |
1.9 |
Novo Nordisk AS |
1.7 |
BNP Paribas SA |
1.6 | |
|
| Material Fund Change [Text Block] |
|
|
| Updated Prospectus Phone Number |
1-888-243-1956
|
|
| Updated Prospectus Web Address |
<span style="box-sizing: border-box; color: rgb(0, 0, 0); display: inline; flex-wrap: nowrap; font-size: 10.6667px; font-weight: 400; grid-area: auto; line-height: 16px; margin: 0px; overflow: visible; text-align: justify; text-align-last: left; white-space-collapse: preserve-breaks;">https://dfinview.com/BHFT</span>
|
|
| C000030618 |
|
|
| Shareholder Report [Line Items] |
|
|
| Fund Name |
MFS<sup style="box-sizing: border-box; color: rgb(0, 0, 0); display: inline; flex-wrap: nowrap; font-size: 12px; font-weight: 700; grid-area: auto; line-height: 0px; margin: 0px; overflow: visible; position: relative; text-align: left; text-align-last: auto; white-space-collapse: preserve-breaks;">®</sup> Research International Portfolio
|
|
| Class Name |
Class E
|
|
| No Trading Symbol [Flag] |
true
|
|
| Annual or Semi-Annual Statement [Text Block] |
This semi-annual shareholder report contains important information about the MFS® Research International Portfolio (the "Portfolio") for the period of January 1, 2025 to June 30, 2025.
|
|
| Shareholder Report Annual or Semi-Annual |
Semi-Annual Shareholder Report
|
|
| Additional Information [Text Block] |
You can find additional information about the Portfolio at https://dfinview.com/BHFT. You can also request this information by contacting us at 1-888-243-1956.
|
|
| Additional Information Phone Number |
1-888-243-1956
|
|
| Additional Information Website |
<span style="box-sizing: border-box; color: rgb(0, 0, 0); display: inline; flex-wrap: nowrap; font-size: 12px; font-weight: 400; grid-area: auto; line-height: 18px; margin: 0px; overflow: visible; text-align: left; text-align-last: auto; white-space-collapse: preserve-breaks;">https://dfinview.com/BHFT</span>
|
|
| Expenses [Text Block] |
What were the Portfolio costs for last six months?This example shows the expenses you would have paid over the reporting period based on a hypothetical $10,000 investment.
Class Name |
Costs of a $10,000 investment |
Costs paid as a percentage of a $10,000 investment |
Class E |
$42 |
0.79%Footnote Reference* |
| Footnote |
Description |
Footnote* |
Annualized. | |
|
| Expenses Paid, Amount |
$ 42
|
|
| Expense Ratio, Percent |
0.79%
|
[60] |
| AssetsNet |
$ 1,422,821,560
|
|
| Holdings Count | Holding |
127
|
|
| Advisory Fees Paid, Amount |
$ 4,103,576
|
|
| InvestmentCompanyPortfolioTurnover |
15.00%
|
|
| Additional Fund Statistics [Text Block] |
- Total Net Assets$1,422,821,560
- # of Portfolio Investments127
- Portfolio Turnover Rate15%
- Total Advisory Fees Paid$4,103,576
|
|
| Holdings [Text Block] |
Value |
Value |
Utilities |
2.7 |
Energy |
3.9 |
Communication Services |
4.7 |
Consumer Staples |
7.1 |
Materials |
7.6 |
Information Technology |
7.7 |
Consumer Discretionary |
9.3 |
Health Care |
10.4 |
Industrials |
19.4 |
Financials |
24.7 |
Value |
Value |
Hong Kong |
1.8 |
Denmark |
2.3 |
Canada |
2.5 |
Switzerland |
3.3 |
Germany |
4.9 |
France |
7.7 |
Netherlands |
8.3 |
United Kingdom |
14.8 |
United States |
18.0 |
Japan |
18.7 | |
|
| Largest Holdings [Text Block] |
Schneider Electric SE |
2.8 |
Roche Holding AG |
2.6 |
Hitachi Ltd. |
2.5 |
Linde PLC |
2.1 |
Nestle SA |
2.1 |
Euronext NV |
2.0 |
Barclays PLC |
2.0 |
NatWest Group PLC |
1.9 |
Novo Nordisk AS |
1.7 |
BNP Paribas SA |
1.6 | |
|
| Material Fund Change [Text Block] |
|
|
| Updated Prospectus Phone Number |
1-888-243-1956
|
|
| Updated Prospectus Web Address |
<span style="box-sizing: border-box; color: rgb(0, 0, 0); display: inline; flex-wrap: nowrap; font-size: 10.6667px; font-weight: 400; grid-area: auto; line-height: 16px; margin: 0px; overflow: visible; text-align: justify; text-align-last: left; white-space-collapse: preserve-breaks;">https://dfinview.com/BHFT</span>
|
|
| C000030581 |
|
|
| Shareholder Report [Line Items] |
|
|
| Fund Name |
Morgan Stanley Discovery Portfolio
|
|
| Class Name |
Class A
|
|
| No Trading Symbol [Flag] |
true
|
|
| Annual or Semi-Annual Statement [Text Block] |
This semi-annual shareholder report contains important information about the Morgan Stanley Discovery Portfolio (the "Portfolio") for the period of January 1, 2025 to June 30, 2025.
|
|
| Shareholder Report Annual or Semi-Annual |
Semi-Annual Shareholder Report
|
|
| Additional Information [Text Block] |
You can find additional information about the Portfolio at https://dfinview.com/BHFT. You can also request this information by contacting us at 1-888-243-1956.
|
|
| Additional Information Phone Number |
1-888-243-1956
|
|
| Additional Information Website |
<span style="box-sizing: border-box; color: rgb(0, 0, 0); display: inline; flex-wrap: nowrap; font-size: 12px; font-weight: 400; grid-area: auto; line-height: 18px; margin: 0px; overflow: visible; text-align: left; text-align-last: auto; white-space-collapse: preserve-breaks;">https://dfinview.com/BHFT</span>
|
|
| Expenses [Text Block] |
What were the Portfolio costs for last six months?This example shows the expenses you would have paid over the reporting period based on a hypothetical $10,000 investment.
Class Name |
Costs of a $10,000 investment |
Costs paid as a percentage of a $10,000 investment |
Class A |
$36 |
0.65%Footnote Reference* |
| Footnote |
Description |
Footnote* |
Annualized. | |
|
| Expenses Paid, Amount |
$ 36
|
|
| Expense Ratio, Percent |
0.65%
|
[61] |
| AssetsNet |
$ 1,447,121,474
|
|
| Holdings Count | Holding |
80
|
|
| Advisory Fees Paid, Amount |
$ 3,940,516
|
|
| InvestmentCompanyPortfolioTurnover |
48.00%
|
|
| Additional Fund Statistics [Text Block] |
- Total Net Assets$1,447,121,474
- # of Portfolio Investments80
- Portfolio Turnover Rate48%
- Total Advisory Fees Paid$3,940,516
|
|
| Holdings [Text Block] |
Value |
Value |
Real Estate |
2.4 |
Consumer Staples |
4.1 |
Health Care |
9.5 |
Communication Services |
10.5 |
Financials |
10.9 |
Industrials |
12.2 |
Consumer Discretionary |
12.4 |
Information Technology |
36.9 |
Value |
Value |
Netherlands |
0.2 |
Israel |
7.1 |
United States |
91.7 | |
|
| Largest Holdings [Text Block] |
Cloudflare, Inc. |
13.1 |
QXO, Inc. |
6.5 |
Affirm Holdings, Inc. |
6.3 |
MicroStrategy, Inc. |
5.8 |
ROBLOX Corp. |
5.8 |
IonQ, Inc. |
5.0 |
Core & Main, Inc. |
5.0 |
Royalty Pharma PLC |
4.8 |
Trade Desk, Inc. |
4.8 |
Aurora Innovation, Inc. |
3.6 | |
|
| Material Fund Change [Text Block] |
|
|
| Updated Prospectus Phone Number |
1-888-243-1956
|
|
| Updated Prospectus Web Address |
<span style="box-sizing: border-box; color: rgb(0, 0, 0); display: inline; flex-wrap: nowrap; font-size: 10.6667px; font-weight: 400; grid-area: auto; line-height: 16px; margin: 0px; overflow: visible; text-align: justify; text-align-last: left; white-space-collapse: preserve-breaks;">https://dfinview.com/BHFT</span>
|
|
| C000030582 |
|
|
| Shareholder Report [Line Items] |
|
|
| Fund Name |
Morgan Stanley Discovery Portfolio
|
|
| Class Name |
Class B
|
|
| No Trading Symbol [Flag] |
true
|
|
| Annual or Semi-Annual Statement [Text Block] |
This semi-annual shareholder report contains important information about the Morgan Stanley Discovery Portfolio (the "Portfolio") for the period of January 1, 2025 to June 30, 2025.
|
|
| Shareholder Report Annual or Semi-Annual |
Semi-Annual Shareholder Report
|
|
| Additional Information [Text Block] |
You can find additional information about the Portfolio at https://dfinview.com/BHFT. You can also request this information by contacting us at 1-888-243-1956.
|
|
| Additional Information Phone Number |
1-888-243-1956
|
|
| Additional Information Website |
<span style="box-sizing: border-box; color: rgb(0, 0, 0); display: inline; flex-wrap: nowrap; font-size: 12px; font-weight: 400; grid-area: auto; line-height: 18px; margin: 0px; overflow: visible; text-align: left; text-align-last: auto; white-space-collapse: preserve-breaks;">https://dfinview.com/BHFT</span>
|
|
| Expenses [Text Block] |
What were the Portfolio costs for last six months?This example shows the expenses you would have paid over the reporting period based on a hypothetical $10,000 investment.
Class Name |
Costs of a $10,000 investment |
Costs paid as a percentage of a $10,000 investment |
Class B |
$50 |
0.90%Footnote Reference* |
| Footnote |
Description |
Footnote* |
Annualized. | |
|
| Expenses Paid, Amount |
$ 50
|
|
| Expense Ratio, Percent |
0.90%
|
[62] |
| AssetsNet |
$ 1,447,121,474
|
|
| Holdings Count | Holding |
80
|
|
| Advisory Fees Paid, Amount |
$ 3,940,516
|
|
| InvestmentCompanyPortfolioTurnover |
48.00%
|
|
| Additional Fund Statistics [Text Block] |
- Total Net Assets$1,447,121,474
- # of Portfolio Investments80
- Portfolio Turnover Rate48%
- Total Advisory Fees Paid$3,940,516
|
|
| Holdings [Text Block] |
Value |
Value |
Real Estate |
2.4 |
Consumer Staples |
4.1 |
Health Care |
9.5 |
Communication Services |
10.5 |
Financials |
10.9 |
Industrials |
12.2 |
Consumer Discretionary |
12.4 |
Information Technology |
36.9 |
Value |
Value |
Netherlands |
0.2 |
Israel |
7.1 |
United States |
91.7 | |
|
| Largest Holdings [Text Block] |
Cloudflare, Inc. |
13.1 |
QXO, Inc. |
6.5 |
Affirm Holdings, Inc. |
6.3 |
MicroStrategy, Inc. |
5.8 |
ROBLOX Corp. |
5.8 |
IonQ, Inc. |
5.0 |
Core & Main, Inc. |
5.0 |
Royalty Pharma PLC |
4.8 |
Trade Desk, Inc. |
4.8 |
Aurora Innovation, Inc. |
3.6 | |
|
| Material Fund Change [Text Block] |
|
|
| Updated Prospectus Phone Number |
1-888-243-1956
|
|
| Updated Prospectus Web Address |
<span style="box-sizing: border-box; color: rgb(0, 0, 0); display: inline; flex-wrap: nowrap; font-size: 10.6667px; font-weight: 400; grid-area: auto; line-height: 16px; margin: 0px; overflow: visible; text-align: justify; text-align-last: left; white-space-collapse: preserve-breaks;">https://dfinview.com/BHFT</span>
|
|
| C000030584 |
|
|
| Shareholder Report [Line Items] |
|
|
| Fund Name |
Morgan Stanley Discovery Portfolio
|
|
| Class Name |
Class E
|
|
| No Trading Symbol [Flag] |
true
|
|
| Annual or Semi-Annual Statement [Text Block] |
This semi-annual shareholder report contains important information about the Morgan Stanley Discovery Portfolio (the "Portfolio") for the period of January 1, 2025 to June 30, 2025.
|
|
| Shareholder Report Annual or Semi-Annual |
Semi-Annual Shareholder Report
|
|
| Additional Information [Text Block] |
You can find additional information about the Portfolio at https://dfinview.com/BHFT. You can also request this information by contacting us at 1-888-243-1956.
|
|
| Additional Information Phone Number |
1-888-243-1956
|
|
| Additional Information Website |
<span style="box-sizing: border-box; color: rgb(0, 0, 0); display: inline; flex-wrap: nowrap; font-size: 12px; font-weight: 400; grid-area: auto; line-height: 18px; margin: 0px; overflow: visible; text-align: left; text-align-last: auto; white-space-collapse: preserve-breaks;">https://dfinview.com/BHFT</span>
|
|
| Expenses [Text Block] |
What were the Portfolio costs for last six months?This example shows the expenses you would have paid over the reporting period based on a hypothetical $10,000 investment.
Class Name |
Costs of a $10,000 investment |
Costs paid as a percentage of a $10,000 investment |
Class E |
$44 |
0.80%Footnote Reference* |
| Footnote |
Description |
Footnote* |
Annualized. | |
|
| Expenses Paid, Amount |
$ 44
|
|
| Expense Ratio, Percent |
0.80%
|
[63] |
| AssetsNet |
$ 1,447,121,474
|
|
| Holdings Count | Holding |
80
|
|
| Advisory Fees Paid, Amount |
$ 3,940,516
|
|
| InvestmentCompanyPortfolioTurnover |
48.00%
|
|
| Additional Fund Statistics [Text Block] |
- Total Net Assets$1,447,121,474
- # of Portfolio Investments80
- Portfolio Turnover Rate48%
- Total Advisory Fees Paid$3,940,516
|
|
| Holdings [Text Block] |
Value |
Value |
Real Estate |
2.4 |
Consumer Staples |
4.1 |
Health Care |
9.5 |
Communication Services |
10.5 |
Financials |
10.9 |
Industrials |
12.2 |
Consumer Discretionary |
12.4 |
Information Technology |
36.9 |
Value |
Value |
Netherlands |
0.2 |
Israel |
7.1 |
United States |
91.7 | |
|
| Largest Holdings [Text Block] |
Cloudflare, Inc. |
13.1 |
QXO, Inc. |
6.5 |
Affirm Holdings, Inc. |
6.3 |
MicroStrategy, Inc. |
5.8 |
ROBLOX Corp. |
5.8 |
IonQ, Inc. |
5.0 |
Core & Main, Inc. |
5.0 |
Royalty Pharma PLC |
4.8 |
Trade Desk, Inc. |
4.8 |
Aurora Innovation, Inc. |
3.6 | |
|
| Material Fund Change [Text Block] |
|
|
| Updated Prospectus Phone Number |
1-888-243-1956
|
|
| Updated Prospectus Web Address |
<span style="box-sizing: border-box; color: rgb(0, 0, 0); display: inline; flex-wrap: nowrap; font-size: 10.6667px; font-weight: 400; grid-area: auto; line-height: 16px; margin: 0px; overflow: visible; text-align: justify; text-align-last: left; white-space-collapse: preserve-breaks;">https://dfinview.com/BHFT</span>
|
|
| C000100071 |
|
|
| Shareholder Report [Line Items] |
|
|
| Fund Name |
PanAgora Global Diversified Risk Portfolio
|
|
| Class Name |
Class B
|
|
| No Trading Symbol [Flag] |
true
|
|
| Annual or Semi-Annual Statement [Text Block] |
This semi-annual shareholder report contains important information about the PanAgora Global Diversified Risk Portfolio (the "Portfolio") for the period of January 1, 2025 to June 30, 2025.
|
|
| Shareholder Report Annual or Semi-Annual |
Semi-Annual Shareholder Report
|
|
| Additional Information [Text Block] |
You can find additional information about the Portfolio at https://dfinview.com/BHFT. You can also request this information by contacting us at 1-888-243-1956.
|
|
| Additional Information Phone Number |
1-888-243-1956
|
|
| Additional Information Website |
<span style="box-sizing: border-box; color: rgb(0, 0, 0); display: inline; flex-wrap: nowrap; font-size: 12px; font-weight: 400; grid-area: auto; line-height: 18px; margin: 0px; overflow: visible; text-align: left; text-align-last: auto; white-space-collapse: preserve-breaks;">https://dfinview.com/BHFT</span>
|
|
| Expenses [Text Block] |
What were the Portfolio costs for last six months?This example shows the expenses you would have paid over the reporting period based on a hypothetical $10,000 investment.
Class Name |
Costs of a $10,000 investment |
Costs paid as a percentage of a $10,000 investment |
Class B |
$48 |
0.93%Footnote Reference* |
| Footnote |
Description |
Footnote* |
Annualized. | |
|
| Expenses Paid, Amount |
$ 48
|
|
| Expense Ratio, Percent |
0.93%
|
[64] |
| AssetsNet |
$ 1,221,367,009
|
|
| Holdings Count | Holding |
686
|
|
| Advisory Fees Paid, Amount |
$ 3,813,888
|
|
| InvestmentCompanyPortfolioTurnover |
52.00%
|
|
| Additional Fund Statistics [Text Block] |
- Total Net Assets$1,221,367,009
- # of Portfolio Investments686
- Portfolio Turnover Rate52%
- Total Advisory Fees Paid$3,813,888
|
|
| Holdings [Text Block] |
U.S. Treasury Inflation-Indexed Notes |
11.0 |
U.S. Treasury Inflation-Indexed Bonds |
1.0 |
Value |
Value |
Italy |
0.3 |
Switzerland |
0.3 |
Spain |
0.3 |
France |
0.4 |
Germany |
0.5 |
Australia |
0.5 |
United Kingdom |
0.8 |
Canada |
0.8 |
Japan |
1.3 |
United States |
17.6 |
Value |
Value |
Global Developed Inflation-Linked |
3.8 |
U.S. Small Cap Equities |
4.1 |
U.S. Large Cap Equities |
6.7 |
Emerging Market Equities |
14.2 |
International Developed Equities |
24.2 |
Commodities |
38.4 |
Global Developed Bonds |
63.4 | |
|
| Largest Holdings [Text Block] |
Iberdrola SA |
0.2 |
Spotify Technology SA |
0.2 |
Shell PLC |
0.2 |
Novartis AG |
0.2 |
Apple, Inc. |
0.1 |
Enel SpA |
0.1 |
BP PLC |
0.1 |
BHP Group Ltd. |
0.1 |
SAP SE |
0.1 |
Walmart, Inc. |
0.1 | |
|
| Updated Prospectus Phone Number |
1-888-243-1956
|
|
| Updated Prospectus Web Address |
<span style="box-sizing: border-box; color: rgb(0, 0, 0); display: inline; flex-wrap: nowrap; font-size: 10.6667px; font-weight: 400; grid-area: auto; line-height: 16px; margin: 0px; overflow: visible; text-align: justify; text-align-last: left; white-space-collapse: preserve-breaks;">https://dfinview.com/BHFT</span>
|
|
| C000030630 |
|
|
| Shareholder Report [Line Items] |
|
|
| Fund Name |
PIMCO Inflation Protected Bond Portfolio
|
|
| Class Name |
Class A
|
|
| No Trading Symbol [Flag] |
true
|
|
| Annual or Semi-Annual Statement [Text Block] |
This semi-annual shareholder report contains important information about the PIMCO Inflation Protected Bond Portfolio (the "Portfolio") for the period of January 1, 2025 to June 30, 2025.
|
|
| Shareholder Report Annual or Semi-Annual |
Semi-Annual Shareholder Report
|
|
| Additional Information [Text Block] |
You can find additional information about the Portfolio at https://dfinview.com/BHFT. You can also request this information by contacting us at 1-888-243-1956.
|
|
| Additional Information Phone Number |
1-888-243-1956
|
|
| Additional Information Website |
<span style="box-sizing: border-box; color: rgb(0, 0, 0); display: inline; flex-wrap: nowrap; font-size: 12px; font-weight: 400; grid-area: auto; line-height: 18px; margin: 0px; overflow: visible; text-align: left; text-align-last: auto; white-space-collapse: preserve-breaks;">https://dfinview.com/BHFT</span>
|
|
| Expenses [Text Block] |
What were the Portfolio costs for last six months?This example shows the expenses you would have paid over the reporting period based on a hypothetical $10,000 investment.
Class Name |
Costs of a $10,000 investment |
Costs paid as a percentage of a $10,000 investment |
Class A |
$52 |
1.03%Footnote Reference* |
| Footnote |
Description |
Footnote* |
Annualized. | |
|
| Expenses Paid, Amount |
$ 52
|
|
| Expense Ratio, Percent |
1.03%
|
[65] |
| AssetsNet |
$ 1,466,761,932
|
|
| Holdings Count | Holding |
580
|
|
| Advisory Fees Paid, Amount |
$ 3,539,376
|
|
| InvestmentCompanyPortfolioTurnover |
97.00%
|
|
| Additional Fund Statistics [Text Block] |
- Total Net Assets$1,466,761,932
- # of Portfolio Investments580
- Portfolio Turnover Rate97%
- Total Advisory Fees Paid$3,539,376
|
|
| Holdings [Text Block] |
Value |
Value |
Convertible Preferred Stocks |
0.1 |
Corporate Bonds & Notes |
0.4 |
Non-Agency Mortgage-Backed Securities |
1.4 |
Foreign Government |
4.6 |
Asset-Backed Securities |
8.7 |
Agency Sponsored Mortgage-Backed Securities |
19.2 |
Short-Term Investments |
39.9 |
U.S. Treasury & Government Agencies |
87.4 | |
|
| Largest Holdings [Text Block] |
Top 10 Fixed Income Issuers
U.S. Treasury Inflation-Indexed Notes |
58.4 |
U.S. Treasury Inflation-Indexed Bonds |
29.0 |
Uniform Mortgage-Backed Security, TBA |
11.4 |
Government National Mortgage Association |
4.9 |
Japan Government CPI-Linked Bonds |
2.1 |
French Republic Government Bonds OAT |
1.7 |
Federal Home Loan Mortgage Corp. |
0.9 |
Federal National Mortgage Association |
0.7 |
Bosphorus CLO VI DAC |
0.6 |
Man Euro CLO DAC |
0.6 | |
|
| Updated Prospectus Phone Number |
1-888-243-1956
|
|
| Updated Prospectus Web Address |
<span style="box-sizing: border-box; color: rgb(0, 0, 0); display: inline; flex-wrap: nowrap; font-size: 10.6667px; font-weight: 400; grid-area: auto; line-height: 16px; margin: 0px; overflow: visible; text-align: justify; text-align-last: left; white-space-collapse: preserve-breaks;">https://dfinview.com/BHFT</span>
|
|
| C000030631 |
|
|
| Shareholder Report [Line Items] |
|
|
| Fund Name |
PIMCO Inflation Protected Bond Portfolio
|
|
| Class Name |
Class B
|
|
| No Trading Symbol [Flag] |
true
|
|
| Annual or Semi-Annual Statement [Text Block] |
This semi-annual shareholder report contains important information about the PIMCO Inflation Protected Bond Portfolio (the "Portfolio") for the period of January 1, 2025 to June 30, 2025.
|
|
| Shareholder Report Annual or Semi-Annual |
Semi-Annual Shareholder Report
|
|
| Additional Information [Text Block] |
You can find additional information about the Portfolio at https://dfinview.com/BHFT. You can also request this information by contacting us at 1-888-243-1956.
|
|
| Additional Information Phone Number |
1-888-243-1956
|
|
| Additional Information Website |
<span style="box-sizing: border-box; color: rgb(0, 0, 0); display: inline; flex-wrap: nowrap; font-size: 12px; font-weight: 400; grid-area: auto; line-height: 18px; margin: 0px; overflow: visible; text-align: left; text-align-last: auto; white-space-collapse: preserve-breaks;">https://dfinview.com/BHFT</span>
|
|
| Expenses [Text Block] |
What were the Portfolio costs for last six months?This example shows the expenses you would have paid over the reporting period based on a hypothetical $10,000 investment.
Class Name |
Costs of a $10,000 investment |
Costs paid as a percentage of a $10,000 investment |
Class B |
$65 |
1.28%Footnote Reference* |
| Footnote |
Description |
Footnote* |
Annualized. | |
|
| Expenses Paid, Amount |
$ 65
|
|
| Expense Ratio, Percent |
1.28%
|
[66] |
| AssetsNet |
$ 1,466,761,932
|
|
| Holdings Count | Holding |
580
|
|
| Advisory Fees Paid, Amount |
$ 3,539,376
|
|
| InvestmentCompanyPortfolioTurnover |
97.00%
|
|
| Additional Fund Statistics [Text Block] |
- Total Net Assets$1,466,761,932
- # of Portfolio Investments580
- Portfolio Turnover Rate97%
- Total Advisory Fees Paid$3,539,376
|
|
| Holdings [Text Block] |
Value |
Value |
Convertible Preferred Stocks |
0.1 |
Corporate Bonds & Notes |
0.4 |
Non-Agency Mortgage-Backed Securities |
1.4 |
Foreign Government |
4.6 |
Asset-Backed Securities |
8.7 |
Agency Sponsored Mortgage-Backed Securities |
19.2 |
Short-Term Investments |
39.9 |
U.S. Treasury & Government Agencies |
87.4 | |
|
| Largest Holdings [Text Block] |
Top 10 Fixed Income Issuers
U.S. Treasury Inflation-Indexed Notes |
58.4 |
U.S. Treasury Inflation-Indexed Bonds |
29.0 |
Uniform Mortgage-Backed Security, TBA |
11.4 |
Government National Mortgage Association |
4.9 |
Japan Government CPI-Linked Bonds |
2.1 |
French Republic Government Bonds OAT |
1.7 |
Federal Home Loan Mortgage Corp. |
0.9 |
Federal National Mortgage Association |
0.7 |
Bosphorus CLO VI DAC |
0.6 |
Man Euro CLO DAC |
0.6 | |
|
| Updated Prospectus Phone Number |
1-888-243-1956
|
|
| Updated Prospectus Web Address |
<span style="box-sizing: border-box; color: rgb(0, 0, 0); display: inline; flex-wrap: nowrap; font-size: 10.6667px; font-weight: 400; grid-area: auto; line-height: 16px; margin: 0px; overflow: visible; text-align: justify; text-align-last: left; white-space-collapse: preserve-breaks;">https://dfinview.com/BHFT</span>
|
|
| C000030633 |
|
|
| Shareholder Report [Line Items] |
|
|
| Fund Name |
PIMCO Inflation Protected Bond Portfolio
|
|
| Class Name |
Class E
|
|
| No Trading Symbol [Flag] |
true
|
|
| Annual or Semi-Annual Statement [Text Block] |
This semi-annual shareholder report contains important information about the PIMCO Inflation Protected Bond Portfolio (the "Portfolio") for the period of January 1, 2025 to June 30, 2025.
|
|
| Shareholder Report Annual or Semi-Annual |
Semi-Annual Shareholder Report
|
|
| Additional Information [Text Block] |
You can find additional information about the Portfolio at https://dfinview.com/BHFT. You can also request this information by contacting us at 1-888-243-1956.
|
|
| Additional Information Phone Number |
1-888-243-1956
|
|
| Additional Information Website |
<span style="box-sizing: border-box; color: rgb(0, 0, 0); display: inline; flex-wrap: nowrap; font-size: 12px; font-weight: 400; grid-area: auto; line-height: 18px; margin: 0px; overflow: visible; text-align: left; text-align-last: auto; white-space-collapse: preserve-breaks;">https://dfinview.com/BHFT</span>
|
|
| Expenses [Text Block] |
What were the Portfolio costs for last six months?This example shows the expenses you would have paid over the reporting period based on a hypothetical $10,000 investment.
Class Name |
Costs of a $10,000 investment |
Costs paid as a percentage of a $10,000 investment |
Class E |
$60 |
1.18%Footnote Reference* |
| Footnote |
Description |
Footnote* |
Annualized. | |
|
| Expenses Paid, Amount |
$ 60
|
|
| Expense Ratio, Percent |
1.18%
|
[67] |
| AssetsNet |
$ 1,466,761,932
|
|
| Holdings Count | Holding |
580
|
|
| Advisory Fees Paid, Amount |
$ 3,539,376
|
|
| InvestmentCompanyPortfolioTurnover |
97.00%
|
|
| Additional Fund Statistics [Text Block] |
- Total Net Assets$1,466,761,932
- # of Portfolio Investments580
- Portfolio Turnover Rate97%
- Total Advisory Fees Paid$3,539,376
|
|
| Holdings [Text Block] |
Value |
Value |
Convertible Preferred Stocks |
0.1 |
Corporate Bonds & Notes |
0.4 |
Non-Agency Mortgage-Backed Securities |
1.4 |
Foreign Government |
4.6 |
Asset-Backed Securities |
8.7 |
Agency Sponsored Mortgage-Backed Securities |
19.2 |
Short-Term Investments |
39.9 |
U.S. Treasury & Government Agencies |
87.4 | |
|
| Largest Holdings [Text Block] |
Top 10 Fixed Income Issuers
U.S. Treasury Inflation-Indexed Notes |
58.4 |
U.S. Treasury Inflation-Indexed Bonds |
29.0 |
Uniform Mortgage-Backed Security, TBA |
11.4 |
Government National Mortgage Association |
4.9 |
Japan Government CPI-Linked Bonds |
2.1 |
French Republic Government Bonds OAT |
1.7 |
Federal Home Loan Mortgage Corp. |
0.9 |
Federal National Mortgage Association |
0.7 |
Bosphorus CLO VI DAC |
0.6 |
Man Euro CLO DAC |
0.6 | |
|
| Updated Prospectus Phone Number |
1-888-243-1956
|
|
| Updated Prospectus Web Address |
<span style="box-sizing: border-box; color: rgb(0, 0, 0); display: inline; flex-wrap: nowrap; font-size: 10.6667px; font-weight: 400; grid-area: auto; line-height: 16px; margin: 0px; overflow: visible; text-align: justify; text-align-last: left; white-space-collapse: preserve-breaks;">https://dfinview.com/BHFT</span>
|
|
| C000030635 |
|
|
| Shareholder Report [Line Items] |
|
|
| Fund Name |
PIMCO Total Return Portfolio
|
|
| Class Name |
Class A
|
|
| No Trading Symbol [Flag] |
true
|
|
| Annual or Semi-Annual Statement [Text Block] |
This semi-annual shareholder report contains important information about the PIMCO Total Return Portfolio (the "Portfolio") for the period of January 1, 2025 to June 30, 2025.
|
|
| Shareholder Report Annual or Semi-Annual |
Semi-Annual Shareholder Report
|
|
| Additional Information [Text Block] |
You can find additional information about the Portfolio at https://dfinview.com/BHFT. You can also request this information by contacting us at 1-888-243-1956.
|
|
| Additional Information Phone Number |
1-888-243-1956
|
|
| Additional Information Website |
<span style="box-sizing: border-box; color: rgb(0, 0, 0); display: inline; flex-wrap: nowrap; font-size: 12px; font-weight: 400; grid-area: auto; line-height: 18px; margin: 0px; overflow: visible; text-align: left; text-align-last: auto; white-space-collapse: preserve-breaks;">https://dfinview.com/BHFT</span>
|
|
| Expenses [Text Block] |
What were the Portfolio costs for last six months?This example shows the expenses you would have paid over the reporting period based on a hypothetical $10,000 investment.
Class Name |
Costs of a $10,000 investment |
Costs paid as a percentage of a $10,000 investment |
Class A |
$29 |
0.57%Footnote Reference* |
| Footnote |
Description |
Footnote* |
Annualized. | |
|
| Expenses Paid, Amount |
$ 29
|
|
| Expense Ratio, Percent |
0.57%
|
[68] |
| AssetsNet |
$ 3,560,701,402
|
|
| Holdings Count | Holding |
1,558
|
|
| Advisory Fees Paid, Amount |
$ 8,066,814
|
|
| InvestmentCompanyPortfolioTurnover |
279.00%
|
|
| Additional Fund Statistics [Text Block] |
- Total Net Assets$3,560,701,402
- # of Portfolio Investments1,558
- Portfolio Turnover Rate279%
- Total Advisory Fees Paid$8,066,814
|
|
| Holdings [Text Block] |
Value |
Value |
Floating Rate Loans |
0.2 |
Municipals |
1.1 |
Short-Term Investments |
2.9 |
Foreign Government |
7.3 |
Asset-Backed Securities |
8.5 |
Non-Agency Mortgage-Backed Securities |
11.8 |
U.S. Treasury & Government Agencies |
17.9 |
Corporate Bonds & Notes |
44.5 |
Agency Sponsored Mortgage-Backed Securities |
49.8 | |
|
| Largest Holdings [Text Block] |
Top 10 Fixed Income Issuers
Uniform Mortgage-Backed Security, TBA |
36.3 |
U.S. Treasury Bonds |
13.7 |
Government National Mortgage Association, TBA |
4.7 |
Federal National Mortgage Association |
3.0 |
Federal Home Loan Mortgage Corp. |
2.5 |
U.S. Treasury Inflation-Indexed Bonds |
2.2 |
Government National Mortgage Association REMICS |
2.1 |
U.S. Treasury Inflation-Indexed Notes |
1.7 |
UBS Group AG |
1.4 |
Benchmark Mortgage Trust |
1.3 | |
|
| Updated Prospectus Phone Number |
1-888-243-1956
|
|
| Updated Prospectus Web Address |
<span style="box-sizing: border-box; color: rgb(0, 0, 0); display: inline; flex-wrap: nowrap; font-size: 10.6667px; font-weight: 400; grid-area: auto; line-height: 16px; margin: 0px; overflow: visible; text-align: justify; text-align-last: left; white-space-collapse: preserve-breaks;">https://dfinview.com/BHFT</span>
|
|
| C000030636 |
|
|
| Shareholder Report [Line Items] |
|
|
| Fund Name |
PIMCO Total Return Portfolio
|
|
| Class Name |
Class B
|
|
| No Trading Symbol [Flag] |
true
|
|
| Annual or Semi-Annual Statement [Text Block] |
This semi-annual shareholder report contains important information about the PIMCO Total Return Portfolio (the "Portfolio") for the period of January 1, 2025 to June 30, 2025.
|
|
| Shareholder Report Annual or Semi-Annual |
Semi-Annual Shareholder Report
|
|
| Additional Information [Text Block] |
You can find additional information about the Portfolio at https://dfinview.com/BHFT. You can also request this information by contacting us at 1-888-243-1956.
|
|
| Additional Information Phone Number |
1-888-243-1956
|
|
| Additional Information Website |
<span style="box-sizing: border-box; color: rgb(0, 0, 0); display: inline; flex-wrap: nowrap; font-size: 12px; font-weight: 400; grid-area: auto; line-height: 18px; margin: 0px; overflow: visible; text-align: left; text-align-last: auto; white-space-collapse: preserve-breaks;">https://dfinview.com/BHFT</span>
|
|
| Expenses [Text Block] |
What were the Portfolio costs for last six months?This example shows the expenses you would have paid over the reporting period based on a hypothetical $10,000 investment.
Class Name |
Costs of a $10,000 investment |
Costs paid as a percentage of a $10,000 investment |
Class B |
$42 |
0.82%Footnote Reference* |
| Footnote |
Description |
Footnote* |
Annualized. | |
|
| Expenses Paid, Amount |
$ 42
|
|
| Expense Ratio, Percent |
0.82%
|
[69] |
| AssetsNet |
$ 3,560,701,402
|
|
| Holdings Count | Holding |
1,558
|
|
| Advisory Fees Paid, Amount |
$ 8,066,814
|
|
| InvestmentCompanyPortfolioTurnover |
279.00%
|
|
| Additional Fund Statistics [Text Block] |
- Total Net Assets$3,560,701,402
- # of Portfolio Investments1,558
- Portfolio Turnover Rate279%
- Total Advisory Fees Paid$8,066,814
|
|
| Holdings [Text Block] |
Value |
Value |
Floating Rate Loans |
0.2 |
Municipals |
1.1 |
Short-Term Investments |
2.9 |
Foreign Government |
7.3 |
Asset-Backed Securities |
8.5 |
Non-Agency Mortgage-Backed Securities |
11.8 |
U.S. Treasury & Government Agencies |
17.9 |
Corporate Bonds & Notes |
44.5 |
Agency Sponsored Mortgage-Backed Securities |
49.8 | |
|
| Largest Holdings [Text Block] |
Top 10 Fixed Income Issuers
Uniform Mortgage-Backed Security, TBA |
36.3 |
U.S. Treasury Bonds |
13.7 |
Government National Mortgage Association, TBA |
4.7 |
Federal National Mortgage Association |
3.0 |
Federal Home Loan Mortgage Corp. |
2.5 |
U.S. Treasury Inflation-Indexed Bonds |
2.2 |
Government National Mortgage Association REMICS |
2.1 |
U.S. Treasury Inflation-Indexed Notes |
1.7 |
UBS Group AG |
1.4 |
Benchmark Mortgage Trust |
1.3 | |
|
| Updated Prospectus Phone Number |
1-888-243-1956
|
|
| Updated Prospectus Web Address |
<span style="box-sizing: border-box; color: rgb(0, 0, 0); display: inline; flex-wrap: nowrap; font-size: 10.6667px; font-weight: 400; grid-area: auto; line-height: 16px; margin: 0px; overflow: visible; text-align: justify; text-align-last: left; white-space-collapse: preserve-breaks;">https://dfinview.com/BHFT</span>
|
|
| C000030638 |
|
|
| Shareholder Report [Line Items] |
|
|
| Fund Name |
PIMCO Total Return Portfolio
|
|
| Class Name |
Class E
|
|
| No Trading Symbol [Flag] |
true
|
|
| Annual or Semi-Annual Statement [Text Block] |
This semi-annual shareholder report contains important information about the PIMCO Total Return Portfolio (the "Portfolio") for the period of January 1, 2025 to June 30, 2025.
|
|
| Shareholder Report Annual or Semi-Annual |
Semi-Annual Shareholder Report
|
|
| Additional Information [Text Block] |
You can find additional information about the Portfolio at https://dfinview.com/BHFT. You can also request this information by contacting us at 1-888-243-1956.
|
|
| Additional Information Phone Number |
1-888-243-1956
|
|
| Additional Information Website |
<span style="box-sizing: border-box; color: rgb(0, 0, 0); display: inline; flex-wrap: nowrap; font-size: 12px; font-weight: 400; grid-area: auto; line-height: 18px; margin: 0px; overflow: visible; text-align: left; text-align-last: auto; white-space-collapse: preserve-breaks;">https://dfinview.com/BHFT</span>
|
|
| Expenses [Text Block] |
What were the Portfolio costs for last six months?This example shows the expenses you would have paid over the reporting period based on a hypothetical $10,000 investment.
Class Name |
Costs of a $10,000 investment |
Costs paid as a percentage of a $10,000 investment |
Class E |
$37 |
0.72%Footnote Reference* |
| Footnote |
Description |
Footnote* |
Annualized. | |
|
| Expenses Paid, Amount |
$ 37
|
|
| Expense Ratio, Percent |
0.72%
|
[70] |
| AssetsNet |
$ 3,560,701,402
|
|
| Holdings Count | Holding |
1,558
|
|
| Advisory Fees Paid, Amount |
$ 8,066,814
|
|
| InvestmentCompanyPortfolioTurnover |
279.00%
|
|
| Additional Fund Statistics [Text Block] |
- Total Net Assets$3,560,701,402
- # of Portfolio Investments1,558
- Portfolio Turnover Rate279%
- Total Advisory Fees Paid$8,066,814
|
|
| Holdings [Text Block] |
Value |
Value |
Floating Rate Loans |
0.2 |
Municipals |
1.1 |
Short-Term Investments |
2.9 |
Foreign Government |
7.3 |
Asset-Backed Securities |
8.5 |
Non-Agency Mortgage-Backed Securities |
11.8 |
U.S. Treasury & Government Agencies |
17.9 |
Corporate Bonds & Notes |
44.5 |
Agency Sponsored Mortgage-Backed Securities |
49.8 | |
|
| Largest Holdings [Text Block] |
Top 10 Fixed Income Issuers
Uniform Mortgage-Backed Security, TBA |
36.3 |
U.S. Treasury Bonds |
13.7 |
Government National Mortgage Association, TBA |
4.7 |
Federal National Mortgage Association |
3.0 |
Federal Home Loan Mortgage Corp. |
2.5 |
U.S. Treasury Inflation-Indexed Bonds |
2.2 |
Government National Mortgage Association REMICS |
2.1 |
U.S. Treasury Inflation-Indexed Notes |
1.7 |
UBS Group AG |
1.4 |
Benchmark Mortgage Trust |
1.3 | |
|
| Updated Prospectus Phone Number |
1-888-243-1956
|
|
| Updated Prospectus Web Address |
<span style="box-sizing: border-box; color: rgb(0, 0, 0); display: inline; flex-wrap: nowrap; font-size: 10.6667px; font-weight: 400; grid-area: auto; line-height: 16px; margin: 0px; overflow: visible; text-align: justify; text-align-last: left; white-space-collapse: preserve-breaks;">https://dfinview.com/BHFT</span>
|
|
| C000112671 |
|
|
| Shareholder Report [Line Items] |
|
|
| Fund Name |
Schroders Global Multi-Asset Portfolio
|
|
| Class Name |
Class B
|
|
| No Trading Symbol [Flag] |
true
|
|
| Annual or Semi-Annual Statement [Text Block] |
This semi-annual shareholder report contains important information about the Schroders Global Multi-Asset Portfolio (the "Portfolio") for the period of January 1, 2025 to June 30, 2025.
|
|
| Shareholder Report Annual or Semi-Annual |
Semi-Annual Shareholder Report
|
|
| Additional Information [Text Block] |
You can find additional information about the Portfolio at https://dfinview.com/BHFT. You can also request this information by contacting us at 1-888-243-1956.
|
|
| Additional Information Phone Number |
1-888-243-1956
|
|
| Additional Information Website |
<span style="box-sizing: border-box; color: rgb(0, 0, 0); display: inline; flex-wrap: nowrap; font-size: 12px; font-weight: 400; grid-area: auto; line-height: 18px; margin: 0px; overflow: visible; text-align: left; text-align-last: auto; white-space-collapse: preserve-breaks;">https://dfinview.com/BHFT</span>
|
|
| Expenses [Text Block] |
What were the Portfolio costs for last six months?This example shows the expenses you would have paid over the reporting period based on a hypothetical $10,000 investment.
Class Name |
Costs of a $10,000 investment |
Costs paid as a percentage of a $10,000 investment |
Class B |
$49 |
0.98%Footnote Reference* |
| Footnote |
Description |
Footnote* |
Annualized. | |
|
| Expenses Paid, Amount |
$ 49
|
|
| Expense Ratio, Percent |
0.98%
|
[71] |
| AssetsNet |
$ 600,981,384
|
|
| Holdings Count | Holding |
944
|
|
| Advisory Fees Paid, Amount |
$ 1,904,736
|
|
| InvestmentCompanyPortfolioTurnover |
22.00%
|
|
| Additional Fund Statistics [Text Block] |
- Total Net Assets$600,981,384
- # of Portfolio Investments944
- Portfolio Turnover Rate22%
- Total Advisory Fees Paid$1,904,736
|
|
| Holdings [Text Block] |
Top 10 Fixed Income Issuers
Wells Fargo & Co. |
1.5 |
JPMorgan Chase & Co. |
1.4 |
Bank of America Corp. |
1.4 |
Morgan Stanley |
1.0 |
Citibank NA |
0.7 |
UBS Group AG |
0.7 |
Pfizer Investment Enterprises Pte. Ltd. |
0.6 |
General Motors Financial Co., Inc. |
0.6 |
AT&T, Inc. |
0.6 |
UnitedHealth Group, Inc. |
0.6 |
Value |
Value |
Netherlands |
0.8 |
Italy |
1.0 |
Ireland |
1.1 |
France |
1.3 |
Switzerland |
1.3 |
Germany |
1.7 |
United Kingdom |
2.0 |
Canada |
2.0 |
Japan |
2.4 |
United States |
75.6 |
Value |
Value |
Warrants |
0.0 |
Preferred Stocks |
0.0Footnote Reference* |
Short-Term Investments |
3.7 |
Corporate Bonds & Notes |
35.0 |
Common Stocks |
57.2 |
| Footnote |
Description |
Footnote* |
Amount rounds to less than 0.1% | |
|
| Largest Holdings [Text Block] |
NVIDIA Corp. |
3.2 |
Microsoft Corp. |
2.9 |
Apple, Inc. |
2.2 |
Alphabet, Inc. |
1.8 |
Amazon.com, Inc. |
1.7 |
Meta Platforms, Inc. |
1.4 |
Broadcom, Inc. |
1.0 |
JPMorgan Chase & Co. |
0.8 |
Netflix, Inc. |
0.7 |
Visa, Inc. |
0.6 | |
|
| Updated Prospectus Phone Number |
1-888-243-1956
|
|
| Updated Prospectus Web Address |
<span style="box-sizing: border-box; color: rgb(0, 0, 0); display: inline; flex-wrap: nowrap; font-size: 10.6667px; font-weight: 400; grid-area: auto; line-height: 16px; margin: 0px; overflow: visible; text-align: justify; text-align-last: left; white-space-collapse: preserve-breaks;">https://dfinview.com/BHFT</span>
|
|
| C000210971 |
|
|
| Shareholder Report [Line Items] |
|
|
| Fund Name |
SSGA Emerging Markets Enhanced Index Portfolio
|
|
| Class Name |
Class A
|
|
| No Trading Symbol [Flag] |
true
|
|
| Annual or Semi-Annual Statement [Text Block] |
This semi-annual shareholder report contains important information about the SSGA Emerging Markets Enhanced Index Portfolio (the "Portfolio") for the period of January 1, 2025 to June 30, 2025.
|
|
| Shareholder Report Annual or Semi-Annual |
Semi-Annual Shareholder Report
|
|
| Additional Information [Text Block] |
You can find additional information about the Portfolio at https://dfinview.com/BHFT. You can also request this information by contacting us at 1-888-243-1956.
|
|
| Additional Information Phone Number |
1-888-243-1956
|
|
| Additional Information Website |
<span style="box-sizing: border-box; color: rgb(0, 0, 0); display: inline; flex-wrap: nowrap; font-size: 12px; font-weight: 400; grid-area: auto; line-height: 18px; margin: 0px; overflow: visible; text-align: left; text-align-last: auto; white-space-collapse: preserve-breaks;">https://dfinview.com/BHFT</span>
|
|
| Expenses [Text Block] |
What were the Portfolio costs for last six months?This example shows the expenses you would have paid over the reporting period based on a hypothetical $10,000 investment.
Class Name |
Costs of a $10,000 investment |
Costs paid as a percentage of a $10,000 investment |
Class A |
$29 |
0.54%Footnote Reference* |
| Footnote |
Description |
Footnote* |
Annualized. | |
|
| Expenses Paid, Amount |
$ 29
|
|
| Expense Ratio, Percent |
0.54%
|
[72] |
| AssetsNet |
$ 1,148,370,464
|
|
| Holdings Count | Holding |
598
|
|
| Advisory Fees Paid, Amount |
$ 1,418,620
|
|
| InvestmentCompanyPortfolioTurnover |
30.00%
|
|
| Additional Fund Statistics [Text Block] |
- Total Net Assets$1,148,370,464
- # of Portfolio Investments598
- Portfolio Turnover Rate30%
- Total Advisory Fees Paid$1,418,620
|
|
| Holdings [Text Block] |
Value |
Value |
Utilities |
2.6 |
Health Care |
3.4 |
Energy |
4.0 |
Consumer Staples |
4.2 |
Materials |
5.4 |
Industrials |
6.7 |
Communication Services |
9.9 |
Consumer Discretionary |
12.5 |
Information Technology |
23.8 |
Financials |
24.4 |
Value |
Value |
Thailand |
1.1 |
United Arab Emirates |
1.7 |
Mexico |
2.0 |
South Africa |
2.8 |
Saudi Arabia |
3.4 |
Brazil |
4.3 |
South Korea |
11.0 |
India |
17.8 |
Taiwan |
18.7 |
China |
27.8 | |
|
| Largest Holdings [Text Block] |
Taiwan Semiconductor Manufacturing Co. Ltd. |
10.2 |
Tencent Holdings Ltd. |
4.8 |
Samsung Electronics Co. Ltd. |
2.8 |
Alibaba Group Holding Ltd. |
2.7 |
Xiaomi Corp. |
1.6 |
SK Hynix, Inc. |
1.6 |
HDFC Bank Ltd. |
1.3 |
Reliance Industries Ltd. |
1.0 |
Hon Hai Precision Industry Co. Ltd. |
1.0 |
ICICI Bank Ltd. |
0.9 | |
|
| Material Fund Change [Text Block] |
|
|
| Updated Prospectus Phone Number |
1-888-243-1956
|
|
| Updated Prospectus Web Address |
<span style="box-sizing: border-box; color: rgb(0, 0, 0); display: inline; flex-wrap: nowrap; font-size: 10.6667px; font-weight: 400; grid-area: auto; line-height: 16px; margin: 0px; overflow: visible; text-align: justify; text-align-last: left; white-space-collapse: preserve-breaks;">https://dfinview.com/BHFT</span>
|
|
| C000210968 |
|
|
| Shareholder Report [Line Items] |
|
|
| Fund Name |
SSGA Emerging Markets Enhanced Index Portfolio
|
|
| Class Name |
Class B
|
|
| No Trading Symbol [Flag] |
true
|
|
| Annual or Semi-Annual Statement [Text Block] |
This semi-annual shareholder report contains important information about the SSGA Emerging Markets Enhanced Index Portfolio (the "Portfolio") for the period of January 1, 2025 to June 30, 2025.
|
|
| Shareholder Report Annual or Semi-Annual |
Semi-Annual Shareholder Report
|
|
| Additional Information [Text Block] |
You can find additional information about the Portfolio at https://dfinview.com/BHFT. You can also request this information by contacting us at 1-888-243-1956.
|
|
| Additional Information Phone Number |
1-888-243-1956
|
|
| Additional Information Website |
<span style="box-sizing: border-box; color: rgb(0, 0, 0); display: inline; flex-wrap: nowrap; font-size: 12px; font-weight: 400; grid-area: auto; line-height: 18px; margin: 0px; overflow: visible; text-align: left; text-align-last: auto; white-space-collapse: preserve-breaks;">https://dfinview.com/BHFT</span>
|
|
| Expenses [Text Block] |
What were the Portfolio costs for last six months?This example shows the expenses you would have paid over the reporting period based on a hypothetical $10,000 investment.
Class Name |
Costs of a $10,000 investment |
Costs paid as a percentage of a $10,000 investment |
Class B |
$42 |
0.79%Footnote Reference* |
| Footnote |
Description |
Footnote* |
Annualized. | |
|
| Expenses Paid, Amount |
$ 42
|
|
| Expense Ratio, Percent |
0.79%
|
[73] |
| AssetsNet |
$ 1,148,370,464
|
|
| Holdings Count | Holding |
598
|
|
| Advisory Fees Paid, Amount |
$ 1,418,620
|
|
| InvestmentCompanyPortfolioTurnover |
30.00%
|
|
| Additional Fund Statistics [Text Block] |
- Total Net Assets$1,148,370,464
- # of Portfolio Investments598
- Portfolio Turnover Rate30%
- Total Advisory Fees Paid$1,418,620
|
|
| Holdings [Text Block] |
Value |
Value |
Utilities |
2.6 |
Health Care |
3.4 |
Energy |
4.0 |
Consumer Staples |
4.2 |
Materials |
5.4 |
Industrials |
6.7 |
Communication Services |
9.9 |
Consumer Discretionary |
12.5 |
Information Technology |
23.8 |
Financials |
24.4 |
Value |
Value |
Thailand |
1.1 |
United Arab Emirates |
1.7 |
Mexico |
2.0 |
South Africa |
2.8 |
Saudi Arabia |
3.4 |
Brazil |
4.3 |
South Korea |
11.0 |
India |
17.8 |
Taiwan |
18.7 |
China |
27.8 | |
|
| Largest Holdings [Text Block] |
Taiwan Semiconductor Manufacturing Co. Ltd. |
10.2 |
Tencent Holdings Ltd. |
4.8 |
Samsung Electronics Co. Ltd. |
2.8 |
Alibaba Group Holding Ltd. |
2.7 |
Xiaomi Corp. |
1.6 |
SK Hynix, Inc. |
1.6 |
HDFC Bank Ltd. |
1.3 |
Reliance Industries Ltd. |
1.0 |
Hon Hai Precision Industry Co. Ltd. |
1.0 |
ICICI Bank Ltd. |
0.9 | |
|
| Material Fund Change [Text Block] |
|
|
| Updated Prospectus Phone Number |
1-888-243-1956
|
|
| Updated Prospectus Web Address |
<span style="box-sizing: border-box; color: rgb(0, 0, 0); display: inline; flex-wrap: nowrap; font-size: 10.6667px; font-weight: 400; grid-area: auto; line-height: 16px; margin: 0px; overflow: visible; text-align: justify; text-align-last: left; white-space-collapse: preserve-breaks;">https://dfinview.com/BHFT</span>
|
|
| C000030695 |
|
|
| Shareholder Report [Line Items] |
|
|
| Fund Name |
SSGA Growth and Income ETF Portfolio
|
|
| Class Name |
Class A
|
|
| No Trading Symbol [Flag] |
true
|
|
| Annual or Semi-Annual Statement [Text Block] |
This semi-annual shareholder report contains important information about the SSGA Growth and Income ETF Portfolio (the "Portfolio") for the period of January 1, 2025 to June 30, 2025.
|
|
| Shareholder Report Annual or Semi-Annual |
Semi-Annual Shareholder Report
|
|
| Additional Information [Text Block] |
You can find additional information about the Portfolio at https://dfinview.com/BHFT. You can also request this information by contacting us at 1-888-243-1956.
|
|
| Additional Information Phone Number |
1-888-243-1956
|
|
| Additional Information Website |
<span style="box-sizing: border-box; color: rgb(0, 0, 0); display: inline; flex-wrap: nowrap; font-size: 12px; font-weight: 400; grid-area: auto; line-height: 18px; margin: 0px; overflow: visible; text-align: left; text-align-last: auto; white-space-collapse: preserve-breaks;">https://dfinview.com/BHFT</span>
|
|
| Expenses [Text Block] |
What were the Portfolio costs for last six months?This example shows the expenses you would have paid over the reporting period based on a hypothetical $10,000 investment.
Class Name |
Costs of a $10,000 investment |
Costs paid as a percentage of a $10,000 investment |
Class A |
$17 |
0.33%Footnote Reference* |
| Footnote |
Description |
Footnote* |
Annualized. | |
|
| Expenses Paid, Amount |
$ 17
|
|
| Expense Ratio, Percent |
0.33%
|
[74] |
| AssetsNet |
$ 1,655,436,071
|
|
| Holdings Count | Holding |
54
|
|
| Advisory Fees Paid, Amount |
$ 2,509,113
|
|
| InvestmentCompanyPortfolioTurnover |
65.00%
|
|
| Additional Fund Statistics [Text Block] |
- Total Net Assets$1,655,436,071
- # of Portfolio Investments54
- Portfolio Turnover Rate65%
- Total Advisory Fees Paid$2,509,113
|
|
| Holdings [Text Block] |
Value |
Value |
Real Eastate Equities |
2.9 |
U.S. Mid Cap Equities |
3.0 |
U.S. Small Cap Equities |
3.5 |
Commodities |
6.8 |
International Developed Market Equities |
7.5 |
Emerging Market Equities |
7.6 |
High Yield Fixed Income |
9.1 |
Investment Grade Fixed Income |
28.2 |
U.S. Large Cap Equities |
30.5 | |
|
| Largest Holdings [Text Block] |
Vanguard Total Bond Market ETF |
19.6 |
SPDR S&P 500 ETF Trust |
13.3 |
iShares Core S&P 500 ETF |
11.2 |
iShares Core MSCI Emerging Markets ETF |
7.6 |
SPDR Portfolio Developed World ex-U.S. ETF |
5.5 |
SPDR Gold Shares |
4.3 |
SPDR Bloomberg High Yield Bond ETF |
4.0 |
iShares 0-5 Year TIPS Bond ETF |
4.0 |
Vanguard Long-Term Corporate Bond ETF |
3.6 |
iShares Core S&P Small-Cap ETF |
3.5 | |
|
| Updated Prospectus Phone Number |
1-888-243-1956
|
|
| Updated Prospectus Web Address |
<span style="box-sizing: border-box; color: rgb(0, 0, 0); display: inline; flex-wrap: nowrap; font-size: 10.6667px; font-weight: 400; grid-area: auto; line-height: 16px; margin: 0px; overflow: visible; text-align: justify; text-align-last: left; white-space-collapse: preserve-breaks;">https://dfinview.com/BHFT</span>
|
|
| C000030696 |
|
|
| Shareholder Report [Line Items] |
|
|
| Fund Name |
SSGA Growth and Income ETF Portfolio
|
|
| Class Name |
Class B
|
|
| No Trading Symbol [Flag] |
true
|
|
| Annual or Semi-Annual Statement [Text Block] |
This semi-annual shareholder report contains important information about the SSGA Growth and Income ETF Portfolio (the "Portfolio") for the period of January 1, 2025 to June 30, 2025.
|
|
| Shareholder Report Annual or Semi-Annual |
Semi-Annual Shareholder Report
|
|
| Additional Information [Text Block] |
You can find additional information about the Portfolio at https://dfinview.com/BHFT. You can also request this information by contacting us at 1-888-243-1956.
|
|
| Additional Information Phone Number |
1-888-243-1956
|
|
| Additional Information Website |
<span style="box-sizing: border-box; color: rgb(0, 0, 0); display: inline; flex-wrap: nowrap; font-size: 12px; font-weight: 400; grid-area: auto; line-height: 18px; margin: 0px; overflow: visible; text-align: left; text-align-last: auto; white-space-collapse: preserve-breaks;">https://dfinview.com/BHFT</span>
|
|
| Expenses [Text Block] |
What were the Portfolio costs for last six months?This example shows the expenses you would have paid over the reporting period based on a hypothetical $10,000 investment.
Class Name |
Costs of a $10,000 investment |
Costs paid as a percentage of a $10,000 investment |
Class B |
$30 |
0.58%Footnote Reference* |
| Footnote |
Description |
Footnote* |
Annualized. | |
|
| Expenses Paid, Amount |
$ 30
|
|
| Expense Ratio, Percent |
0.58%
|
[75] |
| AssetsNet |
$ 1,655,436,071
|
|
| Holdings Count | Holding |
54
|
|
| Advisory Fees Paid, Amount |
$ 2,509,113
|
|
| InvestmentCompanyPortfolioTurnover |
65.00%
|
|
| Additional Fund Statistics [Text Block] |
- Total Net Assets$1,655,436,071
- # of Portfolio Investments54
- Portfolio Turnover Rate65%
- Total Advisory Fees Paid$2,509,113
|
|
| Holdings [Text Block] |
Value |
Value |
Real Eastate Equities |
2.9 |
U.S. Mid Cap Equities |
3.0 |
U.S. Small Cap Equities |
3.5 |
Commodities |
6.8 |
International Developed Market Equities |
7.5 |
Emerging Market Equities |
7.6 |
High Yield Fixed Income |
9.1 |
Investment Grade Fixed Income |
28.2 |
U.S. Large Cap Equities |
30.5 | |
|
| Largest Holdings [Text Block] |
Vanguard Total Bond Market ETF |
19.6 |
SPDR S&P 500 ETF Trust |
13.3 |
iShares Core S&P 500 ETF |
11.2 |
iShares Core MSCI Emerging Markets ETF |
7.6 |
SPDR Portfolio Developed World ex-U.S. ETF |
5.5 |
SPDR Gold Shares |
4.3 |
SPDR Bloomberg High Yield Bond ETF |
4.0 |
iShares 0-5 Year TIPS Bond ETF |
4.0 |
Vanguard Long-Term Corporate Bond ETF |
3.6 |
iShares Core S&P Small-Cap ETF |
3.5 | |
|
| Updated Prospectus Phone Number |
1-888-243-1956
|
|
| Updated Prospectus Web Address |
<span style="box-sizing: border-box; color: rgb(0, 0, 0); display: inline; flex-wrap: nowrap; font-size: 10.6667px; font-weight: 400; grid-area: auto; line-height: 16px; margin: 0px; overflow: visible; text-align: justify; text-align-last: left; white-space-collapse: preserve-breaks;">https://dfinview.com/BHFT</span>
|
|
| C000030698 |
|
|
| Shareholder Report [Line Items] |
|
|
| Fund Name |
SSGA Growth and Income ETF Portfolio
|
|
| Class Name |
Class E
|
|
| No Trading Symbol [Flag] |
true
|
|
| Annual or Semi-Annual Statement [Text Block] |
This semi-annual shareholder report contains important information about the SSGA Growth and Income ETF Portfolio (the "Portfolio") for the period of January 1, 2025 to June 30, 2025.
|
|
| Shareholder Report Annual or Semi-Annual |
Semi-Annual Shareholder Report
|
|
| Additional Information [Text Block] |
You can find additional information about the Portfolio at https://dfinview.com/BHFT. You can also request this information by contacting us at 1-888-243-1956.
|
|
| Additional Information Phone Number |
1-888-243-1956
|
|
| Additional Information Website |
<span style="box-sizing: border-box; color: rgb(0, 0, 0); display: inline; flex-wrap: nowrap; font-size: 12px; font-weight: 400; grid-area: auto; line-height: 18px; margin: 0px; overflow: visible; text-align: left; text-align-last: auto; white-space-collapse: preserve-breaks;">https://dfinview.com/BHFT</span>
|
|
| Expenses [Text Block] |
What were the Portfolio costs for last six months?This example shows the expenses you would have paid over the reporting period based on a hypothetical $10,000 investment.
Class Name |
Costs of a $10,000 investment |
Costs paid as a percentage of a $10,000 investment |
Class E |
$25 |
0.48%Footnote Reference* |
| Footnote |
Description |
Footnote* |
Annualized. | |
|
| Expenses Paid, Amount |
$ 25
|
|
| Expense Ratio, Percent |
0.48%
|
[76] |
| AssetsNet |
$ 1,655,436,071
|
|
| Holdings Count | Holding |
54
|
|
| Advisory Fees Paid, Amount |
$ 2,509,113
|
|
| InvestmentCompanyPortfolioTurnover |
65.00%
|
|
| Additional Fund Statistics [Text Block] |
- Total Net Assets$1,655,436,071
- # of Portfolio Investments54
- Portfolio Turnover Rate65%
- Total Advisory Fees Paid$2,509,113
|
|
| Holdings [Text Block] |
Value |
Value |
Real Eastate Equities |
2.9 |
U.S. Mid Cap Equities |
3.0 |
U.S. Small Cap Equities |
3.5 |
Commodities |
6.8 |
International Developed Market Equities |
7.5 |
Emerging Market Equities |
7.6 |
High Yield Fixed Income |
9.1 |
Investment Grade Fixed Income |
28.2 |
U.S. Large Cap Equities |
30.5 | |
|
| Largest Holdings [Text Block] |
Vanguard Total Bond Market ETF |
19.6 |
SPDR S&P 500 ETF Trust |
13.3 |
iShares Core S&P 500 ETF |
11.2 |
iShares Core MSCI Emerging Markets ETF |
7.6 |
SPDR Portfolio Developed World ex-U.S. ETF |
5.5 |
SPDR Gold Shares |
4.3 |
SPDR Bloomberg High Yield Bond ETF |
4.0 |
iShares 0-5 Year TIPS Bond ETF |
4.0 |
Vanguard Long-Term Corporate Bond ETF |
3.6 |
iShares Core S&P Small-Cap ETF |
3.5 | |
|
| Updated Prospectus Phone Number |
1-888-243-1956
|
|
| Updated Prospectus Web Address |
<span style="box-sizing: border-box; color: rgb(0, 0, 0); display: inline; flex-wrap: nowrap; font-size: 10.6667px; font-weight: 400; grid-area: auto; line-height: 16px; margin: 0px; overflow: visible; text-align: justify; text-align-last: left; white-space-collapse: preserve-breaks;">https://dfinview.com/BHFT</span>
|
|
| C000030700 |
|
|
| Shareholder Report [Line Items] |
|
|
| Fund Name |
SSGA Growth ETF Portfolio
|
|
| Class Name |
Class A
|
|
| No Trading Symbol [Flag] |
true
|
|
| Annual or Semi-Annual Statement [Text Block] |
This semi-annual shareholder report contains important information about the SSGA Growth ETF Portfolio (the "Portfolio") for the period of January 1, 2025 to June 30, 2025.
|
|
| Shareholder Report Annual or Semi-Annual |
Semi-Annual Shareholder Report
|
|
| Additional Information [Text Block] |
You can find additional information about the Portfolio at https://dfinview.com/BHFT. You can also request this information by contacting us at 1-888-243-1956.
|
|
| Additional Information Phone Number |
1-888-243-1956
|
|
| Additional Information Website |
<span style="box-sizing: border-box; color: rgb(0, 0, 0); display: inline; flex-wrap: nowrap; font-size: 12px; font-weight: 400; grid-area: auto; line-height: 18px; margin: 0px; overflow: visible; text-align: left; text-align-last: auto; white-space-collapse: preserve-breaks;">https://dfinview.com/BHFT</span>
|
|
| Expenses [Text Block] |
What were the Portfolio costs for last six months?This example shows the expenses you would have paid over the reporting period based on a hypothetical $10,000 investment.
Class Name |
Costs of a $10,000 investment |
Costs paid as a percentage of a $10,000 investment |
Class A |
$19 |
0.36%Footnote Reference* |
| Footnote |
Description |
Footnote* |
Annualized. | |
|
| Expenses Paid, Amount |
$ 19
|
|
| Expense Ratio, Percent |
0.36%
|
[77] |
| AssetsNet |
$ 731,808,517
|
|
| Holdings Count | Holding |
40
|
|
| Advisory Fees Paid, Amount |
$ 1,139,622
|
|
| InvestmentCompanyPortfolioTurnover |
69.00%
|
|
| Additional Fund Statistics [Text Block] |
- Total Net Assets$731,808,517
- # of Portfolio Investments40
- Portfolio Turnover Rate69%
- Total Advisory Fees Paid$1,139,622
|
|
| Holdings [Text Block] |
Value |
Value |
Real Estate Equities |
3.9 |
U.S. Mid Cap Equities |
4.5 |
U.S. Small Cap Equities |
5.0 |
High Yield Fixed Income |
6.0 |
Commodities |
7.6 |
Emerging Market Equities |
10.1 |
Investment Grade Fixed Income |
11.1 |
International Developed Market Equities |
12.9 |
U.S. Large Cap Equities |
37.3 | |
|
| Largest Holdings [Text Block] |
SPDR S&P 500 ETF Trust |
15.2 |
iShares Core S&P 500 ETF |
13.2 |
iShares Core MSCI Emerging Markets ETF |
10.1 |
SPDR Portfolio Developed World ex-U.S. ETF |
9.9 |
Vanguard Total Bond Market ETF |
6.5 |
iShares Core S&P Small-Cap ETF |
5.0 |
iShares Core S&P Mid-Cap ETF |
4.5 |
SPDR Gold Shares |
4.2 |
Vanguard Long-Term Corporate Bond ETF |
3.6 |
Invesco Optimum Yield Diversified Commodity Strategy No K-1 ETF |
3.5 | |
|
| Updated Prospectus Phone Number |
1-888-243-1956
|
|
| Updated Prospectus Web Address |
<span style="box-sizing: border-box; color: rgb(0, 0, 0); display: inline; flex-wrap: nowrap; font-size: 10.6667px; font-weight: 400; grid-area: auto; line-height: 16px; margin: 0px; overflow: visible; text-align: justify; text-align-last: left; white-space-collapse: preserve-breaks;">https://dfinview.com/BHFT</span>
|
|
| C000030701 |
|
|
| Shareholder Report [Line Items] |
|
|
| Fund Name |
SSGA Growth ETF Portfolio
|
|
| Class Name |
Class B
|
|
| No Trading Symbol [Flag] |
true
|
|
| Annual or Semi-Annual Statement [Text Block] |
This semi-annual shareholder report contains important information about the SSGA Growth ETF Portfolio (the "Portfolio") for the period of January 1, 2025 to June 30, 2025.
|
|
| Shareholder Report Annual or Semi-Annual |
Semi-Annual Shareholder Report
|
|
| Additional Information [Text Block] |
You can find additional information about the Portfolio at https://dfinview.com/BHFT. You can also request this information by contacting us at 1-888-243-1956.
|
|
| Additional Information Phone Number |
1-888-243-1956
|
|
| Additional Information Website |
<span style="box-sizing: border-box; color: rgb(0, 0, 0); display: inline; flex-wrap: nowrap; font-size: 12px; font-weight: 400; grid-area: auto; line-height: 18px; margin: 0px; overflow: visible; text-align: left; text-align-last: auto; white-space-collapse: preserve-breaks;">https://dfinview.com/BHFT</span>
|
|
| Expenses [Text Block] |
What were the Portfolio costs for last six months?This example shows the expenses you would have paid over the reporting period based on a hypothetical $10,000 investment.
Class Name |
Costs of a $10,000 investment |
Costs paid as a percentage of a $10,000 investment |
Class B |
$31 |
0.61%Footnote Reference* |
| Footnote |
Description |
Footnote* |
Annualized. | |
|
| Expenses Paid, Amount |
$ 31
|
|
| Expense Ratio, Percent |
0.61%
|
[78] |
| AssetsNet |
$ 731,808,517
|
|
| Holdings Count | Holding |
40
|
|
| Advisory Fees Paid, Amount |
$ 1,139,622
|
|
| InvestmentCompanyPortfolioTurnover |
69.00%
|
|
| Additional Fund Statistics [Text Block] |
- Total Net Assets$731,808,517
- # of Portfolio Investments40
- Portfolio Turnover Rate69%
- Total Advisory Fees Paid$1,139,622
|
|
| Holdings [Text Block] |
Value |
Value |
Real Estate Equities |
3.9 |
U.S. Mid Cap Equities |
4.5 |
U.S. Small Cap Equities |
5.0 |
High Yield Fixed Income |
6.0 |
Commodities |
7.6 |
Emerging Market Equities |
10.1 |
Investment Grade Fixed Income |
11.1 |
International Developed Market Equities |
12.9 |
U.S. Large Cap Equities |
37.3 | |
|
| Largest Holdings [Text Block] |
SPDR S&P 500 ETF Trust |
15.2 |
iShares Core S&P 500 ETF |
13.2 |
iShares Core MSCI Emerging Markets ETF |
10.1 |
SPDR Portfolio Developed World ex-U.S. ETF |
9.9 |
Vanguard Total Bond Market ETF |
6.5 |
iShares Core S&P Small-Cap ETF |
5.0 |
iShares Core S&P Mid-Cap ETF |
4.5 |
SPDR Gold Shares |
4.2 |
Vanguard Long-Term Corporate Bond ETF |
3.6 |
Invesco Optimum Yield Diversified Commodity Strategy No K-1 ETF |
3.5 | |
|
| Updated Prospectus Phone Number |
1-888-243-1956
|
|
| Updated Prospectus Web Address |
<span style="box-sizing: border-box; color: rgb(0, 0, 0); display: inline; flex-wrap: nowrap; font-size: 10.6667px; font-weight: 400; grid-area: auto; line-height: 16px; margin: 0px; overflow: visible; text-align: justify; text-align-last: left; white-space-collapse: preserve-breaks;">https://dfinview.com/BHFT</span>
|
|
| C000030703 |
|
|
| Shareholder Report [Line Items] |
|
|
| Fund Name |
SSGA Growth ETF Portfolio
|
|
| Class Name |
Class E
|
|
| No Trading Symbol [Flag] |
true
|
|
| Annual or Semi-Annual Statement [Text Block] |
This semi-annual shareholder report contains important information about the SSGA Growth ETF Portfolio (the "Portfolio") for the period of January 1, 2025 to June 30, 2025.
|
|
| Shareholder Report Annual or Semi-Annual |
Semi-Annual Shareholder Report
|
|
| Additional Information [Text Block] |
You can find additional information about the Portfolio at https://dfinview.com/BHFT. You can also request this information by contacting us at 1-888-243-1956.
|
|
| Additional Information Phone Number |
1-888-243-1956
|
|
| Additional Information Website |
<span style="box-sizing: border-box; color: rgb(0, 0, 0); display: inline; flex-wrap: nowrap; font-size: 12px; font-weight: 400; grid-area: auto; line-height: 18px; margin: 0px; overflow: visible; text-align: left; text-align-last: auto; white-space-collapse: preserve-breaks;">https://dfinview.com/BHFT</span>
|
|
| Expenses [Text Block] |
What were the Portfolio costs for last six months?This example shows the expenses you would have paid over the reporting period based on a hypothetical $10,000 investment.
Class Name |
Costs of a $10,000 investment |
Costs paid as a percentage of a $10,000 investment |
Class E |
$26 |
0.51%Footnote Reference* |
| Footnote |
Description |
Footnote* |
Annualized. | |
|
| Expenses Paid, Amount |
$ 26
|
|
| Expense Ratio, Percent |
0.51%
|
[79] |
| AssetsNet |
$ 731,808,517
|
|
| Holdings Count | Holding |
40
|
|
| Advisory Fees Paid, Amount |
$ 1,139,622
|
|
| InvestmentCompanyPortfolioTurnover |
69.00%
|
|
| Additional Fund Statistics [Text Block] |
- Total Net Assets$731,808,517
- # of Portfolio Investments40
- Portfolio Turnover Rate69%
- Total Advisory Fees Paid$1,139,622
|
|
| Holdings [Text Block] |
Value |
Value |
Real Estate Equities |
3.9 |
U.S. Mid Cap Equities |
4.5 |
U.S. Small Cap Equities |
5.0 |
High Yield Fixed Income |
6.0 |
Commodities |
7.6 |
Emerging Market Equities |
10.1 |
Investment Grade Fixed Income |
11.1 |
International Developed Market Equities |
12.9 |
U.S. Large Cap Equities |
37.3 | |
|
| Largest Holdings [Text Block] |
SPDR S&P 500 ETF Trust |
15.2 |
iShares Core S&P 500 ETF |
13.2 |
iShares Core MSCI Emerging Markets ETF |
10.1 |
SPDR Portfolio Developed World ex-U.S. ETF |
9.9 |
Vanguard Total Bond Market ETF |
6.5 |
iShares Core S&P Small-Cap ETF |
5.0 |
iShares Core S&P Mid-Cap ETF |
4.5 |
SPDR Gold Shares |
4.2 |
Vanguard Long-Term Corporate Bond ETF |
3.6 |
Invesco Optimum Yield Diversified Commodity Strategy No K-1 ETF |
3.5 | |
|
| Updated Prospectus Phone Number |
1-888-243-1956
|
|
| Updated Prospectus Web Address |
<span style="box-sizing: border-box; color: rgb(0, 0, 0); display: inline; flex-wrap: nowrap; font-size: 10.6667px; font-weight: 400; grid-area: auto; line-height: 16px; margin: 0px; overflow: visible; text-align: justify; text-align-last: left; white-space-collapse: preserve-breaks;">https://dfinview.com/BHFT</span>
|
|
| C000030576 |
|
|
| Shareholder Report [Line Items] |
|
|
| Fund Name |
T. Rowe Price Large Cap Value Portfolio
|
|
| Class Name |
Class A
|
|
| No Trading Symbol [Flag] |
true
|
|
| Annual or Semi-Annual Statement [Text Block] |
This semi-annual shareholder report contains important information about the T. Rowe Price Large Cap Value Portfolio (the "Portfolio") for the period of January 1, 2025 to June 30, 2025.
|
|
| Shareholder Report Annual or Semi-Annual |
Semi-Annual Shareholder Report
|
|
| Additional Information [Text Block] |
You can find additional information about the Portfolio at https://dfinview.com/BHFT. You can also request this information by contacting us at 1-888-243-1956.
|
|
| Additional Information Phone Number |
1-888-243-1956
|
|
| Additional Information Website |
<span style="box-sizing: border-box; color: rgb(0, 0, 0); display: inline; flex-wrap: nowrap; font-size: 12px; font-weight: 400; grid-area: auto; line-height: 18px; margin: 0px; overflow: visible; text-align: left; text-align-last: auto; white-space-collapse: preserve-breaks;">https://dfinview.com/BHFT</span>
|
|
| Expenses [Text Block] |
What were the Portfolio costs for last six months?This example shows the expenses you would have paid over the reporting period based on a hypothetical $10,000 investment.
Class Name |
Costs of a $10,000 investment |
Costs paid as a percentage of a $10,000 investment |
Class A |
$26 |
0.52%Footnote Reference* |
| Footnote |
Description |
Footnote* |
Annualized. | |
|
| Expenses Paid, Amount |
$ 26
|
|
| Expense Ratio, Percent |
0.52%
|
[80] |
| AssetsNet |
$ 2,509,759,139
|
|
| Holdings Count | Holding |
106
|
|
| Advisory Fees Paid, Amount |
$ 6,141,828
|
|
| InvestmentCompanyPortfolioTurnover |
22.00%
|
|
| Additional Fund Statistics [Text Block] |
- Total Net Assets$2,509,759,139
- # of Portfolio Investments106
- Portfolio Turnover Rate22%
- Total Advisory Fees Paid$6,141,828
|
|
| Holdings [Text Block] |
Value |
Value |
Real Estate |
3.4 |
Consumer Discretionary |
5.1 |
Utilities |
5.2 |
Communication Services |
6.0 |
Energy |
8.1 |
Information Technology |
9.3 |
Consumer Staples |
10.0 |
Health Care |
13.8 |
Industrials |
14.0 |
Financials |
21.4 |
Value |
Value |
Switzerland |
0.5 |
United Kingdom |
0.6 |
Ireland |
0.9 |
South Korea |
1.0 |
France |
1.0 |
Germany |
1.0 |
United States |
93.9 | |
|
| Largest Holdings [Text Block] |
Bank of America Corp. |
3.8 |
Charles Schwab Corp. |
2.6 |
Kenvue, Inc. |
2.5 |
Elevance Health, Inc. |
2.5 |
Wells Fargo & Co. |
2.4 |
Alphabet, Inc. |
2.3 |
L3Harris Technologies, Inc. |
2.3 |
ConocoPhillips |
2.2 |
Hartford Insurance Group, Inc. |
2.2 |
Amazon.com, Inc. |
2.1 | |
|
| Material Fund Change [Text Block] |
|
|
| Updated Prospectus Phone Number |
1-888-243-1956
|
|
| Updated Prospectus Web Address |
<span style="box-sizing: border-box; color: rgb(0, 0, 0); display: inline; flex-wrap: nowrap; font-size: 10.6667px; font-weight: 400; grid-area: auto; line-height: 16px; margin: 0px; overflow: visible; text-align: justify; text-align-last: left; white-space-collapse: preserve-breaks;">https://dfinview.com/BHFT</span>
|
|
| C000030577 |
|
|
| Shareholder Report [Line Items] |
|
|
| Fund Name |
T. Rowe Price Large Cap Value Portfolio
|
|
| Class Name |
Class B
|
|
| No Trading Symbol [Flag] |
true
|
|
| Annual or Semi-Annual Statement [Text Block] |
This semi-annual shareholder report contains important information about the T. Rowe Price Large Cap Value Portfolio (the "Portfolio") for the period of January 1, 2025 to June 30, 2025.
|
|
| Shareholder Report Annual or Semi-Annual |
Semi-Annual Shareholder Report
|
|
| Additional Information [Text Block] |
You can find additional information about the Portfolio at https://dfinview.com/BHFT. You can also request this information by contacting us at 1-888-243-1956.
|
|
| Additional Information Phone Number |
1-888-243-1956
|
|
| Additional Information Website |
<span style="box-sizing: border-box; color: rgb(0, 0, 0); display: inline; flex-wrap: nowrap; font-size: 12px; font-weight: 400; grid-area: auto; line-height: 18px; margin: 0px; overflow: visible; text-align: left; text-align-last: auto; white-space-collapse: preserve-breaks;">https://dfinview.com/BHFT</span>
|
|
| Expenses [Text Block] |
What were the Portfolio costs for last six months?This example shows the expenses you would have paid over the reporting period based on a hypothetical $10,000 investment.
Class Name |
Costs of a $10,000 investment |
Costs paid as a percentage of a $10,000 investment |
Class B |
$39 |
0.77%Footnote Reference* |
| Footnote |
Description |
Footnote* |
Annualized. | |
|
| Expenses Paid, Amount |
$ 39
|
|
| Expense Ratio, Percent |
0.77%
|
[81] |
| AssetsNet |
$ 2,509,759,139
|
|
| Holdings Count | Holding |
106
|
|
| Advisory Fees Paid, Amount |
$ 6,141,828
|
|
| InvestmentCompanyPortfolioTurnover |
22.00%
|
|
| Additional Fund Statistics [Text Block] |
- Total Net Assets$2,509,759,139
- # of Portfolio Investments106
- Portfolio Turnover Rate22%
- Total Advisory Fees Paid$6,141,828
|
|
| Holdings [Text Block] |
Value |
Value |
Real Estate |
3.4 |
Consumer Discretionary |
5.1 |
Utilities |
5.2 |
Communication Services |
6.0 |
Energy |
8.1 |
Information Technology |
9.3 |
Consumer Staples |
10.0 |
Health Care |
13.8 |
Industrials |
14.0 |
Financials |
21.4 |
Value |
Value |
Switzerland |
0.5 |
United Kingdom |
0.6 |
Ireland |
0.9 |
South Korea |
1.0 |
France |
1.0 |
Germany |
1.0 |
United States |
93.9 | |
|
| Largest Holdings [Text Block] |
Bank of America Corp. |
3.8 |
Charles Schwab Corp. |
2.6 |
Kenvue, Inc. |
2.5 |
Elevance Health, Inc. |
2.5 |
Wells Fargo & Co. |
2.4 |
Alphabet, Inc. |
2.3 |
L3Harris Technologies, Inc. |
2.3 |
ConocoPhillips |
2.2 |
Hartford Insurance Group, Inc. |
2.2 |
Amazon.com, Inc. |
2.1 | |
|
| Material Fund Change [Text Block] |
|
|
| Updated Prospectus Phone Number |
1-888-243-1956
|
|
| Updated Prospectus Web Address |
<span style="box-sizing: border-box; color: rgb(0, 0, 0); display: inline; flex-wrap: nowrap; font-size: 10.6667px; font-weight: 400; grid-area: auto; line-height: 16px; margin: 0px; overflow: visible; text-align: justify; text-align-last: left; white-space-collapse: preserve-breaks;">https://dfinview.com/BHFT</span>
|
|
| C000030579 |
|
|
| Shareholder Report [Line Items] |
|
|
| Fund Name |
T. Rowe Price Large Cap Value Portfolio
|
|
| Class Name |
Class E
|
|
| No Trading Symbol [Flag] |
true
|
|
| Annual or Semi-Annual Statement [Text Block] |
This semi-annual shareholder report contains important information about the T. Rowe Price Large Cap Value Portfolio (the "Portfolio") for the period of January 1, 2025 to June 30, 2025.
|
|
| Shareholder Report Annual or Semi-Annual |
Semi-Annual Shareholder Report
|
|
| Additional Information [Text Block] |
You can find additional information about the Portfolio at https://dfinview.com/BHFT. You can also request this information by contacting us at 1-888-243-1956.
|
|
| Additional Information Phone Number |
1-888-243-1956
|
|
| Additional Information Website |
<span style="box-sizing: border-box; color: rgb(0, 0, 0); display: inline; flex-wrap: nowrap; font-size: 12px; font-weight: 400; grid-area: auto; line-height: 18px; margin: 0px; overflow: visible; text-align: left; text-align-last: auto; white-space-collapse: preserve-breaks;">https://dfinview.com/BHFT</span>
|
|
| Expenses [Text Block] |
What were the Portfolio costs for last six months?This example shows the expenses you would have paid over the reporting period based on a hypothetical $10,000 investment.
Class Name |
Costs of a $10,000 investment |
Costs paid as a percentage of a $10,000 investment |
Class E |
$34 |
0.67%Footnote Reference* |
| Footnote |
Description |
Footnote* |
Annualized. | |
|
| Expenses Paid, Amount |
$ 34
|
|
| Expense Ratio, Percent |
0.67%
|
[82] |
| AssetsNet |
$ 2,509,759,139
|
|
| Holdings Count | Holding |
106
|
|
| Advisory Fees Paid, Amount |
$ 6,141,828
|
|
| InvestmentCompanyPortfolioTurnover |
22.00%
|
|
| Additional Fund Statistics [Text Block] |
- Total Net Assets$2,509,759,139
- # of Portfolio Investments106
- Portfolio Turnover Rate22%
- Total Advisory Fees Paid$6,141,828
|
|
| Holdings [Text Block] |
Value |
Value |
Real Estate |
3.4 |
Consumer Discretionary |
5.1 |
Utilities |
5.2 |
Communication Services |
6.0 |
Energy |
8.1 |
Information Technology |
9.3 |
Consumer Staples |
10.0 |
Health Care |
13.8 |
Industrials |
14.0 |
Financials |
21.4 |
Value |
Value |
Switzerland |
0.5 |
United Kingdom |
0.6 |
Ireland |
0.9 |
South Korea |
1.0 |
France |
1.0 |
Germany |
1.0 |
United States |
93.9 | |
|
| Largest Holdings [Text Block] |
Bank of America Corp. |
3.8 |
Charles Schwab Corp. |
2.6 |
Kenvue, Inc. |
2.5 |
Elevance Health, Inc. |
2.5 |
Wells Fargo & Co. |
2.4 |
Alphabet, Inc. |
2.3 |
L3Harris Technologies, Inc. |
2.3 |
ConocoPhillips |
2.2 |
Hartford Insurance Group, Inc. |
2.2 |
Amazon.com, Inc. |
2.1 | |
|
| Material Fund Change [Text Block] |
|
|
| Updated Prospectus Phone Number |
1-888-243-1956
|
|
| Updated Prospectus Web Address |
<span style="box-sizing: border-box; color: rgb(0, 0, 0); display: inline; flex-wrap: nowrap; font-size: 10.6667px; font-weight: 400; grid-area: auto; line-height: 16px; margin: 0px; overflow: visible; text-align: justify; text-align-last: left; white-space-collapse: preserve-breaks;">https://dfinview.com/BHFT</span>
|
|
| C000030650 |
|
|
| Shareholder Report [Line Items] |
|
|
| Fund Name |
T. Rowe Price Mid Cap Growth Portfolio
|
|
| Class Name |
Class A
|
|
| No Trading Symbol [Flag] |
true
|
|
| Annual or Semi-Annual Statement [Text Block] |
This semi-annual shareholder report contains important information about the T. Rowe Price Mid Cap Growth Portfolio (the "Portfolio") for the period of January 1, 2025 to June 30, 2025.
|
|
| Shareholder Report Annual or Semi-Annual |
Semi-Annual Shareholder Report
|
|
| Additional Information [Text Block] |
You can find additional information about the Portfolio at https://dfinview.com/BHFT. You can also request this information by contacting us at 1-888-243-1956.
|
|
| Additional Information Phone Number |
1-888-243-1956
|
|
| Additional Information Website |
<span style="box-sizing: border-box; color: rgb(0, 0, 0); display: inline; flex-wrap: nowrap; font-size: 12px; font-weight: 400; grid-area: auto; line-height: 18px; margin: 0px; overflow: visible; text-align: left; text-align-last: auto; white-space-collapse: preserve-breaks;">https://dfinview.com/BHFT</span>
|
|
| Expenses [Text Block] |
What were the Portfolio costs for last six months?This example shows the expenses you would have paid over the reporting period based on a hypothetical $10,000 investment.
Class Name |
Costs of a $10,000 investment |
Costs paid as a percentage of a $10,000 investment |
Class A |
$33 |
0.66%Footnote Reference* |
| Footnote |
Description |
Footnote* |
Annualized. | |
|
| Expenses Paid, Amount |
$ 33
|
|
| Expense Ratio, Percent |
0.66%
|
[83] |
| AssetsNet |
$ 1,188,334,942
|
|
| Holdings Count | Holding |
166
|
|
| Advisory Fees Paid, Amount |
$ 3,617,853
|
|
| InvestmentCompanyPortfolioTurnover |
18.00%
|
|
| Additional Fund Statistics [Text Block] |
- Total Net Assets$1,188,334,942
- # of Portfolio Investments166
- Portfolio Turnover Rate18%
- Total Advisory Fees Paid$3,617,853
|
|
| Holdings [Text Block] |
Value |
Value |
Real Estate |
0.9 |
Consumer Staples |
3.7 |
Materials |
3.7 |
Communication Services |
4.8 |
Energy |
4.9 |
Financials |
8.9 |
Consumer Discretionary |
14.9 |
Industrials |
16.7 |
Health Care |
18.9 |
Information Technology |
19.7 |
Value |
Value |
Denmark |
0.6 |
Switzerland |
0.7 |
Netherlands |
0.8 |
Germany |
0.9 |
United Kingdom |
1.4 |
United States |
92.8 | |
|
| Largest Holdings [Text Block] |
Veeva Systems, Inc. |
2.2 |
Hologic, Inc. |
2.1 |
Alnylam Pharmaceuticals, Inc. |
1.9 |
PTC, Inc. |
1.8 |
Hilton Worldwide Holdings, Inc. |
1.7 |
Cheniere Energy, Inc. |
1.7 |
Tyler Technologies, Inc. |
1.7 |
Agilent Technologies, Inc. |
1.6 |
Yum! Brands, Inc. |
1.6 |
Textron, Inc. |
1.6 | |
|
| Material Fund Change [Text Block] |
|
|
| Updated Prospectus Phone Number |
1-888-243-1956
|
|
| Updated Prospectus Web Address |
<span style="box-sizing: border-box; color: rgb(0, 0, 0); display: inline; flex-wrap: nowrap; font-size: 10.6667px; font-weight: 400; grid-area: auto; line-height: 16px; margin: 0px; overflow: visible; text-align: justify; text-align-last: left; white-space-collapse: preserve-breaks;">https://dfinview.com/BHFT</span>
|
|
| C000030651 |
|
|
| Shareholder Report [Line Items] |
|
|
| Fund Name |
T. Rowe Price Mid Cap Growth Portfolio
|
|
| Class Name |
Class B
|
|
| No Trading Symbol [Flag] |
true
|
|
| Annual or Semi-Annual Statement [Text Block] |
This semi-annual shareholder report contains important information about the T. Rowe Price Mid Cap Growth Portfolio (the "Portfolio") for the period of January 1, 2025 to June 30, 2025.
|
|
| Shareholder Report Annual or Semi-Annual |
Semi-Annual Shareholder Report
|
|
| Additional Information [Text Block] |
You can find additional information about the Portfolio at https://dfinview.com/BHFT. You can also request this information by contacting us at 1-888-243-1956.
|
|
| Additional Information Phone Number |
1-888-243-1956
|
|
| Additional Information Website |
<span style="box-sizing: border-box; color: rgb(0, 0, 0); display: inline; flex-wrap: nowrap; font-size: 12px; font-weight: 400; grid-area: auto; line-height: 18px; margin: 0px; overflow: visible; text-align: left; text-align-last: auto; white-space-collapse: preserve-breaks;">https://dfinview.com/BHFT</span>
|
|
| Expenses [Text Block] |
What were the Portfolio costs for last six months?This example shows the expenses you would have paid over the reporting period based on a hypothetical $10,000 investment.
Class Name |
Costs of a $10,000 investment |
Costs paid as a percentage of a $10,000 investment |
Class B |
$45 |
0.91%Footnote Reference* |
| Footnote |
Description |
Footnote* |
Annualized. | |
|
| Expenses Paid, Amount |
$ 45
|
|
| Expense Ratio, Percent |
0.91%
|
[84] |
| AssetsNet |
$ 1,188,334,942
|
|
| Holdings Count | Holding |
166
|
|
| Advisory Fees Paid, Amount |
$ 3,617,853
|
|
| InvestmentCompanyPortfolioTurnover |
18.00%
|
|
| Additional Fund Statistics [Text Block] |
- Total Net Assets$1,188,334,942
- # of Portfolio Investments166
- Portfolio Turnover Rate18%
- Total Advisory Fees Paid$3,617,853
|
|
| Holdings [Text Block] |
Value |
Value |
Real Estate |
0.9 |
Consumer Staples |
3.7 |
Materials |
3.7 |
Communication Services |
4.8 |
Energy |
4.9 |
Financials |
8.9 |
Consumer Discretionary |
14.9 |
Industrials |
16.7 |
Health Care |
18.9 |
Information Technology |
19.7 |
Value |
Value |
Denmark |
0.6 |
Switzerland |
0.7 |
Netherlands |
0.8 |
Germany |
0.9 |
United Kingdom |
1.4 |
United States |
92.8 | |
|
| Largest Holdings [Text Block] |
Veeva Systems, Inc. |
2.2 |
Hologic, Inc. |
2.1 |
Alnylam Pharmaceuticals, Inc. |
1.9 |
PTC, Inc. |
1.8 |
Hilton Worldwide Holdings, Inc. |
1.7 |
Cheniere Energy, Inc. |
1.7 |
Tyler Technologies, Inc. |
1.7 |
Agilent Technologies, Inc. |
1.6 |
Yum! Brands, Inc. |
1.6 |
Textron, Inc. |
1.6 | |
|
| Material Fund Change [Text Block] |
|
|
| Updated Prospectus Phone Number |
1-888-243-1956
|
|
| Updated Prospectus Web Address |
<span style="box-sizing: border-box; color: rgb(0, 0, 0); display: inline; flex-wrap: nowrap; font-size: 10.6667px; font-weight: 400; grid-area: auto; line-height: 16px; margin: 0px; overflow: visible; text-align: justify; text-align-last: left; white-space-collapse: preserve-breaks;">https://dfinview.com/BHFT</span>
|
|
| C000030653 |
|
|
| Shareholder Report [Line Items] |
|
|
| Fund Name |
T. Rowe Price Mid Cap Growth Portfolio
|
|
| Class Name |
Class E
|
|
| No Trading Symbol [Flag] |
true
|
|
| Annual or Semi-Annual Statement [Text Block] |
This semi-annual shareholder report contains important information about the T. Rowe Price Mid Cap Growth Portfolio (the "Portfolio") for the period of January 1, 2025 to June 30, 2025.
|
|
| Shareholder Report Annual or Semi-Annual |
Semi-Annual Shareholder Report
|
|
| Additional Information [Text Block] |
You can find additional information about the Portfolio at https://dfinview.com/BHFT. You can also request this information by contacting us at 1-888-243-1956.
|
|
| Additional Information Phone Number |
1-888-243-1956
|
|
| Additional Information Website |
<span style="box-sizing: border-box; color: rgb(0, 0, 0); display: inline; flex-wrap: nowrap; font-size: 12px; font-weight: 400; grid-area: auto; line-height: 18px; margin: 0px; overflow: visible; text-align: left; text-align-last: auto; white-space-collapse: preserve-breaks;">https://dfinview.com/BHFT</span>
|
|
| Expenses [Text Block] |
What were the Portfolio costs for last six months?This example shows the expenses you would have paid over the reporting period based on a hypothetical $10,000 investment.
Class Name |
Costs of a $10,000 investment |
Costs paid as a percentage of a $10,000 investment |
Class E |
$40 |
0.81%Footnote Reference* |
| Footnote |
Description |
Footnote* |
Annualized. | |
|
| Expenses Paid, Amount |
$ 40
|
|
| Expense Ratio, Percent |
0.81%
|
[85] |
| AssetsNet |
$ 1,188,334,942
|
|
| Holdings Count | Holding |
166
|
|
| Advisory Fees Paid, Amount |
$ 3,617,853
|
|
| InvestmentCompanyPortfolioTurnover |
18.00%
|
|
| Additional Fund Statistics [Text Block] |
- Total Net Assets$1,188,334,942
- # of Portfolio Investments166
- Portfolio Turnover Rate18%
- Total Advisory Fees Paid$3,617,853
|
|
| Holdings [Text Block] |
Value |
Value |
Real Estate |
0.9 |
Consumer Staples |
3.7 |
Materials |
3.7 |
Communication Services |
4.8 |
Energy |
4.9 |
Financials |
8.9 |
Consumer Discretionary |
14.9 |
Industrials |
16.7 |
Health Care |
18.9 |
Information Technology |
19.7 |
Value |
Value |
Denmark |
0.6 |
Switzerland |
0.7 |
Netherlands |
0.8 |
Germany |
0.9 |
United Kingdom |
1.4 |
United States |
92.8 | |
|
| Largest Holdings [Text Block] |
Veeva Systems, Inc. |
2.2 |
Hologic, Inc. |
2.1 |
Alnylam Pharmaceuticals, Inc. |
1.9 |
PTC, Inc. |
1.8 |
Hilton Worldwide Holdings, Inc. |
1.7 |
Cheniere Energy, Inc. |
1.7 |
Tyler Technologies, Inc. |
1.7 |
Agilent Technologies, Inc. |
1.6 |
Yum! Brands, Inc. |
1.6 |
Textron, Inc. |
1.6 | |
|
| Material Fund Change [Text Block] |
|
|
| Updated Prospectus Phone Number |
1-888-243-1956
|
|
| Updated Prospectus Web Address |
<span style="box-sizing: border-box; color: rgb(0, 0, 0); display: inline; flex-wrap: nowrap; font-size: 10.6667px; font-weight: 400; grid-area: auto; line-height: 16px; margin: 0px; overflow: visible; text-align: justify; text-align-last: left; white-space-collapse: preserve-breaks;">https://dfinview.com/BHFT</span>
|
|
| C000154912 |
|
|
| Shareholder Report [Line Items] |
|
|
| Fund Name |
TCW Core Fixed Income Portfolio
|
|
| Class Name |
Class A
|
|
| No Trading Symbol [Flag] |
true
|
|
| Annual or Semi-Annual Statement [Text Block] |
This semi-annual shareholder report contains important information about the TCW Core Fixed Income Portfolio (the "Portfolio") for the period of January 1, 2025 to June 30, 2025.
|
|
| Shareholder Report Annual or Semi-Annual |
Semi-Annual Shareholder Report
|
|
| Additional Information [Text Block] |
You can find additional information about the Portfolio at https://dfinview.com/BHFT. You can also request this information by contacting us at 1-888-243-1956.
|
|
| Additional Information Phone Number |
1-888-243-1956
|
|
| Additional Information Website |
<span style="box-sizing: border-box; color: rgb(0, 0, 0); display: inline; flex-wrap: nowrap; font-size: 12px; font-weight: 400; grid-area: auto; line-height: 18px; margin: 0px; overflow: visible; text-align: left; text-align-last: auto; white-space-collapse: preserve-breaks;">https://dfinview.com/BHFT</span>
|
|
| Expenses [Text Block] |
What were the Portfolio costs for last six months?This example shows the expenses you would have paid over the reporting period based on a hypothetical $10,000 investment.
Class Name |
Costs of a $10,000 investment |
Costs paid as a percentage of a $10,000 investment |
Class A |
$24 |
0.47%Footnote Reference* |
| Footnote |
Description |
Footnote* |
Annualized. | |
|
| Expenses Paid, Amount |
$ 24
|
|
| Expense Ratio, Percent |
0.47%
|
[86] |
| AssetsNet |
$ 1,258,998,797
|
|
| Holdings Count | Holding |
411
|
|
| Advisory Fees Paid, Amount |
$ 2,667,026
|
|
| InvestmentCompanyPortfolioTurnover |
237.00%
|
|
| Additional Fund Statistics [Text Block] |
- Total Net Assets$1,258,998,797
- # of Portfolio Investments411
- Portfolio Turnover Rate237%
- Total Advisory Fees Paid$2,667,026
|
|
| Holdings [Text Block] |
Value |
Value |
Foreign Government |
0.1 |
Municipals |
0.6 |
Short-Term Investments |
5.0 |
Non-Agency Mortgage-Backed Securities |
8.9 |
Asset-Backed Securities |
9.1 |
Corporate Bonds & Notes |
17.8 |
U.S. Treasury & Government Agencies |
33.0 |
Agency Sponsored Mortgage-Backed Securities |
35.6 | |
|
| Largest Holdings [Text Block] |
Top 10 Fixed Income Issuers
U.S. Treasury Notes |
23.7 |
Federal National Mortgage Association |
12.5 |
Federal Home Loan Mortgage Corp. |
8.5 |
U.S. Treasury Bonds |
8.1 |
Uniform Mortgage-Backed Security, TBA |
6.5 |
Government National Mortgage Association, TBA |
4.4 |
Government National Mortgage Association |
2.2 |
CIM Trust |
2.1 |
U.S. Treasury Inflation-Indexed Notes |
1.2 |
JP Morgan Mortgage Trust |
1.1 | |
|
| Updated Prospectus Phone Number |
1-888-243-1956
|
|
| Updated Prospectus Web Address |
<span style="box-sizing: border-box; color: rgb(0, 0, 0); display: inline; flex-wrap: nowrap; font-size: 10.6667px; font-weight: 400; grid-area: auto; line-height: 16px; margin: 0px; overflow: visible; text-align: justify; text-align-last: left; white-space-collapse: preserve-breaks;">https://dfinview.com/BHFT</span>
|
|
| C000154913 |
|
|
| Shareholder Report [Line Items] |
|
|
| Fund Name |
TCW Core Fixed Income Portfolio
|
|
| Class Name |
Class B
|
|
| No Trading Symbol [Flag] |
true
|
|
| Annual or Semi-Annual Statement [Text Block] |
This semi-annual shareholder report contains important information about the TCW Core Fixed Income Portfolio (the "Portfolio") for the period of January 1, 2025 to June 30, 2025.
|
|
| Shareholder Report Annual or Semi-Annual |
Semi-Annual Shareholder Report
|
|
| Additional Information [Text Block] |
You can find additional information about the Portfolio at https://dfinview.com/BHFT. You can also request this information by contacting us at 1-888-243-1956.
|
|
| Additional Information Phone Number |
1-888-243-1956
|
|
| Additional Information Website |
<span style="box-sizing: border-box; color: rgb(0, 0, 0); display: inline; flex-wrap: nowrap; font-size: 12px; font-weight: 400; grid-area: auto; line-height: 18px; margin: 0px; overflow: visible; text-align: left; text-align-last: auto; white-space-collapse: preserve-breaks;">https://dfinview.com/BHFT</span>
|
|
| Expenses [Text Block] |
What were the Portfolio costs for last six months?This example shows the expenses you would have paid over the reporting period based on a hypothetical $10,000 investment.
Class Name |
Costs of a $10,000 investment |
Costs paid as a percentage of a $10,000 investment |
Class B |
$36 |
0.72%Footnote Reference* |
| Footnote |
Description |
Footnote* |
Annualized. | |
|
| Expenses Paid, Amount |
$ 36
|
|
| Expense Ratio, Percent |
0.72%
|
[87] |
| AssetsNet |
$ 1,258,998,797
|
|
| Holdings Count | Holding |
411
|
|
| Advisory Fees Paid, Amount |
$ 2,667,026
|
|
| InvestmentCompanyPortfolioTurnover |
237.00%
|
|
| Additional Fund Statistics [Text Block] |
- Total Net Assets$1,258,998,797
- # of Portfolio Investments411
- Portfolio Turnover Rate237%
- Total Advisory Fees Paid$2,667,026
|
|
| Holdings [Text Block] |
Value |
Value |
Foreign Government |
0.1 |
Municipals |
0.6 |
Short-Term Investments |
5.0 |
Non-Agency Mortgage-Backed Securities |
8.9 |
Asset-Backed Securities |
9.1 |
Corporate Bonds & Notes |
17.8 |
U.S. Treasury & Government Agencies |
33.0 |
Agency Sponsored Mortgage-Backed Securities |
35.6 | |
|
| Largest Holdings [Text Block] |
Top 10 Fixed Income Issuers
U.S. Treasury Notes |
23.7 |
Federal National Mortgage Association |
12.5 |
Federal Home Loan Mortgage Corp. |
8.5 |
U.S. Treasury Bonds |
8.1 |
Uniform Mortgage-Backed Security, TBA |
6.5 |
Government National Mortgage Association, TBA |
4.4 |
Government National Mortgage Association |
2.2 |
CIM Trust |
2.1 |
U.S. Treasury Inflation-Indexed Notes |
1.2 |
JP Morgan Mortgage Trust |
1.1 | |
|
| Updated Prospectus Phone Number |
1-888-243-1956
|
|
| Updated Prospectus Web Address |
<span style="box-sizing: border-box; color: rgb(0, 0, 0); display: inline; flex-wrap: nowrap; font-size: 10.6667px; font-weight: 400; grid-area: auto; line-height: 16px; margin: 0px; overflow: visible; text-align: justify; text-align-last: left; white-space-collapse: preserve-breaks;">https://dfinview.com/BHFT</span>
|
|
| C000030586 |
|
|
| Shareholder Report [Line Items] |
|
|
| Fund Name |
Victory Sycamore Mid Cap Value Portfolio
|
|
| Class Name |
Class A
|
|
| No Trading Symbol [Flag] |
true
|
|
| Annual or Semi-Annual Statement [Text Block] |
This semi-annual shareholder report contains important information about the Victory Sycamore Mid Cap Value Portfolio (the "Portfolio") for the period of January 1, 2025 to June 30, 2025.
|
|
| Shareholder Report Annual or Semi-Annual |
Semi-Annual Shareholder Report
|
|
| Additional Information [Text Block] |
You can find additional information about the Portfolio at https://dfinview.com/BHFT. You can also request this information by contacting us at 1-888-243-1956.
|
|
| Additional Information Phone Number |
1-888-243-1956
|
|
| Additional Information Website |
<span style="box-sizing: border-box; color: rgb(0, 0, 0); display: inline; flex-wrap: nowrap; font-size: 12px; font-weight: 400; grid-area: auto; line-height: 18px; margin: 0px; overflow: visible; text-align: left; text-align-last: auto; white-space-collapse: preserve-breaks;">https://dfinview.com/BHFT</span>
|
|
| Expenses [Text Block] |
What were the Portfolio costs for last six months?This example shows the expenses you would have paid over the reporting period based on a hypothetical $10,000 investment.
Class Name |
Costs of a $10,000 investment |
Costs paid as a percentage of a $10,000 investment |
Class A |
$30 |
0.60%Footnote Reference* |
| Footnote |
Description |
Footnote* |
Annualized. | |
|
| Expenses Paid, Amount |
$ 30
|
|
| Expense Ratio, Percent |
0.60%
|
[88] |
| AssetsNet |
$ 861,435,198
|
|
| Holdings Count | Holding |
109
|
|
| Advisory Fees Paid, Amount |
$ 2,409,528
|
|
| InvestmentCompanyPortfolioTurnover |
27.00%
|
|
| Additional Fund Statistics [Text Block] |
- Total Net Assets$861,435,198
- # of Portfolio Investments109
- Portfolio Turnover Rate27%
- Total Advisory Fees Paid$2,409,528
|
|
| Holdings [Text Block] |
Value |
Value |
Energy |
5.0 |
Utilities |
5.1 |
Health Care |
5.9 |
Real Estate |
7.8 |
Consumer Discretionary |
7.8 |
Consumer Staples |
8.1 |
Information Technology |
9.9 |
Materials |
13.7 |
Financials |
14.7 |
Industrials |
18.2 |
Value |
Value |
Jersey, Channel Islands |
0.7 |
Canada |
1.3 |
Israel |
1.5 |
United States |
93.0 | |
|
| Largest Holdings [Text Block] |
U.S. Foods Holding Corp. |
2.5 |
Alliant Energy Corp. |
2.4 |
Quest Diagnostics, Inc. |
2.0 |
Crown Holdings, Inc. |
2.0 |
Fidelity National Financial, Inc. |
1.9 |
Performance Food Group Co. |
1.9 |
Willis Towers Watson PLC |
1.8 |
Genpact Ltd. |
1.8 |
Expedia Group, Inc. |
1.8 |
American Water Works Co., Inc. |
1.8 | |
|
| Material Fund Change [Text Block] |
|
|
| Updated Prospectus Phone Number |
1-888-243-1956
|
|
| Updated Prospectus Web Address |
<span style="box-sizing: border-box; color: rgb(0, 0, 0); display: inline; flex-wrap: nowrap; font-size: 10.6667px; font-weight: 400; grid-area: auto; line-height: 16px; margin: 0px; overflow: visible; text-align: justify; text-align-last: left; white-space-collapse: preserve-breaks;">https://dfinview.com/BHFT</span>
|
|
| C000030587 |
|
|
| Shareholder Report [Line Items] |
|
|
| Fund Name |
Victory Sycamore Mid Cap Value Portfolio
|
|
| Class Name |
Class B
|
|
| No Trading Symbol [Flag] |
true
|
|
| Annual or Semi-Annual Statement [Text Block] |
This semi-annual shareholder report contains important information about the Victory Sycamore Mid Cap Value Portfolio (the "Portfolio") for the period of January 1, 2025 to June 30, 2025.
|
|
| Shareholder Report Annual or Semi-Annual |
Semi-Annual Shareholder Report
|
|
| Additional Information [Text Block] |
You can find additional information about the Portfolio at https://dfinview.com/BHFT. You can also request this information by contacting us at 1-888-243-1956.
|
|
| Additional Information Phone Number |
1-888-243-1956
|
|
| Additional Information Website |
<span style="box-sizing: border-box; color: rgb(0, 0, 0); display: inline; flex-wrap: nowrap; font-size: 12px; font-weight: 400; grid-area: auto; line-height: 18px; margin: 0px; overflow: visible; text-align: left; text-align-last: auto; white-space-collapse: preserve-breaks;">https://dfinview.com/BHFT</span>
|
|
| Expenses [Text Block] |
What were the Portfolio costs for last six months?This example shows the expenses you would have paid over the reporting period based on a hypothetical $10,000 investment.
Class Name |
Costs of a $10,000 investment |
Costs paid as a percentage of a $10,000 investment |
Class B |
$42 |
0.85%Footnote Reference* |
| Footnote |
Description |
Footnote* |
Annualized. | |
|
| Expenses Paid, Amount |
$ 42
|
|
| Expense Ratio, Percent |
0.85%
|
[89] |
| AssetsNet |
$ 861,435,198
|
|
| Holdings Count | Holding |
109
|
|
| Advisory Fees Paid, Amount |
$ 2,409,528
|
|
| InvestmentCompanyPortfolioTurnover |
27.00%
|
|
| Additional Fund Statistics [Text Block] |
- Total Net Assets$861,435,198
- # of Portfolio Investments109
- Portfolio Turnover Rate27%
- Total Advisory Fees Paid$2,409,528
|
|
| Holdings [Text Block] |
Value |
Value |
Energy |
5.0 |
Utilities |
5.1 |
Health Care |
5.9 |
Real Estate |
7.8 |
Consumer Discretionary |
7.8 |
Consumer Staples |
8.1 |
Information Technology |
9.9 |
Materials |
13.7 |
Financials |
14.7 |
Industrials |
18.2 |
Value |
Value |
Jersey, Channel Islands |
0.7 |
Canada |
1.3 |
Israel |
1.5 |
United States |
93.0 | |
|
| Largest Holdings [Text Block] |
U.S. Foods Holding Corp. |
2.5 |
Alliant Energy Corp. |
2.4 |
Quest Diagnostics, Inc. |
2.0 |
Crown Holdings, Inc. |
2.0 |
Fidelity National Financial, Inc. |
1.9 |
Performance Food Group Co. |
1.9 |
Willis Towers Watson PLC |
1.8 |
Genpact Ltd. |
1.8 |
Expedia Group, Inc. |
1.8 |
American Water Works Co., Inc. |
1.8 | |
|
| Material Fund Change [Text Block] |
|
|
| Updated Prospectus Phone Number |
1-888-243-1956
|
|
| Updated Prospectus Web Address |
<span style="box-sizing: border-box; color: rgb(0, 0, 0); display: inline; flex-wrap: nowrap; font-size: 10.6667px; font-weight: 400; grid-area: auto; line-height: 16px; margin: 0px; overflow: visible; text-align: justify; text-align-last: left; white-space-collapse: preserve-breaks;">https://dfinview.com/BHFT</span>
|
|
| C000030589 |
|
|
| Shareholder Report [Line Items] |
|
|
| Fund Name |
Victory Sycamore Mid Cap Value Portfolio
|
|
| Class Name |
Class E
|
|
| No Trading Symbol [Flag] |
true
|
|
| Annual or Semi-Annual Statement [Text Block] |
This semi-annual shareholder report contains important information about the Victory Sycamore Mid Cap Value Portfolio (the "Portfolio") for the period of January 1, 2025 to June 30, 2025.
|
|
| Shareholder Report Annual or Semi-Annual |
Semi-Annual Shareholder Report
|
|
| Additional Information [Text Block] |
You can find additional information about the Portfolio at https://dfinview.com/BHFT. You can also request this information by contacting us at 1-888-243-1956.
|
|
| Additional Information Phone Number |
1-888-243-1956
|
|
| Additional Information Website |
<span style="box-sizing: border-box; color: rgb(0, 0, 0); display: inline; flex-wrap: nowrap; font-size: 12px; font-weight: 400; grid-area: auto; line-height: 18px; margin: 0px; overflow: visible; text-align: left; text-align-last: auto; white-space-collapse: preserve-breaks;">https://dfinview.com/BHFT</span>
|
|
| Expenses [Text Block] |
What were the Portfolio costs for last six months?This example shows the expenses you would have paid over the reporting period based on a hypothetical $10,000 investment.
Class Name |
Costs of a $10,000 investment |
Costs paid as a percentage of a $10,000 investment |
Class E |
$37 |
0.75%Footnote Reference* |
| Footnote |
Description |
Footnote* |
Annualized. | |
|
| Expenses Paid, Amount |
$ 37
|
|
| Expense Ratio, Percent |
0.75%
|
[90] |
| AssetsNet |
$ 861,435,198
|
|
| Holdings Count | Holding |
109
|
|
| Advisory Fees Paid, Amount |
$ 2,409,528
|
|
| InvestmentCompanyPortfolioTurnover |
27.00%
|
|
| Additional Fund Statistics [Text Block] |
- Total Net Assets$861,435,198
- # of Portfolio Investments109
- Portfolio Turnover Rate27%
- Total Advisory Fees Paid$2,409,528
|
|
| Holdings [Text Block] |
Value |
Value |
Energy |
5.0 |
Utilities |
5.1 |
Health Care |
5.9 |
Real Estate |
7.8 |
Consumer Discretionary |
7.8 |
Consumer Staples |
8.1 |
Information Technology |
9.9 |
Materials |
13.7 |
Financials |
14.7 |
Industrials |
18.2 |
Value |
Value |
Jersey, Channel Islands |
0.7 |
Canada |
1.3 |
Israel |
1.5 |
United States |
93.0 | |
|
| Largest Holdings [Text Block] |
U.S. Foods Holding Corp. |
2.5 |
Alliant Energy Corp. |
2.4 |
Quest Diagnostics, Inc. |
2.0 |
Crown Holdings, Inc. |
2.0 |
Fidelity National Financial, Inc. |
1.9 |
Performance Food Group Co. |
1.9 |
Willis Towers Watson PLC |
1.8 |
Genpact Ltd. |
1.8 |
Expedia Group, Inc. |
1.8 |
American Water Works Co., Inc. |
1.8 | |
|
| Material Fund Change [Text Block] |
|
|
| Updated Prospectus Phone Number |
1-888-243-1956
|
|
| Updated Prospectus Web Address |
<span style="box-sizing: border-box; color: rgb(0, 0, 0); display: inline; flex-wrap: nowrap; font-size: 10.6667px; font-weight: 400; grid-area: auto; line-height: 16px; margin: 0px; overflow: visible; text-align: justify; text-align-last: left; white-space-collapse: preserve-breaks;">https://dfinview.com/BHFT</span>
|
|
| C000100091 |
|
|
| Shareholder Report [Line Items] |
|
|
| Fund Name |
Western Asset Management Government Income Portfolio
|
|
| Class Name |
Class B
|
|
| No Trading Symbol [Flag] |
true
|
|
| Annual or Semi-Annual Statement [Text Block] |
This semi-annual shareholder report contains important information about the Western Asset Management Government Income Portfolio (the "Portfolio") for the period of January 1, 2025 to June 30, 2025.
|
|
| Shareholder Report Annual or Semi-Annual |
Semi-Annual Shareholder Report
|
|
| Additional Information [Text Block] |
You can find additional information about the Portfolio at https://dfinview.com/BHFT. You can also request this information by contacting us at 1-888-243-1956.
|
|
| Additional Information Phone Number |
1-888-243-1956
|
|
| Additional Information Website |
<span style="box-sizing: border-box; color: rgb(0, 0, 0); display: inline; flex-wrap: nowrap; font-size: 12px; font-weight: 400; grid-area: auto; line-height: 18px; margin: 0px; overflow: visible; text-align: left; text-align-last: auto; white-space-collapse: preserve-breaks;">https://dfinview.com/BHFT</span>
|
|
| Expenses [Text Block] |
What were the Portfolio costs for last six months?This example shows the expenses you would have paid over the reporting period based on a hypothetical $10,000 investment.
Class Name |
Costs of a $10,000 investment |
Costs paid as a percentage of a $10,000 investment |
Class B |
$37 |
0.73%Footnote Reference* |
| Footnote |
Description |
Footnote* |
Annualized. | |
|
| Expenses Paid, Amount |
$ 37
|
|
| Expense Ratio, Percent |
0.73%
|
[91] |
| AssetsNet |
$ 512,848,424
|
|
| Holdings Count | Holding |
806
|
|
| Advisory Fees Paid, Amount |
$ 1,054,443
|
|
| InvestmentCompanyPortfolioTurnover |
79.00%
|
|
| Additional Fund Statistics [Text Block] |
- Total Net Assets$512,848,424
- # of Portfolio Investments806
- Portfolio Turnover Rate79%
- Total Advisory Fees Paid$1,054,443
|
|
| Holdings [Text Block] |
Value |
Value |
Non-Agency Mortgage-Backed Securities |
1.5 |
Short-Term Investments |
2.9 |
Foreign Government |
6.7 |
Agency Sponsored Mortgage-Backed Securities |
46.1 |
U.S. Treasury & Government Agencies |
49.5 | |
|
| Largest Holdings [Text Block] |
Top 10 Fixed Income Issuers
Federal Home Loan Mortgage Corp. |
17.5 |
Federal National Mortgage Association |
14.6 |
Resolution Funding Corp. Principal STRIPS |
11.4 |
U.S. Treasury Bonds |
10.1 |
Federal Farm Credit Banks Funding Corp. |
7.2 |
Government National Mortgage Association |
5.3 |
Uniform Mortgage-Backed Security, TBA |
4.1 |
Tennessee Valley Authority Generic STRIPS |
3.1 |
U.S. Treasury Notes |
2.7 |
Federal Home Loan Mortgage Corp. STRIPS |
2.5 | |
|
| Updated Prospectus Phone Number |
1-888-243-1956
|
|
| Updated Prospectus Web Address |
<span style="box-sizing: border-box; color: rgb(0, 0, 0); display: inline; flex-wrap: nowrap; font-size: 10.6667px; font-weight: 400; grid-area: auto; line-height: 16px; margin: 0px; overflow: visible; text-align: justify; text-align-last: left; white-space-collapse: preserve-breaks;">https://dfinview.com/BHFT</span>
|
|
|
|