Shareholder Report
|
12 Months Ended |
|
Jun. 30, 2025
USD ($)
Holding
|
|---|
| Shareholder Report [Line Items] |
|
|
| Document Type |
N-CSR
|
|
| Amendment Flag |
false
|
|
| Registrant Name |
PIMCO Equity Series
|
|
| Entity Central Index Key |
0001479360
|
|
| Entity Investment Company Type |
N-1A
|
|
| Document Period End Date |
Jun. 30, 2025
|
|
| C000106728 |
|
|
| Shareholder Report [Line Items] |
|
|
| Fund Name |
PIMCO Dividend and Income Fund
|
|
| Class Name |
Class A
|
|
| Trading Symbol |
PQIZX
|
|
| Annual or Semi-Annual Statement [Text Block] |
This annual shareholder report contains important information about the PIMCO Dividend and Income Fund (the "Fund") for the period of July 1, 2024 to June 30, 2025 (the "reporting period").
|
|
| Shareholder Report Annual or Semi-Annual |
Annual Shareholder Report
|
|
| Additional Information [Text Block] |
You can find additional information about the Fund at www.pimco.com/literature. You can also request this information by contacting us at 888.87.PIMCO (888.877.4626).
|
|
| Material Fund Change Notice [Text Block] |
This report describes changes to the Fund that occurred during the reporting period.
|
|
| Additional Information Website |
www.pimco.com/literature
|
|
| Expenses [Text Block] |
What were the Fund costs for the reporting period?(based on a hypothetical $10,000 investment)
Class Name |
Cost of a $10,000 investment |
Costs paid as a percentage of a $10,000 investment |
Class A |
$136 |
1.27% | |
|
| Expenses Paid, Amount |
$ 136
|
|
| Expense Ratio, Percent |
1.27%
|
|
| Factors Affecting Performance [Text Block] |
How did the Fund perform during the reporting period and what affected its performance?The following affected performance (on a gross basis) during the reporting period: Long exposure to U.S. equities contributed to performance, as U.S. equities had positive returns during the reporting period. Exposure to the cash interest rate in the U.S. contributed to performance, as the currency outperformed the relevant yield differentials during the reporting period. Long exposure to eurozone equities contributed to performance, as eurozone equities had positive returns during the reporting period. Long exposure to agency mortgage-backed securities, particularly 30-year fixed rate securities, detracted from performance, as U.S. 30-year Treasury yields rose during the reporting period. Long exposure to Taiwanese equities detracted from performance, as Taiwanese equities had negative returns during the reporting period. U.K. duration and curve positioning, particularly long exposure to the 12-year and 15-year portions of the curve over most of the reporting period, detracted from performance, as these interest rates rose during the reporting period.
|
|
| Performance Past Does Not Indicate Future [Text] |
Performance quoted represents past performance. Past performance is not a guarantee or a reliable indicator of future results.
|
|
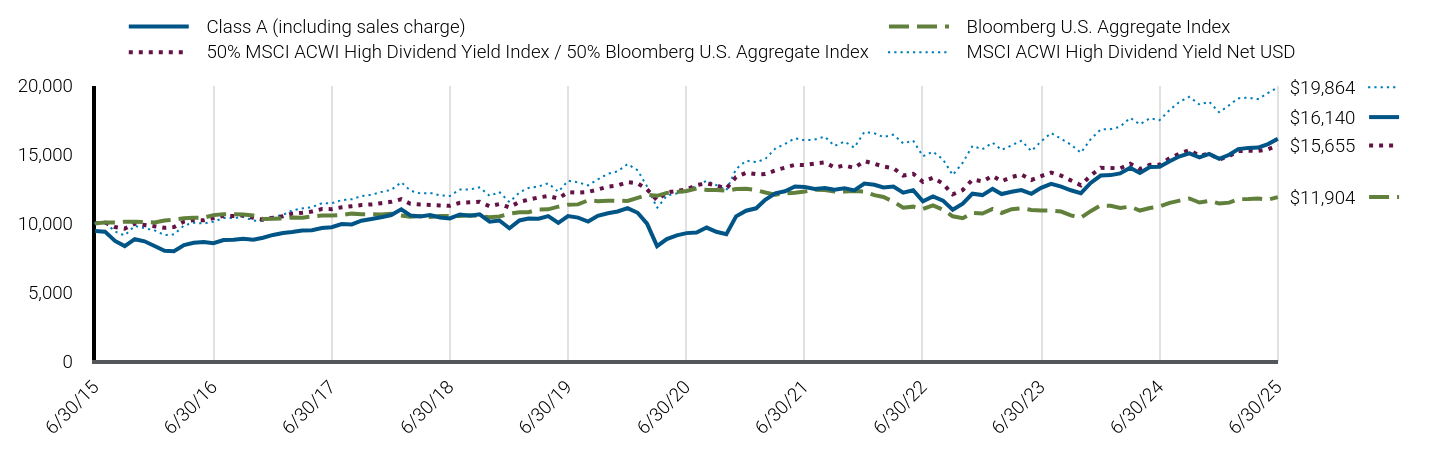
| Line Graph [Table Text Block] |
|
Class A (including sales charge) |
Bloomberg U.S. Aggregate Index |
50% MSCI ACWI High Dividend Yield Index / 50% Bloomberg U.S. Aggregate Index |
MSCI ACWI High Dividend Yield Net USD |
6/30/15 |
$9,447 |
$10,000 |
$10,000 |
$10,000 |
7/31/15 |
$9,402 |
$10,070 |
$10,068 |
$10,066 |
8/31/15 |
$8,728 |
$10,055 |
$9,732 |
$9,409 |
9/30/15 |
$8,355 |
$10,123 |
$9,619 |
$9,127 |
10/31/15 |
$8,854 |
$10,125 |
$9,984 |
$9,818 |
11/30/15 |
$8,701 |
$10,098 |
$9,885 |
$9,650 |
12/31/15 |
$8,363 |
$10,065 |
$9,793 |
$9,500 |
1/31/16 |
$8,014 |
$10,204 |
$9,680 |
$9,151 |
2/29/16 |
$7,985 |
$10,276 |
$9,739 |
$9,198 |
3/31/16 |
$8,422 |
$10,371 |
$10,129 |
$9,850 |
4/30/16 |
$8,591 |
$10,410 |
$10,248 |
$10,043 |
5/31/16 |
$8,641 |
$10,413 |
$10,221 |
$9,988 |
6/30/16 |
$8,561 |
$10,600 |
$10,379 |
$10,118 |
7/31/16 |
$8,793 |
$10,667 |
$10,552 |
$10,390 |
8/31/16 |
$8,810 |
$10,655 |
$10,540 |
$10,379 |
9/30/16 |
$8,879 |
$10,649 |
$10,582 |
$10,468 |
10/31/16 |
$8,810 |
$10,567 |
$10,408 |
$10,203 |
11/30/16 |
$8,957 |
$10,317 |
$10,272 |
$10,178 |
12/31/16 |
$9,163 |
$10,332 |
$10,419 |
$10,455 |
1/31/17 |
$9,303 |
$10,352 |
$10,514 |
$10,624 |
2/28/17 |
$9,372 |
$10,422 |
$10,707 |
$10,943 |
3/31/17 |
$9,483 |
$10,416 |
$10,774 |
$11,086 |
4/30/17 |
$9,509 |
$10,497 |
$10,857 |
$11,172 |
5/31/17 |
$9,658 |
$10,577 |
$11,042 |
$11,466 |
6/30/17 |
$9,720 |
$10,567 |
$11,032 |
$11,458 |
7/31/17 |
$9,948 |
$10,612 |
$11,165 |
$11,685 |
8/31/17 |
$9,921 |
$10,707 |
$11,246 |
$11,750 |
9/30/17 |
$10,191 |
$10,656 |
$11,331 |
$11,982 |
10/31/17 |
$10,315 |
$10,663 |
$11,376 |
$12,072 |
11/30/17 |
$10,438 |
$10,649 |
$11,465 |
$12,275 |
12/31/17 |
$10,605 |
$10,698 |
$11,562 |
$12,427 |
1/31/18 |
$11,025 |
$10,575 |
$11,754 |
$12,982 |
2/28/18 |
$10,578 |
$10,474 |
$11,424 |
$12,376 |
3/31/18 |
$10,494 |
$10,542 |
$11,368 |
$12,169 |
4/30/18 |
$10,610 |
$10,463 |
$11,341 |
$12,209 |
5/31/18 |
$10,432 |
$10,538 |
$11,299 |
$12,031 |
6/30/18 |
$10,361 |
$10,525 |
$11,272 |
$11,988 |
7/31/18 |
$10,648 |
$10,527 |
$11,495 |
$12,459 |
8/31/18 |
$10,550 |
$10,595 |
$11,530 |
$12,455 |
9/30/18 |
$10,653 |
$10,527 |
$11,564 |
$12,609 |
10/31/18 |
$10,128 |
$10,444 |
$11,237 |
$11,996 |
11/30/18 |
$10,209 |
$10,506 |
$11,400 |
$12,273 |
12/31/18 |
$9,646 |
$10,699 |
$11,166 |
$11,543 |
1/31/19 |
$10,210 |
$10,813 |
$11,566 |
$12,246 |
2/28/19 |
$10,348 |
$10,806 |
$11,713 |
$12,566 |
3/31/19 |
$10,345 |
$11,014 |
$11,878 |
$12,678 |
4/30/19 |
$10,529 |
$11,017 |
$11,987 |
$12,907 |
5/31/19 |
$10,039 |
$11,212 |
$11,806 |
$12,289 |
6/30/19 |
$10,528 |
$11,353 |
$12,264 |
$13,087 |
7/31/19 |
$10,416 |
$11,378 |
$12,226 |
$12,978 |
8/31/19 |
$10,135 |
$11,673 |
$12,279 |
$12,754 |
9/30/19 |
$10,547 |
$11,611 |
$12,457 |
$13,192 |
10/31/19 |
$10,734 |
$11,646 |
$12,667 |
$13,598 |
11/30/19 |
$10,866 |
$11,640 |
$12,745 |
$13,772 |
12/31/19 |
$11,105 |
$11,632 |
$12,985 |
$14,300 |
1/31/20 |
$10,770 |
$11,855 |
$12,905 |
$13,849 |
2/29/20 |
$9,986 |
$12,069 |
$12,477 |
$12,681 |
3/31/20 |
$8,350 |
$11,998 |
$11,674 |
$11,124 |
4/30/20 |
$8,857 |
$12,211 |
$12,243 |
$12,010 |
5/31/20 |
$9,135 |
$12,268 |
$12,357 |
$12,177 |
6/30/20 |
$9,294 |
$12,345 |
$12,468 |
$12,320 |
7/31/20 |
$9,342 |
$12,530 |
$12,778 |
$12,748 |
8/31/20 |
$9,697 |
$12,428 |
$12,900 |
$13,093 |
9/30/20 |
$9,392 |
$12,422 |
$12,742 |
$12,781 |
10/31/20 |
$9,209 |
$12,366 |
$12,527 |
$12,406 |
11/30/20 |
$10,509 |
$12,488 |
$13,361 |
$13,937 |
12/31/20 |
$10,916 |
$12,505 |
$13,663 |
$14,547 |
1/31/21 |
$11,093 |
$12,415 |
$13,565 |
$14,444 |
2/28/21 |
$11,711 |
$12,236 |
$13,572 |
$14,667 |
3/31/21 |
$12,177 |
$12,083 |
$13,837 |
$15,422 |
4/30/21 |
$12,324 |
$12,178 |
$14,043 |
$15,759 |
5/31/21 |
$12,679 |
$12,218 |
$14,251 |
$16,171 |
6/30/21 |
$12,630 |
$12,304 |
$14,232 |
$16,019 |
7/31/21 |
$12,501 |
$12,442 |
$14,339 |
$16,081 |
8/31/21 |
$12,560 |
$12,418 |
$14,420 |
$16,293 |
9/30/21 |
$12,444 |
$12,310 |
$14,058 |
$15,615 |
10/31/21 |
$12,554 |
$12,307 |
$14,199 |
$15,932 |
11/30/21 |
$12,394 |
$12,343 |
$14,023 |
$15,491 |
12/31/21 |
$12,890 |
$12,312 |
$14,518 |
$16,625 |
1/31/22 |
$12,798 |
$12,047 |
$14,323 |
$16,536 |
2/28/22 |
$12,605 |
$11,912 |
$14,122 |
$16,257 |
3/31/22 |
$12,670 |
$11,581 |
$14,003 |
$16,435 |
4/30/22 |
$12,231 |
$11,142 |
$13,467 |
$15,800 |
5/31/22 |
$12,405 |
$11,214 |
$13,594 |
$15,996 |
6/30/22 |
$11,599 |
$11,038 |
$13,010 |
$14,873 |
7/31/22 |
$11,958 |
$11,307 |
$13,313 |
$15,202 |
8/31/22 |
$11,651 |
$10,988 |
$12,879 |
$14,639 |
9/30/22 |
$10,984 |
$10,513 |
$12,102 |
$13,505 |
10/31/22 |
$11,428 |
$10,377 |
$12,423 |
$14,397 |
11/30/22 |
$12,152 |
$10,759 |
$13,176 |
$15,612 |
12/31/22 |
$12,051 |
$10,710 |
$13,047 |
$15,379 |
1/31/23 |
$12,501 |
$11,040 |
$13,449 |
$15,852 |
2/28/23 |
$12,126 |
$10,754 |
$13,053 |
$15,328 |
3/31/23 |
$12,298 |
$11,027 |
$13,358 |
$15,656 |
4/30/23 |
$12,417 |
$11,094 |
$13,542 |
$15,992 |
5/31/23 |
$12,147 |
$10,973 |
$13,151 |
$15,243 |
6/30/23 |
$12,582 |
$10,934 |
$13,432 |
$15,948 |
7/31/23 |
$12,865 |
$10,927 |
$13,683 |
$16,555 |
8/31/23 |
$12,669 |
$10,857 |
$13,462 |
$16,127 |
9/30/23 |
$12,401 |
$10,581 |
$13,118 |
$15,713 |
10/31/23 |
$12,192 |
$10,414 |
$12,767 |
$15,121 |
11/30/23 |
$12,929 |
$10,886 |
$13,472 |
$16,105 |
12/31/23 |
$13,467 |
$11,302 |
$14,026 |
$16,812 |
1/31/24 |
$13,501 |
$11,271 |
$14,019 |
$16,842 |
2/29/24 |
$13,624 |
$11,112 |
$13,989 |
$17,008 |
3/31/24 |
$14,030 |
$11,215 |
$14,322 |
$17,653 |
4/30/24 |
$13,656 |
$10,931 |
$13,948 |
$17,183 |
5/31/24 |
$14,087 |
$11,117 |
$14,246 |
$17,627 |
6/30/24 |
$14,099 |
$11,222 |
$14,257 |
$17,488 |
7/31/24 |
$14,511 |
$11,484 |
$14,725 |
$18,226 |
8/31/24 |
$14,866 |
$11,649 |
$15,073 |
$18,828 |
9/30/24 |
$15,083 |
$11,805 |
$15,315 |
$19,179 |
10/31/24 |
$14,783 |
$11,512 |
$14,901 |
$18,617 |
11/30/24 |
$15,036 |
$11,634 |
$15,061 |
$18,822 |
12/31/24 |
$14,680 |
$11,444 |
$14,629 |
$18,050 |
1/31/25 |
$14,974 |
$11,504 |
$14,880 |
$18,572 |
2/28/25 |
$15,386 |
$11,757 |
$15,244 |
$19,073 |
3/31/25 |
$15,474 |
$11,762 |
$15,264 |
$19,116 |
4/30/25 |
$15,498 |
$11,808 |
$15,252 |
$19,012 |
5/31/25 |
$15,748 |
$11,723 |
$15,377 |
$19,459 |
6/30/25 |
$16,140 |
$11,904 |
$15,655 |
$19,864 |
|
|
| Average Annual Return [Table Text Block] |
Class/Index Name |
1 Year |
5 Years |
10 Years |
Class A (excluding sales charge) |
14.47% |
11.67% |
5.50% |
Class A (including sales charge) |
8.15% |
10.42% |
4.90% |
Bloomberg U.S. Aggregate Index |
6.08% |
(0.73%) |
1.76% |
50% MSCI ACWI High Dividend Yield Index / 50% Bloomberg U.S. Aggregate Index |
9.81% |
4.66% |
4.58% |
MSCI ACWI High Dividend Yield Net USD |
13.58% |
10.02% |
7.10% | |
|
| No Deduction of Taxes [Text Block] |
Returns shown do not reflect the deduction of taxes that a shareholder would pay on Fund distributions or the redemption of Fund shares.
|
|
| Performance Table Market Index Changed [Text Block] |
Differences in the Fund’s performance versus an index and related attribution information with respect to particular categories of securities or individual positions may be attributable, in part, to differences in the pricing methodologies used by the Fund and the index.
|
|
| Updated Performance Information Location [Text Block] |
For performance current to the most recent month-end, visit www.pimco.com/literature or via 888.87.PIMCO (888.877.4626).
|
|
| AssetsNet |
$ 197,166,000
|
|
| Holdings Count | Holding |
1,206
|
|
| Advisory Fees Paid, Amount |
$ 795,000
|
|
| InvestmentCompanyPortfolioTurnover |
436.00%
|
|
| Additional Fund Statistics [Text Block] |
Key Fund StatisticsFootnote Reference† (as of the end of the reporting period)
Total Net Assets |
$197,166 |
# of Portfolio Holdings |
1,206 |
Portfolio Turnover Rate |
436% |
Total Net Advisory Fees Paid During the Reporting Period |
$795 |
| Footnote |
Description |
Footnote† |
Dollar amounts displayed in 000's | |
|
| Holdings [Text Block] |
Security Type Breakdown (% of Net Asset Value)Footnote Reference*
Common Stocks |
45.9% |
U.S. Government Agencies |
28.0% |
Asset-Backed Securities |
14.1% |
Non-Agency Mortgage-Backed Securities |
10.5% |
U.S. Treasury Obligations |
10.5% |
Corporate Bonds & Notes |
5.4% |
Real Estate Investment Trusts |
5.0% |
Sovereign Issues |
3.5% |
Loan Participations and Assignments |
0.6% |
Preferred Stocks |
0.4% |
Other Investments |
0.2% |
Short-Term Instruments |
0.5% |
Affiliated Investments |
2.3% |
Financial Derivative Instruments |
(0.2%) |
Other Assets and Liabilities, Net |
(26.7%) |
Total |
100.0% |
| Footnote |
Description |
Footnote* |
% of Net Asset Value includes derivatives instruments, if any, valued at the value used for determining the Fund's net asset value. The notional exposure of such derivatives investments therefore may be greater than what is depicted. | |
|
| Material Fund Change [Text Block] |
This is a summary of certain changes and planned changes of the Fund since the beginning of the reporting period. For more information, you may refer to the Fund's next prospectus, which we expect to be available by October 31, 2025 or upon request at 888.87.PIMCO (888.877.4626). Changes to Total Annual Fund Operating Expenses. Annual fund operating expenses increased during the year by 0.10% as a result of higher expenses related to interest. |
|
| Material Fund Change Expenses [Text Block] |
Changes to Total Annual Fund Operating Expenses. Annual fund operating expenses increased during the year by 0.10% as a result of higher expenses related to interest.
|
|
| Summary of Change Legend [Text Block] |
This is a summary of certain changes and planned changes of the Fund since the beginning of the reporting period. For more information, you may refer to the Fund's next prospectus, which we expect to be available by October 31, 2025 or upon request at 888.87.PIMCO (888.877.4626).
|
|
| C000106729 |
|
|
| Shareholder Report [Line Items] |
|
|
| Fund Name |
PIMCO Dividend and Income Fund
|
|
| Class Name |
Class C
|
|
| Trading Symbol |
PQICX
|
|
| Annual or Semi-Annual Statement [Text Block] |
This annual shareholder report contains important information about the PIMCO Dividend and Income Fund (the "Fund") for the period of July 1, 2024 to June 30, 2025 (the "reporting period").
|
|
| Shareholder Report Annual or Semi-Annual |
Annual Shareholder Report
|
|
| Additional Information [Text Block] |
You can find additional information about the Fund at www.pimco.com/literature. You can also request this information by contacting us at 888.87.PIMCO (888.877.4626).
|
|
| Material Fund Change Notice [Text Block] |
This report describes changes to the Fund that occurred during the reporting period.
|
|
| Additional Information Website |
www.pimco.com/literature
|
|
| Expenses [Text Block] |
What were the Fund costs for the reporting period?(based on a hypothetical $10,000 investment)
Class Name |
Cost of a $10,000 investment |
Costs paid as a percentage of a $10,000 investment |
Class C |
$216 |
2.02% | |
|
| Expenses Paid, Amount |
$ 216
|
|
| Expense Ratio, Percent |
2.02%
|
|
| Factors Affecting Performance [Text Block] |
How did the Fund perform during the reporting period and what affected its performance?The following affected performance (on a gross basis) during the reporting period: Long exposure to U.S. equities contributed to performance, as U.S. equities had positive returns during the reporting period. Exposure to the cash interest rate in the U.S. contributed to performance, as the currency outperformed the relevant yield differentials during the reporting period. Long exposure to eurozone equities contributed to performance, as eurozone equities had positive returns during the reporting period. Long exposure to agency mortgage-backed securities, particularly 30-year fixed rate securities, detracted from performance, as U.S. 30-year Treasury yields rose during the reporting period. Long exposure to Taiwanese equities detracted from performance, as Taiwanese equities had negative returns during the reporting period. U.K. duration and curve positioning, particularly long exposure to the 12-year and 15-year portions of the curve over most of the reporting period, detracted from performance, as these interest rates rose during the reporting period.
|
|
| Performance Past Does Not Indicate Future [Text] |
Performance quoted represents past performance. Past performance is not a guarantee or a reliable indicator of future results.
|
|
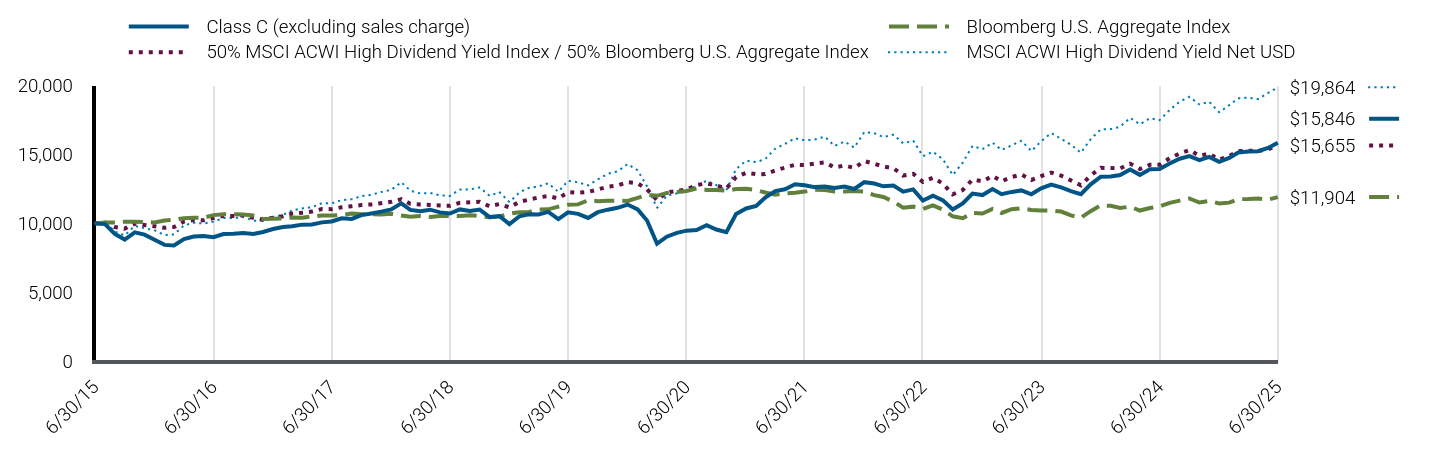
| Line Graph [Table Text Block] |
|
Class C (excluding sales charge) |
Bloomberg U.S. Aggregate Index |
50% MSCI ACWI High Dividend Yield Index / 50% Bloomberg U.S. Aggregate Index |
MSCI ACWI High Dividend Yield Net USD |
6/30/15 |
$10,000 |
$10,000 |
$10,000 |
$10,000 |
7/31/15 |
$9,946 |
$10,070 |
$10,068 |
$10,066 |
8/31/15 |
$9,226 |
$10,055 |
$9,732 |
$9,409 |
9/30/15 |
$8,824 |
$10,123 |
$9,619 |
$9,127 |
10/31/15 |
$9,346 |
$10,125 |
$9,984 |
$9,818 |
11/30/15 |
$9,187 |
$10,098 |
$9,885 |
$9,650 |
12/31/15 |
$8,815 |
$10,065 |
$9,793 |
$9,500 |
1/31/16 |
$8,440 |
$10,204 |
$9,680 |
$9,151 |
2/29/16 |
$8,405 |
$10,276 |
$9,739 |
$9,198 |
3/31/16 |
$8,860 |
$10,371 |
$10,129 |
$9,850 |
4/30/16 |
$9,041 |
$10,410 |
$10,248 |
$10,043 |
5/31/16 |
$9,080 |
$10,413 |
$10,221 |
$9,988 |
6/30/16 |
$8,993 |
$10,600 |
$10,379 |
$10,118 |
7/31/16 |
$9,228 |
$10,667 |
$10,552 |
$10,390 |
8/31/16 |
$9,247 |
$10,655 |
$10,540 |
$10,379 |
9/30/16 |
$9,310 |
$10,649 |
$10,582 |
$10,468 |
10/31/16 |
$9,238 |
$10,567 |
$10,408 |
$10,203 |
11/30/16 |
$9,373 |
$10,317 |
$10,272 |
$10,178 |
12/31/16 |
$9,589 |
$10,332 |
$10,419 |
$10,455 |
1/31/17 |
$9,735 |
$10,352 |
$10,514 |
$10,624 |
2/28/17 |
$9,799 |
$10,422 |
$10,707 |
$10,943 |
3/31/17 |
$9,909 |
$10,416 |
$10,774 |
$11,086 |
4/30/17 |
$9,927 |
$10,497 |
$10,857 |
$11,172 |
5/31/17 |
$10,074 |
$10,577 |
$11,042 |
$11,466 |
6/30/17 |
$10,135 |
$10,567 |
$11,032 |
$11,458 |
7/31/17 |
$10,364 |
$10,612 |
$11,165 |
$11,685 |
8/31/17 |
$10,327 |
$10,707 |
$11,246 |
$11,750 |
9/30/17 |
$10,602 |
$10,656 |
$11,331 |
$11,982 |
10/31/17 |
$10,722 |
$10,663 |
$11,376 |
$12,072 |
11/30/17 |
$10,851 |
$10,649 |
$11,465 |
$12,275 |
12/31/17 |
$11,012 |
$10,698 |
$11,562 |
$12,427 |
1/31/18 |
$11,449 |
$10,575 |
$11,754 |
$12,982 |
2/28/18 |
$10,975 |
$10,474 |
$11,424 |
$12,376 |
3/31/18 |
$10,882 |
$10,542 |
$11,368 |
$12,169 |
4/30/18 |
$10,993 |
$10,463 |
$11,341 |
$12,209 |
5/31/18 |
$10,798 |
$10,538 |
$11,299 |
$12,031 |
6/30/18 |
$10,715 |
$10,525 |
$11,272 |
$11,988 |
7/31/18 |
$11,014 |
$10,527 |
$11,495 |
$12,459 |
8/31/18 |
$10,902 |
$10,595 |
$11,530 |
$12,455 |
9/30/18 |
$11,002 |
$10,527 |
$11,564 |
$12,609 |
10/31/18 |
$10,458 |
$10,444 |
$11,237 |
$11,996 |
11/30/18 |
$10,533 |
$10,506 |
$11,400 |
$12,273 |
12/31/18 |
$9,943 |
$10,699 |
$11,166 |
$11,543 |
1/31/19 |
$10,516 |
$10,813 |
$11,566 |
$12,246 |
2/28/19 |
$10,660 |
$10,806 |
$11,713 |
$12,566 |
3/31/19 |
$10,641 |
$11,014 |
$11,878 |
$12,678 |
4/30/19 |
$10,832 |
$11,017 |
$11,987 |
$12,907 |
5/31/19 |
$10,316 |
$11,212 |
$11,806 |
$12,289 |
6/30/19 |
$10,808 |
$11,353 |
$12,264 |
$13,087 |
7/31/19 |
$10,693 |
$11,378 |
$12,226 |
$12,978 |
8/31/19 |
$10,397 |
$11,673 |
$12,279 |
$12,754 |
9/30/19 |
$10,812 |
$11,611 |
$12,457 |
$13,192 |
10/31/19 |
$10,995 |
$11,646 |
$12,667 |
$13,598 |
11/30/19 |
$11,129 |
$11,640 |
$12,745 |
$13,772 |
12/31/19 |
$11,367 |
$11,632 |
$12,985 |
$14,300 |
1/31/20 |
$11,015 |
$11,855 |
$12,905 |
$13,849 |
2/29/20 |
$10,205 |
$12,069 |
$12,477 |
$12,681 |
3/31/20 |
$8,525 |
$11,998 |
$11,674 |
$11,124 |
4/30/20 |
$9,033 |
$12,211 |
$12,243 |
$12,010 |
5/31/20 |
$9,316 |
$12,268 |
$12,357 |
$12,177 |
6/30/20 |
$9,472 |
$12,345 |
$12,468 |
$12,320 |
7/31/20 |
$9,521 |
$12,530 |
$12,778 |
$12,748 |
8/31/20 |
$9,863 |
$12,428 |
$12,900 |
$13,093 |
9/30/20 |
$9,556 |
$12,422 |
$12,742 |
$12,781 |
10/31/20 |
$9,361 |
$12,366 |
$12,527 |
$12,406 |
11/30/20 |
$10,682 |
$12,488 |
$13,361 |
$13,937 |
12/31/20 |
$11,082 |
$12,505 |
$13,663 |
$14,547 |
1/31/21 |
$11,261 |
$12,415 |
$13,565 |
$14,444 |
2/28/21 |
$11,879 |
$12,236 |
$13,572 |
$14,667 |
3/31/21 |
$12,337 |
$12,083 |
$13,837 |
$15,422 |
4/30/21 |
$12,477 |
$12,178 |
$14,043 |
$15,759 |
5/31/21 |
$12,836 |
$12,218 |
$14,251 |
$16,171 |
6/30/21 |
$12,771 |
$12,304 |
$14,232 |
$16,019 |
7/31/21 |
$12,630 |
$12,442 |
$14,339 |
$16,081 |
8/31/21 |
$12,680 |
$12,418 |
$14,420 |
$16,293 |
9/30/21 |
$12,566 |
$12,310 |
$14,058 |
$15,615 |
10/31/21 |
$12,667 |
$12,307 |
$14,199 |
$15,932 |
11/30/21 |
$12,495 |
$12,343 |
$14,023 |
$15,491 |
12/31/21 |
$12,987 |
$12,312 |
$14,518 |
$16,625 |
1/31/22 |
$12,894 |
$12,047 |
$14,323 |
$16,536 |
2/28/22 |
$12,689 |
$11,912 |
$14,122 |
$16,257 |
3/31/22 |
$12,741 |
$11,581 |
$14,003 |
$16,435 |
4/30/22 |
$12,299 |
$11,142 |
$13,467 |
$15,800 |
5/31/22 |
$12,464 |
$11,214 |
$13,594 |
$15,996 |
6/30/22 |
$11,651 |
$11,038 |
$13,010 |
$14,873 |
7/31/22 |
$12,001 |
$11,307 |
$13,313 |
$15,202 |
8/31/22 |
$11,672 |
$10,988 |
$12,879 |
$14,639 |
9/30/22 |
$11,008 |
$10,513 |
$12,102 |
$13,505 |
10/31/22 |
$11,444 |
$10,377 |
$12,423 |
$14,397 |
11/30/22 |
$12,160 |
$10,759 |
$13,176 |
$15,612 |
12/31/22 |
$12,052 |
$10,710 |
$13,047 |
$15,379 |
1/31/23 |
$12,493 |
$11,040 |
$13,449 |
$15,852 |
2/28/23 |
$12,117 |
$10,754 |
$13,053 |
$15,328 |
3/31/23 |
$12,282 |
$11,027 |
$13,358 |
$15,656 |
4/30/23 |
$12,390 |
$11,094 |
$13,542 |
$15,992 |
5/31/23 |
$12,109 |
$10,973 |
$13,151 |
$15,243 |
6/30/23 |
$12,540 |
$10,934 |
$13,432 |
$15,948 |
7/31/23 |
$12,812 |
$10,927 |
$13,683 |
$16,555 |
8/31/23 |
$12,606 |
$10,857 |
$13,462 |
$16,127 |
9/30/23 |
$12,332 |
$10,581 |
$13,118 |
$15,713 |
10/31/23 |
$12,112 |
$10,414 |
$12,767 |
$15,121 |
11/30/23 |
$12,836 |
$10,886 |
$13,472 |
$16,105 |
12/31/23 |
$13,375 |
$11,302 |
$14,026 |
$16,812 |
1/31/24 |
$13,397 |
$11,271 |
$14,019 |
$16,842 |
2/29/24 |
$13,509 |
$11,112 |
$13,989 |
$17,008 |
3/31/24 |
$13,900 |
$11,215 |
$14,322 |
$17,653 |
4/30/24 |
$13,518 |
$10,931 |
$13,948 |
$17,183 |
5/31/24 |
$13,933 |
$11,117 |
$14,246 |
$17,627 |
6/30/24 |
$13,939 |
$11,222 |
$14,257 |
$17,488 |
7/31/24 |
$14,347 |
$11,484 |
$14,725 |
$18,226 |
8/31/24 |
$14,687 |
$11,649 |
$15,073 |
$18,828 |
9/30/24 |
$14,879 |
$11,805 |
$15,315 |
$19,179 |
10/31/24 |
$14,583 |
$11,512 |
$14,901 |
$18,617 |
11/30/24 |
$14,822 |
$11,634 |
$15,061 |
$18,822 |
12/31/24 |
$14,460 |
$11,444 |
$14,629 |
$18,050 |
1/31/25 |
$14,751 |
$11,504 |
$14,880 |
$18,572 |
2/28/25 |
$15,145 |
$11,757 |
$15,244 |
$19,073 |
3/31/25 |
$15,219 |
$11,762 |
$15,264 |
$19,116 |
4/30/25 |
$15,231 |
$11,808 |
$15,252 |
$19,012 |
5/31/25 |
$15,465 |
$11,723 |
$15,377 |
$19,459 |
6/30/25 |
$15,846 |
$11,904 |
$15,655 |
$19,864 |
|
|
| Average Annual Return [Table Text Block] |
Class/Index Name |
1 Year |
5 Years |
10 Years |
Class C (excluding sales charge) |
13.68% |
10.84% |
4.71% |
Class C (including sales charge) |
12.68% |
10.84% |
4.71% |
Bloomberg U.S. Aggregate Index |
6.08% |
(0.73%) |
1.76% |
50% MSCI ACWI High Dividend Yield Index / 50% Bloomberg U.S. Aggregate Index |
9.81% |
4.66% |
4.58% |
MSCI ACWI High Dividend Yield Net USD |
13.58% |
10.02% |
7.10% | |
|
| No Deduction of Taxes [Text Block] |
Returns shown do not reflect the deduction of taxes that a shareholder would pay on Fund distributions or the redemption of Fund shares.
|
|
| Performance Table Market Index Changed [Text Block] |
Differences in the Fund’s performance versus an index and related attribution information with respect to particular categories of securities or individual positions may be attributable, in part, to differences in the pricing methodologies used by the Fund and the index.
|
|
| Updated Performance Information Location [Text Block] |
For performance current to the most recent month-end, visit www.pimco.com/literature or via 888.87.PIMCO (888.877.4626).
|
|
| AssetsNet |
$ 197,166,000
|
|
| Holdings Count | Holding |
1,206
|
|
| Advisory Fees Paid, Amount |
$ 795,000
|
|
| InvestmentCompanyPortfolioTurnover |
436.00%
|
|
| Additional Fund Statistics [Text Block] |
Key Fund StatisticsFootnote Reference† (as of the end of the reporting period)
Total Net Assets |
$197,166 |
# of Portfolio Holdings |
1,206 |
Portfolio Turnover Rate |
436% |
Total Net Advisory Fees Paid During the Reporting Period |
$795 |
| Footnote |
Description |
Footnote† |
Dollar amounts displayed in 000's | |
|
| Holdings [Text Block] |
Security Type Breakdown (% of Net Asset Value)Footnote Reference*
Common Stocks |
45.9% |
U.S. Government Agencies |
28.0% |
Asset-Backed Securities |
14.1% |
Non-Agency Mortgage-Backed Securities |
10.5% |
U.S. Treasury Obligations |
10.5% |
Corporate Bonds & Notes |
5.4% |
Real Estate Investment Trusts |
5.0% |
Sovereign Issues |
3.5% |
Loan Participations and Assignments |
0.6% |
Preferred Stocks |
0.4% |
Other Investments |
0.2% |
Short-Term Instruments |
0.5% |
Affiliated Investments |
2.3% |
Financial Derivative Instruments |
(0.2%) |
Other Assets and Liabilities, Net |
(26.7%) |
Total |
100.0% |
| Footnote |
Description |
Footnote* |
% of Net Asset Value includes derivatives instruments, if any, valued at the value used for determining the Fund's net asset value. The notional exposure of such derivatives investments therefore may be greater than what is depicted. | |
|
| Material Fund Change [Text Block] |
This is a summary of certain changes and planned changes of the Fund since the beginning of the reporting period. For more information, you may refer to the Fund's next prospectus, which we expect to be available by October 31, 2025 or upon request at 888.87.PIMCO (888.877.4626). Changes to Total Annual Fund Operating Expenses. Annual fund operating expenses increased during the year by 0.10% as a result of higher expenses related to interest. |
|
| Material Fund Change Expenses [Text Block] |
Changes to Total Annual Fund Operating Expenses. Annual fund operating expenses increased during the year by 0.10% as a result of higher expenses related to interest.
|
|
| Summary of Change Legend [Text Block] |
This is a summary of certain changes and planned changes of the Fund since the beginning of the reporting period. For more information, you may refer to the Fund's next prospectus, which we expect to be available by October 31, 2025 or upon request at 888.87.PIMCO (888.877.4626).
|
|
| C000106724 |
|
|
| Shareholder Report [Line Items] |
|
|
| Fund Name |
PIMCO Dividend and Income Fund
|
|
| Class Name |
Institutional Class
|
|
| Trading Symbol |
PQIIX
|
|
| Annual or Semi-Annual Statement [Text Block] |
This annual shareholder report contains important information about the PIMCO Dividend and Income Fund (the "Fund") for the period of July 1, 2024 to June 30, 2025 (the "reporting period").
|
|
| Shareholder Report Annual or Semi-Annual |
Annual Shareholder Report
|
|
| Additional Information [Text Block] |
You can find additional information about the Fund at www.pimco.com/literature. You can also request this information by contacting us at 888.87.PIMCO (888.877.4626).
|
|
| Material Fund Change Notice [Text Block] |
This report describes changes to the Fund that occurred during the reporting period.
|
|
| Additional Information Website |
www.pimco.com/literature
|
|
| Expenses [Text Block] |
What were the Fund costs for the reporting period?(based on a hypothetical $10,000 investment)
Class Name |
Cost of a $10,000 investment |
Costs paid as a percentage of a $10,000 investment |
Institutional Class |
$99 |
0.92% | |
|
| Expenses Paid, Amount |
$ 99
|
|
| Expense Ratio, Percent |
0.92%
|
|
| Factors Affecting Performance [Text Block] |
How did the Fund perform during the reporting period and what affected its performance?The following affected performance (on a gross basis) during the reporting period: Long exposure to U.S. equities contributed to performance, as U.S. equities had positive returns during the reporting period. Exposure to the cash interest rate in the U.S. contributed to performance, as the currency outperformed the relevant yield differentials during the reporting period. Long exposure to eurozone equities contributed to performance, as eurozone equities had positive returns during the reporting period. Long exposure to agency mortgage-backed securities, particularly 30-year fixed rate securities, detracted from performance, as U.S. 30-year Treasury yields rose during the reporting period. Long exposure to Taiwanese equities detracted from performance, as Taiwanese equities had negative returns during the reporting period. U.K. duration and curve positioning, particularly long exposure to the 12-year and 15-year portions of the curve over most of the reporting period, detracted from performance, as these interest rates rose during the reporting period.
|
|
| Performance Past Does Not Indicate Future [Text] |
Performance quoted represents past performance. Past performance is not a guarantee or a reliable indicator of future results.
|
|
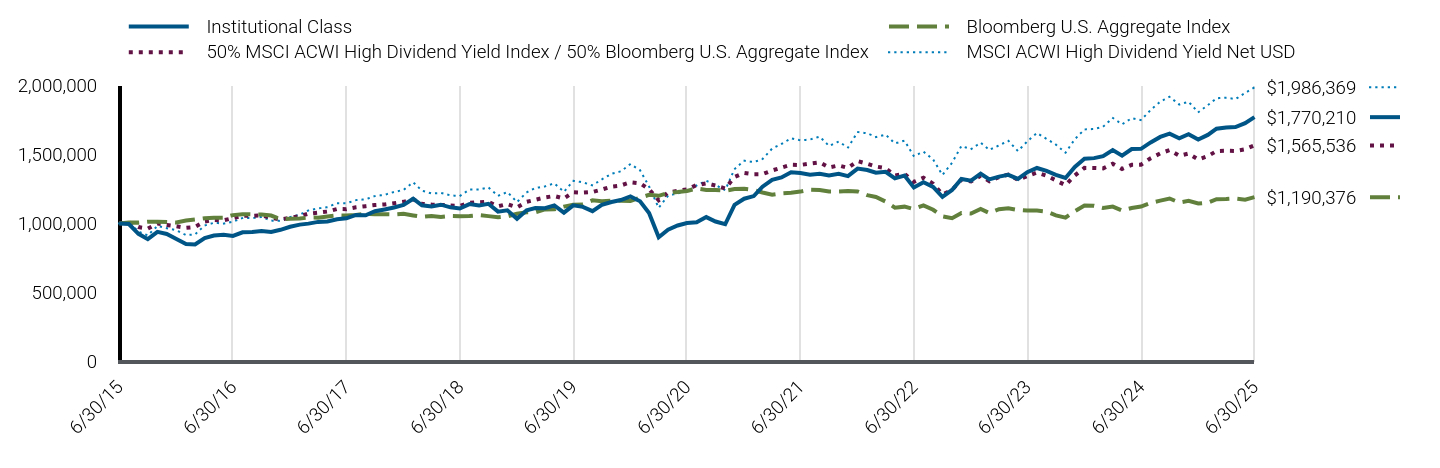
| Line Graph [Table Text Block] |
|
Institutional Class |
Bloomberg U.S. Aggregate Index |
50% MSCI ACWI High Dividend Yield Index / 50% Bloomberg U.S. Aggregate Index |
MSCI ACWI High Dividend Yield Net USD |
6/30/15 |
$1,000,000 |
$1,000,000 |
$1,000,000 |
$1,000,000 |
7/31/15 |
$995,563 |
$1,006,951 |
$1,006,756 |
$1,006,560 |
8/31/15 |
$924,555 |
$1,005,505 |
$973,220 |
$940,946 |
9/30/15 |
$885,357 |
$1,012,307 |
$961,886 |
$912,666 |
10/31/15 |
$938,492 |
$1,012,475 |
$998,417 |
$981,834 |
11/30/15 |
$923,313 |
$1,009,800 |
$988,542 |
$965,008 |
12/31/15 |
$886,717 |
$1,006,537 |
$979,282 |
$950,046 |
1/31/16 |
$850,232 |
$1,020,388 |
$967,982 |
$915,050 |
2/29/16 |
$847,442 |
$1,027,626 |
$973,918 |
$919,779 |
3/31/16 |
$894,003 |
$1,037,055 |
$1,012,903 |
$984,979 |
4/30/16 |
$912,210 |
$1,041,035 |
$1,024,786 |
$1,004,307 |
5/31/16 |
$917,835 |
$1,041,302 |
$1,022,103 |
$998,791 |
6/30/16 |
$909,432 |
$1,060,012 |
$1,037,940 |
$1,011,797 |
7/31/16 |
$935,050 |
$1,066,714 |
$1,055,160 |
$1,038,972 |
8/31/16 |
$937,794 |
$1,065,494 |
$1,054,028 |
$1,037,929 |
9/30/16 |
$945,114 |
$1,064,870 |
$1,058,216 |
$1,046,788 |
10/31/16 |
$937,794 |
$1,056,725 |
$1,040,767 |
$1,020,275 |
11/30/16 |
$953,348 |
$1,031,729 |
$1,027,191 |
$1,017,787 |
12/31/16 |
$975,165 |
$1,033,185 |
$1,041,903 |
$1,045,508 |
1/31/17 |
$990,923 |
$1,035,212 |
$1,051,350 |
$1,062,415 |
2/28/17 |
$998,339 |
$1,042,169 |
$1,070,681 |
$1,094,344 |
3/31/17 |
$1,010,781 |
$1,041,623 |
$1,077,362 |
$1,108,577 |
4/30/17 |
$1,013,573 |
$1,049,661 |
$1,085,718 |
$1,117,216 |
5/31/17 |
$1,030,326 |
$1,057,741 |
$1,104,155 |
$1,146,564 |
6/30/17 |
$1,036,875 |
$1,056,676 |
$1,103,235 |
$1,145,802 |
7/31/17 |
$1,061,184 |
$1,061,223 |
$1,116,522 |
$1,168,470 |
8/31/17 |
$1,058,379 |
$1,070,742 |
$1,124,623 |
$1,174,951 |
9/30/17 |
$1,087,874 |
$1,065,642 |
$1,133,078 |
$1,198,211 |
10/31/17 |
$1,101,049 |
$1,066,260 |
$1,137,634 |
$1,207,152 |
11/30/17 |
$1,115,165 |
$1,064,891 |
$1,146,489 |
$1,227,496 |
12/31/17 |
$1,133,147 |
$1,069,778 |
$1,156,225 |
$1,242,710 |
1/31/18 |
$1,178,931 |
$1,057,458 |
$1,175,376 |
$1,298,189 |
2/28/18 |
$1,131,239 |
$1,047,434 |
$1,142,360 |
$1,237,560 |
3/31/18 |
$1,122,201 |
$1,054,151 |
$1,136,830 |
$1,216,945 |
4/30/18 |
$1,135,561 |
$1,046,311 |
$1,134,138 |
$1,220,932 |
5/31/18 |
$1,116,476 |
$1,053,778 |
$1,129,880 |
$1,203,055 |
6/30/18 |
$1,108,268 |
$1,052,482 |
$1,127,177 |
$1,198,777 |
7/31/18 |
$1,139,960 |
$1,052,732 |
$1,149,455 |
$1,245,878 |
8/31/18 |
$1,130,356 |
$1,059,506 |
$1,152,973 |
$1,245,486 |
9/30/18 |
$1,142,141 |
$1,052,683 |
$1,156,412 |
$1,260,938 |
10/31/18 |
$1,085,034 |
$1,044,365 |
$1,123,736 |
$1,199,641 |
11/30/18 |
$1,094,713 |
$1,050,599 |
$1,140,038 |
$1,227,289 |
12/31/18 |
$1,033,612 |
$1,069,900 |
$1,116,592 |
$1,154,260 |
1/31/19 |
$1,094,936 |
$1,081,262 |
$1,156,565 |
$1,224,644 |
2/28/19 |
$1,110,761 |
$1,080,635 |
$1,171,330 |
$1,256,622 |
3/31/19 |
$1,110,551 |
$1,101,385 |
$1,187,806 |
$1,267,845 |
4/30/19 |
$1,130,347 |
$1,101,667 |
$1,198,661 |
$1,290,693 |
5/31/19 |
$1,077,888 |
$1,121,224 |
$1,180,598 |
$1,228,880 |
6/30/19 |
$1,131,074 |
$1,135,304 |
$1,226,369 |
$1,308,737 |
7/31/19 |
$1,120,034 |
$1,137,801 |
$1,222,612 |
$1,297,838 |
8/31/19 |
$1,088,922 |
$1,167,284 |
$1,227,876 |
$1,275,382 |
9/30/19 |
$1,133,796 |
$1,161,067 |
$1,245,704 |
$1,319,209 |
10/31/19 |
$1,154,979 |
$1,164,564 |
$1,266,740 |
$1,359,791 |
11/30/19 |
$1,169,102 |
$1,163,971 |
$1,274,513 |
$1,377,174 |
12/31/19 |
$1,195,094 |
$1,163,160 |
$1,298,511 |
$1,429,995 |
1/31/20 |
$1,160,096 |
$1,185,544 |
$1,290,545 |
$1,384,930 |
2/29/20 |
$1,075,688 |
$1,206,882 |
$1,247,728 |
$1,268,105 |
3/31/20 |
$899,158 |
$1,199,780 |
$1,167,435 |
$1,112,361 |
4/30/20 |
$953,809 |
$1,221,108 |
$1,224,345 |
$1,201,037 |
5/31/20 |
$984,743 |
$1,226,793 |
$1,235,699 |
$1,217,722 |
6/30/20 |
$1,002,337 |
$1,234,521 |
$1,246,843 |
$1,232,011 |
7/31/20 |
$1,007,498 |
$1,252,961 |
$1,277,812 |
$1,274,812 |
8/31/20 |
$1,045,693 |
$1,242,847 |
$1,289,953 |
$1,309,329 |
9/30/20 |
$1,013,483 |
$1,242,166 |
$1,274,227 |
$1,278,120 |
10/31/20 |
$993,774 |
$1,236,619 |
$1,252,692 |
$1,240,627 |
11/30/20 |
$1,134,852 |
$1,248,753 |
$1,336,144 |
$1,393,750 |
12/31/20 |
$1,178,906 |
$1,250,474 |
$1,366,301 |
$1,454,745 |
1/31/21 |
$1,197,972 |
$1,241,508 |
$1,356,549 |
$1,444,409 |
2/28/21 |
$1,265,762 |
$1,223,580 |
$1,357,202 |
$1,466,654 |
3/31/21 |
$1,315,733 |
$1,208,302 |
$1,383,703 |
$1,542,248 |
4/30/21 |
$1,332,737 |
$1,217,847 |
$1,404,288 |
$1,575,950 |
5/31/21 |
$1,370,998 |
$1,221,826 |
$1,425,086 |
$1,617,053 |
6/30/21 |
$1,365,869 |
$1,230,411 |
$1,423,230 |
$1,601,907 |
7/31/21 |
$1,352,984 |
$1,244,168 |
$1,433,918 |
$1,608,052 |
8/31/21 |
$1,359,427 |
$1,241,799 |
$1,442,021 |
$1,629,291 |
9/30/21 |
$1,347,714 |
$1,231,048 |
$1,405,783 |
$1,561,513 |
10/31/21 |
$1,359,602 |
$1,230,708 |
$1,419,856 |
$1,593,209 |
11/30/21 |
$1,342,310 |
$1,234,349 |
$1,402,324 |
$1,549,147 |
12/31/21 |
$1,397,195 |
$1,231,191 |
$1,451,814 |
$1,662,451 |
1/31/22 |
$1,387,270 |
$1,204,666 |
$1,432,318 |
$1,653,619 |
2/28/22 |
$1,367,420 |
$1,191,226 |
$1,412,238 |
$1,625,703 |
3/31/22 |
$1,374,093 |
$1,158,132 |
$1,400,342 |
$1,643,484 |
4/30/22 |
$1,326,634 |
$1,114,183 |
$1,346,722 |
$1,579,989 |
5/31/22 |
$1,346,501 |
$1,121,367 |
$1,359,430 |
$1,599,623 |
6/30/22 |
$1,259,923 |
$1,103,775 |
$1,301,036 |
$1,487,293 |
7/31/22 |
$1,298,775 |
$1,130,745 |
$1,331,344 |
$1,520,246 |
8/31/22 |
$1,264,363 |
$1,098,794 |
$1,287,873 |
$1,463,920 |
9/30/22 |
$1,192,789 |
$1,051,319 |
$1,210,174 |
$1,350,534 |
10/31/22 |
$1,242,114 |
$1,037,702 |
$1,242,306 |
$1,439,745 |
11/30/22 |
$1,321,708 |
$1,075,864 |
$1,317,567 |
$1,561,241 |
12/31/22 |
$1,309,907 |
$1,071,012 |
$1,304,734 |
$1,537,870 |
1/31/23 |
$1,359,975 |
$1,103,960 |
$1,344,873 |
$1,585,179 |
2/28/23 |
$1,319,222 |
$1,075,417 |
$1,305,280 |
$1,532,829 |
3/31/23 |
$1,338,952 |
$1,102,735 |
$1,335,820 |
$1,565,624 |
4/30/23 |
$1,351,871 |
$1,109,418 |
$1,354,178 |
$1,599,163 |
5/31/23 |
$1,322,508 |
$1,097,338 |
$1,315,098 |
$1,524,278 |
6/30/23 |
$1,370,870 |
$1,093,425 |
$1,343,169 |
$1,594,789 |
7/31/23 |
$1,401,676 |
$1,092,662 |
$1,368,278 |
$1,655,521 |
8/31/23 |
$1,380,349 |
$1,085,683 |
$1,346,202 |
$1,612,674 |
9/30/23 |
$1,351,979 |
$1,058,094 |
$1,311,818 |
$1,571,279 |
10/31/23 |
$1,329,247 |
$1,041,396 |
$1,276,746 |
$1,512,057 |
11/30/23 |
$1,409,408 |
$1,088,557 |
$1,347,234 |
$1,610,542 |
12/31/23 |
$1,469,458 |
$1,130,226 |
$1,402,588 |
$1,681,236 |
1/31/24 |
$1,473,119 |
$1,127,122 |
$1,401,886 |
$1,684,171 |
2/29/24 |
$1,487,765 |
$1,111,198 |
$1,398,903 |
$1,700,797 |
3/31/24 |
$1,531,852 |
$1,121,459 |
$1,432,159 |
$1,765,258 |
4/30/24 |
$1,491,150 |
$1,093,132 |
$1,394,754 |
$1,718,320 |
5/31/24 |
$1,539,252 |
$1,111,664 |
$1,424,578 |
$1,762,674 |
6/30/24 |
$1,540,644 |
$1,122,189 |
$1,425,721 |
$1,748,810 |
7/31/24 |
$1,586,801 |
$1,148,400 |
$1,472,460 |
$1,822,622 |
8/31/24 |
$1,626,721 |
$1,164,902 |
$1,507,335 |
$1,882,774 |
9/30/24 |
$1,650,257 |
$1,180,499 |
$1,531,483 |
$1,917,888 |
10/31/24 |
$1,617,529 |
$1,151,224 |
$1,490,064 |
$1,861,710 |
11/30/24 |
$1,646,481 |
$1,163,396 |
$1,506,142 |
$1,882,206 |
12/31/24 |
$1,607,999 |
$1,144,356 |
$1,462,936 |
$1,805,019 |
1/31/25 |
$1,641,419 |
$1,150,427 |
$1,487,973 |
$1,857,228 |
2/28/25 |
$1,686,407 |
$1,175,739 |
$1,524,416 |
$1,907,340 |
3/31/25 |
$1,695,986 |
$1,176,181 |
$1,526,418 |
$1,911,627 |
4/30/25 |
$1,698,583 |
$1,180,804 |
$1,525,243 |
$1,901,176 |
5/31/25 |
$1,727,152 |
$1,172,349 |
$1,537,743 |
$1,945,946 |
6/30/25 |
$1,770,210 |
$1,190,376 |
$1,565,536 |
$1,986,369 |
|
|
| Average Annual Return [Table Text Block] |
Class/Index Name |
1 Year |
5 Years |
10 Years |
Institutional Class |
14.90% |
12.05% |
5.88% |
Bloomberg U.S. Aggregate Index |
6.08% |
(0.73%) |
1.76% |
50% MSCI ACWI High Dividend Yield Index / 50% Bloomberg U.S. Aggregate Index |
9.81% |
4.66% |
4.58% |
MSCI ACWI High Dividend Yield Net USD |
13.58% |
10.02% |
7.10% | |
|
| No Deduction of Taxes [Text Block] |
Returns shown do not reflect the deduction of taxes that a shareholder would pay on Fund distributions or the redemption of Fund shares.
|
|
| Performance Table Market Index Changed [Text Block] |
Differences in the Fund’s performance versus an index and related attribution information with respect to particular categories of securities or individual positions may be attributable, in part, to differences in the pricing methodologies used by the Fund and the index.
|
|
| Updated Performance Information Location [Text Block] |
For performance current to the most recent month-end, visit www.pimco.com/literature or via 888.87.PIMCO (888.877.4626).
|
|
| AssetsNet |
$ 197,166,000
|
|
| Holdings Count | Holding |
1,206
|
|
| Advisory Fees Paid, Amount |
$ 795,000
|
|
| InvestmentCompanyPortfolioTurnover |
436.00%
|
|
| Additional Fund Statistics [Text Block] |
Key Fund StatisticsFootnote Reference† (as of the end of the reporting period)
Total Net Assets |
$197,166 |
# of Portfolio Holdings |
1,206 |
Portfolio Turnover Rate |
436% |
Total Net Advisory Fees Paid During the Reporting Period |
$795 |
| Footnote |
Description |
Footnote† |
Dollar amounts displayed in 000's | |
|
| Holdings [Text Block] |
Security Type Breakdown (% of Net Asset Value)Footnote Reference*
Common Stocks |
45.9% |
U.S. Government Agencies |
28.0% |
Asset-Backed Securities |
14.1% |
Non-Agency Mortgage-Backed Securities |
10.5% |
U.S. Treasury Obligations |
10.5% |
Corporate Bonds & Notes |
5.4% |
Real Estate Investment Trusts |
5.0% |
Sovereign Issues |
3.5% |
Loan Participations and Assignments |
0.6% |
Preferred Stocks |
0.4% |
Other Investments |
0.2% |
Short-Term Instruments |
0.5% |
Affiliated Investments |
2.3% |
Financial Derivative Instruments |
(0.2%) |
Other Assets and Liabilities, Net |
(26.7%) |
Total |
100.0% |
| Footnote |
Description |
Footnote* |
% of Net Asset Value includes derivatives instruments, if any, valued at the value used for determining the Fund's net asset value. The notional exposure of such derivatives investments therefore may be greater than what is depicted. | |
|
| Material Fund Change [Text Block] |
This is a summary of certain changes and planned changes of the Fund since the beginning of the reporting period. For more information, you may refer to the Fund's next prospectus, which we expect to be available by October 31, 2025 or upon request at 888.87.PIMCO (888.877.4626). Changes to Total Annual Fund Operating Expenses. Annual fund operating expenses increased during the year by 0.10% as a result of higher expenses related to interest. |
|
| Material Fund Change Expenses [Text Block] |
Changes to Total Annual Fund Operating Expenses. Annual fund operating expenses increased during the year by 0.10% as a result of higher expenses related to interest.
|
|
| Summary of Change Legend [Text Block] |
This is a summary of certain changes and planned changes of the Fund since the beginning of the reporting period. For more information, you may refer to the Fund's next prospectus, which we expect to be available by October 31, 2025 or upon request at 888.87.PIMCO (888.877.4626).
|
|
| C000106725 |
|
|
| Shareholder Report [Line Items] |
|
|
| Fund Name |
PIMCO Dividend and Income Fund
|
|
| Class Name |
I-2
|
|
| Trading Symbol |
PQIPX
|
|
| Annual or Semi-Annual Statement [Text Block] |
This annual shareholder report contains important information about the PIMCO Dividend and Income Fund (the "Fund") for the period of July 1, 2024 to June 30, 2025 (the "reporting period").
|
|
| Shareholder Report Annual or Semi-Annual |
Annual Shareholder Report
|
|
| Additional Information [Text Block] |
You can find additional information about the Fund at www.pimco.com/literature. You can also request this information by contacting us at 888.87.PIMCO (888.877.4626).
|
|
| Material Fund Change Notice [Text Block] |
This report describes changes to the Fund that occurred during the reporting period.
|
|
| Additional Information Website |
www.pimco.com/literature
|
|
| Expenses [Text Block] |
What were the Fund costs for the reporting period?(based on a hypothetical $10,000 investment)
Class Name |
Cost of a $10,000 investment |
Costs paid as a percentage of a $10,000 investment |
I-2 |
$110 |
1.02% | |
|
| Expenses Paid, Amount |
$ 110
|
|
| Expense Ratio, Percent |
1.02%
|
|
| Factors Affecting Performance [Text Block] |
How did the Fund perform during the reporting period and what affected its performance?The following affected performance (on a gross basis) during the reporting period: Long exposure to U.S. equities contributed to performance, as U.S. equities had positive returns during the reporting period. Exposure to the cash interest rate in the U.S. contributed to performance, as the currency outperformed the relevant yield differentials during the reporting period. Long exposure to eurozone equities contributed to performance, as eurozone equities had positive returns during the reporting period. Long exposure to agency mortgage-backed securities, particularly 30-year fixed rate securities, detracted from performance, as U.S. 30-year Treasury yields rose during the reporting period. Long exposure to Taiwanese equities detracted from performance, as Taiwanese equities had negative returns during the reporting period. U.K. duration and curve positioning, particularly long exposure to the 12-year and 15-year portions of the curve over most of the reporting period, detracted from performance, as these interest rates rose during the reporting period.
|
|
| Performance Past Does Not Indicate Future [Text] |
Performance quoted represents past performance. Past performance is not a guarantee or a reliable indicator of future results.
|
|
| Line Graph [Table Text Block] |
|
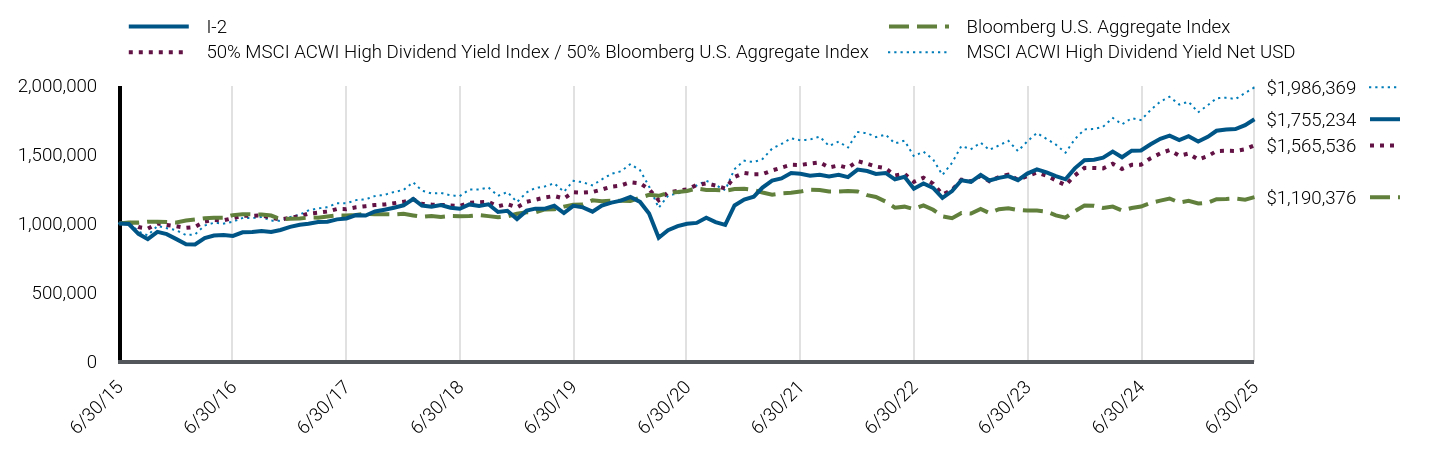
I-2 |
Bloomberg U.S. Aggregate Index |
50% MSCI ACWI High Dividend Yield Index / 50% Bloomberg U.S. Aggregate Index |
MSCI ACWI High Dividend Yield Net USD |
6/30/15 |
$1,000,000 |
$1,000,000 |
$1,000,000 |
$1,000,000 |
7/31/15 |
$995,478 |
$1,006,951 |
$1,006,756 |
$1,006,560 |
8/31/15 |
$924,451 |
$1,005,505 |
$973,220 |
$940,946 |
9/30/15 |
$885,206 |
$1,012,307 |
$961,886 |
$912,666 |
10/31/15 |
$938,207 |
$1,012,475 |
$998,417 |
$981,834 |
11/30/15 |
$922,157 |
$1,009,800 |
$988,542 |
$965,008 |
12/31/15 |
$885,763 |
$1,006,537 |
$979,282 |
$950,046 |
1/31/16 |
$848,892 |
$1,020,388 |
$967,982 |
$915,050 |
2/29/16 |
$846,925 |
$1,027,626 |
$973,918 |
$919,779 |
3/31/16 |
$893,361 |
$1,037,055 |
$1,012,903 |
$984,979 |
4/30/16 |
$911,460 |
$1,041,035 |
$1,024,786 |
$1,004,307 |
5/31/16 |
$916,101 |
$1,041,302 |
$1,022,103 |
$998,791 |
6/30/16 |
$909,482 |
$1,060,012 |
$1,037,940 |
$1,011,797 |
7/31/16 |
$935,050 |
$1,066,714 |
$1,055,160 |
$1,038,972 |
8/31/16 |
$936,876 |
$1,065,494 |
$1,054,028 |
$1,037,929 |
9/30/16 |
$944,181 |
$1,064,870 |
$1,058,216 |
$1,046,788 |
10/31/16 |
$937,789 |
$1,056,725 |
$1,040,767 |
$1,020,275 |
11/30/16 |
$952,399 |
$1,031,729 |
$1,027,191 |
$1,017,787 |
12/31/16 |
$974,404 |
$1,033,185 |
$1,041,903 |
$1,045,508 |
1/31/17 |
$990,120 |
$1,035,212 |
$1,051,350 |
$1,062,415 |
2/28/17 |
$997,516 |
$1,042,169 |
$1,070,681 |
$1,094,344 |
3/31/17 |
$1,009,732 |
$1,041,623 |
$1,077,362 |
$1,108,577 |
4/30/17 |
$1,012,516 |
$1,049,661 |
$1,085,718 |
$1,117,216 |
5/31/17 |
$1,029,221 |
$1,057,741 |
$1,104,155 |
$1,146,564 |
6/30/17 |
$1,035,557 |
$1,056,676 |
$1,103,235 |
$1,145,802 |
7/31/17 |
$1,059,792 |
$1,061,223 |
$1,116,522 |
$1,168,470 |
8/31/17 |
$1,056,996 |
$1,070,742 |
$1,124,623 |
$1,174,951 |
9/30/17 |
$1,086,214 |
$1,065,642 |
$1,133,078 |
$1,198,211 |
10/31/17 |
$1,099,346 |
$1,066,260 |
$1,137,634 |
$1,207,152 |
11/30/17 |
$1,113,416 |
$1,064,891 |
$1,146,489 |
$1,227,496 |
12/31/17 |
$1,131,044 |
$1,069,778 |
$1,156,225 |
$1,242,710 |
1/31/18 |
$1,176,666 |
$1,057,458 |
$1,175,376 |
$1,298,189 |
2/28/18 |
$1,129,143 |
$1,047,434 |
$1,142,360 |
$1,237,560 |
3/31/18 |
$1,120,155 |
$1,054,151 |
$1,136,830 |
$1,216,945 |
4/30/18 |
$1,132,516 |
$1,046,311 |
$1,134,138 |
$1,220,932 |
5/31/18 |
$1,113,498 |
$1,053,778 |
$1,129,880 |
$1,203,055 |
6/30/18 |
$1,106,004 |
$1,052,482 |
$1,127,177 |
$1,198,777 |
7/31/18 |
$1,137,577 |
$1,052,732 |
$1,149,455 |
$1,245,878 |
8/31/18 |
$1,127,052 |
$1,059,506 |
$1,152,973 |
$1,245,486 |
9/30/18 |
$1,138,568 |
$1,052,683 |
$1,156,412 |
$1,260,938 |
10/31/18 |
$1,082,652 |
$1,044,365 |
$1,123,736 |
$1,199,641 |
11/30/18 |
$1,091,329 |
$1,050,599 |
$1,140,038 |
$1,227,289 |
12/31/18 |
$1,031,159 |
$1,069,900 |
$1,116,592 |
$1,154,260 |
1/31/19 |
$1,092,221 |
$1,081,262 |
$1,156,565 |
$1,224,644 |
2/28/19 |
$1,106,994 |
$1,080,635 |
$1,171,330 |
$1,256,622 |
3/31/19 |
$1,106,736 |
$1,101,385 |
$1,187,806 |
$1,267,845 |
4/30/19 |
$1,127,432 |
$1,101,667 |
$1,198,661 |
$1,290,693 |
5/31/19 |
$1,075,199 |
$1,121,224 |
$1,180,598 |
$1,228,880 |
6/30/19 |
$1,127,118 |
$1,135,304 |
$1,226,369 |
$1,308,737 |
7/31/19 |
$1,116,136 |
$1,137,801 |
$1,222,612 |
$1,297,838 |
8/31/19 |
$1,085,188 |
$1,167,284 |
$1,227,876 |
$1,275,382 |
9/30/19 |
$1,129,689 |
$1,161,067 |
$1,245,704 |
$1,319,209 |
10/31/19 |
$1,150,758 |
$1,164,564 |
$1,266,740 |
$1,359,791 |
11/30/19 |
$1,164,804 |
$1,163,971 |
$1,274,513 |
$1,377,174 |
12/31/19 |
$1,191,266 |
$1,163,160 |
$1,298,511 |
$1,429,995 |
1/31/20 |
$1,155,446 |
$1,185,544 |
$1,290,545 |
$1,384,930 |
2/29/20 |
$1,071,525 |
$1,206,882 |
$1,247,728 |
$1,268,105 |
3/31/20 |
$895,842 |
$1,199,780 |
$1,167,435 |
$1,112,361 |
4/30/20 |
$950,167 |
$1,221,108 |
$1,224,345 |
$1,201,037 |
5/31/20 |
$979,892 |
$1,226,793 |
$1,235,699 |
$1,217,722 |
6/30/20 |
$997,237 |
$1,234,521 |
$1,246,843 |
$1,232,011 |
7/31/20 |
$1,003,393 |
$1,252,961 |
$1,277,812 |
$1,274,812 |
8/31/20 |
$1,041,354 |
$1,242,847 |
$1,289,953 |
$1,309,329 |
9/30/20 |
$1,009,163 |
$1,242,166 |
$1,274,227 |
$1,278,120 |
10/31/20 |
$989,578 |
$1,236,619 |
$1,252,692 |
$1,240,627 |
11/30/20 |
$1,129,768 |
$1,248,753 |
$1,336,144 |
$1,393,750 |
12/31/20 |
$1,173,151 |
$1,250,474 |
$1,366,301 |
$1,454,745 |
1/31/21 |
$1,193,142 |
$1,241,508 |
$1,356,549 |
$1,444,409 |
2/28/21 |
$1,259,428 |
$1,223,580 |
$1,357,202 |
$1,466,654 |
3/31/21 |
$1,309,849 |
$1,208,302 |
$1,383,703 |
$1,542,248 |
4/30/21 |
$1,325,681 |
$1,217,847 |
$1,404,288 |
$1,575,950 |
5/31/21 |
$1,364,733 |
$1,221,826 |
$1,425,086 |
$1,617,053 |
6/30/21 |
$1,359,217 |
$1,230,411 |
$1,423,230 |
$1,601,907 |
7/31/21 |
$1,345,358 |
$1,244,168 |
$1,433,918 |
$1,608,052 |
8/31/21 |
$1,351,755 |
$1,241,799 |
$1,442,021 |
$1,629,291 |
9/30/21 |
$1,339,860 |
$1,231,048 |
$1,405,783 |
$1,561,513 |
10/31/21 |
$1,352,733 |
$1,230,708 |
$1,419,856 |
$1,593,209 |
11/30/21 |
$1,335,569 |
$1,234,349 |
$1,402,324 |
$1,549,147 |
12/31/21 |
$1,389,671 |
$1,231,191 |
$1,451,814 |
$1,662,451 |
1/31/22 |
$1,379,823 |
$1,204,666 |
$1,432,318 |
$1,653,619 |
2/28/22 |
$1,359,032 |
$1,191,226 |
$1,412,238 |
$1,625,703 |
3/31/22 |
$1,365,581 |
$1,158,132 |
$1,400,342 |
$1,643,484 |
4/30/22 |
$1,319,588 |
$1,114,183 |
$1,346,722 |
$1,579,989 |
5/31/22 |
$1,338,204 |
$1,121,367 |
$1,359,430 |
$1,599,623 |
6/30/22 |
$1,251,389 |
$1,103,775 |
$1,301,036 |
$1,487,293 |
7/31/22 |
$1,289,944 |
$1,130,745 |
$1,331,344 |
$1,520,246 |
8/31/22 |
$1,256,896 |
$1,098,794 |
$1,287,873 |
$1,463,920 |
9/30/22 |
$1,185,655 |
$1,051,319 |
$1,210,174 |
$1,350,534 |
10/31/22 |
$1,234,593 |
$1,037,702 |
$1,242,306 |
$1,439,745 |
11/30/22 |
$1,312,451 |
$1,075,864 |
$1,317,567 |
$1,561,241 |
12/31/22 |
$1,301,339 |
$1,071,012 |
$1,304,734 |
$1,537,870 |
1/31/23 |
$1,350,991 |
$1,103,960 |
$1,344,873 |
$1,585,179 |
2/28/23 |
$1,310,576 |
$1,075,417 |
$1,305,280 |
$1,532,829 |
3/31/23 |
$1,329,836 |
$1,102,735 |
$1,335,820 |
$1,565,624 |
4/30/23 |
$1,342,645 |
$1,109,418 |
$1,354,178 |
$1,599,163 |
5/31/23 |
$1,313,533 |
$1,097,338 |
$1,315,098 |
$1,524,278 |
6/30/23 |
$1,361,149 |
$1,093,425 |
$1,343,169 |
$1,594,789 |
7/31/23 |
$1,391,684 |
$1,092,662 |
$1,368,278 |
$1,655,521 |
8/31/23 |
$1,370,545 |
$1,085,683 |
$1,346,202 |
$1,612,674 |
9/30/23 |
$1,342,277 |
$1,058,094 |
$1,311,818 |
$1,571,279 |
10/31/23 |
$1,319,748 |
$1,041,396 |
$1,276,746 |
$1,512,057 |
11/30/23 |
$1,399,193 |
$1,088,557 |
$1,347,234 |
$1,610,542 |
12/31/23 |
$1,458,235 |
$1,130,226 |
$1,402,588 |
$1,681,236 |
1/31/24 |
$1,461,862 |
$1,127,122 |
$1,401,886 |
$1,684,171 |
2/29/24 |
$1,476,372 |
$1,111,198 |
$1,398,903 |
$1,700,797 |
3/31/24 |
$1,520,962 |
$1,121,459 |
$1,432,159 |
$1,765,258 |
4/30/24 |
$1,479,426 |
$1,093,132 |
$1,394,754 |
$1,718,320 |
5/31/24 |
$1,527,070 |
$1,111,664 |
$1,424,578 |
$1,762,674 |
6/30/24 |
$1,528,131 |
$1,122,189 |
$1,425,721 |
$1,748,810 |
7/31/24 |
$1,573,839 |
$1,148,400 |
$1,472,460 |
$1,822,622 |
8/31/24 |
$1,613,370 |
$1,164,902 |
$1,507,335 |
$1,882,774 |
9/30/24 |
$1,636,371 |
$1,180,499 |
$1,531,483 |
$1,917,888 |
10/31/24 |
$1,603,968 |
$1,151,224 |
$1,490,064 |
$1,861,710 |
11/30/24 |
$1,632,632 |
$1,163,396 |
$1,506,142 |
$1,882,206 |
12/31/24 |
$1,594,132 |
$1,144,356 |
$1,462,936 |
$1,805,019 |
1/31/25 |
$1,627,210 |
$1,150,427 |
$1,487,973 |
$1,857,228 |
2/28/25 |
$1,671,739 |
$1,175,739 |
$1,524,416 |
$1,907,340 |
3/31/25 |
$1,680,937 |
$1,176,181 |
$1,526,418 |
$1,911,627 |
4/30/25 |
$1,683,507 |
$1,180,804 |
$1,525,243 |
$1,901,176 |
5/31/25 |
$1,711,780 |
$1,172,349 |
$1,537,743 |
$1,945,946 |
6/30/25 |
$1,755,234 |
$1,190,376 |
$1,565,536 |
$1,986,369 |
|
|
| Average Annual Return [Table Text Block] |
Class/Index Name |
1 Year |
5 Years |
10 Years |
I-2 |
14.86% |
11.97% |
5.79% |
Bloomberg U.S. Aggregate Index |
6.08% |
(0.73%) |
1.76% |
50% MSCI ACWI High Dividend Yield Index / 50% Bloomberg U.S. Aggregate Index |
9.81% |
4.66% |
4.58% |
MSCI ACWI High Dividend Yield Net USD |
13.58% |
10.02% |
7.10% | |
|
| No Deduction of Taxes [Text Block] |
Returns shown do not reflect the deduction of taxes that a shareholder would pay on Fund distributions or the redemption of Fund shares.
|
|
| Performance Table Market Index Changed [Text Block] |
Differences in the Fund’s performance versus an index and related attribution information with respect to particular categories of securities or individual positions may be attributable, in part, to differences in the pricing methodologies used by the Fund and the index.
|
|
| Updated Performance Information Location [Text Block] |
For performance current to the most recent month-end, visit www.pimco.com/literature or via 888.87.PIMCO (888.877.4626).
|
|
| AssetsNet |
$ 197,166,000
|
|
| Holdings Count | Holding |
1,206
|
|
| Advisory Fees Paid, Amount |
$ 795,000
|
|
| InvestmentCompanyPortfolioTurnover |
436.00%
|
|
| Additional Fund Statistics [Text Block] |
Key Fund StatisticsFootnote Reference† (as of the end of the reporting period)
Total Net Assets |
$197,166 |
# of Portfolio Holdings |
1,206 |
Portfolio Turnover Rate |
436% |
Total Net Advisory Fees Paid During the Reporting Period |
$795 |
| Footnote |
Description |
Footnote† |
Dollar amounts displayed in 000's | |
|
| Holdings [Text Block] |
Security Type Breakdown (% of Net Asset Value)Footnote Reference*
Common Stocks |
45.9% |
U.S. Government Agencies |
28.0% |
Asset-Backed Securities |
14.1% |
Non-Agency Mortgage-Backed Securities |
10.5% |
U.S. Treasury Obligations |
10.5% |
Corporate Bonds & Notes |
5.4% |
Real Estate Investment Trusts |
5.0% |
Sovereign Issues |
3.5% |
Loan Participations and Assignments |
0.6% |
Preferred Stocks |
0.4% |
Other Investments |
0.2% |
Short-Term Instruments |
0.5% |
Affiliated Investments |
2.3% |
Financial Derivative Instruments |
(0.2%) |
Other Assets and Liabilities, Net |
(26.7%) |
Total |
100.0% |
| Footnote |
Description |
Footnote* |
% of Net Asset Value includes derivatives instruments, if any, valued at the value used for determining the Fund's net asset value. The notional exposure of such derivatives investments therefore may be greater than what is depicted. | |
|
| Material Fund Change [Text Block] |
This is a summary of certain changes and planned changes of the Fund since the beginning of the reporting period. For more information, you may refer to the Fund's next prospectus, which we expect to be available by October 31, 2025 or upon request at 888.87.PIMCO (888.877.4626). Changes to Total Annual Fund Operating Expenses. Annual fund operating expenses increased during the year by 0.10% as a result of higher expenses related to interest. |
|
| Material Fund Change Expenses [Text Block] |
Changes to Total Annual Fund Operating Expenses. Annual fund operating expenses increased during the year by 0.10% as a result of higher expenses related to interest.
|
|
| Summary of Change Legend [Text Block] |
This is a summary of certain changes and planned changes of the Fund since the beginning of the reporting period. For more information, you may refer to the Fund's next prospectus, which we expect to be available by October 31, 2025 or upon request at 888.87.PIMCO (888.877.4626).
|
|
| C000154254 |
|
|
| Shareholder Report [Line Items] |
|
|
| Fund Name |
PIMCO RAE Emerging Markets Fund
|
|
| Class Name |
Class A
|
|
| Trading Symbol |
PEAFX
|
|
| Annual or Semi-Annual Statement [Text Block] |
This annual shareholder report contains important information about the PIMCO RAE Emerging Markets Fund (the "Fund") for the period of July 1, 2024 to June 30, 2025 (the "reporting period").
|
|
| Shareholder Report Annual or Semi-Annual |
Annual Shareholder Report
|
|
| Additional Information [Text Block] |
You can find additional information about the Fund at www.pimco.com/literature. You can also request this information by contacting us at 888.87.PIMCO (888.877.4626).
|
|
| Additional Information Website |
www.pimco.com/literature
|
|
| Expenses [Text Block] |
What were the Fund costs for the reporting period?(based on a hypothetical $10,000 investment)
Class Name |
Cost of a $10,000 investment |
Costs paid as a percentage of a $10,000 investment |
Class A |
$116 |
1.10% | |
|
| Expenses Paid, Amount |
$ 116
|
|
| Expense Ratio, Percent |
1.10%
|
|
| Factors Affecting Performance [Text Block] |
How did the Fund perform during the reporting period and what affected its performance?The following affected performance (on a gross basis) during the reporting period: Security selection in the industrials sector contributed to relative returns, as the Fund's holdings outperformed the MSCI Emerging Markets Value Index (the "Index"). Underweight exposure to the information technology sector contributed to relative returns, as the sector underperformed the Index. Security selection in the consumer staples sector contributed to relative returns, as the Fund's holdings outperformed the Index. Underweight exposure to, and security selection in, the consumer discretionary sector detracted from relative returns, as the sector outperformed the Index and the Fund's holdings underperformed the Index. Underweight exposure to, and security selection in, the financials sector detracted from relative returns, as the sector outperformed the Index and the Fund's holdings underperformed the Index. Overweight exposure to the energy sector detracted from relative returns, as the sector underperformed the Index.
|
|
| Performance Past Does Not Indicate Future [Text] |
Performance quoted represents past performance. Past performance is not a guarantee or a reliable indicator of future results.
|
|
| Average Annual Return [Table Text Block] |
Class/Index Name |
1 Year |
5 Years |
10 Years |
Class A (excluding sales charge) |
10.05% |
14.52% |
7.05% |
Class A (including sales charge) |
5.92% |
13.65% |
6.64% |
MSCI Emerging Markets Index |
15.29% |
6.81% |
4.81% |
MSCI Emerging Markets Value Index |
12.66% |
9.07% |
4.01% | |
|
| No Deduction of Taxes [Text Block] |
Returns shown do not reflect the deduction of taxes that a shareholder would pay on Fund distributions or the redemption of Fund shares.
|
|
| Performance Table Market Index Changed [Text Block] |
Differences in the Fund’s performance versus an index and related attribution information with respect to particular categories of securities or individual positions may be attributable, in part, to differences in the pricing methodologies used by the Fund and the index.
|
|
| Updated Performance Information Location [Text Block] |
For performance current to the most recent month-end, visit www.pimco.com/literature or via 888.87.PIMCO (888.877.4626).
|
|
| AssetsNet |
$ 2,360,499,000
|
|
| Holdings Count | Holding |
369
|
|
| Advisory Fees Paid, Amount |
$ 10,463,000
|
|
| InvestmentCompanyPortfolioTurnover |
48.00%
|
|
| Additional Fund Statistics [Text Block] |
Key Fund StatisticsFootnote Reference† (as of the end of the reporting period)
Total Net Assets |
$2,360,499 |
# of Portfolio Holdings |
369 |
Portfolio Turnover Rate |
48% |
Total Net Advisory Fees Paid During the Reporting Period |
$10,463 |
| Footnote |
Description |
Footnote† |
Dollar amounts displayed in 000's | |
|
| Holdings [Text Block] |
Geographic Breakdown (% of Net Asset Value)Footnote Reference*
China |
26.8% |
Brazil |
17.6% |
South Korea |
14.2% |
India |
9.7% |
Taiwan |
8.1% |
Thailand |
6.1% |
South Africa |
6.1% |
Hong Kong |
2.1% |
Indonesia |
1.9% |
Mexico |
1.5% |
Chile |
1.2% |
Other Countries |
3.7% |
Short-Term Instruments |
0.0%Footnote Reference^ |
Affiliated Investments |
0.7% |
Other Assets and Liabilities, Net |
0.3% |
Total |
100.0% |
| Footnote |
Description |
Footnote* |
% of Net Asset Value includes derivatives instruments, if any, valued at the value used for determining the Fund's net asset value. The notional exposure of such derivatives investments therefore may be greater than what is depicted. |
Footnote^ |
Rounded value of investments is less than 0.1% of net assets. | |
|
| Material Fund Change [Text Block] |
|
|
| C000154250 |
|
|
| Shareholder Report [Line Items] |
|
|
| Fund Name |
PIMCO RAE Emerging Markets Fund
|
|
| Class Name |
Institutional Class
|
|
| Trading Symbol |
PEIFX
|
|
| Annual or Semi-Annual Statement [Text Block] |
This annual shareholder report contains important information about the PIMCO RAE Emerging Markets Fund (the "Fund") for the period of July 1, 2024 to June 30, 2025 (the "reporting period").
|
|
| Shareholder Report Annual or Semi-Annual |
Annual Shareholder Report
|
|
| Additional Information [Text Block] |
You can find additional information about the Fund at www.pimco.com/literature. You can also request this information by contacting us at 888.87.PIMCO (888.877.4626).
|
|
| Additional Information Website |
www.pimco.com/literature
|
|
| Expenses [Text Block] |
What were the Fund costs for the reporting period?(based on a hypothetical $10,000 investment)
Class Name |
Cost of a $10,000 investment |
Costs paid as a percentage of a $10,000 investment |
Institutional Class |
$79 |
0.75% | |
|
| Expenses Paid, Amount |
$ 79
|
|
| Expense Ratio, Percent |
0.75%
|
|
| Factors Affecting Performance [Text Block] |
How did the Fund perform during the reporting period and what affected its performance?The following affected performance (on a gross basis) during the reporting period: Security selection in the industrials sector contributed to relative returns, as the Fund's holdings outperformed the MSCI Emerging Markets Value Index (the "Index"). Underweight exposure to the information technology sector contributed to relative returns, as the sector underperformed the Index. Security selection in the consumer staples sector contributed to relative returns, as the Fund's holdings outperformed the Index. Underweight exposure to, and security selection in, the consumer discretionary sector detracted from relative returns, as the sector outperformed the Index and the Fund's holdings underperformed the Index. Underweight exposure to, and security selection in, the financials sector detracted from relative returns, as the sector outperformed the Index and the Fund's holdings underperformed the Index. Overweight exposure to the energy sector detracted from relative returns, as the sector underperformed the Index.
|
|
| Performance Past Does Not Indicate Future [Text] |
Performance quoted represents past performance. Past performance is not a guarantee or a reliable indicator of future results.
|
|
| Average Annual Return [Table Text Block] |
Class/Index Name |
1 Year |
5 Years |
10 Years |
Institutional Class |
10.49% |
14.93% |
7.43% |
MSCI Emerging Markets Index |
15.29% |
6.81% |
4.81% |
MSCI Emerging Markets Value Index |
12.66% |
9.07% |
4.01% | |
|
| No Deduction of Taxes [Text Block] |
Returns shown do not reflect the deduction of taxes that a shareholder would pay on Fund distributions or the redemption of Fund shares.
|
|
| Performance Table Market Index Changed [Text Block] |
Differences in the Fund’s performance versus an index and related attribution information with respect to particular categories of securities or individual positions may be attributable, in part, to differences in the pricing methodologies used by the Fund and the index.
|
|
| Updated Performance Information Location [Text Block] |
For performance current to the most recent month-end, visit www.pimco.com/literature or via 888.87.PIMCO (888.877.4626).
|
|
| AssetsNet |
$ 2,360,499,000
|
|
| Holdings Count | Holding |
369
|
|
| Advisory Fees Paid, Amount |
$ 10,463,000
|
|
| InvestmentCompanyPortfolioTurnover |
48.00%
|
|
| Additional Fund Statistics [Text Block] |
Key Fund StatisticsFootnote Reference† (as of the end of the reporting period)
Total Net Assets |
$2,360,499 |
# of Portfolio Holdings |
369 |
Portfolio Turnover Rate |
48% |
Total Net Advisory Fees Paid During the Reporting Period |
$10,463 |
| Footnote |
Description |
Footnote† |
Dollar amounts displayed in 000's | |
|
| Holdings [Text Block] |
Geographic Breakdown (% of Net Asset Value)Footnote Reference*
China |
26.8% |
Brazil |
17.6% |
South Korea |
14.2% |
India |
9.7% |
Taiwan |
8.1% |
Thailand |
6.1% |
South Africa |
6.1% |
Hong Kong |
2.1% |
Indonesia |
1.9% |
Mexico |
1.5% |
Chile |
1.2% |
Other Countries |
3.7% |
Short-Term Instruments |
0.0%Footnote Reference^ |
Affiliated Investments |
0.7% |
Other Assets and Liabilities, Net |
0.3% |
Total |
100.0% |
| Footnote |
Description |
Footnote* |
% of Net Asset Value includes derivatives instruments, if any, valued at the value used for determining the Fund's net asset value. The notional exposure of such derivatives investments therefore may be greater than what is depicted. |
Footnote^ |
Rounded value of investments is less than 0.1% of net assets. | |
|
| Material Fund Change [Text Block] |
|
|
| C000154251 |
|
|
| Shareholder Report [Line Items] |
|
|
| Fund Name |
PIMCO RAE Emerging Markets Fund
|
|
| Class Name |
I-2
|
|
| Trading Symbol |
PEPFX
|
|
| Annual or Semi-Annual Statement [Text Block] |
This annual shareholder report contains important information about the PIMCO RAE Emerging Markets Fund (the "Fund") for the period of July 1, 2024 to June 30, 2025 (the "reporting period").
|
|
| Shareholder Report Annual or Semi-Annual |
Annual Shareholder Report
|
|
| Additional Information [Text Block] |
You can find additional information about the Fund at www.pimco.com/literature. You can also request this information by contacting us at 888.87.PIMCO (888.877.4626).
|
|
| Additional Information Website |
www.pimco.com/literature
|
|
| Expenses [Text Block] |
What were the Fund costs for the reporting period?(based on a hypothetical $10,000 investment)
Class Name |
Cost of a $10,000 investment |
Costs paid as a percentage of a $10,000 investment |
I-2 |
$89 |
0.85% | |
|
| Expenses Paid, Amount |
$ 89
|
|
| Expense Ratio, Percent |
0.85%
|
|
| Factors Affecting Performance [Text Block] |
How did the Fund perform during the reporting period and what affected its performance?The following affected performance (on a gross basis) during the reporting period: Security selection in the industrials sector contributed to relative returns, as the Fund's holdings outperformed the MSCI Emerging Markets Value Index (the "Index"). Underweight exposure to the information technology sector contributed to relative returns, as the sector underperformed the Index. Security selection in the consumer staples sector contributed to relative returns, as the Fund's holdings outperformed the Index. Underweight exposure to, and security selection in, the consumer discretionary sector detracted from relative returns, as the sector outperformed the Index and the Fund's holdings underperformed the Index. Underweight exposure to, and security selection in, the financials sector detracted from relative returns, as the sector outperformed the Index and the Fund's holdings underperformed the Index. Overweight exposure to the energy sector detracted from relative returns, as the sector underperformed the Index.
|
|
| Performance Past Does Not Indicate Future [Text] |
Performance quoted represents past performance. Past performance is not a guarantee or a reliable indicator of future results.
|
|
| Average Annual Return [Table Text Block] |
Class/Index Name |
1 Year |
5 Years |
10 Years |
I-2 |
10.33% |
14.81% |
7.29% |
MSCI Emerging Markets Index |
15.29% |
6.81% |
4.81% |
MSCI Emerging Markets Value Index |
12.66% |
9.07% |
4.01% | |
|
| No Deduction of Taxes [Text Block] |
Returns shown do not reflect the deduction of taxes that a shareholder would pay on Fund distributions or the redemption of Fund shares.
|
|
| Performance Table Market Index Changed [Text Block] |
Differences in the Fund’s performance versus an index and related attribution information with respect to particular categories of securities or individual positions may be attributable, in part, to differences in the pricing methodologies used by the Fund and the index.
|
|
| Updated Performance Information Location [Text Block] |
For performance current to the most recent month-end, visit www.pimco.com/literature or via 888.87.PIMCO (888.877.4626).
|
|
| AssetsNet |
$ 2,360,499,000
|
|
| Holdings Count | Holding |
369
|
|
| Advisory Fees Paid, Amount |
$ 10,463,000
|
|
| InvestmentCompanyPortfolioTurnover |
48.00%
|
|
| Additional Fund Statistics [Text Block] |
Key Fund StatisticsFootnote Reference† (as of the end of the reporting period)
Total Net Assets |
$2,360,499 |
# of Portfolio Holdings |
369 |
Portfolio Turnover Rate |
48% |
Total Net Advisory Fees Paid During the Reporting Period |
$10,463 |
| Footnote |
Description |
Footnote† |
Dollar amounts displayed in 000's | |
|
| Holdings [Text Block] |
Geographic Breakdown (% of Net Asset Value)Footnote Reference*
China |
26.8% |
Brazil |
17.6% |
South Korea |
14.2% |
India |
9.7% |
Taiwan |
8.1% |
Thailand |
6.1% |
South Africa |
6.1% |
Hong Kong |
2.1% |
Indonesia |
1.9% |
Mexico |
1.5% |
Chile |
1.2% |
Other Countries |
3.7% |
Short-Term Instruments |
0.0%Footnote Reference^ |
Affiliated Investments |
0.7% |
Other Assets and Liabilities, Net |
0.3% |
Total |
100.0% |
| Footnote |
Description |
Footnote* |
% of Net Asset Value includes derivatives instruments, if any, valued at the value used for determining the Fund's net asset value. The notional exposure of such derivatives investments therefore may be greater than what is depicted. |
Footnote^ |
Rounded value of investments is less than 0.1% of net assets. | |
|
| Material Fund Change [Text Block] |
|
|
| C000154268 |
|
|
| Shareholder Report [Line Items] |
|
|
| Fund Name |
PIMCO RAE Global ex-US Fund
|
|
| Class Name |
Class A
|
|
| Trading Symbol |
PZRAX
|
|
| Annual or Semi-Annual Statement [Text Block] |
This annual shareholder report contains important information about the PIMCO RAE Global ex-US Fund (the "Fund") for the period of July 1, 2024 to June 30, 2025 (the "reporting period").
|
|
| Shareholder Report Annual or Semi-Annual |
Annual Shareholder Report
|
|
| Additional Information [Text Block] |
You can find additional information about the Fund at www.pimco.com/literature. You can also request this information by contacting us at 888.87.PIMCO (888.877.4626).
|
|
| Additional Information Website |
www.pimco.com/literature
|
|
| Expenses [Text Block] |
What were the Fund costs for the reporting period?(based on a hypothetical $10,000 investment)
Class Name |
Cost of a $10,000 investment |
Costs paid as a percentage of a $10,000 investment |
Class A |
$38 |
0.35% | |
|
| Expenses Paid, Amount |
$ 38
|
|
| Expense Ratio, Percent |
0.35%
|
|
| Factors Affecting Performance [Text Block] |
How did the Fund perform during the reporting period and what affected its performance?The following affected performance (on a gross basis) during the reporting period: Security selection in the consumer staples sector contributed to relative returns, as the Fund's holdings outperformed the MSCI ACWI ex US Value Index (the "Index"). Security selection in the information technology sector contributed to relative returns, as the Fund's holdings outperformed the Index. Overweight exposure to, and security selection in, the communication services sector contributed to relative returns, as the sector and the Fund's holdings outperformed the Index. Underweight exposure to, and security selection in, the financials sector detracted from relative returns, as the sector outperformed the Index and the Fund's holdings underperformed the Index. Overweight exposure to, and security selection in, the consumer discretionary sector detracted from relative returns, as the sector and the Fund's holdings underperformed the Index. Security selection in the utilities sector detracted from relative returns, as the Fund's holdings underperformed the Index.
|
|
| Performance Past Does Not Indicate Future [Text] |
Performance quoted represents past performance. Past performance is not a guarantee or a reliable indicator of future results.
|
|
| Average Annual Return [Table Text Block] |
Class/Index Name |
1 Year |
5 Years |
10 Years |
Class A (excluding sales charge) |
17.26% |
12.96% |
5.92% |
Class A (including sales charge) |
12.91% |
12.09% |
5.52% |
MSCI All Country World Index |
16.17% |
13.65% |
9.99% |
MSCI All Country World ex US Index |
17.72% |
10.13% |
6.12% |
MSCI All Country World ex US Value Index |
21.42% |
13.15% |
5.70% | |
|
| No Deduction of Taxes [Text Block] |
Returns shown do not reflect the deduction of taxes that a shareholder would pay on Fund distributions or the redemption of Fund shares.
|
|
| Performance Table Market Index Changed [Text Block] |
Differences in the Fund’s performance versus an index and related attribution information with respect to particular categories of securities or individual positions may be attributable, in part, to differences in the pricing methodologies used by the Fund and the index.
|
|
| Updated Performance Information Location [Text Block] |
For performance current to the most recent month-end, visit www.pimco.com/literature or via 888.87.PIMCO (888.877.4626).
|
|
| AssetsNet |
$ 113,626,000
|
|
| Holdings Count | Holding |
3
|
|
| Advisory Fees Paid, Amount |
$ 0
|
|
| InvestmentCompanyPortfolioTurnover |
12.00%
|
|
| Additional Fund Statistics [Text Block] |
Key Fund StatisticsFootnote Reference† (as of the end of the reporting period)
Total Net Assets |
$113,626 |
# of Portfolio Holdings |
3 |
Portfolio Turnover Rate |
12% |
Total Net Advisory Fees Paid During the Reporting Period |
$0 |
| Footnote |
Description |
Footnote† |
Dollar amounts displayed in 000's | |
|
| Holdings [Text Block] |
Geographic Breakdown (% of Net Asset Value)Footnote Reference*
Short-Term Instruments |
0.2% |
United States |
99.8% |
Other Assets and Liabilities, Net |
0.0%Footnote Reference^ |
Total |
100.0% |
| Footnote |
Description |
Footnote* |
% of Net Asset Value includes derivatives instruments, if any, valued at the value used for determining the Fund's net asset value. The notional exposure of such derivatives investments therefore may be greater than what is depicted. |
Footnote^ |
Rounded value of investments is less than 0.1% of net assets. | |
|
| Largest Holdings [Text Block] |
Top Holdings (% of Net Asset Value)Footnote Reference**
PIMCO RAE International Fund |
73.8% |
PIMCO RAE Emerging Markets Fund |
26.1% |
| Footnote |
Description |
Footnote** |
Short-Term Instruments/Foreign Currency Contracts are not included in Top Holdings table. | |
|
| Material Fund Change [Text Block] |
|
|
| C000154264 |
|
|
| Shareholder Report [Line Items] |
|
|
| Fund Name |
PIMCO RAE Global ex-US Fund
|
|
| Class Name |
Institutional Class
|
|
| Trading Symbol |
PZRIX
|
|
| Annual or Semi-Annual Statement [Text Block] |
This annual shareholder report contains important information about the PIMCO RAE Global ex-US Fund (the "Fund") for the period of July 1, 2024 to June 30, 2025 (the "reporting period").
|
|
| Shareholder Report Annual or Semi-Annual |
Annual Shareholder Report
|
|
| Additional Information [Text Block] |
You can find additional information about the Fund at www.pimco.com/literature. You can also request this information by contacting us at 888.87.PIMCO (888.877.4626).
|
|
| Additional Information Website |
www.pimco.com/literature
|
|
| Expenses [Text Block] |
What were the Fund costs for the reporting period?(based on a hypothetical $10,000 investment)
Class Name |
Cost of a $10,000 investment |
Costs paid as a percentage of a $10,000 investment |
Institutional Class |
$0 |
0.00% | |
|
| Expenses Paid, Amount |
$ 0
|
|
| Expense Ratio, Percent |
0.00%
|
|
| Factors Affecting Performance [Text Block] |
How did the Fund perform during the reporting period and what affected its performance?The following affected performance (on a gross basis) during the reporting period: Security selection in the consumer staples sector contributed to relative returns, as the Fund's holdings outperformed the MSCI ACWI ex US Value Index (the "Index"). Security selection in the information technology sector contributed to relative returns, as the Fund's holdings outperformed the Index. Overweight exposure to, and security selection in, the communication services sector contributed to relative returns, as the sector and the Fund's holdings outperformed the Index. Underweight exposure to, and security selection in, the financials sector detracted from relative returns, as the sector outperformed the Index and the Fund's holdings underperformed the Index. Overweight exposure to, and security selection in, the consumer discretionary sector detracted from relative returns, as the sector and the Fund's holdings underperformed the Index. Security selection in the utilities sector detracted from relative returns, as the Fund's holdings underperformed the Index.
|
|
| Performance Past Does Not Indicate Future [Text] |
Performance quoted represents past performance. Past performance is not a guarantee or a reliable indicator of future results.
|
|
| Average Annual Return [Table Text Block] |
Class/Index Name |
1 Year |
5 Years |
10 Years |
Institutional Class |
17.54% |
13.34% |
6.28% |
MSCI All Country World Index |
16.17% |
13.65% |
9.99% |
MSCI All Country World ex US Index |
17.72% |
10.13% |
6.12% |
MSCI All Country World ex US Value Index |
21.42% |
13.15% |
5.70% | |
|
| No Deduction of Taxes [Text Block] |
Returns shown do not reflect the deduction of taxes that a shareholder would pay on Fund distributions or the redemption of Fund shares.
|
|
| Performance Table Market Index Changed [Text Block] |
Differences in the Fund’s performance versus an index and related attribution information with respect to particular categories of securities or individual positions may be attributable, in part, to differences in the pricing methodologies used by the Fund and the index.
|
|
| Updated Performance Information Location [Text Block] |
For performance current to the most recent month-end, visit www.pimco.com/literature or via 888.87.PIMCO (888.877.4626).
|
|
| AssetsNet |
$ 113,626,000
|
|
| Holdings Count | Holding |
3
|
|
| Advisory Fees Paid, Amount |
$ 0
|
|
| InvestmentCompanyPortfolioTurnover |
12.00%
|
|
| Additional Fund Statistics [Text Block] |
Key Fund StatisticsFootnote Reference† (as of the end of the reporting period)
Total Net Assets |
$113,626 |
# of Portfolio Holdings |
3 |
Portfolio Turnover Rate |
12% |
Total Net Advisory Fees Paid During the Reporting Period |
$0 |
| Footnote |
Description |
Footnote† |
Dollar amounts displayed in 000's | |
|
| Holdings [Text Block] |
Geographic Breakdown (% of Net Asset Value)Footnote Reference*
Short-Term Instruments |
0.2% |
United States |
99.8% |
Other Assets and Liabilities, Net |
0.0%Footnote Reference^ |
Total |
100.0% |
| Footnote |
Description |
Footnote* |
% of Net Asset Value includes derivatives instruments, if any, valued at the value used for determining the Fund's net asset value. The notional exposure of such derivatives investments therefore may be greater than what is depicted. |
Footnote^ |
Rounded value of investments is less than 0.1% of net assets. | |
|
| Largest Holdings [Text Block] |
Top Holdings (% of Net Asset Value)Footnote Reference**
PIMCO RAE International Fund |
73.8% |
PIMCO RAE Emerging Markets Fund |
26.1% |
| Footnote |
Description |
Footnote** |
Short-Term Instruments/Foreign Currency Contracts are not included in Top Holdings table. | |
|
| Material Fund Change [Text Block] |
|
|
| C000154265 |
|
|
| Shareholder Report [Line Items] |
|
|
| Fund Name |
PIMCO RAE Global ex-US Fund
|
|
| Class Name |
I-2
|
|
| Trading Symbol |
PZRPX
|
|
| Annual or Semi-Annual Statement [Text Block] |
This annual shareholder report contains important information about the PIMCO RAE Global ex-US Fund (the "Fund") for the period of July 1, 2024 to June 30, 2025 (the "reporting period").
|
|
| Shareholder Report Annual or Semi-Annual |
Annual Shareholder Report
|
|
| Additional Information [Text Block] |
You can find additional information about the Fund at www.pimco.com/literature. You can also request this information by contacting us at 888.87.PIMCO (888.877.4626).
|
|
| Additional Information Website |
www.pimco.com/literature
|
|
| Expenses [Text Block] |
What were the Fund costs for the reporting period?(based on a hypothetical $10,000 investment)
Class Name |
Cost of a $10,000 investment |
Costs paid as a percentage of a $10,000 investment |
I-2 |
$11 |
0.10% | |
|
| Expenses Paid, Amount |
$ 11
|
|
| Expense Ratio, Percent |
0.10%
|
|
| Factors Affecting Performance [Text Block] |
How did the Fund perform during the reporting period and what affected its performance?The following affected performance (on a gross basis) during the reporting period: Security selection in the consumer staples sector contributed to relative returns, as the Fund's holdings outperformed the MSCI ACWI ex US Value Index (the "Index"). Security selection in the information technology sector contributed to relative returns, as the Fund's holdings outperformed the Index. Overweight exposure to, and security selection in, the communication services sector contributed to relative returns, as the sector and the Fund's holdings outperformed the Index. Underweight exposure to, and security selection in, the financials sector detracted from relative returns, as the sector outperformed the Index and the Fund's holdings underperformed the Index. Overweight exposure to, and security selection in, the consumer discretionary sector detracted from relative returns, as the sector and the Fund's holdings underperformed the Index. Security selection in the utilities sector detracted from relative returns, as the Fund's holdings underperformed the Index.
|
|
| Performance Past Does Not Indicate Future [Text] |
Performance quoted represents past performance. Past performance is not a guarantee or a reliable indicator of future results.
|
|
| Average Annual Return [Table Text Block] |
Class/Index Name |
1 Year |
5 Years |
10 Years |
I-2 |
17.39% |
13.25% |
6.19% |
MSCI All Country World Index |
16.17% |
13.65% |
9.99% |
MSCI All Country World ex US Index |
17.72% |
10.13% |
6.12% |
MSCI All Country World ex US Value Index |
21.42% |
13.15% |
5.70% | |
|
| No Deduction of Taxes [Text Block] |
Returns shown do not reflect the deduction of taxes that a shareholder would pay on Fund distributions or the redemption of Fund shares.
|
|
| Performance Table Market Index Changed [Text Block] |
Differences in the Fund’s performance versus an index and related attribution information with respect to particular categories of securities or individual positions may be attributable, in part, to differences in the pricing methodologies used by the Fund and the index.
|
|
| Updated Performance Information Location [Text Block] |
For performance current to the most recent month-end, visit www.pimco.com/literature or via 888.87.PIMCO (888.877.4626).
|
|
| AssetsNet |
$ 113,626,000
|
|
| Holdings Count | Holding |
3
|
|
| Advisory Fees Paid, Amount |
$ 0
|
|
| InvestmentCompanyPortfolioTurnover |
12.00%
|
|
| Additional Fund Statistics [Text Block] |
Key Fund StatisticsFootnote Reference† (as of the end of the reporting period)
Total Net Assets |
$113,626 |
# of Portfolio Holdings |
3 |
Portfolio Turnover Rate |
12% |
Total Net Advisory Fees Paid During the Reporting Period |
$0 |
| Footnote |
Description |
Footnote† |
Dollar amounts displayed in 000's | |
|
| Holdings [Text Block] |
Geographic Breakdown (% of Net Asset Value)Footnote Reference*
Short-Term Instruments |
0.2% |
United States |
99.8% |
Other Assets and Liabilities, Net |
0.0%Footnote Reference^ |
Total |
100.0% |
| Footnote |
Description |
Footnote* |
% of Net Asset Value includes derivatives instruments, if any, valued at the value used for determining the Fund's net asset value. The notional exposure of such derivatives investments therefore may be greater than what is depicted. |
Footnote^ |
Rounded value of investments is less than 0.1% of net assets. | |
|
| Largest Holdings [Text Block] |
Top Holdings (% of Net Asset Value)Footnote Reference**
PIMCO RAE International Fund |
73.8% |
PIMCO RAE Emerging Markets Fund |
26.1% |
| Footnote |
Description |
Footnote** |
Short-Term Instruments/Foreign Currency Contracts are not included in Top Holdings table. | |
|
| Material Fund Change [Text Block] |
|
|
| C000154275 |
|
|
| Shareholder Report [Line Items] |
|
|
| Fund Name |
PIMCO RAE International Fund
|
|
| Class Name |
Class A
|
|
| Trading Symbol |
PPYAX
|
|
| Annual or Semi-Annual Statement [Text Block] |
This annual shareholder report contains important information about the PIMCO RAE International Fund (the "Fund") for the period of July 1, 2024 to June 30, 2025 (the "reporting period").
|
|
| Shareholder Report Annual or Semi-Annual |
Annual Shareholder Report
|
|
| Additional Information [Text Block] |
You can find additional information about the Fund at www.pimco.com/literature. You can also request this information by contacting us at 888.87.PIMCO (888.877.4626).
|
|
| Additional Information Website |
www.pimco.com/literature
|
|
| Expenses [Text Block] |
What were the Fund costs for the reporting period?(based on a hypothetical $10,000 investment)
Class Name |
Cost of a $10,000 investment |
Costs paid as a percentage of a $10,000 investment |
Class A |
$93 |
0.85% | |
|
| Expenses Paid, Amount |
$ 93
|
|
| Expense Ratio, Percent |
0.85%
|
|
| Factors Affecting Performance [Text Block] |
How did the Fund perform during the reporting period and what affected its performance?The following affected performance (on a gross basis) during the reporting period: Security selection in the consumer staples sector contributed to relative returns, as the Fund's holdings outperformed the MSCI EAFE Value Index (the "Index"). Underweight exposure to, and security selection in, the energy sector contributed to relative returns, as the sector underperformed the Index and the Fund's holdings outperformed the Index. Overweight exposure to the communication services sector contributed to relative returns, as the sector outperformed the Index. Underweight exposure to, and security selection in, the financials sector detracted from relative returns, as the sector outperformed the Index and the Fund's holdings underperformed the Index. Security selection in the industrials sector detracted from relative returns, as the Fund's holdings underperformed the Index. Security selection in the utilities sector detracted from relative returns, as the Fund's holdings underperformed the Index.
|
|
| Performance Past Does Not Indicate Future [Text] |
Performance quoted represents past performance. Past performance is not a guarantee or a reliable indicator of future results.
|
|
| Average Annual Return [Table Text Block] |
Class/Index Name |
1 Year |
5 Years |
10 Years |
Class A (excluding sales charge) |
19.61% |
12.48% |
5.66% |
Class A (including sales charge) |
15.18% |
11.63% |
5.26% |
MSCI EAFE Index |
17.73% |
11.16% |
6.51% |
MSCI EAFE Value Index |
24.24% |
14.29% |
6.05% | |
|
| No Deduction of Taxes [Text Block] |
Returns shown do not reflect the deduction of taxes that a shareholder would pay on Fund distributions or the redemption of Fund shares.
|
|
| Performance Table Market Index Changed [Text Block] |
Differences in the Fund’s performance versus an index and related attribution information with respect to particular categories of securities or individual positions may be attributable, in part, to differences in the pricing methodologies used by the Fund and the index.
|
|
| Updated Performance Information Location [Text Block] |
For performance current to the most recent month-end, visit www.pimco.com/literature or via 888.87.PIMCO (888.877.4626).
|
|
| AssetsNet |
$ 594,270,000
|
|
| Holdings Count | Holding |
278
|
|
| Advisory Fees Paid, Amount |
$ 1,596,000
|
|
| InvestmentCompanyPortfolioTurnover |
76.00%
|
|
| Additional Fund Statistics [Text Block] |
Key Fund StatisticsFootnote Reference† (as of the end of the reporting period)
Total Net Assets |
$594,270 |
# of Portfolio Holdings |
278 |
Portfolio Turnover Rate |
76% |
Total Net Advisory Fees Paid During the Reporting Period |
$1,596 |
| Footnote |
Description |
Footnote† |
Dollar amounts displayed in 000's | |
|
| Holdings [Text Block] |
Geographic Breakdown (% of Net Asset Value)Footnote Reference*
Japan |
21.6% |
United Kingdom |
17.2% |
Germany |
8.7% |
Switzerland |
8.2% |
Netherlands |
6.7% |
Canada |
5.1% |
Hong Kong |
3.6% |
France |
3.1% |
Denmark |
3.1% |
Spain |
3.0% |
Other Countries |
18.6% |
Short-Term Instruments |
0.2% |
Affiliated Investments |
7.6% |
Other Assets and Liabilities, Net |
(6.7%) |
Total |
100.0% |
| Footnote |
Description |
Footnote* |
% of Net Asset Value includes derivatives instruments, if any, valued at the value used for determining the Fund's net asset value. The notional exposure of such derivatives investments therefore may be greater than what is depicted. | |
|
| Material Fund Change [Text Block] |
|
|
| C000154271 |
|
|
| Shareholder Report [Line Items] |
|
|
| Fund Name |
PIMCO RAE International Fund
|
|
| Class Name |
Institutional Class
|
|
| Trading Symbol |
PPYIX
|
|
| Annual or Semi-Annual Statement [Text Block] |
This annual shareholder report contains important information about the PIMCO RAE International Fund (the "Fund") for the period of July 1, 2024 to June 30, 2025 (the "reporting period").
|
|
| Shareholder Report Annual or Semi-Annual |
Annual Shareholder Report
|
|
| Additional Information [Text Block] |
You can find additional information about the Fund at www.pimco.com/literature. You can also request this information by contacting us at 888.87.PIMCO (888.877.4626).
|
|
| Additional Information Website |
www.pimco.com/literature
|
|
| Expenses [Text Block] |
What were the Fund costs for the reporting period?(based on a hypothetical $10,000 investment)
Class Name |
Cost of a $10,000 investment |
Costs paid as a percentage of a $10,000 investment |
Institutional Class |
$55 |
0.50% | |
|
| Expenses Paid, Amount |
$ 55
|
|
| Expense Ratio, Percent |
0.50%
|
|
| Factors Affecting Performance [Text Block] |
How did the Fund perform during the reporting period and what affected its performance?The following affected performance (on a gross basis) during the reporting period: Security selection in the consumer staples sector contributed to relative returns, as the Fund's holdings outperformed the MSCI EAFE Value Index (the "Index"). Underweight exposure to, and security selection in, the energy sector contributed to relative returns, as the sector underperformed the Index and the Fund's holdings outperformed the Index. Overweight exposure to the communication services sector contributed to relative returns, as the sector outperformed the Index. Underweight exposure to, and security selection in, the financials sector detracted from relative returns, as the sector outperformed the Index and the Fund's holdings underperformed the Index. Security selection in the industrials sector detracted from relative returns, as the Fund's holdings underperformed the Index. Security selection in the utilities sector detracted from relative returns, as the Fund's holdings underperformed the Index.
|
|
| Performance Past Does Not Indicate Future [Text] |
Performance quoted represents past performance. Past performance is not a guarantee or a reliable indicator of future results.
|
|
| Average Annual Return [Table Text Block] |
Class/Index Name |
1 Year |
5 Years |
10 Years |
Institutional Class |
20.10% |
12.87% |
6.03% |
MSCI EAFE Index |
17.73% |
11.16% |
6.51% |
MSCI EAFE Value Index |
24.24% |
14.29% |
6.05% | |
|
| No Deduction of Taxes [Text Block] |
Returns shown do not reflect the deduction of taxes that a shareholder would pay on Fund distributions or the redemption of Fund shares.
|
|
| Performance Table Market Index Changed [Text Block] |
Differences in the Fund’s performance versus an index and related attribution information with respect to particular categories of securities or individual positions may be attributable, in part, to differences in the pricing methodologies used by the Fund and the index.
|
|
| Updated Performance Information Location [Text Block] |
For performance current to the most recent month-end, visit www.pimco.com/literature or via 888.87.PIMCO (888.877.4626).
|
|
| AssetsNet |
$ 594,270,000
|
|
| Holdings Count | Holding |
278
|
|
| Advisory Fees Paid, Amount |
$ 1,596,000
|
|
| InvestmentCompanyPortfolioTurnover |
76.00%
|
|
| Additional Fund Statistics [Text Block] |
Key Fund StatisticsFootnote Reference† (as of the end of the reporting period)
Total Net Assets |
$594,270 |
# of Portfolio Holdings |
278 |
Portfolio Turnover Rate |
76% |
Total Net Advisory Fees Paid During the Reporting Period |
$1,596 |
| Footnote |
Description |
Footnote† |
Dollar amounts displayed in 000's | |
|
| Holdings [Text Block] |
Geographic Breakdown (% of Net Asset Value)Footnote Reference*
Japan |
21.6% |
United Kingdom |
17.2% |
Germany |
8.7% |
Switzerland |
8.2% |
Netherlands |
6.7% |
Canada |
5.1% |
Hong Kong |
3.6% |
France |
3.1% |
Denmark |
3.1% |
Spain |
3.0% |
Other Countries |
18.6% |
Short-Term Instruments |
0.2% |
Affiliated Investments |
7.6% |
Other Assets and Liabilities, Net |
(6.7%) |
Total |
100.0% |
| Footnote |
Description |
Footnote* |
% of Net Asset Value includes derivatives instruments, if any, valued at the value used for determining the Fund's net asset value. The notional exposure of such derivatives investments therefore may be greater than what is depicted. | |
|
| Material Fund Change [Text Block] |
|
|
| C000154272 |
|
|
| Shareholder Report [Line Items] |
|
|
| Fund Name |
PIMCO RAE International Fund
|
|
| Class Name |
I-2
|
|
| Trading Symbol |
PPYPX
|
|
| Annual or Semi-Annual Statement [Text Block] |
This annual shareholder report contains important information about the PIMCO RAE International Fund (the "Fund") for the period of July 1, 2024 to June 30, 2025 (the "reporting period").
|
|
| Shareholder Report Annual or Semi-Annual |
Annual Shareholder Report
|
|
| Additional Information [Text Block] |
You can find additional information about the Fund at www.pimco.com/literature. You can also request this information by contacting us at 888.87.PIMCO (888.877.4626).
|
|
| Additional Information Website |
www.pimco.com/literature
|
|
| Expenses [Text Block] |
What were the Fund costs for the reporting period?(based on a hypothetical $10,000 investment)
Class Name |
Cost of a $10,000 investment |
Costs paid as a percentage of a $10,000 investment |
I-2 |
$66 |
0.60% | |
|
| Expenses Paid, Amount |
$ 66
|
|
| Expense Ratio, Percent |
0.60%
|
|
| Factors Affecting Performance [Text Block] |
How did the Fund perform during the reporting period and what affected its performance?The following affected performance (on a gross basis) during the reporting period: Security selection in the consumer staples sector contributed to relative returns, as the Fund's holdings outperformed the MSCI EAFE Value Index (the "Index"). Underweight exposure to, and security selection in, the energy sector contributed to relative returns, as the sector underperformed the Index and the Fund's holdings outperformed the Index. Overweight exposure to the communication services sector contributed to relative returns, as the sector outperformed the Index. Underweight exposure to, and security selection in, the financials sector detracted from relative returns, as the sector outperformed the Index and the Fund's holdings underperformed the Index. Security selection in the industrials sector detracted from relative returns, as the Fund's holdings underperformed the Index. Security selection in the utilities sector detracted from relative returns, as the Fund's holdings underperformed the Index.
|
|
| Performance Past Does Not Indicate Future [Text] |
Performance quoted represents past performance. Past performance is not a guarantee or a reliable indicator of future results.
|
|
| Average Annual Return [Table Text Block] |
Class/Index Name |
1 Year |
5 Years |
10 Years |
I-2 |
19.89% |
12.75% |
5.93% |
MSCI EAFE Index |
17.73% |
11.16% |
6.51% |
MSCI EAFE Value Index |
24.24% |
14.29% |
6.05% | |
|
| No Deduction of Taxes [Text Block] |
Returns shown do not reflect the deduction of taxes that a shareholder would pay on Fund distributions or the redemption of Fund shares.
|
|
| Performance Table Market Index Changed [Text Block] |
Differences in the Fund’s performance versus an index and related attribution information with respect to particular categories of securities or individual positions may be attributable, in part, to differences in the pricing methodologies used by the Fund and the index.
|
|
| Updated Performance Information Location [Text Block] |
For performance current to the most recent month-end, visit www.pimco.com/literature or via 888.87.PIMCO (888.877.4626).
|
|
| AssetsNet |
$ 594,270,000
|
|
| Holdings Count | Holding |
278
|
|
| Advisory Fees Paid, Amount |
$ 1,596,000
|
|
| InvestmentCompanyPortfolioTurnover |
76.00%
|
|
| Additional Fund Statistics [Text Block] |
Key Fund StatisticsFootnote Reference† (as of the end of the reporting period)
Total Net Assets |
$594,270 |
# of Portfolio Holdings |
278 |
Portfolio Turnover Rate |
76% |
Total Net Advisory Fees Paid During the Reporting Period |
$1,596 |
| Footnote |
Description |
Footnote† |
Dollar amounts displayed in 000's | |
|
| Holdings [Text Block] |
Geographic Breakdown (% of Net Asset Value)Footnote Reference*
Japan |
21.6% |
United Kingdom |
17.2% |
Germany |
8.7% |
Switzerland |
8.2% |
Netherlands |
6.7% |
Canada |
5.1% |
Hong Kong |
3.6% |
France |
3.1% |
Denmark |
3.1% |
Spain |
3.0% |
Other Countries |
18.6% |
Short-Term Instruments |
0.2% |
Affiliated Investments |
7.6% |
Other Assets and Liabilities, Net |
(6.7%) |
Total |
100.0% |
| Footnote |
Description |
Footnote* |
% of Net Asset Value includes derivatives instruments, if any, valued at the value used for determining the Fund's net asset value. The notional exposure of such derivatives investments therefore may be greater than what is depicted. | |
|
| Material Fund Change [Text Block] |
|
|
| C000154282 |
|
|
| Shareholder Report [Line Items] |
|
|
| Fund Name |
PIMCO RAE US Fund
|
|
| Class Name |
Class A
|
|
| Trading Symbol |
PKAAX
|
|
| Annual or Semi-Annual Statement [Text Block] |
This annual shareholder report contains important information about the PIMCO RAE US Fund (the "Fund") for the period of July 1, 2024 to June 30, 2025 (the "reporting period").
|
|
| Shareholder Report Annual or Semi-Annual |
Annual Shareholder Report
|
|
| Additional Information [Text Block] |
You can find additional information about the Fund at www.pimco.com/literature. You can also request this information by contacting us at 888.87.PIMCO (888.877.4626).
|
|
| Additional Information Website |
www.pimco.com/literature
|
|
| Expenses [Text Block] |
What were the Fund costs for the reporting period?(based on a hypothetical $10,000 investment)
Class Name |
Cost of a $10,000 investment |
Costs paid as a percentage of a $10,000 investment |
Class A |
$82 |
0.80% | |
|
| Expenses Paid, Amount |
$ 82
|
|
| Expense Ratio, Percent |
0.80%
|
|
| Factors Affecting Performance [Text Block] |
How did the Fund perform during the reporting period and what affected its performance?The following affected performance (on a gross basis) during the reporting period: Overweight exposure to, and security selection in, the consumer staples sector contributed to relative returns, as the sector and the Fund's holdings outperformed the Russell 1000® Value Index (the "Index"). Security selection in the utilities sector contributed to relative returns, as the Fund's holdings outperformed the Index. Security selection in the healthcare sector contributed to relative returns, as the Fund's holdings outperformed the Index. Overweight exposure to, and security selection in, the information technology sector detracted from relative returns, as the sector and the Fund's holdings underperformed the Index. Underweight exposure to, and security selection in, the financials sector detracted from relative returns, as the sector outperformed the Index and the Fund's holdings underperformed the Index. Overweight exposure to, and security selection in, the energy sector detracted from relative returns, as the sector and the Fund's holdings underperformed the Index.
|
|
| Performance Past Does Not Indicate Future [Text] |
Performance quoted represents past performance. Past performance is not a guarantee or a reliable indicator of future results.
|
|
| Average Annual Return [Table Text Block] |
Class/Index Name |
1 Year |
5 Years |
10 Years |
Class A (excluding sales charge) |
5.95% |
15.51% |
9.87% |
Class A (including sales charge) |
1.97% |
14.63% |
9.46% |
S&P 500 Index |
15.16% |
16.64% |
13.65% |
Russell 1000® Value Index |
13.70% |
13.93% |
9.19% | |
|
| No Deduction of Taxes [Text Block] |
Returns shown do not reflect the deduction of taxes that a shareholder would pay on Fund distributions or the redemption of Fund shares.
|
|
| Performance Table Market Index Changed [Text Block] |
Differences in the Fund’s performance versus an index and related attribution information with respect to particular categories of securities or individual positions may be attributable, in part, to differences in the pricing methodologies used by the Fund and the index.
|
|
| Updated Performance Information Location [Text Block] |
For performance current to the most recent month-end, visit www.pimco.com/literature or via 888.87.PIMCO (888.877.4626).
|
|
| AssetsNet |
$ 1,388,310,000
|
|
| Holdings Count | Holding |
143
|
|
| Advisory Fees Paid, Amount |
$ 3,603,000
|
|
| InvestmentCompanyPortfolioTurnover |
57.00%
|
|
| Additional Fund Statistics [Text Block] |
Key Fund StatisticsFootnote Reference† (as of the end of the reporting period)
Total Net Assets |
$1,388,310 |
# of Portfolio Holdings |
143 |
Portfolio Turnover Rate |
57% |
Total Net Advisory Fees Paid During the Reporting Period |
$3,603 |
| Footnote |
Description |
Footnote† |
Dollar amounts displayed in 000's | |
|
| Holdings [Text Block] |
Sector Breakdown (% of Net Asset Value)Footnote Reference*
Information Technology |
22.5% |
Health Care |
17.2% |
Consumer Staples |
12.6% |
Financials |
9.2% |
Energy |
8.2% |
Industrials |
8.0% |
Consumer Discretionary |
7.7% |
Communication Services |
7.4% |
Materials |
2.8% |
Utilities |
2.2% |
Real Estate |
1.9% |
Short-Term Instruments |
0.0%Footnote Reference^ |
Affiliated Investments |
1.8% |
Other Assets and Liabilities, Net |
(1.5%) |
Total |
100.0% |
| Footnote |
Description |
Footnote* |
% of Net Asset Value includes derivatives instruments, if any, valued at the value used for determining the Fund’s net asset value. The notional exposure of such derivatives investments therefore may be greater than what is depicted. |
Footnote^ |
Rounded value of investments is less than 0.1% of net assets. | |
|
| Material Fund Change [Text Block] |
|
|
| C000154278 |
|
|
| Shareholder Report [Line Items] |
|
|
| Fund Name |
PIMCO RAE US Fund
|
|
| Class Name |
Institutional Class
|
|
| Trading Symbol |
PKAIX
|
|
| Annual or Semi-Annual Statement [Text Block] |
This annual shareholder report contains important information about the PIMCO RAE US Fund (the "Fund") for the period of July 1, 2024 to June 30, 2025 (the "reporting period").
|
|
| Shareholder Report Annual or Semi-Annual |
Annual Shareholder Report
|
|
| Additional Information [Text Block] |
You can find additional information about the Fund at www.pimco.com/literature. You can also request this information by contacting us at 888.87.PIMCO (888.877.4626).
|
|
| Additional Information Website |
www.pimco.com/literature
|
|
| Expenses [Text Block] |
What were the Fund costs for the reporting period?(based on a hypothetical $10,000 investment)
Class Name |
Cost of a $10,000 investment |
Costs paid as a percentage of a $10,000 investment |
Institutional Class |
$41 |
0.40% | |
|
| Expenses Paid, Amount |
$ 41
|
|
| Expense Ratio, Percent |
0.40%
|
|
| Factors Affecting Performance [Text Block] |
How did the Fund perform during the reporting period and what affected its performance?The following affected performance (on a gross basis) during the reporting period: Overweight exposure to, and security selection in, the consumer staples sector contributed to relative returns, as the sector and the Fund's holdings outperformed the Russell 1000® Value Index (the "Index"). Security selection in the utilities sector contributed to relative returns, as the Fund's holdings outperformed the Index. Security selection in the healthcare sector contributed to relative returns, as the Fund's holdings outperformed the Index. Overweight exposure to, and security selection in, the information technology sector detracted from relative returns, as the sector and the Fund's holdings underperformed the Index. Underweight exposure to, and security selection in, the financials sector detracted from relative returns, as the sector outperformed the Index and the Fund's holdings underperformed the Index. Overweight exposure to, and security selection in, the energy sector detracted from relative returns, as the sector and the Fund's holdings underperformed the Index.
|
|
| Performance Past Does Not Indicate Future [Text] |
Performance quoted represents past performance. Past performance is not a guarantee or a reliable indicator of future results.
|
|
| Average Annual Return [Table Text Block] |
Class/Index Name |
1 Year |
5 Years |
10 Years |
Institutional Class |
6.41% |
15.97% |
10.33% |
S&P 500 Index |
15.16% |
16.64% |
13.65% |
Russell 1000® Value Index |
13.70% |
13.93% |
9.19% | |
|
| No Deduction of Taxes [Text Block] |
Returns shown do not reflect the deduction of taxes that a shareholder would pay on Fund distributions or the redemption of Fund shares.
|
|
| Performance Table Market Index Changed [Text Block] |
Differences in the Fund’s performance versus an index and related attribution information with respect to particular categories of securities or individual positions may be attributable, in part, to differences in the pricing methodologies used by the Fund and the index.
|
|
| Updated Performance Information Location [Text Block] |
For performance current to the most recent month-end, visit www.pimco.com/literature or via 888.87.PIMCO (888.877.4626).
|
|
| AssetsNet |
$ 1,388,310,000
|
|
| Holdings Count | Holding |
143
|
|
| Advisory Fees Paid, Amount |
$ 3,603,000
|
|
| InvestmentCompanyPortfolioTurnover |
57.00%
|
|
| Additional Fund Statistics [Text Block] |
Key Fund StatisticsFootnote Reference† (as of the end of the reporting period)
Total Net Assets |
$1,388,310 |
# of Portfolio Holdings |
143 |
Portfolio Turnover Rate |
57% |
Total Net Advisory Fees Paid During the Reporting Period |
$3,603 |
| Footnote |
Description |
Footnote† |
Dollar amounts displayed in 000's | |
|
| Holdings [Text Block] |
Sector Breakdown (% of Net Asset Value)Footnote Reference*
Information Technology |
22.5% |
Health Care |
17.2% |
Consumer Staples |
12.6% |
Financials |
9.2% |
Energy |
8.2% |
Industrials |
8.0% |
Consumer Discretionary |
7.7% |
Communication Services |
7.4% |
Materials |
2.8% |
Utilities |
2.2% |
Real Estate |
1.9% |
Short-Term Instruments |
0.0%Footnote Reference^ |
Affiliated Investments |
1.8% |
Other Assets and Liabilities, Net |
(1.5%) |
Total |
100.0% |
| Footnote |
Description |
Footnote* |
% of Net Asset Value includes derivatives instruments, if any, valued at the value used for determining the Fund’s net asset value. The notional exposure of such derivatives investments therefore may be greater than what is depicted. |
Footnote^ |
Rounded value of investments is less than 0.1% of net assets. | |
|
| Material Fund Change [Text Block] |
|
|
| C000154279 |
|
|
| Shareholder Report [Line Items] |
|
|
| Fund Name |
PIMCO RAE US Fund
|
|
| Class Name |
I-2
|
|
| Trading Symbol |
PKAPX
|
|
| Annual or Semi-Annual Statement [Text Block] |
This annual shareholder report contains important information about the PIMCO RAE US Fund (the "Fund") for the period of July 1, 2024 to June 30, 2025 (the "reporting period").
|
|
| Shareholder Report Annual or Semi-Annual |
Annual Shareholder Report
|
|
| Additional Information [Text Block] |
You can find additional information about the Fund at www.pimco.com/literature. You can also request this information by contacting us at 888.87.PIMCO (888.877.4626).
|
|
| Additional Information Website |
www.pimco.com/literature
|
|
| Expenses [Text Block] |
What were the Fund costs for the reporting period?(based on a hypothetical $10,000 investment)
Class Name |
Cost of a $10,000 investment |
Costs paid as a percentage of a $10,000 investment |
I-2 |
$52 |
0.50% | |
|
| Expenses Paid, Amount |
$ 52
|
|
| Expense Ratio, Percent |
0.50%
|
|
| Factors Affecting Performance [Text Block] |
How did the Fund perform during the reporting period and what affected its performance?The following affected performance (on a gross basis) during the reporting period: Overweight exposure to, and security selection in, the consumer staples sector contributed to relative returns, as the sector and the Fund's holdings outperformed the Russell 1000® Value Index (the "Index"). Security selection in the utilities sector contributed to relative returns, as the Fund's holdings outperformed the Index. Security selection in the healthcare sector contributed to relative returns, as the Fund's holdings outperformed the Index. Overweight exposure to, and security selection in, the information technology sector detracted from relative returns, as the sector and the Fund's holdings underperformed the Index. Underweight exposure to, and security selection in, the financials sector detracted from relative returns, as the sector outperformed the Index and the Fund's holdings underperformed the Index. Overweight exposure to, and security selection in, the energy sector detracted from relative returns, as the sector and the Fund's holdings underperformed the Index.
|
|
| Performance Past Does Not Indicate Future [Text] |
Performance quoted represents past performance. Past performance is not a guarantee or a reliable indicator of future results.
|
|
| Average Annual Return [Table Text Block] |
Class/Index Name |
1 Year |
5 Years |
10 Years |
I-2 |
6.35% |
15.86% |
10.23% |
S&P 500 Index |
15.16% |
16.64% |
13.65% |
Russell 1000® Value Index |
13.70% |
13.93% |
9.19% | |
|
| No Deduction of Taxes [Text Block] |
Returns shown do not reflect the deduction of taxes that a shareholder would pay on Fund distributions or the redemption of Fund shares.
|
|
| Performance Table Market Index Changed [Text Block] |
Differences in the Fund’s performance versus an index and related attribution information with respect to particular categories of securities or individual positions may be attributable, in part, to differences in the pricing methodologies used by the Fund and the index.
|
|
| Updated Performance Information Location [Text Block] |
For performance current to the most recent month-end, visit www.pimco.com/literature or via 888.87.PIMCO (888.877.4626).
|
|
| AssetsNet |
$ 1,388,310,000
|
|
| Holdings Count | Holding |
143
|
|
| Advisory Fees Paid, Amount |
$ 3,603,000
|
|
| InvestmentCompanyPortfolioTurnover |
57.00%
|
|
| Additional Fund Statistics [Text Block] |
Key Fund StatisticsFootnote Reference† (as of the end of the reporting period)
Total Net Assets |
$1,388,310 |
# of Portfolio Holdings |
143 |
Portfolio Turnover Rate |
57% |
Total Net Advisory Fees Paid During the Reporting Period |
$3,603 |
| Footnote |
Description |
Footnote† |
Dollar amounts displayed in 000's | |
|
| Holdings [Text Block] |
Sector Breakdown (% of Net Asset Value)Footnote Reference*
Information Technology |
22.5% |
Health Care |
17.2% |
Consumer Staples |
12.6% |
Financials |
9.2% |
Energy |
8.2% |
Industrials |
8.0% |
Consumer Discretionary |
7.7% |
Communication Services |
7.4% |
Materials |
2.8% |
Utilities |
2.2% |
Real Estate |
1.9% |
Short-Term Instruments |
0.0%Footnote Reference^ |
Affiliated Investments |
1.8% |
Other Assets and Liabilities, Net |
(1.5%) |
Total |
100.0% |
| Footnote |
Description |
Footnote* |
% of Net Asset Value includes derivatives instruments, if any, valued at the value used for determining the Fund’s net asset value. The notional exposure of such derivatives investments therefore may be greater than what is depicted. |
Footnote^ |
Rounded value of investments is less than 0.1% of net assets. | |
|
| Material Fund Change [Text Block] |
|
|
| C000154289 |
|
|
| Shareholder Report [Line Items] |
|
|
| Fund Name |
PIMCO RAE US Small Fund
|
|
| Class Name |
Class A
|
|
| Trading Symbol |
PMJAX
|
|
| Annual or Semi-Annual Statement [Text Block] |
This annual shareholder report contains important information about the PIMCO RAE US Small Fund (the "Fund") for the period of July 1, 2024 to June 30, 2025 (the "reporting period").
|
|
| Shareholder Report Annual or Semi-Annual |
Annual Shareholder Report
|
|
| Additional Information [Text Block] |
You can find additional information about the Fund at www.pimco.com/literature. You can also request this information by contacting us at 888.87.PIMCO (888.877.4626).
|
|
| Additional Information Website |
www.pimco.com/literature
|
|
| Expenses [Text Block] |
What were the Fund costs for the reporting period?(based on a hypothetical $10,000 investment)
Class Name |
Cost of a $10,000 investment |
Costs paid as a percentage of a $10,000 investment |
Class A |
$92 |
0.90% | |
|
| Expenses Paid, Amount |
$ 92
|
|
| Expense Ratio, Percent |
0.90%
|
|
| Factors Affecting Performance [Text Block] |
How did the Fund perform during the reporting period and what affected its performance?The following affected performance (on a gross basis) during the reporting period: Overweight exposure to, and security selection in, the consumer staples sector contributed to relative returns, as the sector and the Fund's holdings outperformed the Russell 2000® Value Index (the "Index"). Underweight exposure to, and security selection in, the energy sector contributed to relative returns, as the sector underperformed the Index and the Fund's holdings outperformed the Index. Overweight exposure to, and security selection in, the industrials sector contributed to relative returns, as the sector and the Fund's holdings outperformed the Index. Overweight exposure to, and security selection in, the consumer discretionary sector detracted from relative returns, as the sector and the Fund's holdings underperformed the Index. Security selection in the materials sector detracted from relative returns, as the Fund's holdings underperformed the Index. Security selection in the communication services sector detracted from relative returns, as the Fund's holdings underperformed the Index.
|
|
| Performance Past Does Not Indicate Future [Text] |
Performance quoted represents past performance. Past performance is not a guarantee or a reliable indicator of future results.
|
|
| Line Graph [Table Text Block] |
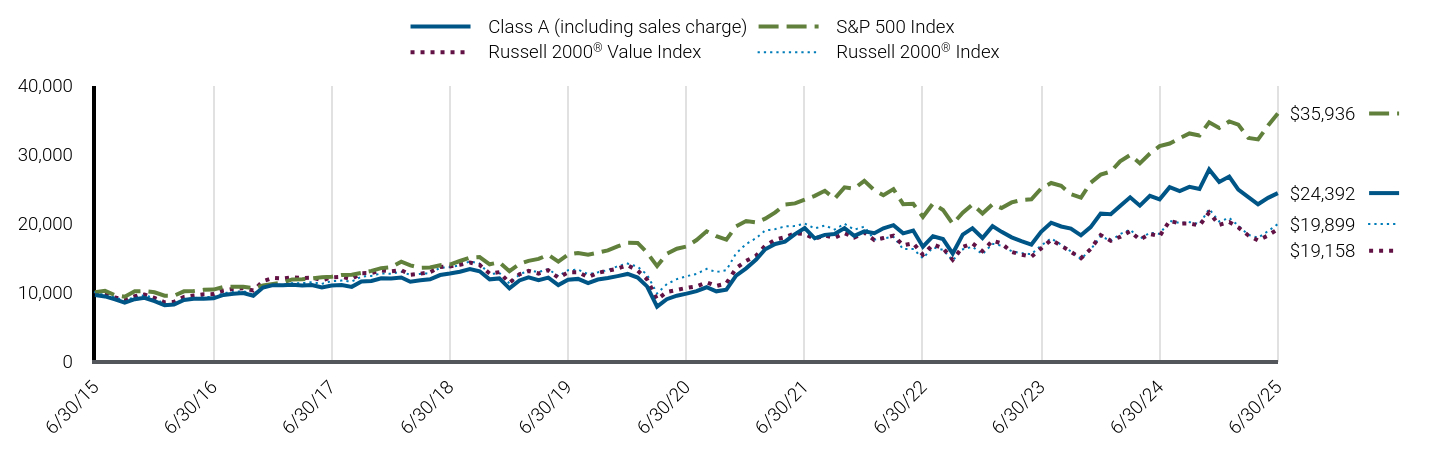
|
Class A (including sales charge) |
S&P 500 Index |
Russell 2000® Value Index |
Russell 2000® Index |
6/30/15 |
$9,622 |
$10,000 |
$10,000 |
$10,000 |
7/31/15 |
$9,408 |
$10,210 |
$9,724 |
$9,884 |
8/31/15 |
$8,982 |
$9,594 |
$9,247 |
$9,263 |
9/30/15 |
$8,506 |
$9,356 |
$8,927 |
$8,808 |
10/31/15 |
$9,011 |
$10,145 |
$9,426 |
$9,305 |
11/30/15 |
$9,214 |
$10,176 |
$9,694 |
$9,607 |
12/31/15 |
$8,717 |
$10,015 |
$9,183 |
$9,125 |
1/31/16 |
$8,128 |
$9,518 |
$8,566 |
$8,322 |
2/29/16 |
$8,226 |
$9,505 |
$8,625 |
$8,322 |
3/31/16 |
$8,904 |
$10,150 |
$9,340 |
$8,986 |
4/30/16 |
$9,071 |
$10,189 |
$9,537 |
$9,127 |
5/31/16 |
$9,081 |
$10,372 |
$9,712 |
$9,333 |
6/30/16 |
$9,130 |
$10,399 |
$9,742 |
$9,327 |
7/31/16 |
$9,621 |
$10,783 |
$10,267 |
$9,884 |
8/31/16 |
$9,798 |
$10,798 |
$10,522 |
$10,059 |
9/30/16 |
$9,887 |
$10,800 |
$10,605 |
$10,171 |
10/31/16 |
$9,513 |
$10,603 |
$10,257 |
$9,687 |
11/30/16 |
$10,693 |
$10,996 |
$11,618 |
$10,767 |
12/31/16 |
$11,045 |
$11,213 |
$12,098 |
$11,069 |
1/31/17 |
$11,015 |
$11,426 |
$12,012 |
$11,113 |
2/28/17 |
$11,084 |
$11,879 |
$12,185 |
$11,327 |
3/31/17 |
$10,985 |
$11,893 |
$12,082 |
$11,342 |
4/30/17 |
$11,055 |
$12,015 |
$12,130 |
$11,466 |
5/31/17 |
$10,707 |
$12,184 |
$11,752 |
$11,233 |
6/30/17 |
$10,985 |
$12,260 |
$12,163 |
$11,622 |
7/31/17 |
$11,064 |
$12,512 |
$12,240 |
$11,708 |
8/31/17 |
$10,796 |
$12,551 |
$11,939 |
$11,559 |
9/30/17 |
$11,581 |
$12,810 |
$12,785 |
$12,280 |
10/31/17 |
$11,651 |
$13,109 |
$12,801 |
$12,385 |
11/30/17 |
$12,039 |
$13,511 |
$13,172 |
$12,742 |
12/31/17 |
$12,017 |
$13,661 |
$13,046 |
$12,690 |
1/31/18 |
$12,163 |
$14,443 |
$13,207 |
$13,022 |
2/28/18 |
$11,539 |
$13,911 |
$12,546 |
$12,518 |
3/31/18 |
$11,747 |
$13,557 |
$12,702 |
$12,680 |
4/30/18 |
$11,882 |
$13,609 |
$12,922 |
$12,789 |
5/31/18 |
$12,506 |
$13,937 |
$13,673 |
$13,566 |
6/30/18 |
$12,724 |
$14,023 |
$13,756 |
$13,663 |
7/31/18 |
$12,984 |
$14,544 |
$13,999 |
$13,901 |
8/31/18 |
$13,389 |
$15,018 |
$14,333 |
$14,500 |
9/30/18 |
$13,057 |
$15,104 |
$13,977 |
$14,152 |
10/31/18 |
$11,882 |
$14,072 |
$12,726 |
$12,615 |
11/30/18 |
$12,017 |
$14,358 |
$12,931 |
$12,815 |
12/31/18 |
$10,578 |
$13,062 |
$11,368 |
$11,293 |
1/31/19 |
$11,727 |
$14,109 |
$12,611 |
$12,563 |
2/28/19 |
$12,162 |
$14,562 |
$13,101 |
$13,216 |
3/31/19 |
$11,772 |
$14,845 |
$12,724 |
$12,940 |
4/30/19 |
$12,140 |
$15,446 |
$13,205 |
$13,379 |
5/31/19 |
$11,057 |
$14,464 |
$12,126 |
$12,339 |
6/30/19 |
$11,827 |
$15,483 |
$12,899 |
$13,211 |
7/31/19 |
$11,950 |
$15,706 |
$12,919 |
$13,287 |
8/31/19 |
$11,325 |
$15,457 |
$12,198 |
$12,631 |
9/30/19 |
$11,861 |
$15,746 |
$12,825 |
$12,894 |
10/31/19 |
$12,073 |
$16,087 |
$13,135 |
$13,233 |
11/30/19 |
$12,352 |
$16,671 |
$13,443 |
$13,778 |
12/31/19 |
$12,668 |
$17,175 |
$13,914 |
$14,175 |
1/31/20 |
$12,136 |
$17,168 |
$13,163 |
$13,721 |
2/29/20 |
$10,869 |
$15,755 |
$11,884 |
$12,566 |
3/31/20 |
$7,929 |
$13,809 |
$8,952 |
$9,836 |
4/30/20 |
$9,003 |
$15,579 |
$10,056 |
$11,187 |
5/31/20 |
$9,512 |
$16,321 |
$10,345 |
$11,915 |
6/30/20 |
$9,817 |
$16,645 |
$10,644 |
$12,336 |
7/31/20 |
$10,179 |
$17,584 |
$10,864 |
$12,677 |
8/31/20 |
$10,734 |
$18,848 |
$11,449 |
$13,391 |
9/30/20 |
$10,145 |
$18,132 |
$10,916 |
$12,944 |
10/31/20 |
$10,383 |
$17,650 |
$11,307 |
$13,215 |
11/30/20 |
$12,430 |
$19,582 |
$13,490 |
$15,651 |
12/31/20 |
$13,484 |
$20,334 |
$14,559 |
$17,005 |
1/31/21 |
$14,746 |
$20,129 |
$15,324 |
$17,860 |
2/28/21 |
$16,243 |
$20,684 |
$16,764 |
$18,974 |
3/31/21 |
$17,010 |
$21,590 |
$17,640 |
$19,164 |
4/30/21 |
$17,356 |
$22,742 |
$17,997 |
$19,567 |
5/31/21 |
$18,445 |
$22,901 |
$18,557 |
$19,607 |
6/30/21 |
$19,323 |
$23,436 |
$18,445 |
$19,987 |
7/31/21 |
$17,838 |
$23,993 |
$17,785 |
$19,265 |
8/31/21 |
$18,333 |
$24,722 |
$18,261 |
$19,696 |
9/30/21 |
$18,457 |
$23,572 |
$17,895 |
$19,115 |
10/31/21 |
$19,310 |
$25,224 |
$18,577 |
$19,929 |
11/30/21 |
$18,197 |
$25,049 |
$17,943 |
$19,098 |
12/31/21 |
$18,844 |
$26,172 |
$18,675 |
$19,525 |
1/31/22 |
$18,574 |
$24,817 |
$17,586 |
$17,645 |
2/28/22 |
$19,281 |
$24,074 |
$17,877 |
$17,833 |
3/31/22 |
$19,738 |
$24,968 |
$18,227 |
$18,055 |
4/30/22 |
$18,553 |
$22,791 |
$16,812 |
$16,266 |
5/31/22 |
$18,969 |
$22,833 |
$17,135 |
$16,290 |
6/30/22 |
$16,621 |
$20,948 |
$15,442 |
$14,951 |
7/31/22 |
$18,138 |
$22,879 |
$16,937 |
$16,512 |
8/31/22 |
$17,722 |
$21,946 |
$16,402 |
$16,174 |
9/30/22 |
$15,624 |
$19,925 |
$14,730 |
$14,624 |
10/31/22 |
$18,366 |
$21,538 |
$16,585 |
$16,234 |
11/30/22 |
$19,301 |
$22,742 |
$17,091 |
$16,613 |
12/31/22 |
$17,885 |
$21,432 |
$15,970 |
$15,535 |
1/31/23 |
$19,596 |
$22,778 |
$17,494 |
$17,049 |
2/28/23 |
$18,774 |
$22,223 |
$17,091 |
$16,761 |
3/31/23 |
$17,976 |
$23,038 |
$15,865 |
$15,960 |
4/30/23 |
$17,428 |
$23,398 |
$15,469 |
$15,673 |
5/31/23 |
$16,927 |
$23,500 |
$15,165 |
$15,528 |
6/30/23 |
$18,774 |
$25,053 |
$16,370 |
$16,791 |
7/31/23 |
$20,097 |
$25,857 |
$17,605 |
$17,817 |
8/31/23 |
$19,550 |
$25,446 |
$16,758 |
$16,926 |
9/30/23 |
$19,253 |
$24,232 |
$15,885 |
$15,930 |
10/31/23 |
$18,272 |
$23,723 |
$14,938 |
$14,843 |
11/30/23 |
$19,459 |
$25,889 |
$16,282 |
$16,187 |
12/31/23 |
$21,416 |
$27,066 |
$18,309 |
$18,164 |
1/31/24 |
$21,323 |
$27,520 |
$17,477 |
$17,458 |
2/29/24 |
$22,526 |
$28,990 |
$18,049 |
$18,445 |
3/31/24 |
$23,775 |
$29,923 |
$18,840 |
$19,105 |
4/30/24 |
$22,572 |
$28,700 |
$17,640 |
$17,761 |
5/31/24 |
$24,006 |
$30,124 |
$18,465 |
$18,652 |
6/30/24 |
$23,497 |
$31,204 |
$18,154 |
$18,479 |
7/31/24 |
$25,255 |
$31,584 |
$20,366 |
$20,357 |
8/31/24 |
$24,677 |
$32,350 |
$19,984 |
$20,053 |
9/30/24 |
$25,301 |
$33,041 |
$19,996 |
$20,193 |
10/31/24 |
$24,977 |
$32,742 |
$19,684 |
$19,901 |
11/30/24 |
$27,822 |
$34,664 |
$21,582 |
$22,084 |
12/31/24 |
$26,013 |
$33,837 |
$19,784 |
$20,260 |
1/31/25 |
$26,800 |
$34,780 |
$20,190 |
$20,791 |
2/28/25 |
$24,893 |
$34,326 |
$19,417 |
$19,679 |
3/31/25 |
$23,820 |
$32,392 |
$18,252 |
$18,340 |
4/30/25 |
$22,771 |
$32,172 |
$17,519 |
$17,916 |
5/31/25 |
$23,701 |
$34,197 |
$18,255 |
$18,873 |
6/30/25 |
$24,392 |
$35,936 |
$19,158 |
$19,899 |
|
|
| Average Annual Return [Table Text Block] |
Class/Index Name |
1 Year |
5 Years |
10 Years |
Class A (excluding sales charge) |
3.81% |
19.96% |
9.75% |
Class A (including sales charge) |
(0.12%) |
19.05% |
9.33% |
S&P 500 Index |
15.16% |
16.64% |
13.65% |
Russell 2000® Value Index |
5.54% |
12.47% |
6.72% |
Russell 2000® Index |
7.68% |
10.04% |
7.12% | |
|
| No Deduction of Taxes [Text Block] |
Returns shown do not reflect the deduction of taxes that a shareholder would pay on Fund distributions or the redemption of Fund shares.
|
|
| Performance Table Market Index Changed [Text Block] |
Differences in the Fund’s performance versus an index and related attribution information with respect to particular categories of securities or individual positions may be attributable, in part, to differences in the pricing methodologies used by the Fund and the index.
|
|
| Updated Performance Information Location [Text Block] |
For performance current to the most recent month-end, visit www.pimco.com/literature or via 888.87.PIMCO (888.877.4626).
|
|
| AssetsNet |
$ 1,981,345,000
|
|
| Holdings Count | Holding |
320
|
|
| Advisory Fees Paid, Amount |
$ 5,808,000
|
|
| InvestmentCompanyPortfolioTurnover |
59.00%
|
|
| Additional Fund Statistics [Text Block] |
Key Fund StatisticsFootnote Reference† (as of the end of the reporting period)
Total Net Assets |
$1,981,345 |
# of Portfolio Holdings |
320 |
Portfolio Turnover Rate |
59% |
Total Net Advisory Fees Paid During the Reporting Period |
$5,808 |
| Footnote |
Description |
Footnote† |
Dollar amounts displayed in 000's | |
|
| Holdings [Text Block] |
Sector Breakdown (% of Net Asset Value)Footnote Reference*
Financials |
18.4% |
Industrials |
17.9% |
Consumer Discretionary |
16.6% |
Information Technology |
12.4% |
Real Estate |
10.4% |
Health Care |
5.7% |
Consumer Staples |
4.6% |
Materials |
4.3% |
Communication Services |
4.1% |
Utilities |
2.7% |
Energy |
1.9% |
Short-Term Instruments |
0.1% |
Affiliated Investments |
1.8% |
Financial Derivative Instruments |
0.0%Footnote Reference^ |
Other Assets and Liabilities, Net |
(0.9%) |
Total |
100.0% |
| Footnote |
Description |
Footnote* |
% of Net Asset Value includes derivatives instruments, if any, valued at the value used for determining the Fund’s net asset value. The notional exposure of such derivatives investments therefore may be greater than what is depicted. |
Footnote^ |
Rounded value of investments is less than 0.1% of net assets. | |
|
| Material Fund Change [Text Block] |
|
|
| C000154285 |
|
|
| Shareholder Report [Line Items] |
|
|
| Fund Name |
PIMCO RAE US Small Fund
|
|
| Class Name |
Institutional Class
|
|
| Trading Symbol |
PMJIX
|
|
| Annual or Semi-Annual Statement [Text Block] |
This annual shareholder report contains important information about the PIMCO RAE US Small Fund (the "Fund") for the period of July 1, 2024 to June 30, 2025 (the "reporting period").
|
|
| Shareholder Report Annual or Semi-Annual |
Annual Shareholder Report
|
|
| Additional Information [Text Block] |
You can find additional information about the Fund at www.pimco.com/literature. You can also request this information by contacting us at 888.87.PIMCO (888.877.4626).
|
|
| Additional Information Website |
www.pimco.com/literature
|
|
| Expenses [Text Block] |
What were the Fund costs for the reporting period?(based on a hypothetical $10,000 investment)
Class Name |
Cost of a $10,000 investment |
Costs paid as a percentage of a $10,000 investment |
Institutional Class |
$51 |
0.50% | |
|
| Expenses Paid, Amount |
$ 51
|
|
| Expense Ratio, Percent |
0.50%
|
|
| Factors Affecting Performance [Text Block] |
How did the Fund perform during the reporting period and what affected its performance?The following affected performance (on a gross basis) during the reporting period: Overweight exposure to, and security selection in, the consumer staples sector contributed to relative returns, as the sector and the Fund's holdings outperformed the Russell 2000® Value Index (the "Index"). Underweight exposure to, and security selection in, the energy sector contributed to relative returns, as the sector underperformed the Index and the Fund's holdings outperformed the Index. Overweight exposure to, and security selection in, the industrials sector contributed to relative returns, as the sector and the Fund's holdings outperformed the Index. Overweight exposure to, and security selection in, the consumer discretionary sector detracted from relative returns, as the sector and the Fund's holdings underperformed the Index. Security selection in the materials sector detracted from relative returns, as the Fund's holdings underperformed the Index. Security selection in the communication services sector detracted from relative returns, as the Fund's holdings underperformed the Index.
|
|
| Performance Past Does Not Indicate Future [Text] |
Performance quoted represents past performance. Past performance is not a guarantee or a reliable indicator of future results.
|
|
| Line Graph [Table Text Block] |
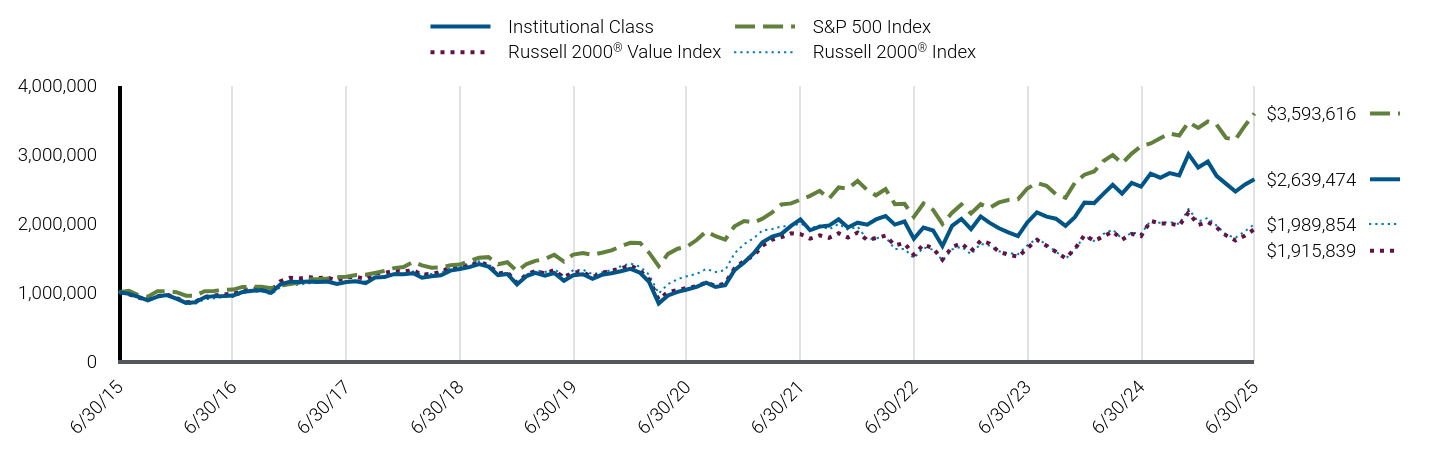
|
Institutional Class |
S&P 500 Index |
Russell 2000® Value Index |
Russell 2000® Index |
6/30/15 |
$1,000,000 |
$1,000,000 |
$1,000,000 |
$1,000,000 |
7/31/15 |
$977,845 |
$1,020,951 |
$972,416 |
$988,380 |
8/31/15 |
$933,535 |
$959,353 |
$924,661 |
$926,270 |
9/30/15 |
$884,189 |
$935,615 |
$892,652 |
$880,827 |
10/31/15 |
$937,563 |
$1,014,539 |
$942,631 |
$930,453 |
11/30/15 |
$959,718 |
$1,017,556 |
$969,428 |
$960,721 |
12/31/15 |
$908,136 |
$1,001,507 |
$918,325 |
$912,483 |
1/31/16 |
$846,706 |
$951,808 |
$856,633 |
$832,248 |
2/29/16 |
$856,944 |
$950,524 |
$862,475 |
$832,215 |
3/31/16 |
$927,589 |
$1,015,006 |
$933,962 |
$898,634 |
4/30/16 |
$944,994 |
$1,018,940 |
$953,744 |
$912,734 |
5/31/16 |
$947,041 |
$1,037,239 |
$971,226 |
$933,289 |
6/30/16 |
$953,184 |
$1,039,926 |
$974,178 |
$932,701 |
7/31/16 |
$1,004,376 |
$1,078,267 |
$1,026,735 |
$988,392 |
8/31/16 |
$1,023,828 |
$1,079,781 |
$1,052,249 |
$1,005,867 |
9/30/16 |
$1,032,019 |
$1,079,985 |
$1,060,541 |
$1,017,072 |
10/31/16 |
$994,137 |
$1,060,285 |
$1,025,681 |
$968,721 |
11/30/16 |
$1,118,021 |
$1,099,552 |
$1,161,820 |
$1,076,743 |
12/31/16 |
$1,154,619 |
$1,121,286 |
$1,209,791 |
$1,106,913 |
1/31/17 |
$1,151,510 |
$1,142,553 |
$1,201,154 |
$1,111,274 |
2/28/17 |
$1,158,765 |
$1,187,919 |
$1,218,534 |
$1,132,722 |
3/31/17 |
$1,149,437 |
$1,189,305 |
$1,208,213 |
$1,134,206 |
4/30/17 |
$1,156,692 |
$1,201,519 |
$1,212,974 |
$1,146,648 |
5/31/17 |
$1,121,453 |
$1,218,428 |
$1,175,202 |
$1,123,325 |
6/30/17 |
$1,150,473 |
$1,226,033 |
$1,216,310 |
$1,162,158 |
7/31/17 |
$1,159,802 |
$1,251,243 |
$1,224,009 |
$1,170,793 |
8/31/17 |
$1,131,817 |
$1,255,074 |
$1,193,923 |
$1,155,901 |
9/30/17 |
$1,214,734 |
$1,280,963 |
$1,278,453 |
$1,228,041 |
10/31/17 |
$1,221,989 |
$1,310,855 |
$1,280,128 |
$1,238,504 |
11/30/17 |
$1,263,448 |
$1,351,059 |
$1,317,175 |
$1,274,197 |
12/31/17 |
$1,261,664 |
$1,366,081 |
$1,304,609 |
$1,269,049 |
1/31/18 |
$1,276,865 |
$1,444,294 |
$1,320,682 |
$1,302,210 |
2/28/18 |
$1,212,805 |
$1,391,062 |
$1,254,648 |
$1,251,788 |
3/31/18 |
$1,233,434 |
$1,355,710 |
$1,270,167 |
$1,267,974 |
4/30/18 |
$1,248,635 |
$1,360,912 |
$1,292,179 |
$1,278,942 |
5/31/18 |
$1,314,867 |
$1,393,686 |
$1,367,346 |
$1,356,573 |
6/30/18 |
$1,338,754 |
$1,402,264 |
$1,375,632 |
$1,366,300 |
7/31/18 |
$1,365,898 |
$1,454,447 |
$1,399,925 |
$1,390,115 |
8/31/18 |
$1,409,329 |
$1,501,841 |
$1,433,272 |
$1,450,043 |
9/30/18 |
$1,374,584 |
$1,510,389 |
$1,397,712 |
$1,415,169 |
10/31/18 |
$1,250,806 |
$1,407,154 |
$1,272,575 |
$1,261,453 |
11/30/18 |
$1,266,007 |
$1,435,829 |
$1,293,089 |
$1,281,498 |
12/31/18 |
$1,114,532 |
$1,306,187 |
$1,136,780 |
$1,129,269 |
1/31/19 |
$1,235,651 |
$1,410,859 |
$1,261,121 |
$1,256,311 |
2/28/19 |
$1,282,236 |
$1,456,159 |
$1,310,141 |
$1,321,627 |
3/31/19 |
$1,241,474 |
$1,484,455 |
$1,272,370 |
$1,293,965 |
4/30/19 |
$1,281,071 |
$1,544,560 |
$1,320,491 |
$1,337,921 |
5/31/19 |
$1,166,939 |
$1,446,406 |
$1,212,633 |
$1,233,871 |
6/30/19 |
$1,248,462 |
$1,548,343 |
$1,289,866 |
$1,321,081 |
7/31/19 |
$1,262,437 |
$1,570,597 |
$1,291,942 |
$1,328,691 |
8/31/19 |
$1,197,219 |
$1,545,718 |
$1,219,839 |
$1,263,093 |
9/30/19 |
$1,254,285 |
$1,574,639 |
$1,282,478 |
$1,289,378 |
10/31/19 |
$1,277,577 |
$1,608,745 |
$1,313,539 |
$1,323,340 |
11/30/19 |
$1,306,693 |
$1,667,141 |
$1,344,289 |
$1,377,809 |
12/31/19 |
$1,339,905 |
$1,717,458 |
$1,391,353 |
$1,417,531 |
1/31/20 |
$1,284,322 |
$1,716,785 |
$1,316,303 |
$1,372,071 |
2/29/20 |
$1,150,686 |
$1,575,461 |
$1,188,398 |
$1,256,570 |
3/31/20 |
$839,658 |
$1,380,871 |
$895,197 |
$983,568 |
4/30/20 |
$954,372 |
$1,557,890 |
$1,005,628 |
$1,118,661 |
5/31/20 |
$1,007,590 |
$1,632,089 |
$1,034,490 |
$1,191,452 |
6/30/20 |
$1,040,703 |
$1,664,547 |
$1,064,438 |
$1,233,570 |
7/31/20 |
$1,079,729 |
$1,758,403 |
$1,086,397 |
$1,267,715 |
8/31/20 |
$1,138,860 |
$1,884,798 |
$1,144,922 |
$1,339,138 |
9/30/20 |
$1,077,364 |
$1,813,182 |
$1,091,648 |
$1,294,411 |
10/31/20 |
$1,103,382 |
$1,764,962 |
$1,130,697 |
$1,321,516 |
11/30/20 |
$1,320,983 |
$1,958,162 |
$1,349,000 |
$1,565,098 |
12/31/20 |
$1,432,099 |
$2,033,450 |
$1,455,854 |
$1,700,479 |
1/31/21 |
$1,567,935 |
$2,012,921 |
$1,532,447 |
$1,786,047 |
2/28/21 |
$1,727,058 |
$2,068,427 |
$1,676,420 |
$1,897,371 |
3/31/21 |
$1,809,853 |
$2,159,015 |
$1,764,030 |
$1,916,421 |
4/30/21 |
$1,847,369 |
$2,274,239 |
$1,799,717 |
$1,956,666 |
5/31/21 |
$1,963,800 |
$2,290,123 |
$1,855,724 |
$1,960,696 |
6/30/21 |
$2,056,945 |
$2,343,585 |
$1,844,478 |
$1,998,675 |
7/31/21 |
$1,900,410 |
$2,399,257 |
$1,778,464 |
$1,926,503 |
8/31/21 |
$1,953,451 |
$2,472,208 |
$1,826,091 |
$1,969,599 |
9/30/21 |
$1,967,681 |
$2,357,226 |
$1,789,515 |
$1,911,535 |
10/31/21 |
$2,058,239 |
$2,522,377 |
$1,857,749 |
$1,992,852 |
11/30/21 |
$1,940,514 |
$2,504,900 |
$1,794,288 |
$1,909,809 |
12/31/21 |
$2,010,196 |
$2,617,160 |
$1,867,459 |
$1,952,475 |
1/31/22 |
$1,982,277 |
$2,481,730 |
$1,758,586 |
$1,764,510 |
2/28/22 |
$2,057,444 |
$2,407,423 |
$1,787,691 |
$1,783,337 |
3/31/22 |
$2,106,840 |
$2,496,810 |
$1,822,676 |
$1,805,540 |
4/30/22 |
$1,982,277 |
$2,279,083 |
$1,681,218 |
$1,626,593 |
5/31/22 |
$2,027,377 |
$2,283,265 |
$1,713,481 |
$1,629,049 |
6/30/22 |
$1,776,103 |
$2,094,795 |
$1,544,206 |
$1,495,076 |
7/31/22 |
$1,939,324 |
$2,287,945 |
$1,693,716 |
$1,651,162 |
8/31/22 |
$1,896,371 |
$2,194,638 |
$1,640,161 |
$1,617,379 |
9/30/22 |
$1,670,868 |
$1,992,515 |
$1,473,028 |
$1,462,369 |
10/31/22 |
$1,965,096 |
$2,153,832 |
$1,658,468 |
$1,623,362 |
11/30/22 |
$2,066,035 |
$2,274,196 |
$1,709,134 |
$1,661,283 |
12/31/22 |
$1,916,850 |
$2,143,170 |
$1,596,998 |
$1,553,466 |
1/31/23 |
$2,100,529 |
$2,277,834 |
$1,749,399 |
$1,704,882 |
2/28/23 |
$2,011,044 |
$2,222,257 |
$1,709,058 |
$1,676,087 |
3/31/23 |
$1,928,625 |
$2,303,845 |
$1,586,502 |
$1,596,004 |
4/30/23 |
$1,869,753 |
$2,339,805 |
$1,546,934 |
$1,567,307 |
5/31/23 |
$1,815,592 |
$2,349,975 |
$1,516,506 |
$1,552,826 |
6/30/23 |
$2,013,399 |
$2,505,250 |
$1,636,977 |
$1,679,070 |
7/31/23 |
$2,159,400 |
$2,585,731 |
$1,760,504 |
$1,781,745 |
8/31/23 |
$2,098,174 |
$2,544,562 |
$1,675,823 |
$1,692,605 |
9/30/23 |
$2,067,561 |
$2,423,243 |
$1,588,547 |
$1,592,961 |
10/31/23 |
$1,963,947 |
$2,372,291 |
$1,493,790 |
$1,484,321 |
11/30/23 |
$2,091,109 |
$2,588,941 |
$1,628,246 |
$1,618,667 |
12/31/23 |
$2,301,437 |
$2,706,559 |
$1,830,897 |
$1,816,436 |
1/31/24 |
$2,294,268 |
$2,752,040 |
$1,747,738 |
$1,745,795 |
2/29/24 |
$2,423,320 |
$2,898,987 |
$1,804,906 |
$1,844,502 |
3/31/24 |
$2,559,543 |
$2,992,260 |
$1,884,015 |
$1,910,535 |
4/30/24 |
$2,430,490 |
$2,870,043 |
$1,763,966 |
$1,776,071 |
5/31/24 |
$2,585,831 |
$3,012,353 |
$1,846,467 |
$1,865,177 |
6/30/24 |
$2,533,254 |
$3,120,443 |
$1,815,354 |
$1,847,924 |
7/31/24 |
$2,722,053 |
$3,158,426 |
$2,036,591 |
$2,035,673 |
8/31/24 |
$2,662,307 |
$3,235,039 |
$1,998,364 |
$2,005,260 |
9/30/24 |
$2,729,223 |
$3,304,130 |
$1,999,643 |
$2,019,277 |
10/31/24 |
$2,695,765 |
$3,274,166 |
$1,968,369 |
$1,990,119 |
11/30/24 |
$3,004,057 |
$3,466,363 |
$2,158,237 |
$2,208,415 |
12/31/24 |
$2,809,524 |
$3,383,732 |
$1,978,392 |
$2,026,022 |
1/31/25 |
$2,895,782 |
$3,477,960 |
$2,019,028 |
$2,079,144 |
2/28/25 |
$2,688,764 |
$3,432,579 |
$1,941,739 |
$1,967,931 |
3/31/25 |
$2,572,933 |
$3,239,172 |
$1,825,216 |
$1,833,974 |
4/30/25 |
$2,462,031 |
$3,217,208 |
$1,751,915 |
$1,791,609 |
5/31/25 |
$2,565,539 |
$3,419,714 |
$1,825,513 |
$1,887,281 |
6/30/25 |
$2,639,474 |
$3,593,616 |
$1,915,839 |
$1,989,854 |
|
|
| Average Annual Return [Table Text Block] |
Class/Index Name |
1 Year |
5 Years |
10 Years |
Institutional Class |
4.19% |
20.46% |
10.19% |
S&P 500 Index |
15.16% |
16.64% |
13.65% |
Russell 2000® Value Index |
5.54% |
12.47% |
6.72% |
Russell 2000® Index |
7.68% |
10.04% |
7.12% | |
|
| No Deduction of Taxes [Text Block] |
Returns shown do not reflect the deduction of taxes that a shareholder would pay on Fund distributions or the redemption of Fund shares.
|
|
| Performance Table Market Index Changed [Text Block] |
Differences in the Fund’s performance versus an index and related attribution information with respect to particular categories of securities or individual positions may be attributable, in part, to differences in the pricing methodologies used by the Fund and the index.
|
|
| Updated Performance Information Location [Text Block] |
For performance current to the most recent month-end, visit www.pimco.com/literature or via 888.87.PIMCO (888.877.4626).
|
|
| AssetsNet |
$ 1,981,345,000
|
|
| Holdings Count | Holding |
320
|
|
| Advisory Fees Paid, Amount |
$ 5,808,000
|
|
| InvestmentCompanyPortfolioTurnover |
59.00%
|
|
| Additional Fund Statistics [Text Block] |
Key Fund StatisticsFootnote Reference† (as of the end of the reporting period)
Total Net Assets |
$1,981,345 |
# of Portfolio Holdings |
320 |
Portfolio Turnover Rate |
59% |
Total Net Advisory Fees Paid During the Reporting Period |
$5,808 |
| Footnote |
Description |
Footnote† |
Dollar amounts displayed in 000's | |
|
| Holdings [Text Block] |
Sector Breakdown (% of Net Asset Value)Footnote Reference*
Financials |
18.4% |
Industrials |
17.9% |
Consumer Discretionary |
16.6% |
Information Technology |
12.4% |
Real Estate |
10.4% |
Health Care |
5.7% |
Consumer Staples |
4.6% |
Materials |
4.3% |
Communication Services |
4.1% |
Utilities |
2.7% |
Energy |
1.9% |
Short-Term Instruments |
0.1% |
Affiliated Investments |
1.8% |
Financial Derivative Instruments |
0.0%Footnote Reference^ |
Other Assets and Liabilities, Net |
(0.9%) |
Total |
100.0% |
| Footnote |
Description |
Footnote* |
% of Net Asset Value includes derivatives instruments, if any, valued at the value used for determining the Fund’s net asset value. The notional exposure of such derivatives investments therefore may be greater than what is depicted. |
Footnote^ |
Rounded value of investments is less than 0.1% of net assets. | |
|
| Material Fund Change [Text Block] |
|
|
| C000154286 |
|
|
| Shareholder Report [Line Items] |
|
|
| Fund Name |
PIMCO RAE US Small Fund
|
|
| Class Name |
I-2
|
|
| Trading Symbol |
PMJPX
|
|
| Annual or Semi-Annual Statement [Text Block] |
This annual shareholder report contains important information about the PIMCO RAE US Small Fund (the "Fund") for the period of July 1, 2024 to June 30, 2025 (the "reporting period").
|
|
| Shareholder Report Annual or Semi-Annual |
Annual Shareholder Report
|
|
| Additional Information [Text Block] |
You can find additional information about the Fund at www.pimco.com/literature. You can also request this information by contacting us at 888.87.PIMCO (888.877.4626).
|
|
| Additional Information Website |
www.pimco.com/literature
|
|
| Expenses [Text Block] |
What were the Fund costs for the reporting period?(based on a hypothetical $10,000 investment)
Class Name |
Cost of a $10,000 investment |
Costs paid as a percentage of a $10,000 investment |
I-2 |
$61 |
0.60% | |
|
| Expenses Paid, Amount |
$ 61
|
|
| Expense Ratio, Percent |
0.60%
|
|
| Factors Affecting Performance [Text Block] |
How did the Fund perform during the reporting period and what affected its performance?The following affected performance (on a gross basis) during the reporting period: Overweight exposure to, and security selection in, the consumer staples sector contributed to relative returns, as the sector and the Fund's holdings outperformed the Russell 2000® Value Index (the "Index"). Underweight exposure to, and security selection in, the energy sector contributed to relative returns, as the sector underperformed the Index and the Fund's holdings outperformed the Index. Overweight exposure to, and security selection in, the industrials sector contributed to relative returns, as the sector and the Fund's holdings outperformed the Index. Overweight exposure to, and security selection in, the consumer discretionary sector detracted from relative returns, as the sector and the Fund's holdings underperformed the Index. Security selection in the materials sector detracted from relative returns, as the Fund's holdings underperformed the Index. Security selection in the communication services sector detracted from relative returns, as the Fund's holdings underperformed the Index.
|
|
| Performance Past Does Not Indicate Future [Text] |
Performance quoted represents past performance. Past performance is not a guarantee or a reliable indicator of future results.
|
|
| Line Graph [Table Text Block] |
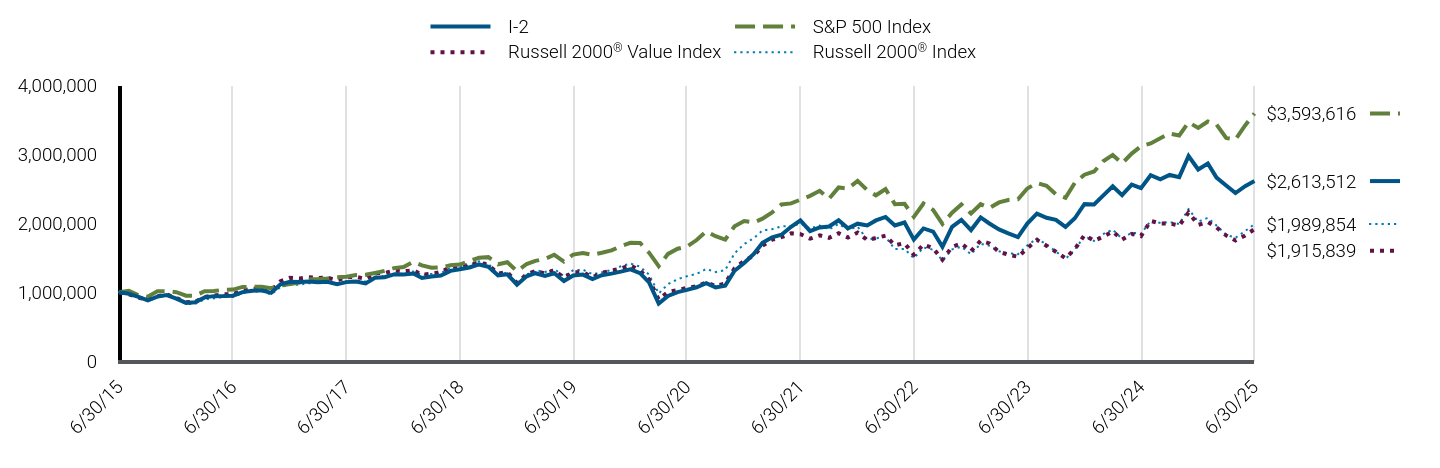
|
I-2 |
S&P 500 Index |
Russell 2000® Value Index |
Russell 2000® Index |
6/30/15 |
$1,000,000 |
$1,000,000 |
$1,000,000 |
$1,000,000 |
7/31/15 |
$978,831 |
$1,020,951 |
$972,416 |
$988,380 |
8/31/15 |
$933,468 |
$959,353 |
$924,661 |
$926,270 |
9/30/15 |
$884,073 |
$935,615 |
$892,652 |
$880,827 |
10/31/15 |
$937,500 |
$1,014,539 |
$942,631 |
$930,453 |
11/30/15 |
$959,677 |
$1,017,556 |
$969,428 |
$960,721 |
12/31/15 |
$907,995 |
$1,001,507 |
$918,325 |
$912,483 |
1/31/16 |
$846,506 |
$951,808 |
$856,633 |
$832,248 |
2/29/16 |
$856,754 |
$950,524 |
$862,475 |
$832,215 |
3/31/16 |
$927,467 |
$1,015,006 |
$933,962 |
$898,634 |
4/30/16 |
$944,889 |
$1,018,940 |
$953,744 |
$912,734 |
5/31/16 |
$945,914 |
$1,037,239 |
$971,226 |
$933,289 |
6/30/16 |
$952,063 |
$1,039,926 |
$974,178 |
$932,701 |
7/31/16 |
$1,003,304 |
$1,078,267 |
$1,026,735 |
$988,392 |
8/31/16 |
$1,021,751 |
$1,079,781 |
$1,052,249 |
$1,005,867 |
9/30/16 |
$1,030,974 |
$1,079,985 |
$1,060,541 |
$1,017,072 |
10/31/16 |
$993,056 |
$1,060,285 |
$1,025,681 |
$968,721 |
11/30/16 |
$1,116,035 |
$1,099,552 |
$1,161,820 |
$1,076,743 |
12/31/16 |
$1,153,315 |
$1,121,286 |
$1,209,791 |
$1,106,913 |
1/31/17 |
$1,150,203 |
$1,142,553 |
$1,201,154 |
$1,111,274 |
2/28/17 |
$1,157,463 |
$1,187,919 |
$1,218,534 |
$1,132,722 |
3/31/17 |
$1,147,092 |
$1,189,305 |
$1,208,213 |
$1,134,206 |
4/30/17 |
$1,154,352 |
$1,201,519 |
$1,212,974 |
$1,146,648 |
5/31/17 |
$1,119,089 |
$1,218,428 |
$1,175,202 |
$1,123,325 |
6/30/17 |
$1,148,129 |
$1,226,033 |
$1,216,310 |
$1,162,158 |
7/31/17 |
$1,157,463 |
$1,251,243 |
$1,224,009 |
$1,170,793 |
8/31/17 |
$1,129,460 |
$1,255,074 |
$1,193,923 |
$1,155,901 |
9/30/17 |
$1,211,395 |
$1,280,963 |
$1,278,453 |
$1,228,041 |
10/31/17 |
$1,219,692 |
$1,310,855 |
$1,280,128 |
$1,238,504 |
11/30/17 |
$1,260,141 |
$1,351,059 |
$1,317,175 |
$1,274,197 |
12/31/17 |
$1,257,825 |
$1,366,081 |
$1,304,609 |
$1,269,049 |
1/31/18 |
$1,273,032 |
$1,444,294 |
$1,320,682 |
$1,302,210 |
2/28/18 |
$1,208,946 |
$1,391,062 |
$1,254,648 |
$1,251,788 |
3/31/18 |
$1,230,670 |
$1,355,710 |
$1,270,167 |
$1,267,974 |
4/30/18 |
$1,244,790 |
$1,360,912 |
$1,292,179 |
$1,278,942 |
5/31/18 |
$1,311,049 |
$1,393,686 |
$1,367,346 |
$1,356,573 |
6/30/18 |
$1,334,945 |
$1,402,264 |
$1,375,632 |
$1,366,300 |
7/31/18 |
$1,361,014 |
$1,454,447 |
$1,399,925 |
$1,390,115 |
8/31/18 |
$1,404,462 |
$1,501,841 |
$1,433,272 |
$1,450,043 |
9/30/18 |
$1,369,704 |
$1,510,389 |
$1,397,712 |
$1,415,169 |
10/31/18 |
$1,246,963 |
$1,407,154 |
$1,272,575 |
$1,261,453 |
11/30/18 |
$1,261,083 |
$1,435,829 |
$1,293,089 |
$1,281,498 |
12/31/18 |
$1,110,683 |
$1,306,187 |
$1,136,780 |
$1,129,269 |
1/31/19 |
$1,231,890 |
$1,410,859 |
$1,261,121 |
$1,256,311 |
2/28/19 |
$1,277,343 |
$1,456,159 |
$1,310,141 |
$1,321,627 |
3/31/19 |
$1,236,552 |
$1,484,455 |
$1,272,370 |
$1,293,965 |
4/30/19 |
$1,276,178 |
$1,544,560 |
$1,320,491 |
$1,337,921 |
5/31/19 |
$1,163,128 |
$1,446,406 |
$1,212,633 |
$1,233,871 |
6/30/19 |
$1,243,545 |
$1,548,343 |
$1,289,866 |
$1,321,081 |
7/31/19 |
$1,257,530 |
$1,570,597 |
$1,291,942 |
$1,328,691 |
8/31/19 |
$1,192,265 |
$1,545,718 |
$1,219,839 |
$1,263,093 |
9/30/19 |
$1,248,207 |
$1,574,639 |
$1,282,478 |
$1,289,378 |
10/31/19 |
$1,271,516 |
$1,608,745 |
$1,313,539 |
$1,323,340 |
11/30/19 |
$1,300,652 |
$1,667,141 |
$1,344,289 |
$1,377,809 |
12/31/19 |
$1,334,269 |
$1,717,458 |
$1,391,353 |
$1,417,531 |
1/31/20 |
$1,278,675 |
$1,716,785 |
$1,316,303 |
$1,372,071 |
2/29/20 |
$1,145,011 |
$1,575,461 |
$1,188,398 |
$1,256,570 |
3/31/20 |
$836,284 |
$1,380,871 |
$895,197 |
$983,568 |
4/30/20 |
$948,656 |
$1,557,890 |
$1,005,628 |
$1,118,661 |
5/31/20 |
$1,003,068 |
$1,632,089 |
$1,034,490 |
$1,191,452 |
6/30/20 |
$1,036,188 |
$1,664,547 |
$1,064,438 |
$1,233,570 |
7/31/20 |
$1,074,039 |
$1,758,403 |
$1,086,397 |
$1,267,715 |
8/31/20 |
$1,132,000 |
$1,884,798 |
$1,144,922 |
$1,339,138 |
9/30/20 |
$1,071,674 |
$1,813,182 |
$1,091,648 |
$1,294,411 |
10/31/20 |
$1,096,514 |
$1,764,962 |
$1,130,697 |
$1,321,516 |
11/30/20 |
$1,312,978 |
$1,958,162 |
$1,349,000 |
$1,565,098 |
12/31/20 |
$1,424,613 |
$2,033,450 |
$1,455,854 |
$1,700,479 |
1/31/21 |
$1,557,887 |
$2,012,921 |
$1,532,447 |
$1,786,047 |
2/28/21 |
$1,717,040 |
$2,068,427 |
$1,676,420 |
$1,897,371 |
3/31/21 |
$1,798,557 |
$2,159,015 |
$1,764,030 |
$1,916,421 |
4/30/21 |
$1,836,081 |
$2,274,239 |
$1,799,717 |
$1,956,666 |
5/31/21 |
$1,951,240 |
$2,290,123 |
$1,855,724 |
$1,960,696 |
6/30/21 |
$2,044,403 |
$2,343,585 |
$1,844,478 |
$1,998,675 |
7/31/21 |
$1,887,838 |
$2,399,257 |
$1,778,464 |
$1,926,503 |
8/31/21 |
$1,940,889 |
$2,472,208 |
$1,826,091 |
$1,969,599 |
9/30/21 |
$1,955,122 |
$2,357,226 |
$1,789,515 |
$1,911,535 |
10/31/21 |
$2,045,697 |
$2,522,377 |
$1,857,749 |
$1,992,852 |
11/30/21 |
$1,927,950 |
$2,504,900 |
$1,794,288 |
$1,909,809 |
12/31/21 |
$1,995,624 |
$2,617,160 |
$1,867,459 |
$1,952,475 |
1/31/22 |
$1,969,735 |
$2,481,730 |
$1,758,586 |
$1,764,510 |
2/28/22 |
$2,043,088 |
$2,407,423 |
$1,787,691 |
$1,783,337 |
3/31/22 |
$2,092,709 |
$2,496,810 |
$1,822,676 |
$1,805,540 |
4/30/22 |
$1,969,735 |
$2,279,083 |
$1,681,218 |
$1,626,593 |
5/31/22 |
$2,012,884 |
$2,283,265 |
$1,713,481 |
$1,629,049 |
6/30/22 |
$1,764,779 |
$2,094,795 |
$1,544,206 |
$1,495,076 |
7/31/22 |
$1,926,586 |
$2,287,945 |
$1,693,716 |
$1,651,162 |
8/31/22 |
$1,881,280 |
$2,194,638 |
$1,640,161 |
$1,617,379 |
9/30/22 |
$1,659,065 |
$1,992,515 |
$1,473,028 |
$1,462,369 |
10/31/22 |
$1,950,318 |
$2,153,832 |
$1,658,468 |
$1,623,362 |
11/30/22 |
$2,051,717 |
$2,274,196 |
$1,709,134 |
$1,661,283 |
12/31/22 |
$1,903,415 |
$2,143,170 |
$1,596,998 |
$1,553,466 |
1/31/23 |
$2,085,707 |
$2,277,834 |
$1,749,399 |
$1,704,882 |
2/28/23 |
$1,998,112 |
$2,222,257 |
$1,709,058 |
$1,676,087 |
3/31/23 |
$1,912,885 |
$2,303,845 |
$1,586,502 |
$1,596,004 |
4/30/23 |
$1,856,066 |
$2,339,805 |
$1,546,934 |
$1,567,307 |
5/31/23 |
$1,801,615 |
$2,349,975 |
$1,516,506 |
$1,552,826 |
6/30/23 |
$1,998,112 |
$2,505,250 |
$1,636,977 |
$1,679,070 |
7/31/23 |
$2,142,526 |
$2,585,731 |
$1,760,504 |
$1,781,745 |
8/31/23 |
$2,080,972 |
$2,544,562 |
$1,675,823 |
$1,692,605 |
9/30/23 |
$2,050,196 |
$2,423,243 |
$1,588,547 |
$1,592,961 |
10/31/23 |
$1,948,396 |
$2,372,291 |
$1,493,790 |
$1,484,321 |
11/30/23 |
$2,073,870 |
$2,588,941 |
$1,628,246 |
$1,618,667 |
12/31/23 |
$2,282,094 |
$2,706,559 |
$1,830,897 |
$1,816,436 |
1/31/24 |
$2,274,887 |
$2,752,040 |
$1,747,738 |
$1,745,795 |
2/29/24 |
$2,402,204 |
$2,898,987 |
$1,804,906 |
$1,844,502 |
3/31/24 |
$2,536,727 |
$2,992,260 |
$1,884,015 |
$1,910,535 |
4/30/24 |
$2,409,410 |
$2,870,043 |
$1,763,966 |
$1,776,071 |
5/31/24 |
$2,563,151 |
$3,012,353 |
$1,846,467 |
$1,865,177 |
6/30/24 |
$2,510,303 |
$3,120,443 |
$1,815,354 |
$1,847,924 |
7/31/24 |
$2,697,675 |
$3,158,426 |
$2,036,591 |
$2,035,673 |
8/31/24 |
$2,637,620 |
$3,235,039 |
$1,998,364 |
$2,005,260 |
9/30/24 |
$2,702,479 |
$3,304,130 |
$1,999,643 |
$2,019,277 |
10/31/24 |
$2,671,251 |
$3,274,166 |
$1,968,369 |
$1,990,119 |
11/30/24 |
$2,976,330 |
$3,466,363 |
$2,158,237 |
$2,208,415 |
12/31/24 |
$2,781,966 |
$3,383,732 |
$1,978,392 |
$2,026,022 |
1/31/25 |
$2,868,670 |
$3,477,960 |
$2,019,028 |
$2,079,144 |
2/28/25 |
$2,663,057 |
$3,432,579 |
$1,941,739 |
$1,967,931 |
3/31/25 |
$2,549,103 |
$3,239,172 |
$1,825,216 |
$1,833,974 |
4/30/25 |
$2,440,104 |
$3,217,208 |
$1,751,915 |
$1,791,609 |
5/31/25 |
$2,539,194 |
$3,419,714 |
$1,825,513 |
$1,887,281 |
6/30/25 |
$2,613,512 |
$3,593,616 |
$1,915,839 |
$1,989,854 |
|
|
| Average Annual Return [Table Text Block] |
Class/Index Name |
1 Year |
5 Years |
10 Years |
I-2 |
4.11% |
20.33% |
10.08% |
S&P 500 Index |
15.16% |
16.64% |
13.65% |
Russell 2000® Value Index |
5.54% |
12.47% |
6.72% |
Russell 2000® Index |
7.68% |
10.04% |
7.12% | |
|
| No Deduction of Taxes [Text Block] |
Returns shown do not reflect the deduction of taxes that a shareholder would pay on Fund distributions or the redemption of Fund shares.
|
|
| Performance Table Market Index Changed [Text Block] |
Differences in the Fund’s performance versus an index and related attribution information with respect to particular categories of securities or individual positions may be attributable, in part, to differences in the pricing methodologies used by the Fund and the index.
|
|
| Updated Performance Information Location [Text Block] |
For performance current to the most recent month-end, visit www.pimco.com/literature or via 888.87.PIMCO (888.877.4626).
|
|
| AssetsNet |
$ 1,981,345,000
|
|
| Holdings Count | Holding |
320
|
|
| Advisory Fees Paid, Amount |
$ 5,808,000
|
|
| InvestmentCompanyPortfolioTurnover |
59.00%
|
|
| Additional Fund Statistics [Text Block] |
Key Fund StatisticsFootnote Reference† (as of the end of the reporting period)
Total Net Assets |
$1,981,345 |
# of Portfolio Holdings |
320 |
Portfolio Turnover Rate |
59% |
Total Net Advisory Fees Paid During the Reporting Period |
$5,808 |
| Footnote |
Description |
Footnote† |
Dollar amounts displayed in 000's | |
|
| Holdings [Text Block] |
Sector Breakdown (% of Net Asset Value)Footnote Reference*
Financials |
18.4% |
Industrials |
17.9% |
Consumer Discretionary |
16.6% |
Information Technology |
12.4% |
Real Estate |
10.4% |
Health Care |
5.7% |
Consumer Staples |
4.6% |
Materials |
4.3% |
Communication Services |
4.1% |
Utilities |
2.7% |
Energy |
1.9% |
Short-Term Instruments |
0.1% |
Affiliated Investments |
1.8% |
Financial Derivative Instruments |
0.0%Footnote Reference^ |
Other Assets and Liabilities, Net |
(0.9%) |
Total |
100.0% |
| Footnote |
Description |
Footnote* |
% of Net Asset Value includes derivatives instruments, if any, valued at the value used for determining the Fund’s net asset value. The notional exposure of such derivatives investments therefore may be greater than what is depicted. |
Footnote^ |
Rounded value of investments is less than 0.1% of net assets. | |
|
| Material Fund Change [Text Block] |
|
|
| C000182353 |
|
|
| Shareholder Report [Line Items] |
|
|
| Fund Name |
PIMCO RAFI Dynamic Multi-Factor Emerging Markets Equity ETF
|
|
| Trading Symbol |
MFEM
|
|
| Security Exchange Name |
NYSEArca
|
|
| Annual or Semi-Annual Statement [Text Block] |
This annual shareholder report contains important information about the PIMCO RAFI Dynamic Multi-Factor Emerging Markets Equity ETF (the "Fund") for the period of July 1, 2024 to June 30, 2025 (the "reporting period").
|
|
| Shareholder Report Annual or Semi-Annual |
Annual Shareholder Report
|
|
| Additional Information [Text Block] |
You can find additional information about the Fund at www.pimco.com/literature. You can also request this information by contacting us at 888.400.4ETF (888.400.4383).
|
|
| Additional Information Website |
www.pimco.com/literature
|
|
| Expenses [Text Block] |
What were the Fund costs for the reporting period?(based on a hypothetical $10,000 investment)
Fund Name |
Cost of a $10,000 investment |
Costs paid as a percentage of a $10,000 investment |
PIMCO RAFI Dynamic Multi-Factor Emerging Markets Equity ETF |
$51 |
0.49% | |
|
| Expenses Paid, Amount |
$ 51
|
|
| Expense Ratio, Percent |
0.49%
|
|
| Factors Affecting Performance [Text Block] |
How did the Fund perform during the reporting period and what affected its performance?The following affected performance (on a gross basis) during the reporting period: Security selection in the financials sector contributed to relative returns, as the Fund’s holdings outperformed the MSCI Emerging Markets Index (the "Index"). Security selection in the industrials sector contributed to relative returns, as the Fund’s holdings outperformed the Index. Security selection in the consumer discretionary sector detracted from relative returns, as the Fund’s holdings underperformed the Index. Security selection in the information technology sector detracted from relative returns, as the Fund’s holdings underperformed the Index. Overweight exposure to, and security selection in, the materials sector detracted from relative returns, as the sector and the Fund’s holdings underperformed the Index.
|
|
| Performance Past Does Not Indicate Future [Text] |
Performance quoted represents past performance. Past performance is not a guarantee or a reliable indicator of future results.
|
|
| Average Annual Return [Table Text Block] |
Fund/Index Name |
1 Year |
5 Years |
Since Inception 8/31/17 |
PIMCO RAFI Dynamic Multi-Factor Emerging Markets Equity ETF (at NAV) |
9.47% |
9.87% |
4.54% |
MSCI Emerging Markets Index |
15.29% |
6.81% |
3.98% |
RAFI Dynamic Multi-Factor Emerging Markets Index |
9.99% |
11.02% |
5.33% | |
|
| No Deduction of Taxes [Text Block] |
Returns shown do not reflect the deduction of taxes that a shareholder would pay on Fund distributions or the redemption of Fund shares.
|
|
| Performance Table Market Index Changed [Text Block] |
Differences in the Fund’s performance versus an index and related attribution information with respect to particular categories of securities or individual positions may be attributable, in part, to differences in the pricing methodologies used by the Fund and the index.
|
|
| Updated Performance Information Location [Text Block] |
For performance current to the most recent month-end, visit www.pimco.com/literature or via 888.400.4ETF (888.400.4383).
|
|
| AssetsNet |
$ 108,739,000
|
|
| Holdings Count | Holding |
755
|
|
| Advisory Fees Paid, Amount |
$ 490,000
|
|
| InvestmentCompanyPortfolioTurnover |
40.00%
|
|
| Additional Fund Statistics [Text Block] |
Key Fund StatisticsFootnote Reference† (as of the end of the reporting period)
Total Net Assets |
$108,739 |
# of Portfolio Holdings |
755 |
Portfolio Turnover Rate |
40% |
Total Net Management Fees Paid During the Reporting Period |
$490 |
| Footnote |
Description |
Footnote† |
Dollar amounts displayed in 000's | |
|
| Holdings [Text Block] |
Geographic Breakdown (% of Net Asset Value)Footnote Reference*
| Footnote |
Description |
Footnote* |
% of Net Asset Value includes derivatives instruments, if any, valued at the value used for determining the Fund's net asset value. The notional exposure of such derivatives investments therefore may be greater than what is depicted. |
Footnote^ |
Rounded value of investments is less than 0.1% of net assets. |
China |
28.1% |
Taiwan |
18.2% |
India |
12.4% |
South Korea |
9.9% |
Brazil |
6.5% |
South Africa |
4.2% |
Thailand |
2.9% |
Mexico |
2.7% |
Hong Kong |
2.4% |
Saudi Arabia |
2.4% |
Malaysia |
2.1% |
Other Countries |
7.4% |
Short-Term Instruments |
0.5% |
Affiliated Investments |
0.0%Footnote Reference^ |
Other Assets and Liabilities, Net |
0.3% |
Total |
100.0% | |
|
| Material Fund Change [Text Block] |
|
|
| C000182354 |
|
|
| Shareholder Report [Line Items] |
|
|
| Fund Name |
PIMCO RAFI Dynamic Multi-Factor International Equity ETF
|
|
| Trading Symbol |
MFDX
|
|
| Security Exchange Name |
NYSEArca
|
|
| Annual or Semi-Annual Statement [Text Block] |
This annual shareholder report contains important information about the PIMCO RAFI Dynamic Multi-Factor International Equity ETF (the "Fund") for the period of July 1, 2024 to June 30, 2025 (the "reporting period").
|
|
| Shareholder Report Annual or Semi-Annual |
Annual Shareholder Report
|
|
| Additional Information [Text Block] |
You can find additional information about the Fund at www.pimco.com/literature. You can also request this information by contacting us at 888.400.4ETF (888.400.4383).
|
|
| Additional Information Website |
www.pimco.com/literature
|
|
| Expenses [Text Block] |
What were the Fund costs for the reporting period?(based on a hypothetical $10,000 investment)
Fund Name |
Cost of a $10,000 investment |
Costs paid as a percentage of a $10,000 investment |
PIMCO RAFI Dynamic Multi-Factor International Equity ETF |
$43 |
0.39% | |
|
| Expenses Paid, Amount |
$ 43
|
|
| Expense Ratio, Percent |
0.39%
|
|
| Factors Affecting Performance [Text Block] |
How did the Fund perform during the reporting period and what affected its performance?The following affected performance (on a gross basis) during the reporting period: Underweight exposure to, and security selection in, the healthcare sector contributed to relative returns, as the sector underperformed the MSCI EAFE Index (the "Index") and the Fund’s holdings outperformed the Index. Underweight exposure to, and security selection in, the information technology sector contributed to relative returns, as the sector underperformed the Index and the Fund’s holdings outperformed the Index. Security selection in the consumer staples sector contributed to relative returns, as the Fund’s holdings outperformed the Index. Security selection in the utilities sector detracted from relative returns, as the Fund’s holdings underperformed the Index. There were no other material detractors for this Fund.
|
|
| Performance Past Does Not Indicate Future [Text] |
Performance quoted represents past performance. Past performance is not a guarantee or a reliable indicator of future results.
|
|
| Average Annual Return [Table Text Block] |
Fund/Index Name |
1 Year |
5 Years |
Since Inception 8/31/17 |
PIMCO RAFI Dynamic Multi-Factor International Equity ETF (at NAV) |
22.80% |
12.56% |
7.58% |
MSCI EAFE Index |
17.73% |
11.16% |
6.94% |
RAFI Dynamic Multi-Factor Developed Ex-U.S. Index |
22.17% |
12.59% |
7.71% | |
|
| No Deduction of Taxes [Text Block] |
Returns shown do not reflect the deduction of taxes that a shareholder would pay on Fund distributions or the redemption of Fund shares.
|
|
| Performance Table Market Index Changed [Text Block] |
Differences in the Fund’s performance versus an index and related attribution information with respect to particular categories of securities or individual positions may be attributable, in part, to differences in the pricing methodologies used by the Fund and the index.
|
|
| Updated Performance Information Location [Text Block] |
For performance current to the most recent month-end, visit www.pimco.com/literature or via 888.400.4ETF (888.400.4383).
|
|
| AssetsNet |
$ 358,495,000
|
|
| Holdings Count | Holding |
1,195
|
|
| Advisory Fees Paid, Amount |
$ 1,121,000
|
|
| InvestmentCompanyPortfolioTurnover |
37.00%
|
|
| Additional Fund Statistics [Text Block] |
Key Fund StatisticsFootnote Reference† (as of the end of the reporting period)
Total Net Assets |
$358,495 |
# of Portfolio Holdings |
1,195 |
Portfolio Turnover Rate |
37% |
Total Net Management Fees Paid During the Reporting Period |
$1,121 |
| Footnote |
Description |
Footnote† |
Dollar amounts displayed in 000's | |
|
| Holdings [Text Block] |
Geographic Breakdown (% of Net Asset Value)Footnote Reference*
| Footnote |
Description |
Footnote* |
% of Net Asset Value includes derivatives instruments, if any, valued at the value used for determining the Fund's net asset value. The notional exposure of such derivatives investments therefore may be greater than what is depicted. |
Japan |
22.7% |
United Kingdom |
14.9% |
Canada |
7.9% |
Switzerland |
7.3% |
Germany |
7.1% |
France |
7.0% |
Australia |
4.4% |
Spain |
4.3% |
Italy |
4.0% |
Netherlands |
3.9% |
Sweden |
2.3% |
Other Countries |
13.4% |
Other Assets and Liabilities, Net |
0.8% |
Total |
100.0% | |
|
| Material Fund Change [Text Block] |
|
|
| C000182355 |
|
|
| Shareholder Report [Line Items] |
|
|
| Fund Name |
PIMCO RAFI Dynamic Multi-Factor U.S. Equity ETF
|
|
| Trading Symbol |
MFUS
|
|
| Security Exchange Name |
NYSEArca
|
|
| Annual or Semi-Annual Statement [Text Block] |
This annual shareholder report contains important information about the PIMCO RAFI Dynamic Multi-Factor U.S. Equity ETF (the "Fund") for the period of July 1, 2024 to June 30, 2025 (the "reporting period").
|
|
| Shareholder Report Annual or Semi-Annual |
Annual Shareholder Report
|
|
| Additional Information [Text Block] |
You can find additional information about the Fund at www.pimco.com/literature. You can also request this information by contacting us at 888.400.4ETF (888.400.4383).
|
|
| Additional Information Website |
www.pimco.com/literature
|
|
| Expenses [Text Block] |
What were the Fund costs for the reporting period?(based on a hypothetical $10,000 investment)
Fund Name |
Cost of a $10,000 investment |
Costs paid as a percentage of a $10,000 investment |
PIMCO RAFI Dynamic Multi-Factor U.S. Equity ETF |
$31 |
0.29% | |
|
| Expenses Paid, Amount |
$ 31
|
|
| Expense Ratio, Percent |
0.29%
|
|
| Factors Affecting Performance [Text Block] |
How did the Fund perform during the reporting period and what affected its performance?The following affected performance (on a gross basis) during the reporting period: Security selection in the information technology sector contributed to relative returns, as the Fund's holdings outperformed the S&P 500 Index (the "Index"). Security selection in the communication services sector contributed to relative returns, as the Fund's holdings outperformed the Index. Security selection in the utilities sector contributed to relative returns, as the Fund's holdings outperformed the Index. Security selection in the consumer discretionary sector detracted from relative returns, as the Fund's holdings underperformed the Index. Security selection in the industrials sector detracted from relative returns, as the Fund's holdings underperformed the Index. Security selection in the real estate sector detracted from relative returns, as the Fund's holdings underperformed the Index.
|
|
| Performance Past Does Not Indicate Future [Text] |
Performance quoted represents past performance. Past performance is not a guarantee or a reliable indicator of future results.
|
|
| Average Annual Return [Table Text Block] |
Fund/Index Name |
1 Year |
5 Years |
Since Inception 8/31/17 |
PIMCO RAFI Dynamic Multi-Factor U.S. Equity ETF (at NAV) |
14.45% |
16.05% |
12.24% |
S&P 500 Index |
15.16% |
16.64% |
14.38% |
RAFI Dynamic Multi-Factor U.S. Index |
14.59% |
16.37% |
12.58% | |
|
| No Deduction of Taxes [Text Block] |
Returns shown do not reflect the deduction of taxes that a shareholder would pay on Fund distributions or the redemption of Fund shares.
|
|
| Performance Table Market Index Changed [Text Block] |
Differences in the Fund’s performance versus an index and related attribution information with respect to particular categories of securities or individual positions may be attributable, in part, to differences in the pricing methodologies used by the Fund and the index.
|
|
| Updated Performance Information Location [Text Block] |
For performance current to the most recent month-end, visit www.pimco.com/literature or via 888.400.4ETF (888.400.4383).
|
|
| AssetsNet |
$ 182,658,000
|
|
| Holdings Count | Holding |
861
|
|
| Advisory Fees Paid, Amount |
$ 481,000
|
|
| InvestmentCompanyPortfolioTurnover |
40.00%
|
|
| Additional Fund Statistics [Text Block] |
Key Fund StatisticsFootnote Reference† (as of the end of the reporting period)
Total Net Assets |
$182,658 |
# of Portfolio Holdings |
861 |
Portfolio Turnover Rate |
40% |
Total Net Management Fees Paid During the Reporting Period |
$481 |
| Footnote |
Description |
Footnote† |
Dollar amounts displayed in 000's | |
|
| Holdings [Text Block] |
Sector Breakdown (% of Net Asset Value)Footnote Reference*
| Footnote |
Description |
Footnote* |
% of Net Asset Value includes derivatives instruments, if any, valued at the value used for determining the Fund’s net asset value. The notional exposure of such derivatives investments therefore may be greater than what is depicted. |
Financials |
16.9% |
Health Care |
14.6% |
Consumer Staples |
14.4% |
Information Technology |
14.1% |
Industrials |
11.4% |
Consumer Discretionary |
10.2% |
Communication Services |
8.0% |
Energy |
3.3% |
Materials |
2.5% |
Real Estate |
2.2% |
Utilities |
1.9% |
Short-Term Instruments |
0.4% |
Other Assets and Liabilities, Net |
0.1% |
Total |
100.0% | |
|
| Material Fund Change [Text Block] |
|
|
| C000215599 |
|
|
| Shareholder Report [Line Items] |
|
|
| Fund Name |
PIMCO RAFI ESG U.S. ETF
|
|
| Trading Symbol |
RAFE
|
|
| Security Exchange Name |
NYSEArca
|
|
| Annual or Semi-Annual Statement [Text Block] |
This annual shareholder report contains important information about the PIMCO RAFI ESG U.S. ETF (the "Fund") for the period of July 1, 2024 to June 30, 2025 (the "reporting period").
|
|
| Shareholder Report Annual or Semi-Annual |
Annual Shareholder Report
|
|
| Additional Information [Text Block] |
You can find additional information about the Fund at www.pimco.com/literature. You can also request this information by contacting us at 888.400.4ETF (888.400.4383).
|
|
| Additional Information Website |
www.pimco.com/literature
|
|
| Expenses [Text Block] |
What were the Fund costs for the reporting period?(based on a hypothetical $10,000 investment)
Fund Name |
Cost of a $10,000 investment |
Costs paid as a percentage of a $10,000 investment |
PIMCO RAFI ESG U.S. ETF |
$30 |
0.29% | |
|
| Expenses Paid, Amount |
$ 30
|
|
| Expense Ratio, Percent |
0.29%
|
|
| Factors Affecting Performance [Text Block] |
How did the Fund perform during the reporting period and what affected its performance?The following affected performance (on a gross basis) during the reporting period: Overweight exposure to, and security selection in, the financials sector contributed to relative returns, as the sector and Fund’s holdings outperformed the S&P 500 Index (the "Index"). No exposure to the energy sector contributed to relative returns, as the sector underperformed the Index. Security selection in the communication services sector contributed to relative returns, as the Fund’s holdings outperformed the Index. Security selection in the information technology sector detracted from relative returns, as the Fund’s holdings underperformed the Index. Security selection in the consumer staples sector detracted from relative returns, as the Fund’s holdings underperformed the Index. Security selection in the consumer discretionary sector detracted from relative returns, as the Fund’s holdings underperformed the Index.
|
|
| Performance Past Does Not Indicate Future [Text] |
Performance quoted represents past performance. Past performance is not a guarantee or a reliable indicator of future results.
|
|
| Average Annual Return [Table Text Block] |
Fund/Index Name |
1 Year |
5 Years |
Since Inception 12/18/19 |
PIMCO RAFI ESG U.S. ETF (at NAV) |
10.32% |
14.48% |
10.09% |
S&P 500 Index |
15.16% |
16.64% |
14.54% |
RAFI ESG US Index |
10.46% |
14.79% |
10.38% | |
|
| No Deduction of Taxes [Text Block] |
Returns shown do not reflect the deduction of taxes that a shareholder would pay on Fund distributions or the redemption of Fund shares.
|
|
| Performance Table Market Index Changed [Text Block] |
Differences in the Fund’s performance versus an index and related attribution information with respect to particular categories of securities or individual positions may be attributable, in part, to differences in the pricing methodologies used by the Fund and the index.
|
|
| Updated Performance Information Location [Text Block] |
For performance current to the most recent month-end, visit www.pimco.com/literature or via 888.400.4ETF (888.400.4383).
|
|
| AssetsNet |
$ 91,550,000
|
|
| Holdings Count | Holding |
267
|
|
| Advisory Fees Paid, Amount |
$ 205,000
|
|
| InvestmentCompanyPortfolioTurnover |
22.00%
|
|
| Additional Fund Statistics [Text Block] |
Key Fund StatisticsFootnote Reference† (as of the end of the reporting period)
Total Net Assets |
$91,550 |
# of Portfolio Holdings |
267 |
Portfolio Turnover Rate |
22% |
Total Net Management Fees Paid During the Reporting Period |
$205 |
| Footnote |
Description |
Footnote† |
Dollar amounts displayed in 000's | |
|
| Holdings [Text Block] |
Sector Breakdown (% of Net Asset Value)Footnote Reference*
| Footnote |
Description |
Footnote* |
% of Net Asset Value includes derivatives instruments, if any, valued at the value used for determining the Fund’s net asset value. The notional exposure of such derivatives investments therefore may be greater than what is depicted. |
Information Technology |
30.6% |
Health Care |
21.1% |
Financials |
15.0% |
Communication Services |
7.8% |
Consumer Staples |
7.6% |
Consumer Discretionary |
6.3% |
Industrials |
4.4% |
Materials |
4.2% |
Real Estate |
2.2% |
Utilities |
0.4% |
Other Assets and Liabilities, Net |
0.4% |
Total |
100.0% | |
|
| Material Fund Change [Text Block] |
|
|
| C000150054 |
|
|
| Shareholder Report [Line Items] |
|
|
| Fund Name |
PIMCO REALPATH<sup style="box-sizing: border-box; color: rgb(0, 0, 0); display: inline; flex-wrap: nowrap; font-size: 19px; font-weight: 700; grid-area: auto; line-height: 0px; margin: 0px; overflow: visible; position: relative; text-align: left; text-align-last: auto; white-space-collapse: preserve-breaks;">®</sup> Blend 2030 Fund
|
|
| Class Name |
Class A
|
|
| Trading Symbol |
PBPAX
|
|
| Annual or Semi-Annual Statement [Text Block] |
This annual shareholder report contains important information about the PIMCO REALPATH® Blend 2030 Fund (the "Fund") for the period of July 1, 2024 to June 30, 2025 (the "reporting period").
|
|
| Shareholder Report Annual or Semi-Annual |
Annual Shareholder Report
|
|
| Additional Information [Text Block] |
You can find additional information about the Fund at www.pimco.com/literature. You can also request this information by contacting us at 888.87.PIMCO (888.877.4626).
|
|
| Material Fund Change Notice [Text Block] |
This report describes changes to the Fund that occurred during the reporting period.
|
|
| Additional Information Website |
www.pimco.com/literature
|
|
| Expenses [Text Block] |
What were the Fund costs for the reporting period?(based on a hypothetical $10,000 investment)
Class Name |
Cost of a $10,000 investment |
Costs paid as a percentage of a $10,000 investment |
Class A |
$50 |
0.48% | |
|
| Expenses Paid, Amount |
$ 50
|
|
| Expense Ratio, Percent |
0.48%
|
|
| Factors Affecting Performance [Text Block] |
How did the Fund perform during the reporting period and what affected its performance?The following affected performance (on a gross basis) during the reporting period: Exposure to U.S. large cap equities contributed to absolute performance, as U.S. large cap equities posted positive returns. Exposure to global equities contributed to absolute performance, as global equities posted positive returns. Exposure to U.S. core bonds contributed to absolute performance, as U.S. core bonds posted positive returns. There were no material detractors from absolute performance for this Fund.
|
|
| Performance Past Does Not Indicate Future [Text] |
Performance quoted represents past performance. Past performance is not a guarantee or a reliable indicator of future results.
|
|
| Line Graph [Table Text Block] |
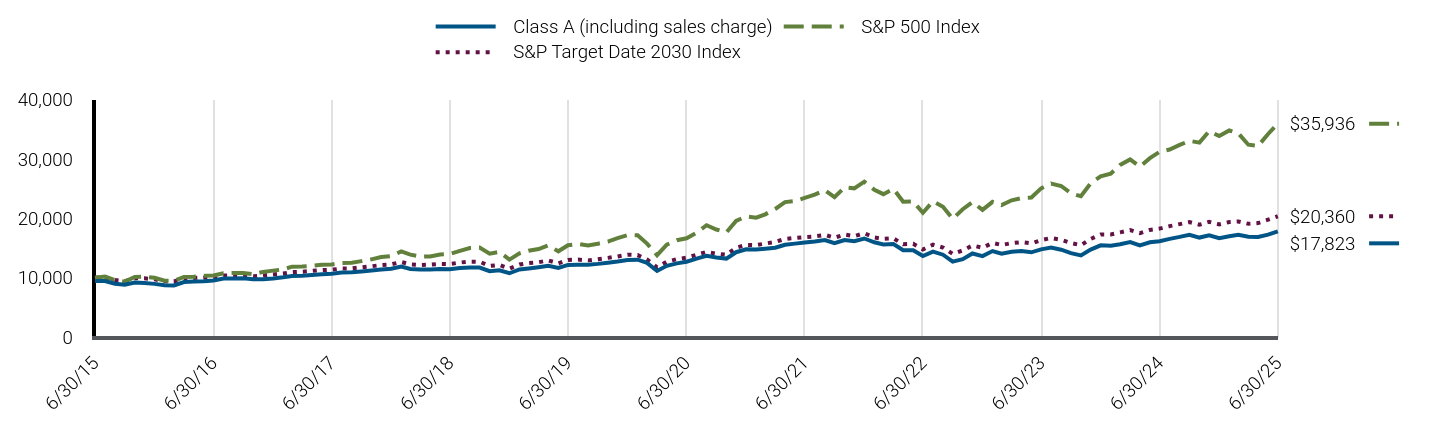
|
Class A (including sales charge) |
S&P 500 Index |
S&P Target Date 2030 Index |
6/30/15 |
$9,452 |
$10,000 |
$10,000 |
7/31/15 |
$9,471 |
$10,210 |
$10,113 |
8/31/15 |
$9,017 |
$9,594 |
$9,636 |
9/30/15 |
$8,828 |
$9,356 |
$9,432 |
10/31/15 |
$9,225 |
$10,145 |
$9,926 |
11/30/15 |
$9,131 |
$10,176 |
$9,928 |
12/31/15 |
$8,985 |
$10,015 |
$9,751 |
1/31/16 |
$8,745 |
$9,518 |
$9,407 |
2/29/16 |
$8,716 |
$9,505 |
$9,380 |
3/31/16 |
$9,299 |
$10,150 |
$9,899 |
4/30/16 |
$9,395 |
$10,189 |
$9,977 |
5/31/16 |
$9,414 |
$10,372 |
$10,056 |
6/30/16 |
$9,560 |
$10,399 |
$10,098 |
7/31/16 |
$9,870 |
$10,783 |
$10,386 |
8/31/16 |
$9,899 |
$10,798 |
$10,408 |
9/30/16 |
$9,939 |
$10,800 |
$10,440 |
10/31/16 |
$9,774 |
$10,603 |
$10,262 |
11/30/16 |
$9,755 |
$10,996 |
$10,389 |
12/31/16 |
$9,901 |
$11,213 |
$10,564 |
1/31/17 |
$10,088 |
$11,426 |
$10,737 |
2/28/17 |
$10,326 |
$11,879 |
$10,960 |
3/31/17 |
$10,365 |
$11,893 |
$11,034 |
4/30/17 |
$10,484 |
$12,015 |
$11,161 |
5/31/17 |
$10,623 |
$12,184 |
$11,306 |
6/30/17 |
$10,673 |
$12,260 |
$11,366 |
7/31/17 |
$10,880 |
$12,512 |
$11,562 |
8/31/17 |
$10,950 |
$12,551 |
$11,579 |
9/30/17 |
$11,077 |
$12,810 |
$11,775 |
10/31/17 |
$11,226 |
$13,109 |
$11,946 |
11/30/17 |
$11,385 |
$13,511 |
$12,152 |
12/31/17 |
$11,544 |
$13,661 |
$12,275 |
1/31/18 |
$11,897 |
$14,443 |
$12,665 |
2/28/18 |
$11,484 |
$13,911 |
$12,270 |
3/31/18 |
$11,423 |
$13,557 |
$12,158 |
4/30/18 |
$11,423 |
$13,609 |
$12,213 |
5/31/18 |
$11,484 |
$13,937 |
$12,347 |
6/30/18 |
$11,458 |
$14,023 |
$12,329 |
7/31/18 |
$11,669 |
$14,544 |
$12,574 |
8/31/18 |
$11,750 |
$15,018 |
$12,725 |
9/30/18 |
$11,727 |
$15,104 |
$12,717 |
10/31/18 |
$11,120 |
$14,072 |
$12,005 |
11/30/18 |
$11,262 |
$14,358 |
$12,168 |
12/31/18 |
$10,770 |
$13,062 |
$11,539 |
1/31/19 |
$11,410 |
$14,109 |
$12,236 |
2/28/19 |
$11,578 |
$14,562 |
$12,489 |
3/31/19 |
$11,796 |
$14,845 |
$12,623 |
4/30/19 |
$12,028 |
$15,446 |
$12,927 |
5/31/19 |
$11,680 |
$14,464 |
$12,425 |
6/30/19 |
$12,177 |
$15,483 |
$13,014 |
7/31/19 |
$12,219 |
$15,706 |
$13,067 |
8/31/19 |
$12,219 |
$15,457 |
$12,939 |
9/30/19 |
$12,348 |
$15,746 |
$13,127 |
10/31/19 |
$12,540 |
$16,087 |
$13,358 |
11/30/19 |
$12,732 |
$16,671 |
$13,588 |
12/31/19 |
$13,004 |
$17,175 |
$13,890 |
1/31/20 |
$13,047 |
$17,168 |
$13,828 |
2/29/20 |
$12,526 |
$15,755 |
$13,092 |
3/31/20 |
$11,159 |
$13,809 |
$11,754 |
4/30/20 |
$12,016 |
$15,579 |
$12,704 |
5/31/20 |
$12,429 |
$16,321 |
$13,134 |
6/30/20 |
$12,713 |
$16,645 |
$13,393 |
7/31/20 |
$13,234 |
$17,584 |
$13,879 |
8/31/20 |
$13,690 |
$18,848 |
$14,359 |
9/30/20 |
$13,409 |
$18,132 |
$14,065 |
10/31/20 |
$13,235 |
$17,650 |
$13,879 |
11/30/20 |
$14,311 |
$19,582 |
$15,058 |
12/31/20 |
$14,787 |
$20,334 |
$15,544 |
1/31/21 |
$14,754 |
$20,129 |
$15,503 |
2/28/21 |
$14,899 |
$20,684 |
$15,762 |
3/31/21 |
$15,055 |
$21,590 |
$16,047 |
4/30/21 |
$15,563 |
$22,742 |
$16,538 |
5/31/21 |
$15,755 |
$22,901 |
$16,712 |
6/30/21 |
$15,959 |
$23,436 |
$16,836 |
7/31/21 |
$16,130 |
$23,993 |
$16,962 |
8/31/21 |
$16,369 |
$24,722 |
$17,227 |
9/30/21 |
$15,843 |
$23,572 |
$16,759 |
10/31/21 |
$16,368 |
$25,224 |
$17,289 |
11/30/21 |
$16,174 |
$25,049 |
$17,016 |
12/31/21 |
$16,618 |
$26,172 |
$17,504 |
1/31/22 |
$15,985 |
$24,817 |
$16,794 |
2/28/22 |
$15,622 |
$24,074 |
$16,548 |
3/31/22 |
$15,679 |
$24,968 |
$16,641 |
4/30/22 |
$14,659 |
$22,791 |
$15,650 |
5/31/22 |
$14,624 |
$22,833 |
$15,714 |
6/30/22 |
$13,658 |
$20,948 |
$14,775 |
7/31/22 |
$14,410 |
$22,879 |
$15,579 |
8/31/22 |
$13,893 |
$21,946 |
$15,105 |
9/30/22 |
$12,724 |
$19,925 |
$14,039 |
10/31/22 |
$13,149 |
$21,538 |
$14,611 |
11/30/22 |
$14,092 |
$22,742 |
$15,432 |
12/31/22 |
$13,659 |
$21,432 |
$15,059 |
1/31/23 |
$14,506 |
$22,778 |
$15,871 |
2/28/23 |
$14,046 |
$22,223 |
$15,529 |
3/31/23 |
$14,389 |
$23,038 |
$15,839 |
4/30/23 |
$14,522 |
$23,398 |
$16,003 |
5/31/23 |
$14,291 |
$23,500 |
$15,808 |
6/30/23 |
$14,792 |
$25,053 |
$16,345 |
7/31/23 |
$15,108 |
$25,857 |
$16,700 |
8/31/23 |
$14,731 |
$25,446 |
$16,405 |
9/30/23 |
$14,157 |
$24,232 |
$15,858 |
10/31/23 |
$13,766 |
$23,723 |
$15,479 |
11/30/23 |
$14,744 |
$25,889 |
$16,543 |
12/31/23 |
$15,464 |
$27,066 |
$17,288 |
1/31/24 |
$15,402 |
$27,520 |
$17,301 |
2/29/24 |
$15,663 |
$28,990 |
$17,640 |
3/31/24 |
$16,004 |
$29,923 |
$18,024 |
4/30/24 |
$15,455 |
$28,700 |
$17,520 |
5/31/24 |
$15,979 |
$30,124 |
$18,058 |
6/30/24 |
$16,170 |
$31,204 |
$18,282 |
7/31/24 |
$16,560 |
$31,584 |
$18,691 |
8/31/24 |
$16,887 |
$32,350 |
$19,039 |
9/30/24 |
$17,242 |
$33,041 |
$19,374 |
10/31/24 |
$16,773 |
$32,742 |
$18,943 |
11/30/24 |
$17,154 |
$34,664 |
$19,419 |
12/31/24 |
$16,660 |
$33,837 |
$18,999 |
1/31/25 |
$17,008 |
$34,780 |
$19,389 |
2/28/25 |
$17,252 |
$34,326 |
$19,474 |
3/31/25 |
$16,917 |
$32,392 |
$19,094 |
4/30/25 |
$16,879 |
$32,172 |
$19,208 |
5/31/25 |
$17,266 |
$34,197 |
$19,777 |
6/30/25 |
$17,823 |
$35,936 |
$20,360 |
|
|
| Average Annual Return [Table Text Block] |
Class/Index Name |
1 Year |
5 Years |
10 Years |
Class A (excluding sales charge) |
10.22% |
6.99% |
6.55% |
Class A (including sales charge) |
4.15% |
5.79% |
5.95% |
S&P 500 Index |
15.16% |
16.64% |
13.65% |
S&P Target Date 2030 Index |
11.37% |
8.74% |
7.37% | |
|
| No Deduction of Taxes [Text Block] |
Returns shown do not reflect the deduction of taxes that a shareholder would pay on Fund distributions or the redemption of Fund shares.
|
|
| Performance Table Market Index Changed [Text Block] |
Differences in the Fund’s performance versus an index and related attribution information with respect to particular categories of securities or individual positions may be attributable, in part, to differences in the pricing methodologies used by the Fund and the index.
|
|
| Updated Performance Information Location [Text Block] |
For performance current to the most recent month-end, visit www.pimco.com/literature or via 888.87.PIMCO (888.877.4626).
|
|
| AssetsNet |
$ 580,331,000
|
|
| Holdings Count | Holding |
25
|
|
| Advisory Fees Paid, Amount |
$ 60,000
|
|
| InvestmentCompanyPortfolioTurnover |
16.00%
|
|
| Additional Fund Statistics [Text Block] |
Key Fund StatisticsFootnote Reference† (as of the end of the reporting period)
Total Net Assets |
$580,331 |
# of Portfolio Holdings |
25 |
Portfolio Turnover Rate |
16% |
Total Net Advisory Fees Paid During the Reporting Period |
$60 |
| Footnote |
Description |
Footnote† |
Dollar amounts displayed in 000's | |
|
| Holdings [Text Block] |
Security Type Breakdown (% of Net Asset Value)Footnote Reference*
Mutual Funds |
48.9% |
Short-Term Instruments |
0.2% |
Affiliated Investments |
50.5% |
Financial Derivative Instruments |
(0.1%) |
Other Assets and Liabilities, Net |
0.5% |
Total |
100.0% |
| Footnote |
Description |
Footnote* |
% of Net Asset Value includes derivatives instruments, if any, valued at the value used for determining the Fund's net asset value. The notional exposure of such derivatives investments therefore may be greater than what is depicted. | |
|
| Largest Holdings [Text Block] |
Top Holdings (% of Net Asset Value)Footnote Reference**
Vanguard Institutional Index Fund 'Institutional Plus' |
30.6% |
Vanguard Developed Markets Index Fund 'Institutional' |
12.5% |
PIMCO Total Return Fund |
11.0% |
PIMCO Long-Term Real Return Fund |
9.0% |
PIMCO Long-Term U.S. Government Fund |
8.2% |
PIMCO Income Fund |
7.6% |
PIMCO Real Return Fund |
4.9% |
Vanguard Emerging Markets Stock Index Fund 'Institutional' |
4.2% |
PIMCO Emerging Markets Local Currency and Bond Fund |
2.7% |
PIMCO International Bond Fund (U.S. Dollar-Hedged) |
1.9% |
| Footnote |
Description |
Footnote** |
Short-Term Instruments/Foreign Currency Contracts are not included in Top Holdings table. | |
|
| Material Fund Change [Text Block] |
This is a summary of certain changes and planned changes of the Fund since the beginning of the reporting period. For more information, you may refer to the Fund's next prospectus, which we expect to be available by October 31, 2025 or upon request at 888.87.PIMCO (888.877.4626). Change to REALPATH Blend Glide Path. Effective February 28, 2025, the Fund’s REALPATH Blend Glide Path, which forms the basis of the Fund’s long-term asset allocations, was changed based on data relating to risk metrics, long-term market trends, correlation of asset types and actuarial assumptions of life expectancy and retirement. Changes to Total Annual Fund Operating Expenses. Annual fund operating expenses increased during the year by 0.15% as a result of the Fund's exposure to fees and expenses related to the Fund's investment in underlying funds. |
|
| Material Fund Change Objectives [Text Block] |
Change to REALPATH Blend Glide Path. Effective February 28, 2025, the Fund’s REALPATH Blend Glide Path, which forms the basis of the Fund’s long-term asset allocations, was changed based on data relating to risk metrics, long-term market trends, correlation of asset types and actuarial assumptions of life expectancy and retirement.
|
|
| Material Fund Change Expenses [Text Block] |
Changes to Total Annual Fund Operating Expenses. Annual fund operating expenses increased during the year by 0.15% as a result of the Fund's exposure to fees and expenses related to the Fund's investment in underlying funds.
|
|
| Summary of Change Legend [Text Block] |
This is a summary of certain changes and planned changes of the Fund since the beginning of the reporting period. For more information, you may refer to the Fund's next prospectus, which we expect to be available by October 31, 2025 or upon request at 888.87.PIMCO (888.877.4626).
|
|
| C000150050 |
|
|
| Shareholder Report [Line Items] |
|
|
| Fund Name |
PIMCO REALPATH<sup style="box-sizing: border-box; color: rgb(0, 0, 0); display: inline; flex-wrap: nowrap; font-size: 19px; font-weight: 700; grid-area: auto; line-height: 0px; margin: 0px; overflow: visible; position: relative; text-align: left; text-align-last: auto; white-space-collapse: preserve-breaks;">®</sup> Blend 2030 Fund
|
|
| Class Name |
Institutional Class
|
|
| Trading Symbol |
PBPNX
|
|
| Annual or Semi-Annual Statement [Text Block] |
This annual shareholder report contains important information about the PIMCO REALPATH® Blend 2030 Fund (the "Fund") for the period of July 1, 2024 to June 30, 2025 (the "reporting period").
|
|
| Shareholder Report Annual or Semi-Annual |
Annual Shareholder Report
|
|
| Additional Information [Text Block] |
You can find additional information about the Fund at www.pimco.com/literature. You can also request this information by contacting us at 888.87.PIMCO (888.877.4626).
|
|
| Material Fund Change Notice [Text Block] |
This report describes changes to the Fund that occurred during the reporting period.
|
|
| Additional Information Website |
www.pimco.com/literature
|
|
| Expenses [Text Block] |
What were the Fund costs for the reporting period?(based on a hypothetical $10,000 investment)
Class Name |
Cost of a $10,000 investment |
Costs paid as a percentage of a $10,000 investment |
Institutional Class |
$3 |
0.03% | |
|
| Expenses Paid, Amount |
$ 3
|
|
| Expense Ratio, Percent |
0.03%
|
|
| Factors Affecting Performance [Text Block] |
How did the Fund perform during the reporting period and what affected its performance?The following affected performance (on a gross basis) during the reporting period: Exposure to U.S. large cap equities contributed to absolute performance, as U.S. large cap equities posted positive returns. Exposure to global equities contributed to absolute performance, as global equities posted positive returns. Exposure to U.S. core bonds contributed to absolute performance, as U.S. core bonds posted positive returns. There were no material detractors from absolute performance for this Fund.
|
|
| Performance Past Does Not Indicate Future [Text] |
Performance quoted represents past performance. Past performance is not a guarantee or a reliable indicator of future results.
|
|
| Line Graph [Table Text Block] |
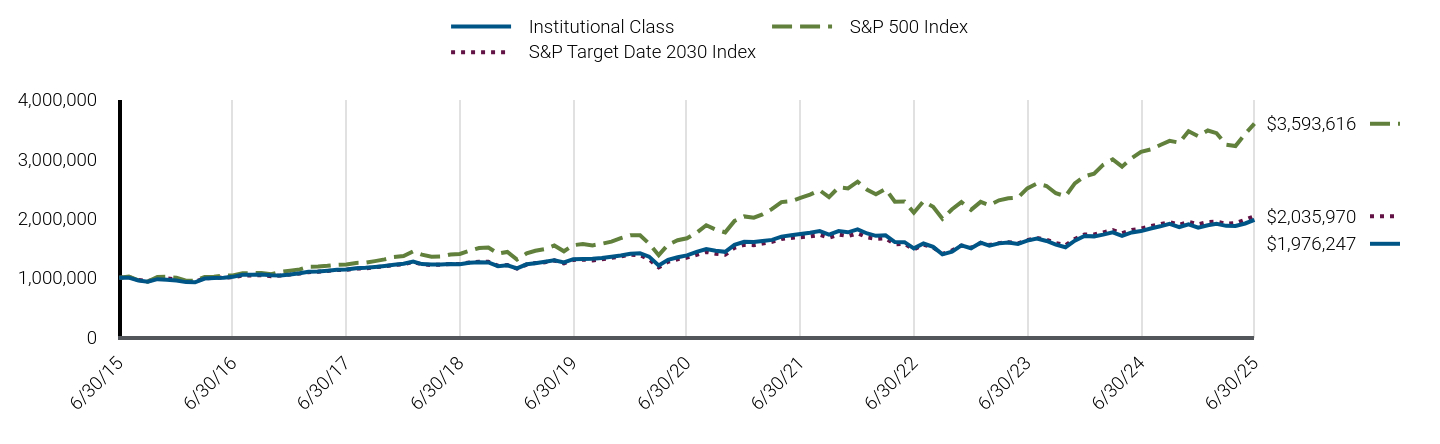
|
Institutional Class |
S&P 500 Index |
S&P Target Date 2030 Index |
6/30/15 |
$1,000,000 |
$1,000,000 |
$1,000,000 |
7/31/15 |
$1,003,000 |
$1,020,951 |
$1,011,297 |
8/31/15 |
$955,000 |
$959,353 |
$963,567 |
9/30/15 |
$935,837 |
$935,615 |
$943,169 |
10/31/15 |
$977,919 |
$1,014,539 |
$992,578 |
11/30/15 |
$968,902 |
$1,017,556 |
$992,816 |
12/31/15 |
$953,457 |
$1,001,507 |
$975,051 |
1/31/16 |
$927,936 |
$951,808 |
$940,701 |
2/29/16 |
$925,895 |
$950,524 |
$937,962 |
3/31/16 |
$987,718 |
$1,015,006 |
$989,864 |
4/30/16 |
$998,965 |
$1,018,940 |
$997,672 |
5/31/16 |
$1,001,010 |
$1,037,239 |
$1,005,591 |
6/30/16 |
$1,016,745 |
$1,039,926 |
$1,009,842 |
7/31/16 |
$1,050,739 |
$1,078,267 |
$1,038,561 |
8/31/16 |
$1,053,830 |
$1,079,781 |
$1,040,764 |
9/30/16 |
$1,057,466 |
$1,079,985 |
$1,044,042 |
10/31/16 |
$1,041,991 |
$1,060,285 |
$1,026,240 |
11/30/16 |
$1,039,928 |
$1,099,552 |
$1,038,864 |
12/31/16 |
$1,056,298 |
$1,121,286 |
$1,056,430 |
1/31/17 |
$1,076,308 |
$1,142,553 |
$1,073,672 |
2/28/17 |
$1,101,583 |
$1,187,919 |
$1,095,956 |
3/31/17 |
$1,105,796 |
$1,189,305 |
$1,103,434 |
4/30/17 |
$1,118,434 |
$1,201,519 |
$1,116,125 |
5/31/17 |
$1,134,231 |
$1,218,428 |
$1,130,571 |
6/30/17 |
$1,140,814 |
$1,226,033 |
$1,136,599 |
7/31/17 |
$1,161,920 |
$1,251,243 |
$1,156,214 |
8/31/17 |
$1,170,363 |
$1,255,074 |
$1,157,948 |
9/30/17 |
$1,183,978 |
$1,280,963 |
$1,177,548 |
10/31/17 |
$1,200,938 |
$1,310,855 |
$1,194,609 |
11/30/17 |
$1,218,957 |
$1,351,059 |
$1,215,231 |
12/31/17 |
$1,236,411 |
$1,366,081 |
$1,227,453 |
1/31/18 |
$1,274,074 |
$1,444,294 |
$1,266,493 |
2/28/18 |
$1,231,031 |
$1,391,062 |
$1,227,028 |
3/31/18 |
$1,224,574 |
$1,355,710 |
$1,215,833 |
4/30/18 |
$1,225,651 |
$1,360,912 |
$1,221,350 |
5/31/18 |
$1,232,107 |
$1,393,686 |
$1,234,726 |
6/30/18 |
$1,229,866 |
$1,402,264 |
$1,232,851 |
7/31/18 |
$1,253,621 |
$1,454,447 |
$1,257,384 |
8/31/18 |
$1,262,259 |
$1,501,841 |
$1,272,458 |
9/30/18 |
$1,259,694 |
$1,510,389 |
$1,271,666 |
10/31/18 |
$1,195,733 |
$1,407,154 |
$1,200,486 |
11/30/18 |
$1,211,994 |
$1,435,829 |
$1,216,789 |
12/31/18 |
$1,158,901 |
$1,306,187 |
$1,153,903 |
1/31/19 |
$1,227,535 |
$1,410,859 |
$1,223,591 |
2/28/19 |
$1,246,663 |
$1,456,159 |
$1,248,881 |
3/31/19 |
$1,270,303 |
$1,484,455 |
$1,262,262 |
4/30/19 |
$1,296,320 |
$1,544,560 |
$1,292,743 |
5/31/19 |
$1,258,992 |
$1,446,406 |
$1,242,455 |
6/30/19 |
$1,313,930 |
$1,548,343 |
$1,301,399 |
7/31/19 |
$1,318,485 |
$1,570,597 |
$1,306,735 |
8/31/19 |
$1,319,623 |
$1,545,718 |
$1,293,863 |
9/30/19 |
$1,333,535 |
$1,574,639 |
$1,312,748 |
10/31/19 |
$1,355,302 |
$1,608,745 |
$1,335,776 |
11/30/19 |
$1,375,924 |
$1,667,141 |
$1,358,832 |
12/31/19 |
$1,405,906 |
$1,717,458 |
$1,389,021 |
1/31/20 |
$1,411,754 |
$1,716,785 |
$1,382,776 |
2/29/20 |
$1,356,781 |
$1,575,461 |
$1,309,237 |
3/31/20 |
$1,208,941 |
$1,380,871 |
$1,175,388 |
4/30/20 |
$1,302,567 |
$1,557,890 |
$1,270,434 |
5/31/20 |
$1,347,039 |
$1,632,089 |
$1,313,401 |
6/30/20 |
$1,378,232 |
$1,664,547 |
$1,339,264 |
7/31/20 |
$1,435,658 |
$1,758,403 |
$1,387,885 |
8/31/20 |
$1,484,881 |
$1,884,798 |
$1,435,886 |
9/30/20 |
$1,455,736 |
$1,813,182 |
$1,406,466 |
10/31/20 |
$1,436,953 |
$1,764,962 |
$1,387,939 |
11/30/20 |
$1,554,351 |
$1,958,162 |
$1,505,805 |
12/31/20 |
$1,606,736 |
$2,033,450 |
$1,554,436 |
1/31/21 |
$1,604,320 |
$2,012,921 |
$1,550,286 |
2/28/21 |
$1,620,025 |
$2,068,427 |
$1,576,227 |
3/31/21 |
$1,638,581 |
$2,159,015 |
$1,604,738 |
4/30/21 |
$1,693,608 |
$2,274,239 |
$1,653,802 |
5/31/21 |
$1,715,618 |
$2,290,123 |
$1,671,174 |
6/30/21 |
$1,738,497 |
$2,343,585 |
$1,683,629 |
7/31/21 |
$1,758,239 |
$2,399,257 |
$1,696,159 |
8/31/21 |
$1,785,384 |
$2,472,208 |
$1,722,707 |
9/30/21 |
$1,728,578 |
$2,357,226 |
$1,675,939 |
10/31/21 |
$1,785,537 |
$2,522,377 |
$1,728,905 |
11/30/21 |
$1,765,725 |
$2,504,900 |
$1,701,571 |
12/31/21 |
$1,814,946 |
$2,617,160 |
$1,750,381 |
1/31/22 |
$1,746,265 |
$2,481,730 |
$1,679,363 |
2/28/22 |
$1,706,838 |
$2,407,423 |
$1,654,807 |
3/31/22 |
$1,714,753 |
$2,496,810 |
$1,664,088 |
4/30/22 |
$1,602,561 |
$2,279,083 |
$1,564,989 |
5/31/22 |
$1,600,011 |
$2,283,265 |
$1,571,366 |
6/30/22 |
$1,495,592 |
$2,094,795 |
$1,477,474 |
7/31/22 |
$1,577,472 |
$2,287,945 |
$1,557,924 |
8/31/22 |
$1,521,180 |
$2,194,638 |
$1,510,459 |
9/30/22 |
$1,395,007 |
$1,992,515 |
$1,403,898 |
10/31/22 |
$1,441,251 |
$2,153,832 |
$1,461,060 |
11/30/22 |
$1,545,298 |
$2,274,196 |
$1,543,201 |
12/31/22 |
$1,497,660 |
$2,143,170 |
$1,505,945 |
1/31/23 |
$1,591,346 |
$2,277,834 |
$1,587,114 |
2/28/23 |
$1,541,204 |
$2,222,257 |
$1,552,852 |
3/31/23 |
$1,579,986 |
$2,303,845 |
$1,583,939 |
4/30/23 |
$1,594,578 |
$2,339,805 |
$1,600,341 |
5/31/23 |
$1,570,699 |
$2,349,975 |
$1,580,784 |
6/30/23 |
$1,625,804 |
$2,505,250 |
$1,634,544 |
7/31/23 |
$1,661,726 |
$2,585,731 |
$1,669,950 |
8/31/23 |
$1,620,482 |
$2,544,562 |
$1,640,503 |
9/30/23 |
$1,557,777 |
$2,423,243 |
$1,585,817 |
10/31/23 |
$1,514,988 |
$2,372,291 |
$1,547,947 |
11/30/23 |
$1,624,634 |
$2,588,941 |
$1,654,322 |
12/31/23 |
$1,702,909 |
$2,706,559 |
$1,728,783 |
1/31/24 |
$1,697,477 |
$2,752,040 |
$1,730,122 |
2/29/24 |
$1,727,353 |
$2,898,987 |
$1,764,015 |
3/31/24 |
$1,765,037 |
$2,992,260 |
$1,802,449 |
4/30/24 |
$1,704,881 |
$2,870,043 |
$1,752,009 |
5/31/24 |
$1,763,670 |
$3,012,353 |
$1,805,833 |
6/30/24 |
$1,786,500 |
$3,120,443 |
$1,828,183 |
7/31/24 |
$1,829,298 |
$3,158,426 |
$1,869,099 |
8/31/24 |
$1,866,575 |
$3,235,039 |
$1,903,892 |
9/30/24 |
$1,907,287 |
$3,304,130 |
$1,937,398 |
10/31/24 |
$1,854,384 |
$3,274,166 |
$1,894,287 |
11/30/24 |
$1,898,934 |
$3,466,363 |
$1,941,860 |
12/31/24 |
$1,844,453 |
$3,383,732 |
$1,899,894 |
1/31/25 |
$1,884,028 |
$3,477,960 |
$1,938,918 |
2/28/25 |
$1,910,882 |
$3,432,579 |
$1,947,409 |
3/31/25 |
$1,874,471 |
$3,239,172 |
$1,909,450 |
4/30/25 |
$1,871,633 |
$3,217,208 |
$1,920,836 |
5/31/25 |
$1,914,203 |
$3,419,714 |
$1,977,654 |
6/30/25 |
$1,976,247 |
$3,593,616 |
$2,035,970 |
|
|
| Average Annual Return [Table Text Block] |
Class/Index Name |
1 Year |
5 Years |
10 Years |
Institutional Class |
10.62% |
7.47% |
7.05% |
S&P 500 Index |
15.16% |
16.64% |
13.65% |
S&P Target Date 2030 Index |
11.37% |
8.74% |
7.37% | |
|
| No Deduction of Taxes [Text Block] |
Returns shown do not reflect the deduction of taxes that a shareholder would pay on Fund distributions or the redemption of Fund shares.
|
|
| Performance Table Market Index Changed [Text Block] |
Differences in the Fund’s performance versus an index and related attribution information with respect to particular categories of securities or individual positions may be attributable, in part, to differences in the pricing methodologies used by the Fund and the index.
|
|
| Updated Performance Information Location [Text Block] |
For performance current to the most recent month-end, visit www.pimco.com/literature or via 888.87.PIMCO (888.877.4626).
|
|
| AssetsNet |
$ 580,331,000
|
|
| Holdings Count | Holding |
25
|
|
| Advisory Fees Paid, Amount |
$ 60,000
|
|
| InvestmentCompanyPortfolioTurnover |
16.00%
|
|
| Additional Fund Statistics [Text Block] |
Key Fund StatisticsFootnote Reference† (as of the end of the reporting period)
Total Net Assets |
$580,331 |
# of Portfolio Holdings |
25 |
Portfolio Turnover Rate |
16% |
Total Net Advisory Fees Paid During the Reporting Period |
$60 |
| Footnote |
Description |
Footnote† |
Dollar amounts displayed in 000's | |
|
| Holdings [Text Block] |
Security Type Breakdown (% of Net Asset Value)Footnote Reference*
Mutual Funds |
48.9% |
Short-Term Instruments |
0.2% |
Affiliated Investments |
50.5% |
Financial Derivative Instruments |
(0.1%) |
Other Assets and Liabilities, Net |
0.5% |
Total |
100.0% |
| Footnote |
Description |
Footnote* |
% of Net Asset Value includes derivatives instruments, if any, valued at the value used for determining the Fund's net asset value. The notional exposure of such derivatives investments therefore may be greater than what is depicted. | |
|
| Largest Holdings [Text Block] |
Top Holdings (% of Net Asset Value)Footnote Reference**
Vanguard Institutional Index Fund 'Institutional Plus' |
30.6% |
Vanguard Developed Markets Index Fund 'Institutional' |
12.5% |
PIMCO Total Return Fund |
11.0% |
PIMCO Long-Term Real Return Fund |
9.0% |
PIMCO Long-Term U.S. Government Fund |
8.2% |
PIMCO Income Fund |
7.6% |
PIMCO Real Return Fund |
4.9% |
Vanguard Emerging Markets Stock Index Fund 'Institutional' |
4.2% |
PIMCO Emerging Markets Local Currency and Bond Fund |
2.7% |
PIMCO International Bond Fund (U.S. Dollar-Hedged) |
1.9% |
| Footnote |
Description |
Footnote** |
Short-Term Instruments/Foreign Currency Contracts are not included in Top Holdings table. | |
|
| Material Fund Change [Text Block] |
This is a summary of certain changes and planned changes of the Fund since the beginning of the reporting period. For more information, you may refer to the Fund's next prospectus, which we expect to be available by October 31, 2025 or upon request at 888.87.PIMCO (888.877.4626). Change to REALPATH Blend Glide Path. Effective February 28, 2025, the Fund’s REALPATH Blend Glide Path, which forms the basis of the Fund’s long-term asset allocations, was changed based on data relating to risk metrics, long-term market trends, correlation of asset types and actuarial assumptions of life expectancy and retirement. Changes to Total Annual Fund Operating Expenses. Annual fund operating expenses increased during the year by 0.15% as a result of the Fund's exposure to fees and expenses related to the Fund's investment in underlying funds. |
|
| Material Fund Change Objectives [Text Block] |
Change to REALPATH Blend Glide Path. Effective February 28, 2025, the Fund’s REALPATH Blend Glide Path, which forms the basis of the Fund’s long-term asset allocations, was changed based on data relating to risk metrics, long-term market trends, correlation of asset types and actuarial assumptions of life expectancy and retirement.
|
|
| Material Fund Change Expenses [Text Block] |
Changes to Total Annual Fund Operating Expenses. Annual fund operating expenses increased during the year by 0.15% as a result of the Fund's exposure to fees and expenses related to the Fund's investment in underlying funds.
|
|
| Summary of Change Legend [Text Block] |
This is a summary of certain changes and planned changes of the Fund since the beginning of the reporting period. For more information, you may refer to the Fund's next prospectus, which we expect to be available by October 31, 2025 or upon request at 888.87.PIMCO (888.877.4626).
|
|
| C000150061 |
|
|
| Shareholder Report [Line Items] |
|
|
| Fund Name |
PIMCO REALPATH<sup style="box-sizing: border-box; color: rgb(0, 0, 0); display: inline; flex-wrap: nowrap; font-size: 19px; font-weight: 700; grid-area: auto; line-height: 0px; margin: 0px; overflow: visible; position: relative; text-align: left; text-align-last: auto; white-space-collapse: preserve-breaks;">®</sup> Blend 2035 Fund
|
|
| Class Name |
Class A
|
|
| Trading Symbol |
PDGAX
|
|
| Annual or Semi-Annual Statement [Text Block] |
This annual shareholder report contains important information about the PIMCO REALPATH® Blend 2035 Fund (the "Fund") for the period of July 1, 2024 to June 30, 2025 (the "reporting period").
|
|
| Shareholder Report Annual or Semi-Annual |
Annual Shareholder Report
|
|
| Additional Information [Text Block] |
You can find additional information about the Fund at www.pimco.com/literature. You can also request this information by contacting us at 888.87.PIMCO (888.877.4626).
|
|
| Material Fund Change Notice [Text Block] |
This report describes changes to the Fund that occurred during the reporting period.
|
|
| Additional Information Website |
www.pimco.com/literature
|
|
| Expenses [Text Block] |
What were the Fund costs for the reporting period?(based on a hypothetical $10,000 investment)
Class Name |
Cost of a $10,000 investment |
Costs paid as a percentage of a $10,000 investment |
Class A |
$52 |
0.49% | |
|
| Expenses Paid, Amount |
$ 52
|
|
| Expense Ratio, Percent |
0.49%
|
|
| Factors Affecting Performance [Text Block] |
How did the Fund perform during the reporting period and what affected its performance?The following affected performance (on a gross basis) during the reporting period: Exposure to U.S. large cap equities contributed to absolute performance, as U.S. large cap equities posted positive returns. Exposure to global equities contributed to absolute performance, as global equities posted positive returns. Exposure to emerging market equities contributed to absolute performance, as emerging market equities posted positive returns. There were no material detractors from absolute performance for this Fund.
|
|
| Performance Past Does Not Indicate Future [Text] |
Performance quoted represents past performance. Past performance is not a guarantee or a reliable indicator of future results.
|
|
| Line Graph [Table Text Block] |
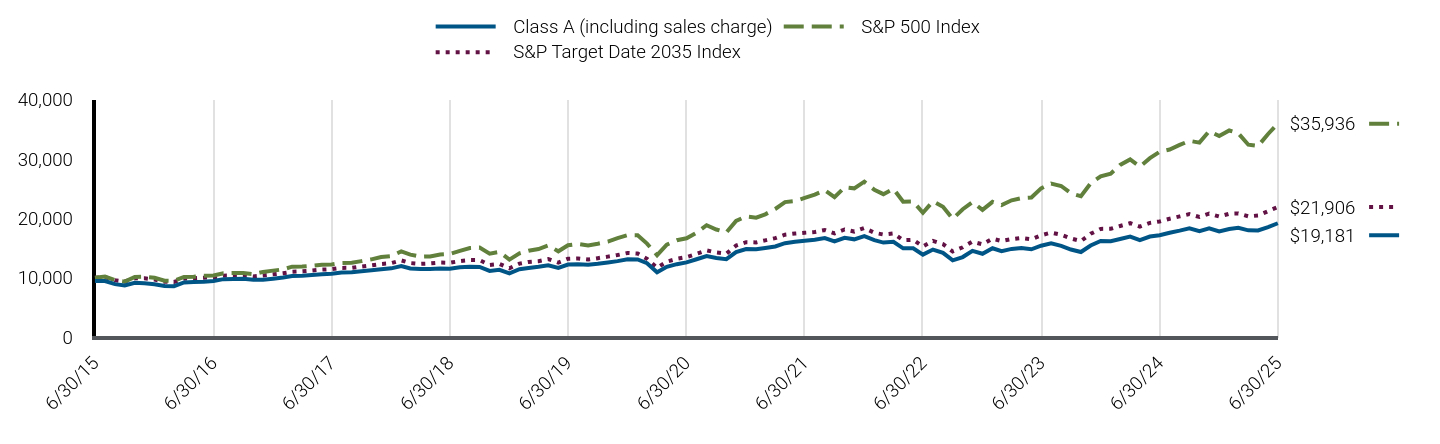
|
Class A (including sales charge) |
S&P 500 Index |
S&P Target Date 2035 Index |
6/30/15 |
$9,453 |
$10,000 |
$10,000 |
7/31/15 |
$9,463 |
$10,210 |
$10,117 |
8/31/15 |
$8,944 |
$9,594 |
$9,602 |
9/30/15 |
$8,735 |
$9,356 |
$9,380 |
10/31/15 |
$9,178 |
$10,145 |
$9,911 |
11/30/15 |
$9,084 |
$10,176 |
$9,916 |
12/31/15 |
$8,929 |
$10,015 |
$9,726 |
1/31/16 |
$8,624 |
$9,518 |
$9,346 |
2/29/16 |
$8,595 |
$9,505 |
$9,310 |
3/31/16 |
$9,228 |
$10,150 |
$9,862 |
4/30/16 |
$9,314 |
$10,189 |
$9,944 |
5/31/16 |
$9,343 |
$10,372 |
$10,030 |
6/30/16 |
$9,473 |
$10,399 |
$10,061 |
7/31/16 |
$9,780 |
$10,783 |
$10,370 |
8/31/16 |
$9,799 |
$10,798 |
$10,396 |
9/30/16 |
$9,837 |
$10,800 |
$10,429 |
10/31/16 |
$9,674 |
$10,603 |
$10,241 |
11/30/16 |
$9,693 |
$10,996 |
$10,397 |
12/31/16 |
$9,863 |
$11,213 |
$10,587 |
1/31/17 |
$10,048 |
$11,426 |
$10,774 |
2/28/17 |
$10,302 |
$11,879 |
$11,013 |
3/31/17 |
$10,351 |
$11,893 |
$11,096 |
4/30/17 |
$10,467 |
$12,015 |
$11,229 |
5/31/17 |
$10,614 |
$12,184 |
$11,384 |
6/30/17 |
$10,673 |
$12,260 |
$11,454 |
7/31/17 |
$10,887 |
$12,512 |
$11,672 |
8/31/17 |
$10,956 |
$12,551 |
$11,683 |
9/30/17 |
$11,096 |
$12,810 |
$11,909 |
10/31/17 |
$11,263 |
$13,109 |
$12,102 |
11/30/17 |
$11,439 |
$13,511 |
$12,335 |
12/31/17 |
$11,596 |
$13,661 |
$12,469 |
1/31/18 |
$11,993 |
$14,443 |
$12,929 |
2/28/18 |
$11,566 |
$13,911 |
$12,488 |
3/31/18 |
$11,477 |
$13,557 |
$12,352 |
4/30/18 |
$11,496 |
$13,609 |
$12,422 |
5/31/18 |
$11,566 |
$13,937 |
$12,563 |
6/30/18 |
$11,533 |
$14,023 |
$12,539 |
7/31/18 |
$11,771 |
$14,544 |
$12,820 |
8/31/18 |
$11,860 |
$15,018 |
$12,983 |
9/30/18 |
$11,841 |
$15,104 |
$12,980 |
10/31/18 |
$11,173 |
$14,072 |
$12,169 |
11/30/18 |
$11,342 |
$14,358 |
$12,349 |
12/31/18 |
$10,753 |
$13,062 |
$11,611 |
1/31/19 |
$11,453 |
$14,109 |
$12,388 |
2/28/19 |
$11,651 |
$14,562 |
$12,677 |
3/31/19 |
$11,851 |
$14,845 |
$12,804 |
4/30/19 |
$12,124 |
$15,446 |
$13,151 |
5/31/19 |
$11,683 |
$14,464 |
$12,551 |
6/30/19 |
$12,242 |
$15,483 |
$13,212 |
7/31/19 |
$12,274 |
$15,706 |
$13,267 |
8/31/19 |
$12,211 |
$15,457 |
$13,081 |
9/30/19 |
$12,366 |
$15,746 |
$13,307 |
10/31/19 |
$12,589 |
$16,087 |
$13,571 |
11/30/19 |
$12,811 |
$16,671 |
$13,835 |
12/31/19 |
$13,127 |
$17,175 |
$14,186 |
1/31/20 |
$13,105 |
$17,168 |
$14,081 |
2/29/20 |
$12,468 |
$15,755 |
$13,203 |
3/31/20 |
$10,946 |
$13,809 |
$11,676 |
4/30/20 |
$11,853 |
$15,579 |
$12,723 |
5/31/20 |
$12,296 |
$16,321 |
$13,201 |
6/30/20 |
$12,603 |
$16,645 |
$13,491 |
7/31/20 |
$13,132 |
$17,584 |
$14,030 |
8/31/20 |
$13,651 |
$18,848 |
$14,611 |
9/30/20 |
$13,348 |
$18,132 |
$14,261 |
10/31/20 |
$13,142 |
$17,650 |
$14,051 |
11/30/20 |
$14,331 |
$19,582 |
$15,425 |
12/31/20 |
$14,854 |
$20,334 |
$16,001 |
1/31/21 |
$14,810 |
$20,129 |
$15,962 |
2/28/21 |
$15,029 |
$20,684 |
$16,308 |
3/31/21 |
$15,276 |
$21,590 |
$16,677 |
4/30/21 |
$15,830 |
$22,742 |
$17,252 |
5/31/21 |
$16,052 |
$22,901 |
$17,454 |
6/30/21 |
$16,254 |
$23,436 |
$17,586 |
7/31/21 |
$16,410 |
$23,993 |
$17,708 |
8/31/21 |
$16,701 |
$24,722 |
$18,037 |
9/30/21 |
$16,118 |
$23,572 |
$17,479 |
10/31/21 |
$16,734 |
$25,224 |
$18,129 |
11/30/21 |
$16,476 |
$25,049 |
$17,784 |
12/31/21 |
$17,013 |
$26,172 |
$18,389 |
1/31/22 |
$16,335 |
$24,817 |
$17,569 |
2/28/22 |
$15,933 |
$24,074 |
$17,285 |
3/31/22 |
$16,071 |
$24,968 |
$17,465 |
4/30/22 |
$14,967 |
$22,791 |
$16,325 |
5/31/22 |
$14,967 |
$22,833 |
$16,395 |
6/30/22 |
$13,903 |
$20,948 |
$15,273 |
7/31/22 |
$14,755 |
$22,879 |
$16,213 |
8/31/22 |
$14,202 |
$21,946 |
$15,669 |
9/30/22 |
$12,942 |
$19,925 |
$14,434 |
10/31/22 |
$13,495 |
$21,538 |
$15,137 |
11/30/22 |
$14,534 |
$22,742 |
$16,091 |
12/31/22 |
$14,049 |
$21,432 |
$15,633 |
1/31/23 |
$14,971 |
$22,778 |
$16,583 |
2/28/23 |
$14,498 |
$22,223 |
$16,191 |
3/31/23 |
$14,869 |
$23,038 |
$16,522 |
4/30/23 |
$15,023 |
$23,398 |
$16,712 |
5/31/23 |
$14,798 |
$23,500 |
$16,486 |
6/30/23 |
$15,404 |
$25,053 |
$17,163 |
7/31/23 |
$15,795 |
$25,857 |
$17,604 |
8/31/23 |
$15,380 |
$25,446 |
$17,250 |
9/30/23 |
$14,761 |
$24,232 |
$16,625 |
10/31/23 |
$14,345 |
$23,723 |
$16,188 |
11/30/23 |
$15,439 |
$25,889 |
$17,405 |
12/31/23 |
$16,196 |
$27,066 |
$18,233 |
1/31/24 |
$16,148 |
$27,520 |
$18,257 |
2/29/24 |
$16,534 |
$28,990 |
$18,726 |
3/31/24 |
$16,939 |
$29,923 |
$19,187 |
4/30/24 |
$16,346 |
$28,700 |
$18,611 |
5/31/24 |
$16,952 |
$30,124 |
$19,244 |
6/30/24 |
$17,176 |
$31,204 |
$19,489 |
7/31/24 |
$17,579 |
$31,584 |
$19,936 |
8/31/24 |
$17,945 |
$32,350 |
$20,329 |
9/30/24 |
$18,341 |
$33,041 |
$20,708 |
10/31/24 |
$17,849 |
$32,742 |
$20,231 |
11/30/24 |
$18,341 |
$34,664 |
$20,789 |
12/31/24 |
$17,810 |
$33,837 |
$20,309 |
1/31/25 |
$18,224 |
$34,780 |
$20,782 |
2/28/25 |
$18,411 |
$34,326 |
$20,819 |
3/31/25 |
$17,988 |
$32,392 |
$20,339 |
4/30/25 |
$17,975 |
$32,172 |
$20,480 |
5/31/25 |
$18,527 |
$34,197 |
$21,215 |
6/30/25 |
$19,181 |
$35,936 |
$21,906 |
|
|
| Average Annual Return [Table Text Block] |
Class/Index Name |
1 Year |
5 Years |
10 Years |
Class A (excluding sales charge) |
11.67% |
8.76% |
7.33% |
Class A (including sales charge) |
5.52% |
7.54% |
6.73% |
S&P 500 Index |
15.16% |
16.64% |
13.65% |
S&P Target Date 2035 Index |
12.40% |
10.18% |
8.16% | |
|
| No Deduction of Taxes [Text Block] |
Returns shown do not reflect the deduction of taxes that a shareholder would pay on Fund distributions or the redemption of Fund shares.
|
|
| Performance Table Market Index Changed [Text Block] |
Differences in the Fund’s performance versus an index and related attribution information with respect to particular categories of securities or individual positions may be attributable, in part, to differences in the pricing methodologies used by the Fund and the index.
|
|
| Updated Performance Information Location [Text Block] |
For performance current to the most recent month-end, visit www.pimco.com/literature or via 888.87.PIMCO (888.877.4626).
|
|
| AssetsNet |
$ 638,497,000
|
|
| Holdings Count | Holding |
21
|
|
| Advisory Fees Paid, Amount |
$ 128,000
|
|
| InvestmentCompanyPortfolioTurnover |
18.00%
|
|
| Additional Fund Statistics [Text Block] |
Key Fund StatisticsFootnote Reference† (as of the end of the reporting period)
Total Net Assets |
$638,497 |
# of Portfolio Holdings |
21 |
Portfolio Turnover Rate |
18% |
Total Net Advisory Fees Paid During the Reporting Period |
$128 |
| Footnote |
Description |
Footnote† |
Dollar amounts displayed in 000's | |
|
| Holdings [Text Block] |
Security Type Breakdown (% of Net Asset Value)Footnote Reference*
Mutual Funds |
60.3% |
Short-Term Instruments |
0.2% |
Affiliated Investments |
40.0% |
Financial Derivative Instruments |
(0.1%) |
Other Assets and Liabilities, Net |
(0.4%) |
Total |
100.0% |
| Footnote |
Description |
Footnote* |
% of Net Asset Value includes derivatives instruments, if any, valued at the value used for determining the Fund's net asset value. The notional exposure of such derivatives investments therefore may be greater than what is depicted. | |
|
| Largest Holdings [Text Block] |
Top Holdings (% of Net Asset Value)Footnote Reference**
Vanguard Institutional Index Fund 'Institutional Plus' |
36.2% |
Vanguard Developed Markets Index Fund 'Institutional' |
15.6% |
PIMCO Total Return Fund |
8.6% |
PIMCO Long-Term Real Return Fund |
6.8% |
PIMCO Long-Term U.S. Government Fund |
5.9% |
PIMCO Income Fund |
5.8% |
Vanguard Emerging Markets Stock Index Fund 'Institutional' |
5.7% |
PIMCO Real Return Fund |
3.7% |
Vanguard Small-Cap Index Fund 'Institutional' |
2.7% |
PIMCO Emerging Markets Local Currency and Bond Fund |
2.2% |
| Footnote |
Description |
Footnote** |
Short-Term Instruments/Foreign Currency Contracts are not included in Top Holdings table. | |
|
| Material Fund Change [Text Block] |
This is a summary of certain changes and planned changes of the Fund since the beginning of the reporting period. For more information, you may refer to the Fund's next prospectus, which we expect to be available by October 31, 2025 or upon request at 888.87.PIMCO (888.877.4626). Change to REALPATH Blend Glide Path. Effective February 28, 2025, the Fund’s REALPATH Blend Glide Path, which forms the basis of the Fund’s long-term asset allocations, was changed based on data relating to risk metrics, long-term market trends, correlation of asset types and actuarial assumptions of life expectancy and retirement. Changes to Total Annual Fund Operating Expenses. Annual fund operating expenses increased during the year by 0.10% as a result of the Fund’s exposure to fees and expenses related to the Fund’s investment in underlying funds. |
|
| Material Fund Change Objectives [Text Block] |
Change to REALPATH Blend Glide Path. Effective February 28, 2025, the Fund’s REALPATH Blend Glide Path, which forms the basis of the Fund’s long-term asset allocations, was changed based on data relating to risk metrics, long-term market trends, correlation of asset types and actuarial assumptions of life expectancy and retirement.
|
|
| Material Fund Change Expenses [Text Block] |
Changes to Total Annual Fund Operating Expenses. Annual fund operating expenses increased during the year by 0.10% as a result of the Fund’s exposure to fees and expenses related to the Fund’s investment in underlying funds.
|
|
| Summary of Change Legend [Text Block] |
This is a summary of certain changes and planned changes of the Fund since the beginning of the reporting period. For more information, you may refer to the Fund's next prospectus, which we expect to be available by October 31, 2025 or upon request at 888.87.PIMCO (888.877.4626).
|
|
| C000150057 |
|
|
| Shareholder Report [Line Items] |
|
|
| Fund Name |
PIMCO REALPATH<sup style="box-sizing: border-box; color: rgb(0, 0, 0); display: inline; flex-wrap: nowrap; font-size: 19px; font-weight: 700; grid-area: auto; line-height: 0px; margin: 0px; overflow: visible; position: relative; text-align: left; text-align-last: auto; white-space-collapse: preserve-breaks;">®</sup> Blend 2035 Fund
|
|
| Class Name |
Institutional Class
|
|
| Trading Symbol |
PDGZX
|
|
| Annual or Semi-Annual Statement [Text Block] |
This annual shareholder report contains important information about the PIMCO REALPATH® Blend 2035 Fund (the "Fund") for the period of July 1, 2024 to June 30, 2025 (the "reporting period").
|
|
| Shareholder Report Annual or Semi-Annual |
Annual Shareholder Report
|
|
| Additional Information [Text Block] |
You can find additional information about the Fund at www.pimco.com/literature. You can also request this information by contacting us at 888.87.PIMCO (888.877.4626).
|
|
| Material Fund Change Notice [Text Block] |
This report describes changes to the Fund that occurred during the reporting period.
|
|
| Additional Information Website |
www.pimco.com/literature
|
|
| Expenses [Text Block] |
What were the Fund costs for the reporting period?(based on a hypothetical $10,000 investment)
Class Name |
Cost of a $10,000 investment |
Costs paid as a percentage of a $10,000 investment |
Institutional Class |
$4 |
0.04% | |
|
| Expenses Paid, Amount |
$ 4
|
|
| Expense Ratio, Percent |
0.04%
|
|
| Factors Affecting Performance [Text Block] |
How did the Fund perform during the reporting period and what affected its performance?The following affected performance (on a gross basis) during the reporting period: Exposure to U.S. large cap equities contributed to absolute performance, as U.S. large cap equities posted positive returns. Exposure to global equities contributed to absolute performance, as global equities posted positive returns. Exposure to emerging market equities contributed to absolute performance, as emerging market equities posted positive returns. There were no material detractors from absolute performance for this Fund.
|
|
| Performance Past Does Not Indicate Future [Text] |
Performance quoted represents past performance. Past performance is not a guarantee or a reliable indicator of future results.
|
|
| Line Graph [Table Text Block] |
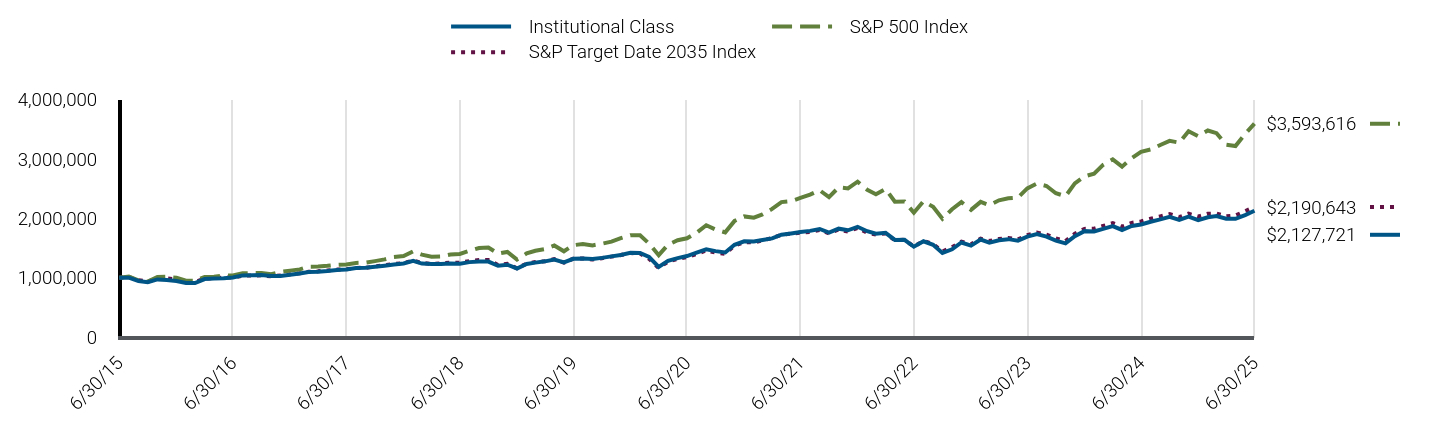
|
Institutional Class |
S&P 500 Index |
S&P Target Date 2035 Index |
6/30/15 |
$1,000,000 |
$1,000,000 |
$1,000,000 |
7/31/15 |
$1,001,992 |
$1,020,951 |
$1,011,688 |
8/31/15 |
$947,211 |
$959,353 |
$960,231 |
9/30/15 |
$925,970 |
$935,615 |
$937,957 |
10/31/15 |
$972,868 |
$1,014,539 |
$991,102 |
11/30/15 |
$963,887 |
$1,017,556 |
$991,632 |
12/31/15 |
$946,579 |
$1,001,507 |
$972,646 |
1/31/16 |
$915,128 |
$951,808 |
$934,649 |
2/29/16 |
$912,084 |
$950,524 |
$930,996 |
3/31/16 |
$979,398 |
$1,015,006 |
$986,214 |
4/30/16 |
$989,558 |
$1,018,940 |
$994,422 |
5/31/16 |
$992,606 |
$1,037,239 |
$1,002,997 |
6/30/16 |
$1,006,430 |
$1,039,926 |
$1,006,090 |
7/31/16 |
$1,041,241 |
$1,078,267 |
$1,036,989 |
8/31/16 |
$1,043,288 |
$1,079,781 |
$1,039,552 |
9/30/16 |
$1,048,042 |
$1,079,985 |
$1,042,945 |
10/31/16 |
$1,030,609 |
$1,060,285 |
$1,024,086 |
11/30/16 |
$1,032,660 |
$1,099,552 |
$1,039,732 |
12/31/16 |
$1,051,146 |
$1,121,286 |
$1,058,745 |
1/31/17 |
$1,072,002 |
$1,142,553 |
$1,077,380 |
2/28/17 |
$1,099,115 |
$1,187,919 |
$1,101,311 |
3/31/17 |
$1,104,329 |
$1,189,305 |
$1,109,631 |
4/30/17 |
$1,116,843 |
$1,201,519 |
$1,122,942 |
5/31/17 |
$1,133,528 |
$1,218,428 |
$1,138,399 |
6/30/17 |
$1,140,141 |
$1,226,033 |
$1,145,391 |
7/31/17 |
$1,164,177 |
$1,251,243 |
$1,167,248 |
8/31/17 |
$1,171,492 |
$1,255,074 |
$1,168,336 |
9/30/17 |
$1,186,643 |
$1,280,963 |
$1,190,905 |
10/31/17 |
$1,204,480 |
$1,310,855 |
$1,210,244 |
11/30/17 |
$1,224,415 |
$1,351,059 |
$1,233,520 |
12/31/17 |
$1,241,702 |
$1,366,081 |
$1,246,941 |
1/31/18 |
$1,285,402 |
$1,444,294 |
$1,292,889 |
2/28/18 |
$1,239,571 |
$1,391,062 |
$1,248,789 |
3/31/18 |
$1,231,044 |
$1,355,710 |
$1,235,159 |
4/30/18 |
$1,233,176 |
$1,360,912 |
$1,242,179 |
5/31/18 |
$1,240,636 |
$1,393,686 |
$1,256,329 |
6/30/18 |
$1,237,691 |
$1,402,264 |
$1,253,913 |
7/31/18 |
$1,264,412 |
$1,454,447 |
$1,281,952 |
8/31/18 |
$1,274,031 |
$1,501,841 |
$1,298,301 |
9/30/18 |
$1,272,990 |
$1,510,389 |
$1,298,024 |
10/31/18 |
$1,202,149 |
$1,407,154 |
$1,216,910 |
11/30/18 |
$1,220,396 |
$1,435,829 |
$1,234,904 |
12/31/18 |
$1,157,716 |
$1,306,187 |
$1,161,144 |
1/31/19 |
$1,233,170 |
$1,410,859 |
$1,238,836 |
2/28/19 |
$1,255,694 |
$1,456,159 |
$1,267,650 |
3/31/19 |
$1,277,420 |
$1,484,455 |
$1,280,394 |
4/30/19 |
$1,306,890 |
$1,544,560 |
$1,315,121 |
5/31/19 |
$1,260,418 |
$1,446,406 |
$1,255,119 |
6/30/19 |
$1,320,265 |
$1,548,343 |
$1,321,151 |
7/31/19 |
$1,324,825 |
$1,570,597 |
$1,326,709 |
8/31/19 |
$1,317,985 |
$1,545,718 |
$1,308,092 |
9/30/19 |
$1,335,999 |
$1,574,639 |
$1,330,712 |
10/31/19 |
$1,361,228 |
$1,608,745 |
$1,357,091 |
11/30/19 |
$1,385,310 |
$1,667,141 |
$1,383,463 |
12/31/19 |
$1,420,207 |
$1,717,458 |
$1,418,640 |
1/31/20 |
$1,417,867 |
$1,716,785 |
$1,408,122 |
2/29/20 |
$1,350,015 |
$1,575,461 |
$1,320,295 |
3/31/20 |
$1,184,789 |
$1,380,871 |
$1,167,612 |
4/30/20 |
$1,284,302 |
$1,557,890 |
$1,272,322 |
5/31/20 |
$1,332,302 |
$1,632,089 |
$1,320,056 |
6/30/20 |
$1,366,089 |
$1,664,547 |
$1,349,149 |
7/31/20 |
$1,423,546 |
$1,758,403 |
$1,403,047 |
8/31/20 |
$1,481,004 |
$1,884,798 |
$1,461,057 |
9/30/20 |
$1,449,403 |
$1,813,182 |
$1,426,101 |
10/31/20 |
$1,427,087 |
$1,764,962 |
$1,405,083 |
11/30/20 |
$1,556,288 |
$1,958,162 |
$1,542,460 |
12/31/20 |
$1,615,224 |
$2,033,450 |
$1,600,075 |
1/31/21 |
$1,610,442 |
$2,012,921 |
$1,596,154 |
2/28/21 |
$1,635,549 |
$2,068,427 |
$1,630,793 |
3/31/21 |
$1,662,925 |
$2,159,015 |
$1,667,677 |
4/30/21 |
$1,724,515 |
$2,274,239 |
$1,725,164 |
5/31/21 |
$1,747,460 |
$2,290,123 |
$1,745,422 |
6/30/21 |
$1,771,584 |
$2,343,585 |
$1,758,575 |
7/31/21 |
$1,789,860 |
$2,399,257 |
$1,770,751 |
8/31/21 |
$1,821,539 |
$2,472,208 |
$1,803,740 |
9/30/21 |
$1,759,384 |
$2,357,226 |
$1,747,853 |
10/31/21 |
$1,826,630 |
$2,522,377 |
$1,812,893 |
11/30/21 |
$1,799,732 |
$2,504,900 |
$1,778,395 |
12/31/21 |
$1,858,384 |
$2,617,160 |
$1,838,891 |
1/31/22 |
$1,784,249 |
$2,481,730 |
$1,756,882 |
2/28/22 |
$1,741,528 |
$2,407,423 |
$1,728,516 |
3/31/22 |
$1,757,156 |
$2,496,810 |
$1,746,511 |
4/30/22 |
$1,637,664 |
$2,279,083 |
$1,632,498 |
5/31/22 |
$1,638,922 |
$2,283,265 |
$1,639,472 |
6/30/22 |
$1,523,070 |
$2,094,795 |
$1,527,329 |
7/31/22 |
$1,615,110 |
$2,287,945 |
$1,621,300 |
8/31/22 |
$1,555,851 |
$2,194,638 |
$1,566,858 |
9/30/22 |
$1,418,787 |
$1,992,515 |
$1,443,366 |
10/31/22 |
$1,479,483 |
$2,153,832 |
$1,513,693 |
11/30/22 |
$1,594,554 |
$2,274,196 |
$1,609,125 |
12/31/22 |
$1,541,120 |
$2,143,170 |
$1,563,323 |
1/31/23 |
$1,643,602 |
$2,277,834 |
$1,658,284 |
2/28/23 |
$1,591,712 |
$2,222,257 |
$1,619,110 |
3/31/23 |
$1,632,623 |
$2,303,845 |
$1,652,162 |
4/30/23 |
$1,650,836 |
$2,339,805 |
$1,671,222 |
5/31/23 |
$1,626,119 |
$2,349,975 |
$1,648,569 |
6/30/23 |
$1,694,526 |
$2,505,250 |
$1,716,310 |
7/31/23 |
$1,737,541 |
$2,585,731 |
$1,760,399 |
8/31/23 |
$1,693,222 |
$2,544,562 |
$1,724,978 |
9/30/23 |
$1,625,246 |
$2,423,243 |
$1,662,461 |
10/31/23 |
$1,580,719 |
$2,372,291 |
$1,618,825 |
11/30/23 |
$1,701,204 |
$2,588,941 |
$1,740,519 |
12/31/23 |
$1,785,546 |
$2,706,559 |
$1,823,325 |
1/31/24 |
$1,780,224 |
$2,752,040 |
$1,825,681 |
2/29/24 |
$1,824,131 |
$2,898,987 |
$1,872,601 |
3/31/24 |
$1,869,205 |
$2,992,260 |
$1,918,666 |
4/30/24 |
$1,805,026 |
$2,870,043 |
$1,861,091 |
5/31/24 |
$1,871,879 |
$3,012,353 |
$1,924,395 |
6/30/24 |
$1,897,352 |
$3,120,443 |
$1,948,921 |
7/31/24 |
$1,943,201 |
$3,158,426 |
$1,993,590 |
8/31/24 |
$1,983,656 |
$3,235,039 |
$2,032,927 |
9/30/24 |
$2,027,758 |
$3,304,130 |
$2,070,810 |
10/31/24 |
$1,974,789 |
$3,274,166 |
$2,023,061 |
11/30/24 |
$2,030,474 |
$3,466,363 |
$2,078,922 |
12/31/24 |
$1,971,693 |
$3,383,732 |
$2,030,913 |
1/31/25 |
$2,018,837 |
$3,477,960 |
$2,078,167 |
2/28/25 |
$2,039,635 |
$3,432,579 |
$2,081,869 |
3/31/25 |
$1,993,271 |
$3,239,172 |
$2,033,943 |
4/30/25 |
$1,991,881 |
$3,217,208 |
$2,047,956 |
5/31/25 |
$2,055,821 |
$3,419,714 |
$2,121,542 |
6/30/25 |
$2,127,721 |
$3,593,616 |
$2,190,643 |
|
|
| Average Annual Return [Table Text Block] |
Class/Index Name |
1 Year |
5 Years |
10 Years |
Institutional Class |
12.14% |
9.27% |
7.84% |
S&P 500 Index |
15.16% |
16.64% |
13.65% |
S&P Target Date 2035 Index |
12.40% |
10.18% |
8.16% | |
|
| No Deduction of Taxes [Text Block] |
Returns shown do not reflect the deduction of taxes that a shareholder would pay on Fund distributions or the redemption of Fund shares.
|
|
| Performance Table Market Index Changed [Text Block] |
Differences in the Fund’s performance versus an index and related attribution information with respect to particular categories of securities or individual positions may be attributable, in part, to differences in the pricing methodologies used by the Fund and the index.
|
|
| Updated Performance Information Location [Text Block] |
For performance current to the most recent month-end, visit www.pimco.com/literature or via 888.87.PIMCO (888.877.4626).
|
|
| AssetsNet |
$ 638,497,000
|
|
| Holdings Count | Holding |
21
|
|
| Advisory Fees Paid, Amount |
$ 128,000
|
|
| InvestmentCompanyPortfolioTurnover |
18.00%
|
|
| Additional Fund Statistics [Text Block] |
Key Fund StatisticsFootnote Reference† (as of the end of the reporting period)
Total Net Assets |
$638,497 |
# of Portfolio Holdings |
21 |
Portfolio Turnover Rate |
18% |
Total Net Advisory Fees Paid During the Reporting Period |
$128 |
| Footnote |
Description |
Footnote† |
Dollar amounts displayed in 000's | |
|
| Holdings [Text Block] |
Security Type Breakdown (% of Net Asset Value)Footnote Reference*
Mutual Funds |
60.3% |
Short-Term Instruments |
0.2% |
Affiliated Investments |
40.0% |
Financial Derivative Instruments |
(0.1%) |
Other Assets and Liabilities, Net |
(0.4%) |
Total |
100.0% |
| Footnote |
Description |
Footnote* |
% of Net Asset Value includes derivatives instruments, if any, valued at the value used for determining the Fund's net asset value. The notional exposure of such derivatives investments therefore may be greater than what is depicted. | |
|
| Largest Holdings [Text Block] |
Top Holdings (% of Net Asset Value)Footnote Reference**
Vanguard Institutional Index Fund 'Institutional Plus' |
36.2% |
Vanguard Developed Markets Index Fund 'Institutional' |
15.6% |
PIMCO Total Return Fund |
8.6% |
PIMCO Long-Term Real Return Fund |
6.8% |
PIMCO Long-Term U.S. Government Fund |
5.9% |
PIMCO Income Fund |
5.8% |
Vanguard Emerging Markets Stock Index Fund 'Institutional' |
5.7% |
PIMCO Real Return Fund |
3.7% |
Vanguard Small-Cap Index Fund 'Institutional' |
2.7% |
PIMCO Emerging Markets Local Currency and Bond Fund |
2.2% |
| Footnote |
Description |
Footnote** |
Short-Term Instruments/Foreign Currency Contracts are not included in Top Holdings table. | |
|
| Material Fund Change [Text Block] |
This is a summary of certain changes and planned changes of the Fund since the beginning of the reporting period. For more information, you may refer to the Fund's next prospectus, which we expect to be available by October 31, 2025 or upon request at 888.87.PIMCO (888.877.4626). Change to REALPATH Blend Glide Path. Effective February 28, 2025, the Fund’s REALPATH Blend Glide Path, which forms the basis of the Fund’s long-term asset allocations, was changed based on data relating to risk metrics, long-term market trends, correlation of asset types and actuarial assumptions of life expectancy and retirement. Changes to Total Annual Fund Operating Expenses. Annual fund operating expenses increased during the year by 0.10% as a result of the Fund’s exposure to fees and expenses related to the Fund’s investment in underlying funds. |
|
| Material Fund Change Objectives [Text Block] |
Change to REALPATH Blend Glide Path. Effective February 28, 2025, the Fund’s REALPATH Blend Glide Path, which forms the basis of the Fund’s long-term asset allocations, was changed based on data relating to risk metrics, long-term market trends, correlation of asset types and actuarial assumptions of life expectancy and retirement.
|
|
| Material Fund Change Expenses [Text Block] |
Changes to Total Annual Fund Operating Expenses. Annual fund operating expenses increased during the year by 0.10% as a result of the Fund’s exposure to fees and expenses related to the Fund’s investment in underlying funds.
|
|
| Summary of Change Legend [Text Block] |
This is a summary of certain changes and planned changes of the Fund since the beginning of the reporting period. For more information, you may refer to the Fund's next prospectus, which we expect to be available by October 31, 2025 or upon request at 888.87.PIMCO (888.877.4626).
|
|
| C000150068 |
|
|
| Shareholder Report [Line Items] |
|
|
| Fund Name |
PIMCO REALPATH<sup style="box-sizing: border-box; color: rgb(0, 0, 0); display: inline; flex-wrap: nowrap; font-size: 19px; font-weight: 700; grid-area: auto; line-height: 0px; margin: 0px; overflow: visible; position: relative; text-align: left; text-align-last: auto; white-space-collapse: preserve-breaks;">®</sup> Blend 2040 Fund
|
|
| Class Name |
Class A
|
|
| Trading Symbol |
PVPAX
|
|
| Annual or Semi-Annual Statement [Text Block] |
This annual shareholder report contains important information about the PIMCO REALPATH® Blend 2040 Fund (the "Fund") for the period of July 1, 2024 to June 30, 2025 (the "reporting period").
|
|
| Shareholder Report Annual or Semi-Annual |
Annual Shareholder Report
|
|
| Additional Information [Text Block] |
You can find additional information about the Fund at www.pimco.com/literature. You can also request this information by contacting us at 888.87.PIMCO (888.877.4626).
|
|
| Material Fund Change Notice [Text Block] |
This report describes changes to the Fund that occurred during the reporting period.
|
|
| Additional Information Website |
www.pimco.com/literature
|
|
| Expenses [Text Block] |
What were the Fund costs for the reporting period?(based on a hypothetical $10,000 investment)
Class Name |
Cost of a $10,000 investment |
Costs paid as a percentage of a $10,000 investment |
Class A |
$53 |
0.50% | |
|
| Expenses Paid, Amount |
$ 53
|
|
| Expense Ratio, Percent |
0.50%
|
|
| Factors Affecting Performance [Text Block] |
How did the Fund perform during the reporting period and what affected its performance?The following affected performance (on a gross basis) during the reporting period: Exposure to U.S. large cap equities contributed to absolute performance, as U.S. large cap equities posted positive returns. Exposure to global equities contributed to absolute performance, as global equities posted positive returns. Exposure to emerging market equities contributed to absolute performance, as emerging market equities posted positive returns. There were no material detractors from absolute performance for this Fund.
|
|
| Performance Past Does Not Indicate Future [Text] |
Performance quoted represents past performance. Past performance is not a guarantee or a reliable indicator of future results.
|
|
| Line Graph [Table Text Block] |
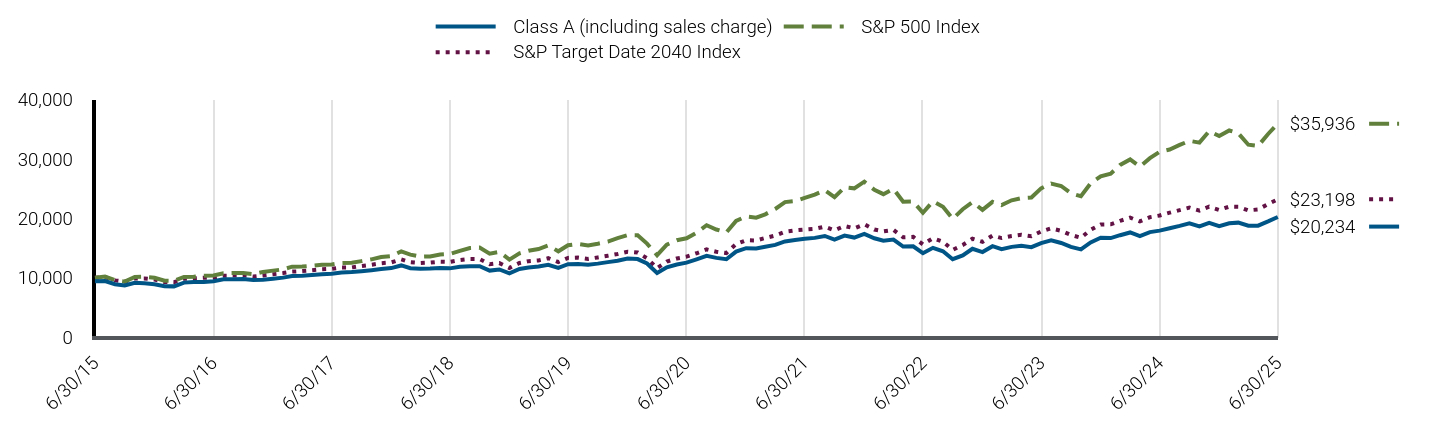
|
Class A (including sales charge) |
S&P 500 Index |
S&P Target Date 2040 Index |
6/30/15 |
$9,447 |
$10,000 |
$10,000 |
7/31/15 |
$9,456 |
$10,210 |
$10,119 |
8/31/15 |
$8,931 |
$9,594 |
$9,577 |
9/30/15 |
$8,724 |
$9,356 |
$9,340 |
10/31/15 |
$9,175 |
$10,145 |
$9,898 |
11/30/15 |
$9,100 |
$10,176 |
$9,906 |
12/31/15 |
$8,936 |
$10,015 |
$9,706 |
1/31/16 |
$8,594 |
$9,518 |
$9,301 |
2/29/16 |
$8,565 |
$9,505 |
$9,258 |
3/31/16 |
$9,196 |
$10,150 |
$9,834 |
4/30/16 |
$9,282 |
$10,189 |
$9,919 |
5/31/16 |
$9,310 |
$10,372 |
$10,009 |
6/30/16 |
$9,437 |
$10,399 |
$10,032 |
7/31/16 |
$9,754 |
$10,783 |
$10,356 |
8/31/16 |
$9,773 |
$10,798 |
$10,384 |
9/30/16 |
$9,808 |
$10,800 |
$10,420 |
10/31/16 |
$9,635 |
$10,603 |
$10,224 |
11/30/16 |
$9,674 |
$10,996 |
$10,402 |
12/31/16 |
$9,842 |
$11,213 |
$10,602 |
1/31/17 |
$10,036 |
$11,426 |
$10,799 |
2/28/17 |
$10,299 |
$11,879 |
$11,050 |
3/31/17 |
$10,347 |
$11,893 |
$11,139 |
4/30/17 |
$10,464 |
$12,015 |
$11,276 |
5/31/17 |
$10,620 |
$12,184 |
$11,437 |
6/30/17 |
$10,686 |
$12,260 |
$11,514 |
7/31/17 |
$10,910 |
$12,512 |
$11,746 |
8/31/17 |
$10,968 |
$12,551 |
$11,751 |
9/30/17 |
$11,124 |
$12,810 |
$11,998 |
10/31/17 |
$11,290 |
$13,109 |
$12,207 |
11/30/17 |
$11,485 |
$13,511 |
$12,461 |
12/31/17 |
$11,638 |
$13,661 |
$12,602 |
1/31/18 |
$12,085 |
$14,443 |
$13,107 |
2/28/18 |
$11,628 |
$13,911 |
$12,633 |
3/31/18 |
$11,529 |
$13,557 |
$12,483 |
4/30/18 |
$11,558 |
$13,609 |
$12,563 |
5/31/18 |
$11,638 |
$13,937 |
$12,715 |
6/30/18 |
$11,596 |
$14,023 |
$12,688 |
7/31/18 |
$11,864 |
$14,544 |
$12,990 |
8/31/18 |
$11,953 |
$15,018 |
$13,159 |
9/30/18 |
$11,948 |
$15,104 |
$13,160 |
10/31/18 |
$11,220 |
$14,072 |
$12,284 |
11/30/18 |
$11,409 |
$14,358 |
$12,475 |
12/31/18 |
$10,751 |
$13,062 |
$11,669 |
1/31/19 |
$11,491 |
$14,109 |
$12,497 |
2/28/19 |
$11,721 |
$14,562 |
$12,807 |
3/31/19 |
$11,901 |
$14,845 |
$12,932 |
4/30/19 |
$12,204 |
$15,446 |
$13,306 |
5/31/19 |
$11,681 |
$14,464 |
$12,645 |
6/30/19 |
$12,290 |
$15,483 |
$13,355 |
7/31/19 |
$12,322 |
$15,706 |
$13,412 |
8/31/19 |
$12,206 |
$15,457 |
$13,183 |
9/30/19 |
$12,388 |
$15,746 |
$13,434 |
10/31/19 |
$12,642 |
$16,087 |
$13,720 |
11/30/19 |
$12,885 |
$16,671 |
$14,008 |
12/31/19 |
$13,241 |
$17,175 |
$14,395 |
1/31/20 |
$13,154 |
$17,168 |
$14,259 |
2/29/20 |
$12,409 |
$15,755 |
$13,281 |
3/31/20 |
$10,821 |
$13,809 |
$11,626 |
4/30/20 |
$11,783 |
$15,579 |
$12,738 |
5/31/20 |
$12,247 |
$16,321 |
$13,251 |
6/30/20 |
$12,557 |
$16,645 |
$13,563 |
7/31/20 |
$13,108 |
$17,584 |
$14,136 |
8/31/20 |
$13,691 |
$18,848 |
$14,782 |
9/30/20 |
$13,355 |
$18,132 |
$14,396 |
10/31/20 |
$13,128 |
$17,650 |
$14,173 |
11/30/20 |
$14,415 |
$19,582 |
$15,678 |
12/31/20 |
$14,990 |
$20,334 |
$16,319 |
1/31/21 |
$14,936 |
$20,129 |
$16,287 |
2/28/21 |
$15,220 |
$20,684 |
$16,696 |
3/31/21 |
$15,538 |
$21,590 |
$17,124 |
4/30/21 |
$16,123 |
$22,742 |
$17,757 |
5/31/21 |
$16,367 |
$22,901 |
$17,982 |
6/30/21 |
$16,563 |
$23,436 |
$18,115 |
7/31/21 |
$16,719 |
$23,993 |
$18,236 |
8/31/21 |
$17,042 |
$24,722 |
$18,612 |
9/30/21 |
$16,416 |
$23,572 |
$17,989 |
10/31/21 |
$17,097 |
$25,224 |
$18,727 |
11/30/21 |
$16,773 |
$25,049 |
$18,328 |
12/31/21 |
$17,381 |
$26,172 |
$19,020 |
1/31/22 |
$16,657 |
$24,817 |
$18,120 |
2/28/22 |
$16,244 |
$24,074 |
$17,817 |
3/31/22 |
$16,428 |
$24,968 |
$18,063 |
4/30/22 |
$15,268 |
$22,791 |
$16,820 |
5/31/22 |
$15,291 |
$22,833 |
$16,891 |
6/30/22 |
$14,148 |
$20,948 |
$15,623 |
7/31/22 |
$15,044 |
$22,879 |
$16,663 |
8/31/22 |
$14,470 |
$21,946 |
$16,074 |
9/30/22 |
$13,134 |
$19,925 |
$14,713 |
10/31/22 |
$13,767 |
$21,538 |
$15,525 |
11/30/22 |
$14,882 |
$22,742 |
$16,581 |
12/31/22 |
$14,340 |
$21,432 |
$16,061 |
1/31/23 |
$15,328 |
$22,778 |
$17,108 |
2/28/23 |
$14,834 |
$22,223 |
$16,689 |
3/31/23 |
$15,209 |
$23,038 |
$17,037 |
4/30/23 |
$15,386 |
$23,398 |
$17,247 |
5/31/23 |
$15,162 |
$23,500 |
$16,995 |
6/30/23 |
$15,846 |
$25,053 |
$17,798 |
7/31/23 |
$16,306 |
$25,857 |
$18,322 |
8/31/23 |
$15,858 |
$25,446 |
$17,911 |
9/30/23 |
$15,202 |
$24,232 |
$17,223 |
10/31/23 |
$14,776 |
$23,723 |
$16,734 |
11/30/23 |
$15,947 |
$25,889 |
$18,077 |
12/31/23 |
$16,738 |
$27,066 |
$18,979 |
1/31/24 |
$16,690 |
$27,520 |
$19,004 |
2/29/24 |
$17,170 |
$28,990 |
$19,593 |
3/31/24 |
$17,630 |
$29,923 |
$20,122 |
4/30/24 |
$17,016 |
$28,700 |
$19,490 |
5/31/24 |
$17,690 |
$30,124 |
$20,203 |
6/30/24 |
$17,939 |
$31,204 |
$20,477 |
7/31/24 |
$18,351 |
$31,584 |
$20,959 |
8/31/24 |
$18,739 |
$32,350 |
$21,392 |
9/30/24 |
$19,160 |
$33,041 |
$21,807 |
10/31/24 |
$18,661 |
$32,742 |
$21,301 |
11/30/24 |
$19,246 |
$34,664 |
$21,965 |
12/31/24 |
$18,699 |
$33,837 |
$21,421 |
1/31/25 |
$19,171 |
$34,780 |
$21,971 |
2/28/25 |
$19,283 |
$34,326 |
$21,949 |
3/31/25 |
$18,759 |
$32,392 |
$21,352 |
4/30/25 |
$18,772 |
$32,172 |
$21,498 |
5/31/25 |
$19,493 |
$34,197 |
$22,399 |
6/30/25 |
$20,234 |
$35,936 |
$23,198 |
|
|
| Average Annual Return [Table Text Block] |
Class/Index Name |
1 Year |
5 Years |
10 Years |
Class A (excluding sales charge) |
12.79% |
10.01% |
7.91% |
Class A (including sales charge) |
6.60% |
8.77% |
7.30% |
S&P 500 Index |
15.16% |
16.64% |
13.65% |
S&P Target Date 2040 Index |
13.28% |
11.33% |
8.78% | |
|
| No Deduction of Taxes [Text Block] |
Returns shown do not reflect the deduction of taxes that a shareholder would pay on Fund distributions or the redemption of Fund shares.
|
|
| Performance Table Market Index Changed [Text Block] |
Differences in the Fund’s performance versus an index and related attribution information with respect to particular categories of securities or individual positions may be attributable, in part, to differences in the pricing methodologies used by the Fund and the index.
|
|
| Updated Performance Information Location [Text Block] |
For performance current to the most recent month-end, visit www.pimco.com/literature or via 888.87.PIMCO (888.877.4626).
|
|
| AssetsNet |
$ 575,615,000
|
|
| Holdings Count | Holding |
20
|
|
| Advisory Fees Paid, Amount |
$ 171,000
|
|
| InvestmentCompanyPortfolioTurnover |
15.00%
|
|
| Additional Fund Statistics [Text Block] |
Key Fund StatisticsFootnote Reference† (as of the end of the reporting period)
Total Net Assets |
$575,615 |
# of Portfolio Holdings |
20 |
Portfolio Turnover Rate |
15% |
Total Net Advisory Fees Paid During the Reporting Period |
$171 |
| Footnote |
Description |
Footnote† |
Dollar amounts displayed in 000's | |
|
| Holdings [Text Block] |
Security Type Breakdown (% of Net Asset Value)Footnote Reference*
Mutual Funds |
71.5% |
Short-Term Instruments |
0.1% |
Affiliated Investments |
29.3% |
Financial Derivative Instruments |
(0.1%) |
Other Assets and Liabilities, Net |
(0.8%) |
Total |
100.0% |
| Footnote |
Description |
Footnote* |
% of Net Asset Value includes derivatives instruments, if any, valued at the value used for determining the Fund's net asset value. The notional exposure of such derivatives investments therefore may be greater than what is depicted. | |
|
| Largest Holdings [Text Block] |
Top Holdings (% of Net Asset Value)Footnote Reference**
Vanguard Institutional Index Fund 'Institutional Plus' |
42.9% |
Vanguard Developed Markets Index Fund 'Institutional' |
18.4% |
Vanguard Emerging Markets Stock Index Fund 'Institutional' |
7.2% |
PIMCO Total Return Fund |
5.9% |
PIMCO Long-Term Real Return Fund |
4.8% |
PIMCO Income Fund |
3.8% |
PIMCO Long-Term U.S. Government Fund |
3.5% |
Vanguard Small-Cap Index Fund 'Institutional' |
3.0% |
PIMCO Real Return Fund |
2.6% |
PIMCO Emerging Markets Local Currency and Bond Fund |
1.7% |
| Footnote |
Description |
Footnote** |
Short-Term Instruments/Foreign Currency Contracts are not included in Top Holdings table. | |
|
| Material Fund Change [Text Block] |
This is a summary of certain changes and planned changes of the Fund since the beginning of the reporting period. For more information, you may refer to the Fund's next prospectus, which we expect to be available by October 31, 2025 or upon request at 888.87.PIMCO (888.877.4626). Change to REALPATH Blend Glide Path. Effective February 28, 2025, the Fund’s REALPATH Blend Glide Path, which forms the basis of the Fund’s long-term asset allocations, was changed based on data relating to risk metrics, long-term market trends, correlation of asset types and actuarial assumptions of life expectancy and retirement. Changes to Total Annual Fund Operating Expenses. Annual fund operating expenses increased during the year by 0.05% as a result of the Fund’s exposure to fees and expenses related to the Fund’s investment in underlying funds. |
|
| Material Fund Change Objectives [Text Block] |
Change to REALPATH Blend Glide Path. Effective February 28, 2025, the Fund’s REALPATH Blend Glide Path, which forms the basis of the Fund’s long-term asset allocations, was changed based on data relating to risk metrics, long-term market trends, correlation of asset types and actuarial assumptions of life expectancy and retirement.
|
|
| Material Fund Change Expenses [Text Block] |
Changes to Total Annual Fund Operating Expenses. Annual fund operating expenses increased during the year by 0.05% as a result of the Fund’s exposure to fees and expenses related to the Fund’s investment in underlying funds.
|
|
| Summary of Change Legend [Text Block] |
This is a summary of certain changes and planned changes of the Fund since the beginning of the reporting period. For more information, you may refer to the Fund's next prospectus, which we expect to be available by October 31, 2025 or upon request at 888.87.PIMCO (888.877.4626).
|
|
| C000150064 |
|
|
| Shareholder Report [Line Items] |
|
|
| Fund Name |
PIMCO REALPATH<sup style="box-sizing: border-box; color: rgb(0, 0, 0); display: inline; flex-wrap: nowrap; font-size: 19px; font-weight: 700; grid-area: auto; line-height: 0px; margin: 0px; overflow: visible; position: relative; text-align: left; text-align-last: auto; white-space-collapse: preserve-breaks;">®</sup> Blend 2040 Fund
|
|
| Class Name |
Institutional Class
|
|
| Trading Symbol |
PVPNX
|
|
| Annual or Semi-Annual Statement [Text Block] |
This annual shareholder report contains important information about the PIMCO REALPATH® Blend 2040 Fund (the "Fund") for the period of July 1, 2024 to June 30, 2025 (the "reporting period").
|
|
| Shareholder Report Annual or Semi-Annual |
Annual Shareholder Report
|
|
| Additional Information [Text Block] |
You can find additional information about the Fund at www.pimco.com/literature. You can also request this information by contacting us at 888.87.PIMCO (888.877.4626).
|
|
| Material Fund Change Notice [Text Block] |
This report describes changes to the Fund that occurred during the reporting period.
|
|
| Additional Information Website |
www.pimco.com/literature
|
|
| Expenses [Text Block] |
What were the Fund costs for the reporting period?(based on a hypothetical $10,000 investment)
Class Name |
Cost of a $10,000 investment |
Costs paid as a percentage of a $10,000 investment |
Institutional Class |
$5 |
0.05% | |
|
| Expenses Paid, Amount |
$ 5
|
|
| Expense Ratio, Percent |
0.05%
|
|
| Factors Affecting Performance [Text Block] |
How did the Fund perform during the reporting period and what affected its performance?The following affected performance (on a gross basis) during the reporting period: Exposure to U.S. large cap equities contributed to absolute performance, as U.S. large cap equities posted positive returns. Exposure to global equities contributed to absolute performance, as global equities posted positive returns. Exposure to emerging market equities contributed to absolute performance, as emerging market equities posted positive returns. There were no material detractors from absolute performance for this Fund.
|
|
| Performance Past Does Not Indicate Future [Text] |
Performance quoted represents past performance. Past performance is not a guarantee or a reliable indicator of future results.
|
|
| Line Graph [Table Text Block] |

|
Institutional Class |
S&P 500 Index |
S&P Target Date 2040 Index |
6/30/15 |
$1,000,000 |
$1,000,000 |
$1,000,000 |
7/31/15 |
$1,001,986 |
$1,020,951 |
$1,011,922 |
8/31/15 |
$946,375 |
$959,353 |
$957,734 |
9/30/15 |
$925,435 |
$935,615 |
$934,031 |
10/31/15 |
$973,200 |
$1,014,539 |
$989,817 |
11/30/15 |
$965,239 |
$1,017,556 |
$990,572 |
12/31/15 |
$948,447 |
$1,001,507 |
$970,637 |
1/31/16 |
$913,095 |
$951,808 |
$930,117 |
2/29/16 |
$910,065 |
$950,524 |
$925,838 |
3/31/16 |
$977,986 |
$1,015,006 |
$983,448 |
4/30/16 |
$987,097 |
$1,018,940 |
$991,935 |
5/31/16 |
$990,135 |
$1,037,239 |
$1,000,882 |
6/30/16 |
$1,004,823 |
$1,039,926 |
$1,003,216 |
7/31/16 |
$1,038,521 |
$1,078,267 |
$1,035,643 |
8/31/16 |
$1,040,563 |
$1,079,781 |
$1,038,439 |
9/30/16 |
$1,045,341 |
$1,079,985 |
$1,042,000 |
10/31/16 |
$1,027,953 |
$1,060,285 |
$1,022,449 |
11/30/16 |
$1,031,022 |
$1,099,552 |
$1,040,233 |
12/31/16 |
$1,049,429 |
$1,121,286 |
$1,060,199 |
1/31/17 |
$1,071,205 |
$1,142,553 |
$1,079,908 |
2/28/17 |
$1,099,204 |
$1,187,919 |
$1,104,974 |
3/31/17 |
$1,105,426 |
$1,189,305 |
$1,113,908 |
4/30/17 |
$1,118,907 |
$1,201,519 |
$1,127,612 |
5/31/17 |
$1,135,498 |
$1,218,428 |
$1,143,698 |
6/30/17 |
$1,142,811 |
$1,226,033 |
$1,151,353 |
7/31/17 |
$1,167,745 |
$1,251,243 |
$1,174,559 |
8/31/17 |
$1,175,018 |
$1,255,074 |
$1,175,112 |
9/30/17 |
$1,191,727 |
$1,280,963 |
$1,199,822 |
10/31/17 |
$1,210,494 |
$1,310,855 |
$1,220,728 |
11/30/17 |
$1,231,347 |
$1,351,059 |
$1,246,073 |
12/31/17 |
$1,248,237 |
$1,366,081 |
$1,260,212 |
1/31/18 |
$1,297,104 |
$1,444,294 |
$1,310,696 |
2/28/18 |
$1,248,237 |
$1,391,062 |
$1,263,347 |
3/31/18 |
$1,238,676 |
$1,355,710 |
$1,248,320 |
4/30/18 |
$1,241,863 |
$1,360,912 |
$1,256,296 |
5/31/18 |
$1,250,362 |
$1,393,686 |
$1,271,545 |
6/30/18 |
$1,247,564 |
$1,402,264 |
$1,268,755 |
7/31/18 |
$1,276,329 |
$1,454,447 |
$1,298,952 |
8/31/18 |
$1,286,983 |
$1,501,841 |
$1,315,916 |
9/30/18 |
$1,286,427 |
$1,510,389 |
$1,315,951 |
10/31/18 |
$1,209,306 |
$1,407,154 |
$1,228,362 |
11/30/18 |
$1,229,657 |
$1,435,829 |
$1,247,453 |
12/31/18 |
$1,158,618 |
$1,306,187 |
$1,166,877 |
1/31/19 |
$1,239,295 |
$1,410,859 |
$1,249,693 |
2/28/19 |
$1,263,946 |
$1,456,159 |
$1,280,657 |
3/31/19 |
$1,284,571 |
$1,484,455 |
$1,293,158 |
4/30/19 |
$1,318,375 |
$1,544,560 |
$1,330,558 |
5/31/19 |
$1,262,034 |
$1,446,406 |
$1,264,491 |
6/30/19 |
$1,327,944 |
$1,548,343 |
$1,335,495 |
7/31/19 |
$1,332,480 |
$1,570,597 |
$1,341,196 |
8/31/19 |
$1,320,006 |
$1,545,718 |
$1,318,267 |
9/30/19 |
$1,340,745 |
$1,574,639 |
$1,343,430 |
10/31/19 |
$1,368,131 |
$1,608,745 |
$1,371,966 |
11/30/19 |
$1,395,516 |
$1,667,141 |
$1,400,820 |
12/31/19 |
$1,433,465 |
$1,717,458 |
$1,439,548 |
1/31/20 |
$1,426,473 |
$1,716,785 |
$1,425,883 |
2/29/20 |
$1,346,059 |
$1,575,461 |
$1,328,103 |
3/31/20 |
$1,173,193 |
$1,380,871 |
$1,162,592 |
4/30/20 |
$1,278,151 |
$1,557,890 |
$1,273,838 |
5/31/20 |
$1,329,464 |
$1,632,089 |
$1,325,107 |
6/30/20 |
$1,364,588 |
$1,664,547 |
$1,356,310 |
7/31/20 |
$1,424,172 |
$1,758,403 |
$1,413,558 |
8/31/20 |
$1,487,261 |
$1,884,798 |
$1,478,242 |
9/30/20 |
$1,452,184 |
$1,813,182 |
$1,439,617 |
10/31/20 |
$1,428,781 |
$1,764,962 |
$1,417,252 |
11/30/20 |
$1,569,202 |
$1,958,162 |
$1,567,827 |
12/31/20 |
$1,631,346 |
$2,033,450 |
$1,631,948 |
1/31/21 |
$1,627,784 |
$2,012,921 |
$1,628,742 |
2/28/21 |
$1,658,654 |
$2,068,427 |
$1,669,561 |
3/31/21 |
$1,693,578 |
$2,159,015 |
$1,712,430 |
4/30/21 |
$1,759,499 |
$2,274,239 |
$1,775,655 |
5/31/21 |
$1,785,868 |
$2,290,123 |
$1,798,193 |
6/30/21 |
$1,808,131 |
$2,343,585 |
$1,811,543 |
7/31/21 |
$1,826,261 |
$2,399,257 |
$1,823,605 |
8/31/21 |
$1,861,312 |
$2,472,208 |
$1,861,223 |
9/30/21 |
$1,793,632 |
$2,357,226 |
$1,798,913 |
10/31/21 |
$1,868,872 |
$2,522,377 |
$1,872,742 |
11/30/21 |
$1,834,893 |
$2,504,900 |
$1,832,791 |
12/31/21 |
$1,902,148 |
$2,617,160 |
$1,902,001 |
1/31/22 |
$1,823,464 |
$2,481,730 |
$1,812,023 |
2/28/22 |
$1,778,502 |
$2,407,423 |
$1,781,738 |
3/31/22 |
$1,800,103 |
$2,496,810 |
$1,806,270 |
4/30/22 |
$1,673,934 |
$2,279,083 |
$1,682,007 |
5/31/22 |
$1,676,432 |
$2,283,265 |
$1,689,105 |
6/30/22 |
$1,551,438 |
$2,094,795 |
$1,562,343 |
7/31/22 |
$1,650,279 |
$2,287,945 |
$1,666,318 |
8/31/22 |
$1,587,721 |
$2,194,638 |
$1,607,373 |
9/30/22 |
$1,442,042 |
$1,992,515 |
$1,471,258 |
10/31/22 |
$1,512,263 |
$2,153,832 |
$1,552,542 |
11/30/22 |
$1,635,150 |
$2,274,196 |
$1,658,064 |
12/31/22 |
$1,575,704 |
$2,143,170 |
$1,606,127 |
1/31/23 |
$1,684,861 |
$2,277,834 |
$1,710,826 |
2/28/23 |
$1,632,209 |
$2,222,257 |
$1,668,916 |
3/31/23 |
$1,673,336 |
$2,303,845 |
$1,703,711 |
4/30/23 |
$1,693,947 |
$2,339,805 |
$1,724,654 |
5/31/23 |
$1,669,472 |
$2,349,975 |
$1,699,515 |
6/30/23 |
$1,746,135 |
$2,505,250 |
$1,779,846 |
7/31/23 |
$1,796,430 |
$2,585,731 |
$1,832,158 |
8/31/23 |
$1,748,714 |
$2,544,562 |
$1,791,089 |
9/30/23 |
$1,677,073 |
$2,423,243 |
$1,722,277 |
10/31/23 |
$1,630,452 |
$2,372,291 |
$1,673,360 |
11/30/23 |
$1,761,251 |
$2,588,941 |
$1,807,723 |
12/31/23 |
$1,847,540 |
$2,706,559 |
$1,897,855 |
1/31/24 |
$1,843,595 |
$2,752,040 |
$1,900,408 |
2/29/24 |
$1,897,509 |
$2,898,987 |
$1,959,271 |
3/31/24 |
$1,948,344 |
$2,992,260 |
$2,012,168 |
4/30/24 |
$1,882,299 |
$2,870,043 |
$1,949,017 |
5/31/24 |
$1,956,270 |
$3,012,353 |
$2,020,306 |
6/30/24 |
$1,985,724 |
$3,120,443 |
$2,047,749 |
7/31/24 |
$2,030,975 |
$3,158,426 |
$2,095,907 |
8/31/24 |
$2,076,226 |
$3,235,039 |
$2,139,218 |
9/30/24 |
$2,123,019 |
$3,304,130 |
$2,180,735 |
10/31/24 |
$2,069,442 |
$3,274,166 |
$2,130,055 |
11/30/24 |
$2,133,735 |
$3,466,363 |
$2,196,527 |
12/31/24 |
$2,073,675 |
$3,383,732 |
$2,142,100 |
1/31/25 |
$2,126,952 |
$3,477,960 |
$2,197,078 |
2/28/25 |
$2,140,612 |
$3,432,579 |
$2,194,870 |
3/31/25 |
$2,083,616 |
$3,239,172 |
$2,135,162 |
4/30/25 |
$2,084,986 |
$3,217,208 |
$2,149,822 |
5/31/25 |
$2,167,180 |
$3,419,714 |
$2,239,903 |
6/30/25 |
$2,249,720 |
$3,593,616 |
$2,319,750 |
|
|
| Average Annual Return [Table Text Block] |
Class/Index Name |
1 Year |
5 Years |
10 Years |
Institutional Class |
13.29% |
10.52% |
8.45% |
S&P 500 Index |
15.16% |
16.64% |
13.65% |
S&P Target Date 2040 Index |
13.28% |
11.33% |
8.78% | |
|
| No Deduction of Taxes [Text Block] |
Returns shown do not reflect the deduction of taxes that a shareholder would pay on Fund distributions or the redemption of Fund shares.
|
|
| Performance Table Market Index Changed [Text Block] |
Differences in the Fund’s performance versus an index and related attribution information with respect to particular categories of securities or individual positions may be attributable, in part, to differences in the pricing methodologies used by the Fund and the index.
|
|
| Updated Performance Information Location [Text Block] |
For performance current to the most recent month-end, visit www.pimco.com/literature or via 888.87.PIMCO (888.877.4626).
|
|
| AssetsNet |
$ 575,615,000
|
|
| Holdings Count | Holding |
20
|
|
| Advisory Fees Paid, Amount |
$ 171,000
|
|
| InvestmentCompanyPortfolioTurnover |
15.00%
|
|
| Additional Fund Statistics [Text Block] |
Key Fund StatisticsFootnote Reference† (as of the end of the reporting period)
Total Net Assets |
$575,615 |
# of Portfolio Holdings |
20 |
Portfolio Turnover Rate |
15% |
Total Net Advisory Fees Paid During the Reporting Period |
$171 |
| Footnote |
Description |
Footnote† |
Dollar amounts displayed in 000's | |
|
| Holdings [Text Block] |
Security Type Breakdown (% of Net Asset Value)Footnote Reference*
Mutual Funds |
71.5% |
Short-Term Instruments |
0.1% |
Affiliated Investments |
29.3% |
Financial Derivative Instruments |
(0.1%) |
Other Assets and Liabilities, Net |
(0.8%) |
Total |
100.0% |
| Footnote |
Description |
Footnote* |
% of Net Asset Value includes derivatives instruments, if any, valued at the value used for determining the Fund's net asset value. The notional exposure of such derivatives investments therefore may be greater than what is depicted. | |
|
| Largest Holdings [Text Block] |
Top Holdings (% of Net Asset Value)Footnote Reference**
Vanguard Institutional Index Fund 'Institutional Plus' |
42.9% |
Vanguard Developed Markets Index Fund 'Institutional' |
18.4% |
Vanguard Emerging Markets Stock Index Fund 'Institutional' |
7.2% |
PIMCO Total Return Fund |
5.9% |
PIMCO Long-Term Real Return Fund |
4.8% |
PIMCO Income Fund |
3.8% |
PIMCO Long-Term U.S. Government Fund |
3.5% |
Vanguard Small-Cap Index Fund 'Institutional' |
3.0% |
PIMCO Real Return Fund |
2.6% |
PIMCO Emerging Markets Local Currency and Bond Fund |
1.7% |
| Footnote |
Description |
Footnote** |
Short-Term Instruments/Foreign Currency Contracts are not included in Top Holdings table. | |
|
| Material Fund Change [Text Block] |
This is a summary of certain changes and planned changes of the Fund since the beginning of the reporting period. For more information, you may refer to the Fund's next prospectus, which we expect to be available by October 31, 2025 or upon request at 888.87.PIMCO (888.877.4626). Change to REALPATH Blend Glide Path. Effective February 28, 2025, the Fund’s REALPATH Blend Glide Path, which forms the basis of the Fund’s long-term asset allocations, was changed based on data relating to risk metrics, long-term market trends, correlation of asset types and actuarial assumptions of life expectancy and retirement. Changes to Total Annual Fund Operating Expenses. Annual fund operating expenses increased during the year by 0.05% as a result of the Fund’s exposure to fees and expenses related to the Fund’s investment in underlying funds. |
|
| Material Fund Change Objectives [Text Block] |
Change to REALPATH Blend Glide Path. Effective February 28, 2025, the Fund’s REALPATH Blend Glide Path, which forms the basis of the Fund’s long-term asset allocations, was changed based on data relating to risk metrics, long-term market trends, correlation of asset types and actuarial assumptions of life expectancy and retirement.
|
|
| Material Fund Change Expenses [Text Block] |
Changes to Total Annual Fund Operating Expenses. Annual fund operating expenses increased during the year by 0.05% as a result of the Fund’s exposure to fees and expenses related to the Fund’s investment in underlying funds.
|
|
| Summary of Change Legend [Text Block] |
This is a summary of certain changes and planned changes of the Fund since the beginning of the reporting period. For more information, you may refer to the Fund's next prospectus, which we expect to be available by October 31, 2025 or upon request at 888.87.PIMCO (888.877.4626).
|
|
| C000150075 |
|
|
| Shareholder Report [Line Items] |
|
|
| Fund Name |
PIMCO REALPATH<sup style="box-sizing: border-box; color: rgb(0, 0, 0); display: inline; flex-wrap: nowrap; font-size: 19px; font-weight: 700; grid-area: auto; line-height: 0px; margin: 0px; overflow: visible; position: relative; text-align: left; text-align-last: auto; white-space-collapse: preserve-breaks;">®</sup> Blend 2045 Fund
|
|
| Class Name |
Class A
|
|
| Trading Symbol |
PVQAX
|
|
| Annual or Semi-Annual Statement [Text Block] |
This annual shareholder report contains important information about the PIMCO REALPATH® Blend 2045 Fund (the "Fund") for the period of July 1, 2024 to June 30, 2025 (the "reporting period").
|
|
| Shareholder Report Annual or Semi-Annual |
Annual Shareholder Report
|
|
| Additional Information [Text Block] |
You can find additional information about the Fund at www.pimco.com/literature. You can also request this information by contacting us at 888.87.PIMCO (888.877.4626).
|
|
| Material Fund Change Notice [Text Block] |
This report describes changes to the Fund that occurred during the reporting period.
|
|
| Additional Information Website |
www.pimco.com/literature
|
|
| Expenses [Text Block] |
What were the Fund costs for the reporting period?(based on a hypothetical $10,000 investment)
Class Name |
Cost of a $10,000 investment |
Costs paid as a percentage of a $10,000 investment |
Class A |
$53 |
0.50% | |
|
| Expenses Paid, Amount |
$ 53
|
|
| Expense Ratio, Percent |
0.50%
|
|
| Factors Affecting Performance [Text Block] |
How did the Fund perform during the reporting period and what affected its performance?The following affected performance (on a gross basis) during the reporting period: Exposure to U.S. large cap equities contributed to absolute performance, as U.S. large cap equities posted positive returns. Exposure to global equities contributed to absolute performance, as global equities posted positive returns. Exposure to emerging market equities contributed to absolute performance, as emerging market equities posted positive returns. There were no material detractors from absolute performance for this Fund.
|
|
| Performance Past Does Not Indicate Future [Text] |
Performance quoted represents past performance. Past performance is not a guarantee or a reliable indicator of future results.
|
|
| Line Graph [Table Text Block] |
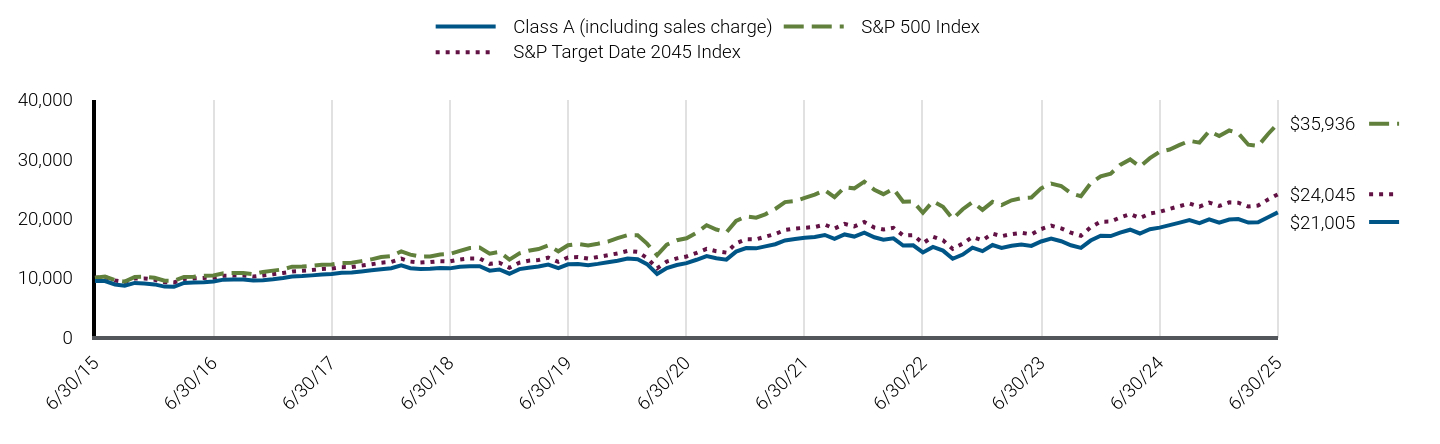
|
Class A (including sales charge) |
S&P 500 Index |
S&P Target Date 2045 Index |
6/30/15 |
$9,448 |
$10,000 |
$10,000 |
7/31/15 |
$9,448 |
$10,210 |
$10,121 |
8/31/15 |
$8,886 |
$9,594 |
$9,556 |
9/30/15 |
$8,676 |
$9,356 |
$9,307 |
10/31/15 |
$9,145 |
$10,145 |
$9,887 |
11/30/15 |
$9,060 |
$10,176 |
$9,896 |
12/31/15 |
$8,897 |
$10,015 |
$9,689 |
1/31/16 |
$8,527 |
$9,518 |
$9,263 |
2/29/16 |
$8,489 |
$9,505 |
$9,215 |
3/31/16 |
$9,137 |
$10,150 |
$9,810 |
4/30/16 |
$9,222 |
$10,189 |
$9,898 |
5/31/16 |
$9,241 |
$10,372 |
$9,990 |
6/30/16 |
$9,371 |
$10,399 |
$10,006 |
7/31/16 |
$9,696 |
$10,783 |
$10,343 |
8/31/16 |
$9,705 |
$10,798 |
$10,373 |
9/30/16 |
$9,740 |
$10,800 |
$10,410 |
10/31/16 |
$9,568 |
$10,603 |
$10,209 |
11/30/16 |
$9,596 |
$10,996 |
$10,406 |
12/31/16 |
$9,765 |
$11,213 |
$10,613 |
1/31/17 |
$9,978 |
$11,426 |
$10,819 |
2/28/17 |
$10,239 |
$11,879 |
$11,080 |
3/31/17 |
$10,297 |
$11,893 |
$11,174 |
4/30/17 |
$10,414 |
$12,015 |
$11,314 |
5/31/17 |
$10,568 |
$12,184 |
$11,480 |
6/30/17 |
$10,636 |
$12,260 |
$11,559 |
7/31/17 |
$10,868 |
$12,512 |
$11,801 |
8/31/17 |
$10,917 |
$12,551 |
$11,805 |
9/30/17 |
$11,078 |
$12,810 |
$12,062 |
10/31/17 |
$11,262 |
$13,109 |
$12,280 |
11/30/17 |
$11,456 |
$13,511 |
$12,542 |
12/31/17 |
$11,614 |
$13,661 |
$12,689 |
1/31/18 |
$12,087 |
$14,443 |
$13,221 |
2/28/18 |
$11,614 |
$13,911 |
$12,730 |
3/31/18 |
$11,506 |
$13,557 |
$12,570 |
4/30/18 |
$11,536 |
$13,609 |
$12,657 |
5/31/18 |
$11,634 |
$13,937 |
$12,810 |
6/30/18 |
$11,595 |
$14,023 |
$12,779 |
7/31/18 |
$11,870 |
$14,544 |
$13,092 |
8/31/18 |
$11,969 |
$15,018 |
$13,265 |
9/30/18 |
$11,969 |
$15,104 |
$13,266 |
10/31/18 |
$11,207 |
$14,072 |
$12,353 |
11/30/18 |
$11,405 |
$14,358 |
$12,549 |
12/31/18 |
$10,697 |
$13,062 |
$11,707 |
1/31/19 |
$11,469 |
$14,109 |
$12,562 |
2/28/19 |
$11,709 |
$14,562 |
$12,884 |
3/31/19 |
$11,893 |
$14,845 |
$13,006 |
4/30/19 |
$12,218 |
$15,446 |
$13,394 |
5/31/19 |
$11,641 |
$14,464 |
$12,699 |
6/30/19 |
$12,276 |
$15,483 |
$13,437 |
7/31/19 |
$12,308 |
$15,706 |
$13,494 |
8/31/19 |
$12,139 |
$15,457 |
$13,242 |
9/30/19 |
$12,351 |
$15,746 |
$13,508 |
10/31/19 |
$12,616 |
$16,087 |
$13,809 |
11/30/19 |
$12,871 |
$16,671 |
$14,110 |
12/31/19 |
$13,249 |
$17,175 |
$14,519 |
1/31/20 |
$13,130 |
$17,168 |
$14,365 |
2/29/20 |
$12,309 |
$15,755 |
$13,326 |
3/31/20 |
$10,655 |
$13,809 |
$11,593 |
4/30/20 |
$11,660 |
$15,579 |
$12,741 |
5/31/20 |
$12,158 |
$16,321 |
$13,271 |
6/30/20 |
$12,477 |
$16,645 |
$13,598 |
7/31/20 |
$13,040 |
$17,584 |
$14,192 |
8/31/20 |
$13,645 |
$18,848 |
$14,882 |
9/30/20 |
$13,288 |
$18,132 |
$14,473 |
10/31/20 |
$13,061 |
$17,650 |
$14,239 |
11/30/20 |
$14,413 |
$19,582 |
$15,822 |
12/31/20 |
$15,017 |
$20,334 |
$16,502 |
1/31/21 |
$14,962 |
$20,129 |
$16,473 |
2/28/21 |
$15,290 |
$20,684 |
$16,917 |
3/31/21 |
$15,655 |
$21,590 |
$17,382 |
4/30/21 |
$16,284 |
$22,742 |
$18,051 |
5/31/21 |
$16,526 |
$22,901 |
$18,291 |
6/30/21 |
$16,724 |
$23,436 |
$18,426 |
7/31/21 |
$16,879 |
$23,993 |
$18,546 |
8/31/21 |
$17,213 |
$24,722 |
$18,950 |
9/30/21 |
$16,561 |
$23,572 |
$18,288 |
10/31/21 |
$17,296 |
$25,224 |
$19,080 |
11/30/21 |
$16,940 |
$25,049 |
$18,650 |
12/31/21 |
$17,588 |
$26,172 |
$19,393 |
1/31/22 |
$16,821 |
$24,817 |
$18,448 |
2/28/22 |
$16,409 |
$24,074 |
$18,133 |
3/31/22 |
$16,638 |
$24,968 |
$18,419 |
4/30/22 |
$15,435 |
$22,791 |
$17,116 |
5/31/22 |
$15,470 |
$22,833 |
$17,187 |
6/30/22 |
$14,267 |
$20,948 |
$15,818 |
7/31/22 |
$15,195 |
$22,879 |
$16,922 |
8/31/22 |
$14,577 |
$21,946 |
$16,309 |
9/30/22 |
$13,208 |
$19,925 |
$14,868 |
10/31/22 |
$13,907 |
$21,538 |
$15,767 |
11/30/22 |
$15,065 |
$22,742 |
$16,885 |
12/31/22 |
$14,487 |
$21,432 |
$16,321 |
1/31/23 |
$15,518 |
$22,778 |
$17,432 |
2/28/23 |
$15,026 |
$22,223 |
$17,003 |
3/31/23 |
$15,401 |
$23,038 |
$17,354 |
4/30/23 |
$15,601 |
$23,398 |
$17,576 |
5/31/23 |
$15,366 |
$23,500 |
$17,311 |
6/30/23 |
$16,117 |
$25,053 |
$18,198 |
7/31/23 |
$16,622 |
$25,857 |
$18,777 |
8/31/23 |
$16,153 |
$25,446 |
$18,325 |
9/30/23 |
$15,473 |
$24,232 |
$17,592 |
10/31/23 |
$15,037 |
$23,723 |
$17,068 |
11/30/23 |
$16,274 |
$25,889 |
$18,496 |
12/31/23 |
$17,084 |
$27,066 |
$19,444 |
1/31/24 |
$17,025 |
$27,520 |
$19,472 |
2/29/24 |
$17,597 |
$28,990 |
$20,144 |
3/31/24 |
$18,095 |
$29,923 |
$20,719 |
4/30/24 |
$17,460 |
$28,700 |
$20,049 |
5/31/24 |
$18,179 |
$30,124 |
$20,818 |
6/30/24 |
$18,449 |
$31,204 |
$21,098 |
7/31/24 |
$18,859 |
$31,584 |
$21,602 |
8/31/24 |
$19,292 |
$32,350 |
$22,062 |
9/30/24 |
$19,721 |
$33,041 |
$22,510 |
10/31/24 |
$19,213 |
$32,742 |
$21,964 |
11/30/24 |
$19,842 |
$34,664 |
$22,665 |
12/31/24 |
$19,282 |
$33,837 |
$22,084 |
1/31/25 |
$19,803 |
$34,780 |
$22,692 |
2/28/25 |
$19,877 |
$34,326 |
$22,638 |
3/31/25 |
$19,304 |
$32,392 |
$21,987 |
4/30/25 |
$19,341 |
$32,172 |
$22,163 |
5/31/25 |
$20,197 |
$34,197 |
$23,176 |
6/30/25 |
$21,005 |
$35,936 |
$24,045 |
|
|
| Average Annual Return [Table Text Block] |
Class/Index Name |
1 Year |
5 Years |
10 Years |
Class A (excluding sales charge) |
13.85% |
10.98% |
8.32% |
Class A (including sales charge) |
7.60% |
9.73% |
7.70% |
S&P 500 Index |
15.16% |
16.64% |
13.65% |
S&P Target Date 2045 Index |
13.97% |
12.08% |
9.17% | |
|
| No Deduction of Taxes [Text Block] |
Returns shown do not reflect the deduction of taxes that a shareholder would pay on Fund distributions or the redemption of Fund shares.
|
|
| Performance Table Market Index Changed [Text Block] |
Differences in the Fund’s performance versus an index and related attribution information with respect to particular categories of securities or individual positions may be attributable, in part, to differences in the pricing methodologies used by the Fund and the index.
|
|
| Updated Performance Information Location [Text Block] |
For performance current to the most recent month-end, visit www.pimco.com/literature or via 888.87.PIMCO (888.877.4626).
|
|
| AssetsNet |
$ 572,723,000
|
|
| Holdings Count | Holding |
23
|
|
| Advisory Fees Paid, Amount |
$ 164,000
|
|
| InvestmentCompanyPortfolioTurnover |
16.00%
|
|
| Additional Fund Statistics [Text Block] |
Key Fund StatisticsFootnote Reference† (as of the end of the reporting period)
Total Net Assets |
$572,723 |
# of Portfolio Holdings |
23 |
Portfolio Turnover Rate |
16% |
Total Net Advisory Fees Paid During the Reporting Period |
$164 |
| Footnote |
Description |
Footnote† |
Dollar amounts displayed in 000's | |
|
| Holdings [Text Block] |
Security Type Breakdown (% of Net Asset Value)Footnote Reference*
Mutual Funds |
80.1% |
Short-Term Instruments |
0.1% |
Affiliated Investments |
20.1% |
Financial Derivative Instruments |
(0.1%) |
Other Assets and Liabilities, Net |
(0.2%) |
Total |
100.0% |
| Footnote |
Description |
Footnote* |
% of Net Asset Value includes derivatives instruments, if any, valued at the value used for determining the Fund's net asset value. The notional exposure of such derivatives investments therefore may be greater than what is depicted. | |
|
| Largest Holdings [Text Block] |
Top Holdings (% of Net Asset Value)Footnote Reference**
Vanguard Institutional Index Fund 'Institutional Plus' |
47.3% |
Vanguard Developed Markets Index Fund 'Institutional' |
22.3% |
Vanguard Emerging Markets Stock Index Fund 'Institutional' |
7.5% |
PIMCO Total Return Fund |
3.7% |
Vanguard Small-Cap Index Fund 'Institutional' |
3.0% |
PIMCO Long-Term U.S. Government Fund |
2.6% |
PIMCO Long-Term Real Return Fund |
2.6% |
PIMCO Real Return Fund |
2.1% |
PIMCO Income Fund |
1.7% |
PIMCO Emerging Markets Local Currency and Bond Fund |
1.4% |
| Footnote |
Description |
Footnote** |
Short-Term Instruments/Foreign Currency Contracts are not included in Top Holdings table. | |
|
| Material Fund Change [Text Block] |
This is a summary of certain changes and planned changes of the Fund since the beginning of the reporting period. For more information, you may refer to the Fund's next prospectus, which we expect to be available by October 31, 2025 or upon request at 888.87.PIMCO (888.877.4626). Change to REALPATH Blend Glide Path. Effective February 28, 2025, the Fund’s REALPATH Blend Glide Path, which forms the basis of the Fund’s long-term asset allocations, was changed based on data relating to risk metrics, long-term market trends, correlation of asset types and actuarial assumptions of life expectancy and retirement. |
|
| Material Fund Change Objectives [Text Block] |
Change to REALPATH Blend Glide Path. Effective February 28, 2025, the Fund’s REALPATH Blend Glide Path, which forms the basis of the Fund’s long-term asset allocations, was changed based on data relating to risk metrics, long-term market trends, correlation of asset types and actuarial assumptions of life expectancy and retirement.
|
|
| Summary of Change Legend [Text Block] |
This is a summary of certain changes and planned changes of the Fund since the beginning of the reporting period. For more information, you may refer to the Fund's next prospectus, which we expect to be available by October 31, 2025 or upon request at 888.87.PIMCO (888.877.4626).
|
|
| C000150071 |
|
|
| Shareholder Report [Line Items] |
|
|
| Fund Name |
PIMCO REALPATH<sup style="box-sizing: border-box; color: rgb(0, 0, 0); display: inline; flex-wrap: nowrap; font-size: 19px; font-weight: 700; grid-area: auto; line-height: 0px; margin: 0px; overflow: visible; position: relative; text-align: left; text-align-last: auto; white-space-collapse: preserve-breaks;">®</sup> Blend 2045 Fund
|
|
| Class Name |
Institutional Class
|
|
| Trading Symbol |
PVQNX
|
|
| Annual or Semi-Annual Statement [Text Block] |
This annual shareholder report contains important information about the PIMCO REALPATH® Blend 2045 Fund (the "Fund") for the period of July 1, 2024 to June 30, 2025 (the "reporting period").
|
|
| Shareholder Report Annual or Semi-Annual |
Annual Shareholder Report
|
|
| Additional Information [Text Block] |
You can find additional information about the Fund at www.pimco.com/literature. You can also request this information by contacting us at 888.87.PIMCO (888.877.4626).
|
|
| Material Fund Change Notice [Text Block] |
This report describes changes to the Fund that occurred during the reporting period.
|
|
| Additional Information Website |
www.pimco.com/literature
|
|
| Expenses [Text Block] |
What were the Fund costs for the reporting period?(based on a hypothetical $10,000 investment)
Class Name |
Cost of a $10,000 investment |
Costs paid as a percentage of a $10,000 investment |
Institutional Class |
$5 |
0.05% | |
|
| Expenses Paid, Amount |
$ 5
|
|
| Expense Ratio, Percent |
0.05%
|
|
| Factors Affecting Performance [Text Block] |
How did the Fund perform during the reporting period and what affected its performance?The following affected performance (on a gross basis) during the reporting period: Exposure to U.S. large cap equities contributed to absolute performance, as U.S. large cap equities posted positive returns. Exposure to global equities contributed to absolute performance, as global equities posted positive returns. Exposure to emerging market equities contributed to absolute performance, as emerging market equities posted positive returns. There were no material detractors from absolute performance for this Fund.
|
|
| Performance Past Does Not Indicate Future [Text] |
Performance quoted represents past performance. Past performance is not a guarantee or a reliable indicator of future results.
|
|
| Line Graph [Table Text Block] |

|
Institutional Class |
S&P 500 Index |
S&P Target Date 2045 Index |
6/30/15 |
$1,000,000 |
$1,000,000 |
$1,000,000 |
7/31/15 |
$999,010 |
$1,020,951 |
$1,012,080 |
8/31/15 |
$941,584 |
$959,353 |
$955,633 |
9/30/15 |
$919,353 |
$935,615 |
$930,742 |
10/31/15 |
$968,941 |
$1,014,539 |
$988,689 |
11/30/15 |
$961,007 |
$1,017,556 |
$989,628 |
12/31/15 |
$943,026 |
$1,001,507 |
$968,906 |
1/31/16 |
$904,781 |
$951,808 |
$926,304 |
2/29/16 |
$900,756 |
$950,524 |
$921,495 |
3/31/16 |
$970,407 |
$1,015,006 |
$981,039 |
4/30/16 |
$979,485 |
$1,018,940 |
$989,755 |
5/31/16 |
$981,503 |
$1,037,239 |
$998,988 |
6/30/16 |
$995,503 |
$1,039,926 |
$1,000,646 |
7/31/16 |
$1,031,093 |
$1,078,267 |
$1,034,329 |
8/31/16 |
$1,032,110 |
$1,079,781 |
$1,037,336 |
9/30/16 |
$1,036,616 |
$1,079,985 |
$1,041,039 |
10/31/16 |
$1,018,287 |
$1,060,285 |
$1,020,950 |
11/30/16 |
$1,022,360 |
$1,099,552 |
$1,040,582 |
12/31/16 |
$1,040,890 |
$1,121,286 |
$1,061,320 |
1/31/17 |
$1,063,585 |
$1,142,553 |
$1,081,936 |
2/28/17 |
$1,091,439 |
$1,187,919 |
$1,107,952 |
3/31/17 |
$1,098,660 |
$1,189,305 |
$1,117,408 |
4/30/17 |
$1,112,071 |
$1,201,519 |
$1,131,426 |
5/31/17 |
$1,128,576 |
$1,218,428 |
$1,148,027 |
6/30/17 |
$1,136,018 |
$1,226,033 |
$1,155,934 |
7/31/17 |
$1,161,837 |
$1,251,243 |
$1,180,055 |
8/31/17 |
$1,168,034 |
$1,255,074 |
$1,180,464 |
9/30/17 |
$1,185,318 |
$1,280,963 |
$1,206,212 |
10/31/17 |
$1,206,040 |
$1,310,855 |
$1,227,987 |
11/30/17 |
$1,227,799 |
$1,351,059 |
$1,254,233 |
12/31/17 |
$1,245,227 |
$1,366,081 |
$1,268,940 |
1/31/18 |
$1,295,795 |
$1,444,294 |
$1,322,112 |
2/28/18 |
$1,246,281 |
$1,391,062 |
$1,272,987 |
3/31/18 |
$1,234,693 |
$1,355,710 |
$1,257,042 |
4/30/18 |
$1,238,907 |
$1,360,912 |
$1,265,680 |
5/31/18 |
$1,248,388 |
$1,393,686 |
$1,280,965 |
6/30/18 |
$1,244,721 |
$1,402,264 |
$1,277,877 |
7/31/18 |
$1,275,337 |
$1,454,447 |
$1,309,246 |
8/31/18 |
$1,286,950 |
$1,501,841 |
$1,326,466 |
9/30/18 |
$1,286,966 |
$1,510,389 |
$1,326,583 |
10/31/18 |
$1,206,331 |
$1,407,154 |
$1,235,256 |
11/30/18 |
$1,227,551 |
$1,435,829 |
$1,254,935 |
12/31/18 |
$1,152,375 |
$1,306,187 |
$1,170,670 |
1/31/19 |
$1,236,449 |
$1,410,859 |
$1,256,237 |
2/28/19 |
$1,262,231 |
$1,456,159 |
$1,288,367 |
3/31/19 |
$1,282,153 |
$1,484,455 |
$1,300,561 |
4/30/19 |
$1,318,270 |
$1,544,560 |
$1,339,407 |
5/31/19 |
$1,256,194 |
$1,446,406 |
$1,269,918 |
6/30/19 |
$1,324,962 |
$1,548,343 |
$1,343,716 |
7/31/19 |
$1,329,504 |
$1,570,597 |
$1,349,389 |
8/31/19 |
$1,311,338 |
$1,545,718 |
$1,324,164 |
9/30/19 |
$1,335,306 |
$1,574,639 |
$1,350,840 |
10/31/19 |
$1,363,862 |
$1,608,745 |
$1,380,877 |
11/30/19 |
$1,392,419 |
$1,667,141 |
$1,410,971 |
12/31/19 |
$1,433,966 |
$1,717,458 |
$1,451,895 |
1/31/20 |
$1,422,307 |
$1,716,785 |
$1,436,463 |
2/29/20 |
$1,333,705 |
$1,575,461 |
$1,332,565 |
3/31/20 |
$1,154,935 |
$1,380,871 |
$1,159,276 |
4/30/20 |
$1,263,429 |
$1,557,890 |
$1,274,122 |
5/31/20 |
$1,318,260 |
$1,632,089 |
$1,327,116 |
6/30/20 |
$1,353,527 |
$1,664,547 |
$1,359,772 |
7/31/20 |
$1,415,476 |
$1,758,403 |
$1,419,186 |
8/31/20 |
$1,482,100 |
$1,884,798 |
$1,488,176 |
9/30/20 |
$1,443,528 |
$1,813,182 |
$1,447,281 |
10/31/20 |
$1,418,983 |
$1,764,962 |
$1,423,866 |
11/30/20 |
$1,567,426 |
$1,958,162 |
$1,582,212 |
12/31/20 |
$1,633,885 |
$2,033,450 |
$1,650,221 |
1/31/21 |
$1,627,969 |
$2,012,921 |
$1,647,341 |
2/28/21 |
$1,664,646 |
$2,068,427 |
$1,691,738 |
3/31/21 |
$1,704,834 |
$2,159,015 |
$1,738,247 |
4/30/21 |
$1,774,175 |
$2,274,239 |
$1,805,117 |
5/31/21 |
$1,801,672 |
$2,290,123 |
$1,829,117 |
6/30/21 |
$1,822,810 |
$2,343,585 |
$1,842,598 |
7/31/21 |
$1,842,112 |
$2,399,257 |
$1,854,605 |
8/31/21 |
$1,879,509 |
$2,472,208 |
$1,895,012 |
9/30/21 |
$1,807,820 |
$2,357,226 |
$1,828,773 |
10/31/21 |
$1,890,104 |
$2,522,377 |
$1,907,998 |
11/30/21 |
$1,851,382 |
$2,504,900 |
$1,865,035 |
12/31/21 |
$1,923,210 |
$2,617,160 |
$1,939,254 |
1/31/22 |
$1,839,754 |
$2,481,730 |
$1,844,837 |
2/28/22 |
$1,794,913 |
$2,407,423 |
$1,813,286 |
3/31/22 |
$1,821,070 |
$2,496,810 |
$1,841,866 |
4/30/22 |
$1,690,282 |
$2,279,083 |
$1,711,565 |
5/31/22 |
$1,695,265 |
$2,283,265 |
$1,718,660 |
6/30/22 |
$1,563,399 |
$2,094,795 |
$1,581,820 |
7/31/22 |
$1,665,630 |
$2,287,945 |
$1,692,213 |
8/31/22 |
$1,598,307 |
$2,194,638 |
$1,630,862 |
9/30/22 |
$1,447,857 |
$1,992,515 |
$1,486,811 |
10/31/22 |
$1,525,309 |
$2,153,832 |
$1,576,724 |
11/30/22 |
$1,653,980 |
$2,274,196 |
$1,688,496 |
12/31/22 |
$1,590,770 |
$2,143,170 |
$1,632,107 |
1/31/23 |
$1,704,487 |
$2,277,834 |
$1,743,176 |
2/28/23 |
$1,650,823 |
$2,222,257 |
$1,700,330 |
3/31/23 |
$1,693,221 |
$2,303,845 |
$1,735,360 |
4/30/23 |
$1,716,293 |
$2,339,805 |
$1,757,604 |
5/31/23 |
$1,690,657 |
$2,349,975 |
$1,731,073 |
6/30/23 |
$1,774,188 |
$2,505,250 |
$1,819,798 |
7/31/23 |
$1,829,311 |
$2,585,731 |
$1,877,690 |
8/31/23 |
$1,779,316 |
$2,544,562 |
$1,832,501 |
9/30/23 |
$1,705,100 |
$2,423,243 |
$1,759,249 |
10/31/23 |
$1,657,486 |
$2,372,291 |
$1,706,782 |
11/30/23 |
$1,793,894 |
$2,588,941 |
$1,849,588 |
12/31/23 |
$1,883,559 |
$2,706,559 |
$1,944,447 |
1/31/24 |
$1,878,337 |
$2,752,040 |
$1,947,189 |
2/29/24 |
$1,942,298 |
$2,898,987 |
$2,014,438 |
3/31/24 |
$1,998,517 |
$2,992,260 |
$2,071,919 |
4/30/24 |
$1,929,015 |
$2,870,043 |
$2,004,937 |
5/31/24 |
$2,009,008 |
$3,012,353 |
$2,081,786 |
6/30/24 |
$2,039,505 |
$3,120,443 |
$2,109,829 |
7/31/24 |
$2,085,708 |
$3,158,426 |
$2,160,167 |
8/31/24 |
$2,133,230 |
$3,235,039 |
$2,206,163 |
9/30/24 |
$2,182,134 |
$3,304,130 |
$2,250,954 |
10/31/24 |
$2,127,713 |
$3,274,166 |
$2,196,403 |
11/30/24 |
$2,198,062 |
$3,466,363 |
$2,266,451 |
12/31/24 |
$2,136,690 |
$3,383,732 |
$2,208,433 |
1/31/25 |
$2,195,210 |
$3,477,960 |
$2,269,235 |
2/28/25 |
$2,204,737 |
$3,432,579 |
$2,263,841 |
3/31/25 |
$2,141,131 |
$3,239,172 |
$2,198,741 |
4/30/25 |
$2,146,583 |
$3,217,208 |
$2,216,267 |
5/31/25 |
$2,241,986 |
$3,419,714 |
$2,317,640 |
6/30/25 |
$2,331,923 |
$3,593,616 |
$2,404,541 |
|
|
| Average Annual Return [Table Text Block] |
Class/Index Name |
1 Year |
5 Years |
10 Years |
Institutional Class |
14.34% |
11.49% |
8.84% |
S&P 500 Index |
15.16% |
16.64% |
13.65% |
S&P Target Date 2045 Index |
13.97% |
12.08% |
9.17% | |
|
| No Deduction of Taxes [Text Block] |
Returns shown do not reflect the deduction of taxes that a shareholder would pay on Fund distributions or the redemption of Fund shares.
|
|
| Performance Table Market Index Changed [Text Block] |
Differences in the Fund’s performance versus an index and related attribution information with respect to particular categories of securities or individual positions may be attributable, in part, to differences in the pricing methodologies used by the Fund and the index.
|
|
| Updated Performance Information Location [Text Block] |
For performance current to the most recent month-end, visit www.pimco.com/literature or via 888.87.PIMCO (888.877.4626).
|
|
| AssetsNet |
$ 572,723,000
|
|
| Holdings Count | Holding |
23
|
|
| Advisory Fees Paid, Amount |
$ 164,000
|
|
| InvestmentCompanyPortfolioTurnover |
16.00%
|
|
| Additional Fund Statistics [Text Block] |
Key Fund StatisticsFootnote Reference† (as of the end of the reporting period)
Total Net Assets |
$572,723 |
# of Portfolio Holdings |
23 |
Portfolio Turnover Rate |
16% |
Total Net Advisory Fees Paid During the Reporting Period |
$164 |
| Footnote |
Description |
Footnote† |
Dollar amounts displayed in 000's | |
|
| Holdings [Text Block] |
Security Type Breakdown (% of Net Asset Value)Footnote Reference*
Mutual Funds |
80.1% |
Short-Term Instruments |
0.1% |
Affiliated Investments |
20.1% |
Financial Derivative Instruments |
(0.1%) |
Other Assets and Liabilities, Net |
(0.2%) |
Total |
100.0% |
| Footnote |
Description |
Footnote* |
% of Net Asset Value includes derivatives instruments, if any, valued at the value used for determining the Fund's net asset value. The notional exposure of such derivatives investments therefore may be greater than what is depicted. | |
|
| Largest Holdings [Text Block] |
Top Holdings (% of Net Asset Value)Footnote Reference**
Vanguard Institutional Index Fund 'Institutional Plus' |
47.3% |
Vanguard Developed Markets Index Fund 'Institutional' |
22.3% |
Vanguard Emerging Markets Stock Index Fund 'Institutional' |
7.5% |
PIMCO Total Return Fund |
3.7% |
Vanguard Small-Cap Index Fund 'Institutional' |
3.0% |
PIMCO Long-Term U.S. Government Fund |
2.6% |
PIMCO Long-Term Real Return Fund |
2.6% |
PIMCO Real Return Fund |
2.1% |
PIMCO Income Fund |
1.7% |
PIMCO Emerging Markets Local Currency and Bond Fund |
1.4% |
| Footnote |
Description |
Footnote** |
Short-Term Instruments/Foreign Currency Contracts are not included in Top Holdings table. | |
|
| Material Fund Change [Text Block] |
This is a summary of certain changes and planned changes of the Fund since the beginning of the reporting period. For more information, you may refer to the Fund's next prospectus, which we expect to be available by October 31, 2025 or upon request at 888.87.PIMCO (888.877.4626). Change to REALPATH Blend Glide Path. Effective February 28, 2025, the Fund’s REALPATH Blend Glide Path, which forms the basis of the Fund’s long-term asset allocations, was changed based on data relating to risk metrics, long-term market trends, correlation of asset types and actuarial assumptions of life expectancy and retirement. |
|
| Material Fund Change Objectives [Text Block] |
Change to REALPATH Blend Glide Path. Effective February 28, 2025, the Fund’s REALPATH Blend Glide Path, which forms the basis of the Fund’s long-term asset allocations, was changed based on data relating to risk metrics, long-term market trends, correlation of asset types and actuarial assumptions of life expectancy and retirement.
|
|
| Summary of Change Legend [Text Block] |
This is a summary of certain changes and planned changes of the Fund since the beginning of the reporting period. For more information, you may refer to the Fund's next prospectus, which we expect to be available by October 31, 2025 or upon request at 888.87.PIMCO (888.877.4626).
|
|
| C000150082 |
|
|
| Shareholder Report [Line Items] |
|
|
| Fund Name |
PIMCO REALPATH<sup style="box-sizing: border-box; color: rgb(0, 0, 0); display: inline; flex-wrap: nowrap; font-size: 19px; font-weight: 700; grid-area: auto; line-height: 0px; margin: 0px; overflow: visible; position: relative; text-align: left; text-align-last: auto; white-space-collapse: preserve-breaks;">®</sup> Blend 2050 Fund
|
|
| Class Name |
Class A
|
|
| Trading Symbol |
PPQAX
|
|
| Annual or Semi-Annual Statement [Text Block] |
This annual shareholder report contains important information about the PIMCO REALPATH® Blend 2050 Fund (the "Fund") for the period of July 1, 2024 to June 30, 2025 (the "reporting period").
|
|
| Shareholder Report Annual or Semi-Annual |
Annual Shareholder Report
|
|
| Additional Information [Text Block] |
You can find additional information about the Fund at www.pimco.com/literature. You can also request this information by contacting us at 888.87.PIMCO (888.877.4626).
|
|
| Material Fund Change Notice [Text Block] |
This report describes changes to the Fund that occurred during the reporting period.
|
|
| Additional Information Website |
www.pimco.com/literature
|
|
| Expenses [Text Block] |
What were the Fund costs for the reporting period?(based on a hypothetical $10,000 investment)
Class Name |
Cost of a $10,000 investment |
Costs paid as a percentage of a $10,000 investment |
Class A |
$54 |
0.50% | |
|
| Expenses Paid, Amount |
$ 54
|
|
| Expense Ratio, Percent |
0.50%
|
|
| Factors Affecting Performance [Text Block] |
How did the Fund perform during the reporting period and what affected its performance?The following affected performance (on a gross basis) during the reporting period: Exposure to U.S. large cap equities contributed to absolute performance, as U.S. large cap equities posted positive returns. Exposure to global equities contributed to absolute performance, as global equities posted positive returns. Exposure to emerging market equities contributed to absolute performance, as emerging market equities posted positive returns. There were no material detractors from absolute performance for this Fund.
|
|
| Performance Past Does Not Indicate Future [Text] |
Performance quoted represents past performance. Past performance is not a guarantee or a reliable indicator of future results.
|
|
| Line Graph [Table Text Block] |
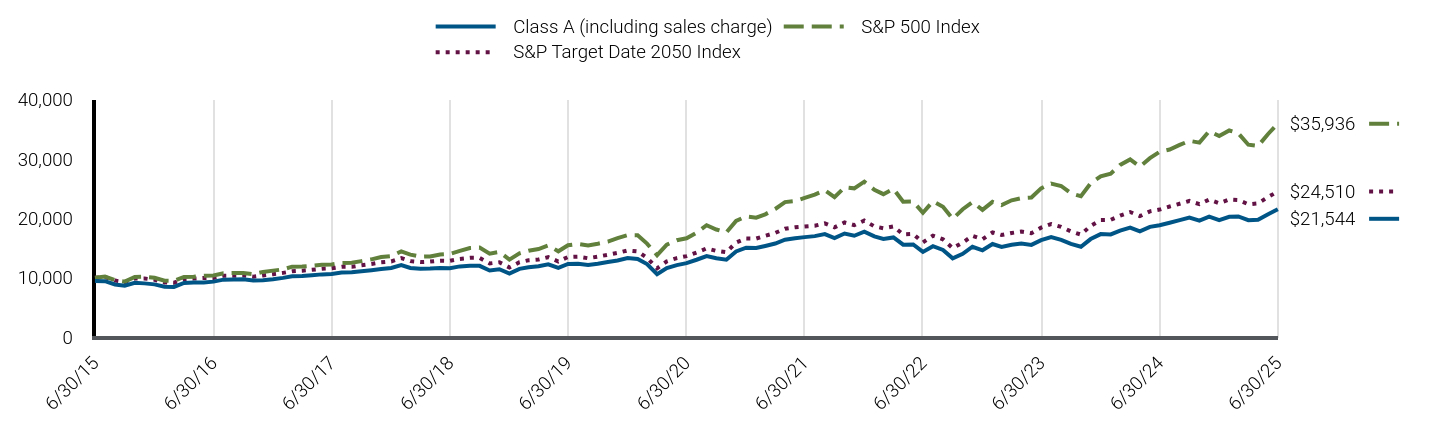
|
Class A (including sales charge) |
S&P 500 Index |
S&P Target Date 2050 Index |
6/30/15 |
$9,448 |
$10,000 |
$10,000 |
7/31/15 |
$9,439 |
$10,210 |
$10,124 |
8/31/15 |
$8,887 |
$9,594 |
$9,536 |
9/30/15 |
$8,676 |
$9,356 |
$9,277 |
10/31/15 |
$9,154 |
$10,145 |
$9,877 |
11/30/15 |
$9,069 |
$10,176 |
$9,892 |
12/31/15 |
$8,904 |
$10,015 |
$9,678 |
1/31/16 |
$8,514 |
$9,518 |
$9,231 |
2/29/16 |
$8,467 |
$9,505 |
$9,177 |
3/31/16 |
$9,131 |
$10,150 |
$9,792 |
4/30/16 |
$9,216 |
$10,189 |
$9,878 |
5/31/16 |
$9,235 |
$10,372 |
$9,973 |
6/30/16 |
$9,364 |
$10,399 |
$9,982 |
7/31/16 |
$9,698 |
$10,783 |
$10,332 |
8/31/16 |
$9,708 |
$10,798 |
$10,361 |
9/30/16 |
$9,748 |
$10,800 |
$10,398 |
10/31/16 |
$9,567 |
$10,603 |
$10,192 |
11/30/16 |
$9,605 |
$10,996 |
$10,407 |
12/31/16 |
$9,778 |
$11,213 |
$10,621 |
1/31/17 |
$9,991 |
$11,426 |
$10,836 |
2/28/17 |
$10,253 |
$11,879 |
$11,105 |
3/31/17 |
$10,311 |
$11,893 |
$11,206 |
4/30/17 |
$10,437 |
$12,015 |
$11,349 |
5/31/17 |
$10,582 |
$12,184 |
$11,520 |
6/30/17 |
$10,650 |
$12,260 |
$11,602 |
7/31/17 |
$10,892 |
$12,512 |
$11,848 |
8/31/17 |
$10,940 |
$12,551 |
$11,851 |
9/30/17 |
$11,110 |
$12,810 |
$12,117 |
10/31/17 |
$11,294 |
$13,109 |
$12,341 |
11/30/17 |
$11,498 |
$13,511 |
$12,614 |
12/31/17 |
$11,660 |
$13,661 |
$12,763 |
1/31/18 |
$12,143 |
$14,443 |
$13,313 |
2/28/18 |
$11,660 |
$13,911 |
$12,808 |
3/31/18 |
$11,541 |
$13,557 |
$12,644 |
4/30/18 |
$11,581 |
$13,609 |
$12,734 |
5/31/18 |
$11,669 |
$13,937 |
$12,894 |
6/30/18 |
$11,630 |
$14,023 |
$12,862 |
7/31/18 |
$11,926 |
$14,544 |
$13,184 |
8/31/18 |
$12,034 |
$15,018 |
$13,358 |
9/30/18 |
$12,023 |
$15,104 |
$13,360 |
10/31/18 |
$11,241 |
$14,072 |
$12,418 |
11/30/18 |
$11,439 |
$14,358 |
$12,621 |
12/31/18 |
$10,707 |
$13,062 |
$11,750 |
1/31/19 |
$11,512 |
$14,109 |
$12,626 |
2/28/19 |
$11,763 |
$14,562 |
$12,955 |
3/31/19 |
$11,942 |
$14,845 |
$13,076 |
4/30/19 |
$12,278 |
$15,446 |
$13,474 |
5/31/19 |
$11,669 |
$14,464 |
$12,754 |
6/30/19 |
$12,327 |
$15,483 |
$13,509 |
7/31/19 |
$12,359 |
$15,706 |
$13,566 |
8/31/19 |
$12,158 |
$15,457 |
$13,298 |
9/30/19 |
$12,384 |
$15,746 |
$13,573 |
10/31/19 |
$12,660 |
$16,087 |
$13,880 |
11/30/19 |
$12,926 |
$16,671 |
$14,189 |
12/31/19 |
$13,326 |
$17,175 |
$14,611 |
1/31/20 |
$13,174 |
$17,168 |
$14,445 |
2/29/20 |
$12,308 |
$15,755 |
$13,375 |
3/31/20 |
$10,609 |
$13,809 |
$11,607 |
4/30/20 |
$11,637 |
$15,579 |
$12,776 |
5/31/20 |
$12,146 |
$16,321 |
$13,318 |
6/30/20 |
$12,470 |
$16,645 |
$13,651 |
7/31/20 |
$13,044 |
$17,584 |
$14,251 |
8/31/20 |
$13,672 |
$18,848 |
$14,962 |
9/30/20 |
$13,304 |
$18,132 |
$14,542 |
10/31/20 |
$13,055 |
$17,650 |
$14,303 |
11/30/20 |
$14,441 |
$19,582 |
$15,933 |
12/31/20 |
$15,068 |
$20,334 |
$16,637 |
1/31/21 |
$15,014 |
$20,129 |
$16,611 |
2/28/21 |
$15,363 |
$20,684 |
$17,077 |
3/31/21 |
$15,769 |
$21,590 |
$17,564 |
4/30/21 |
$16,408 |
$22,742 |
$18,252 |
5/31/21 |
$16,673 |
$22,901 |
$18,501 |
6/30/21 |
$16,848 |
$23,436 |
$18,632 |
7/31/21 |
$17,015 |
$23,993 |
$18,751 |
8/31/21 |
$17,359 |
$24,722 |
$19,171 |
9/30/21 |
$16,686 |
$23,572 |
$18,484 |
10/31/21 |
$17,454 |
$25,224 |
$19,308 |
11/30/21 |
$17,075 |
$25,049 |
$18,858 |
12/31/21 |
$17,766 |
$26,172 |
$19,630 |
1/31/22 |
$16,974 |
$24,817 |
$18,659 |
2/28/22 |
$16,537 |
$24,074 |
$18,338 |
3/31/22 |
$16,801 |
$24,968 |
$18,646 |
4/30/22 |
$15,573 |
$22,791 |
$17,307 |
5/31/22 |
$15,607 |
$22,833 |
$17,377 |
6/30/22 |
$14,367 |
$20,948 |
$15,963 |
7/31/22 |
$15,331 |
$22,879 |
$17,096 |
8/31/22 |
$14,688 |
$21,946 |
$16,471 |
9/30/22 |
$13,288 |
$19,925 |
$14,994 |
10/31/22 |
$14,035 |
$21,538 |
$15,928 |
11/30/22 |
$15,230 |
$22,742 |
$17,076 |
12/31/22 |
$14,636 |
$21,432 |
$16,494 |
1/31/23 |
$15,693 |
$22,778 |
$17,637 |
2/28/23 |
$15,188 |
$22,223 |
$17,202 |
3/31/23 |
$15,571 |
$23,038 |
$17,551 |
4/30/23 |
$15,782 |
$23,398 |
$17,778 |
5/31/23 |
$15,547 |
$23,500 |
$17,504 |
6/30/23 |
$16,347 |
$25,053 |
$18,438 |
7/31/23 |
$16,864 |
$25,857 |
$19,050 |
8/31/23 |
$16,394 |
$25,446 |
$18,574 |
9/30/23 |
$15,709 |
$24,232 |
$17,819 |
10/31/23 |
$15,237 |
$23,723 |
$17,273 |
11/30/23 |
$16,523 |
$25,889 |
$18,748 |
12/31/23 |
$17,356 |
$27,066 |
$19,725 |
1/31/24 |
$17,308 |
$27,520 |
$19,751 |
2/29/24 |
$17,929 |
$28,990 |
$20,469 |
3/31/24 |
$18,453 |
$29,923 |
$21,070 |
4/30/24 |
$17,805 |
$28,700 |
$20,381 |
5/31/24 |
$18,573 |
$30,124 |
$21,179 |
6/30/24 |
$18,853 |
$31,204 |
$21,481 |
7/31/24 |
$19,263 |
$31,584 |
$21,999 |
8/31/24 |
$19,709 |
$32,350 |
$22,469 |
9/30/24 |
$20,153 |
$33,041 |
$22,930 |
10/31/24 |
$19,632 |
$32,742 |
$22,391 |
11/30/24 |
$20,311 |
$34,664 |
$23,159 |
12/31/24 |
$19,719 |
$33,837 |
$22,546 |
1/31/25 |
$20,267 |
$34,780 |
$23,176 |
2/28/25 |
$20,317 |
$34,326 |
$23,090 |
3/31/25 |
$19,692 |
$32,392 |
$22,376 |
4/30/25 |
$19,754 |
$32,172 |
$22,527 |
5/31/25 |
$20,701 |
$34,197 |
$23,596 |
6/30/25 |
$21,544 |
$35,936 |
$24,510 |
|
|
| Average Annual Return [Table Text Block] |
Class/Index Name |
1 Year |
5 Years |
10 Years |
Class A (excluding sales charge) |
14.27% |
11.56% |
8.59% |
Class A (including sales charge) |
7.99% |
10.30% |
7.98% |
S&P 500 Index |
15.16% |
16.64% |
13.65% |
S&P Target Date 2050 Index |
14.10% |
12.42% |
9.38% | |
|
| No Deduction of Taxes [Text Block] |
Returns shown do not reflect the deduction of taxes that a shareholder would pay on Fund distributions or the redemption of Fund shares.
|
|
| Performance Table Market Index Changed [Text Block] |
Differences in the Fund’s performance versus an index and related attribution information with respect to particular categories of securities or individual positions may be attributable, in part, to differences in the pricing methodologies used by the Fund and the index.
|
|
| Updated Performance Information Location [Text Block] |
For performance current to the most recent month-end, visit www.pimco.com/literature or via 888.87.PIMCO (888.877.4626).
|
|
| AssetsNet |
$ 534,823,000
|
|
| Holdings Count | Holding |
19
|
|
| Advisory Fees Paid, Amount |
$ 150,000
|
|
| InvestmentCompanyPortfolioTurnover |
16.00%
|
|
| Additional Fund Statistics [Text Block] |
Key Fund StatisticsFootnote Reference† (as of the end of the reporting period)
Total Net Assets |
$534,823 |
# of Portfolio Holdings |
19 |
Portfolio Turnover Rate |
16% |
Total Net Advisory Fees Paid During the Reporting Period |
$150 |
| Footnote |
Description |
Footnote† |
Dollar amounts displayed in 000's | |
|
| Holdings [Text Block] |
Security Type Breakdown (% of Net Asset Value)Footnote Reference*
Mutual Funds |
85.9% |
Short-Term Instruments |
0.1% |
Affiliated Investments |
14.2% |
Financial Derivative Instruments |
(0.1%) |
Other Assets and Liabilities, Net |
(0.1%) |
Total |
100.0% |
| Footnote |
Description |
Footnote* |
% of Net Asset Value includes derivatives instruments, if any, valued at the value used for determining the Fund's net asset value. The notional exposure of such derivatives investments therefore may be greater than what is depicted. | |
|
| Largest Holdings [Text Block] |
Top Holdings (% of Net Asset Value)Footnote Reference**
Vanguard Institutional Index Fund 'Institutional Plus' |
49.7% |
Vanguard Developed Markets Index Fund 'Institutional' |
24.7% |
Vanguard Emerging Markets Stock Index Fund 'Institutional' |
8.0% |
Vanguard Small-Cap Index Fund 'Institutional' |
3.5% |
PIMCO Total Return Fund |
2.5% |
PIMCO Long-Term U.S. Government Fund |
1.7% |
PIMCO Long-Term Real Return Fund |
1.5% |
PIMCO Real Return Fund |
1.4% |
PIMCO Income Fund |
1.1% |
PIMCO Emerging Markets Local Currency and Bond Fund |
0.6% |
| Footnote |
Description |
Footnote** |
Short-Term Instruments/Foreign Currency Contracts are not included in Top Holdings table. | |
|
| Material Fund Change [Text Block] |
This is a summary of certain changes and planned changes of the Fund since the beginning of the reporting period. For more information, you may refer to the Fund's next prospectus, which we expect to be available by October 31, 2025 or upon request at 888.87.PIMCO (888.877.4626). Change to REALPATH Blend Glide Path. Effective February 28, 2025, the Fund’s REALPATH Blend Glide Path, which forms the basis of the Fund’s long-term asset allocations, was changed based on data relating to risk metrics, long-term market trends, correlation of asset types and actuarial assumptions of life expectancy and retirement. |
|
| Material Fund Change Objectives [Text Block] |
Change to REALPATH Blend Glide Path. Effective February 28, 2025, the Fund’s REALPATH Blend Glide Path, which forms the basis of the Fund’s long-term asset allocations, was changed based on data relating to risk metrics, long-term market trends, correlation of asset types and actuarial assumptions of life expectancy and retirement.
|
|
| Summary of Change Legend [Text Block] |
This is a summary of certain changes and planned changes of the Fund since the beginning of the reporting period. For more information, you may refer to the Fund's next prospectus, which we expect to be available by October 31, 2025 or upon request at 888.87.PIMCO (888.877.4626).
|
|
| C000150078 |
|
|
| Shareholder Report [Line Items] |
|
|
| Fund Name |
PIMCO REALPATH<sup style="box-sizing: border-box; color: rgb(0, 0, 0); display: inline; flex-wrap: nowrap; font-size: 19px; font-weight: 700; grid-area: auto; line-height: 0px; margin: 0px; overflow: visible; position: relative; text-align: left; text-align-last: auto; white-space-collapse: preserve-breaks;">®</sup> Blend 2050 Fund
|
|
| Class Name |
Institutional Class
|
|
| Trading Symbol |
PPQZX
|
|
| Annual or Semi-Annual Statement [Text Block] |
This annual shareholder report contains important information about the PIMCO REALPATH® Blend 2050 Fund (the "Fund") for the period of July 1, 2024 to June 30, 2025 (the "reporting period").
|
|
| Shareholder Report Annual or Semi-Annual |
Annual Shareholder Report
|
|
| Additional Information [Text Block] |
You can find additional information about the Fund at www.pimco.com/literature. You can also request this information by contacting us at 888.87.PIMCO (888.877.4626).
|
|
| Material Fund Change Notice [Text Block] |
This report describes changes to the Fund that occurred during the reporting period.
|
|
| Additional Information Website |
www.pimco.com/literature
|
|
| Expenses [Text Block] |
What were the Fund costs for the reporting period?(based on a hypothetical $10,000 investment)
Class Name |
Cost of a $10,000 investment |
Costs paid as a percentage of a $10,000 investment |
Institutional Class |
$5 |
0.05% | |
|
| Expenses Paid, Amount |
$ 5
|
|
| Expense Ratio, Percent |
0.05%
|
|
| Factors Affecting Performance [Text Block] |
How did the Fund perform during the reporting period and what affected its performance?The following affected performance (on a gross basis) during the reporting period: Exposure to U.S. large cap equities contributed to absolute performance, as U.S. large cap equities posted positive returns. Exposure to global equities contributed to absolute performance, as global equities posted positive returns. Exposure to emerging market equities contributed to absolute performance, as emerging market equities posted positive returns. There were no material detractors from absolute performance for this Fund.
|
|
| Performance Past Does Not Indicate Future [Text] |
Performance quoted represents past performance. Past performance is not a guarantee or a reliable indicator of future results.
|
|
| Line Graph [Table Text Block] |
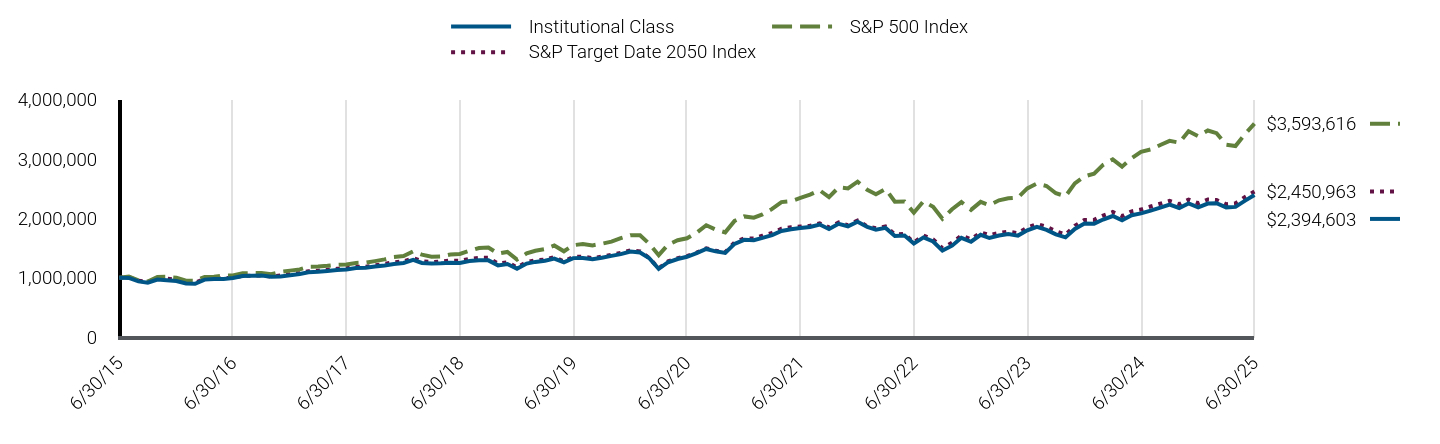
|
Institutional Class |
S&P 500 Index |
S&P Target Date 2050 Index |
6/30/15 |
$1,000,000 |
$1,000,000 |
$1,000,000 |
7/31/15 |
$999,011 |
$1,020,951 |
$1,012,401 |
8/31/15 |
$940,653 |
$959,353 |
$953,585 |
9/30/15 |
$918,771 |
$935,615 |
$927,721 |
10/31/15 |
$970,309 |
$1,014,539 |
$987,741 |
11/30/15 |
$961,389 |
$1,017,556 |
$989,158 |
12/31/15 |
$945,162 |
$1,001,507 |
$967,828 |
1/31/16 |
$903,936 |
$951,808 |
$923,115 |
2/29/16 |
$899,914 |
$950,524 |
$917,650 |
3/31/16 |
$970,078 |
$1,015,006 |
$979,186 |
4/30/16 |
$979,144 |
$1,018,940 |
$987,809 |
5/31/16 |
$982,166 |
$1,037,239 |
$997,342 |
6/30/16 |
$995,982 |
$1,039,926 |
$998,152 |
7/31/16 |
$1,031,480 |
$1,078,267 |
$1,033,159 |
8/31/16 |
$1,033,509 |
$1,079,781 |
$1,036,093 |
9/30/16 |
$1,037,811 |
$1,079,985 |
$1,039,803 |
10/31/16 |
$1,019,533 |
$1,060,285 |
$1,019,171 |
11/30/16 |
$1,023,595 |
$1,099,552 |
$1,040,686 |
12/31/16 |
$1,042,580 |
$1,121,286 |
$1,062,051 |
1/31/17 |
$1,065,245 |
$1,142,553 |
$1,083,590 |
2/28/17 |
$1,094,091 |
$1,187,919 |
$1,110,531 |
3/31/17 |
$1,101,302 |
$1,189,305 |
$1,120,598 |
4/30/17 |
$1,114,695 |
$1,201,519 |
$1,134,936 |
5/31/17 |
$1,131,179 |
$1,218,428 |
$1,152,029 |
6/30/17 |
$1,139,447 |
$1,226,033 |
$1,160,242 |
7/31/17 |
$1,165,226 |
$1,251,243 |
$1,184,838 |
8/31/17 |
$1,171,413 |
$1,255,074 |
$1,185,053 |
9/30/17 |
$1,189,571 |
$1,280,963 |
$1,211,686 |
10/31/17 |
$1,209,225 |
$1,310,855 |
$1,234,122 |
11/30/17 |
$1,231,982 |
$1,351,059 |
$1,261,386 |
12/31/17 |
$1,249,806 |
$1,366,081 |
$1,276,346 |
1/31/18 |
$1,302,407 |
$1,444,294 |
$1,331,343 |
2/28/18 |
$1,250,858 |
$1,391,062 |
$1,280,802 |
3/31/18 |
$1,239,286 |
$1,355,710 |
$1,264,398 |
4/30/18 |
$1,243,494 |
$1,360,912 |
$1,273,375 |
5/31/18 |
$1,254,014 |
$1,393,686 |
$1,289,394 |
6/30/18 |
$1,249,904 |
$1,402,264 |
$1,286,166 |
7/31/18 |
$1,281,521 |
$1,454,447 |
$1,318,376 |
8/31/18 |
$1,294,167 |
$1,501,841 |
$1,335,830 |
9/30/18 |
$1,294,064 |
$1,510,389 |
$1,335,971 |
10/31/18 |
$1,209,346 |
$1,407,154 |
$1,241,798 |
11/30/18 |
$1,231,584 |
$1,435,829 |
$1,262,093 |
12/31/18 |
$1,152,832 |
$1,306,187 |
$1,174,971 |
1/31/19 |
$1,240,218 |
$1,410,859 |
$1,262,558 |
2/28/19 |
$1,268,227 |
$1,456,159 |
$1,295,503 |
3/31/19 |
$1,287,617 |
$1,484,455 |
$1,307,551 |
4/30/19 |
$1,324,825 |
$1,544,560 |
$1,347,444 |
5/31/19 |
$1,259,429 |
$1,446,406 |
$1,275,404 |
6/30/19 |
$1,331,643 |
$1,548,343 |
$1,350,934 |
7/31/19 |
$1,335,046 |
$1,570,597 |
$1,356,631 |
8/31/19 |
$1,314,629 |
$1,545,718 |
$1,329,763 |
9/30/19 |
$1,338,907 |
$1,574,639 |
$1,357,256 |
10/31/19 |
$1,369,725 |
$1,608,745 |
$1,387,954 |
11/30/19 |
$1,398,261 |
$1,667,141 |
$1,418,934 |
12/31/19 |
$1,442,088 |
$1,717,458 |
$1,461,097 |
1/31/20 |
$1,426,945 |
$1,716,785 |
$1,444,515 |
2/29/20 |
$1,333,757 |
$1,575,461 |
$1,337,514 |
3/31/20 |
$1,150,403 |
$1,380,871 |
$1,160,714 |
4/30/20 |
$1,262,296 |
$1,557,890 |
$1,277,565 |
5/31/20 |
$1,317,077 |
$1,632,089 |
$1,331,774 |
6/30/20 |
$1,353,703 |
$1,664,547 |
$1,365,079 |
7/31/20 |
$1,415,607 |
$1,758,403 |
$1,425,099 |
8/31/20 |
$1,485,686 |
$1,884,798 |
$1,496,244 |
9/30/20 |
$1,445,975 |
$1,813,182 |
$1,454,223 |
10/31/20 |
$1,419,111 |
$1,764,962 |
$1,430,343 |
11/30/20 |
$1,570,950 |
$1,958,162 |
$1,593,325 |
12/31/20 |
$1,639,947 |
$2,033,450 |
$1,663,690 |
1/31/21 |
$1,634,044 |
$2,012,921 |
$1,661,139 |
2/28/21 |
$1,673,006 |
$2,068,427 |
$1,707,695 |
3/31/21 |
$1,718,517 |
$2,159,015 |
$1,756,377 |
4/30/21 |
$1,788,879 |
$2,274,239 |
$1,825,184 |
5/31/21 |
$1,817,501 |
$2,290,123 |
$1,850,057 |
6/30/21 |
$1,838,590 |
$2,343,585 |
$1,863,237 |
7/31/21 |
$1,856,639 |
$2,399,257 |
$1,875,071 |
8/31/21 |
$1,896,347 |
$2,472,208 |
$1,917,092 |
9/30/21 |
$1,822,436 |
$2,357,226 |
$1,848,427 |
10/31/21 |
$1,908,127 |
$2,522,377 |
$1,930,839 |
11/30/21 |
$1,867,092 |
$2,504,900 |
$1,885,841 |
12/31/21 |
$1,943,322 |
$2,617,160 |
$1,963,010 |
1/31/22 |
$1,856,121 |
$2,481,730 |
$1,865,859 |
2/28/22 |
$1,810,030 |
$2,407,423 |
$1,833,759 |
3/31/22 |
$1,839,927 |
$2,496,810 |
$1,864,583 |
4/30/22 |
$1,705,389 |
$2,279,083 |
$1,730,655 |
5/31/22 |
$1,710,372 |
$2,283,265 |
$1,737,741 |
6/30/22 |
$1,575,834 |
$2,094,795 |
$1,596,301 |
7/31/22 |
$1,680,475 |
$2,287,945 |
$1,709,609 |
8/31/22 |
$1,611,960 |
$2,194,638 |
$1,647,109 |
9/30/22 |
$1,458,593 |
$1,992,515 |
$1,499,362 |
10/31/22 |
$1,540,943 |
$2,153,832 |
$1,592,829 |
11/30/22 |
$1,673,202 |
$2,274,196 |
$1,707,624 |
12/31/22 |
$1,607,246 |
$2,143,170 |
$1,649,447 |
1/31/23 |
$1,724,600 |
$2,277,834 |
$1,763,676 |
2/28/23 |
$1,669,750 |
$2,222,257 |
$1,720,167 |
3/31/23 |
$1,712,822 |
$2,303,845 |
$1,755,102 |
4/30/23 |
$1,737,126 |
$2,339,805 |
$1,777,778 |
5/31/23 |
$1,710,264 |
$2,349,975 |
$1,750,354 |
6/30/23 |
$1,800,041 |
$2,505,250 |
$1,843,820 |
7/31/23 |
$1,858,891 |
$2,585,731 |
$1,904,974 |
8/31/23 |
$1,806,438 |
$2,544,562 |
$1,857,426 |
9/30/23 |
$1,730,707 |
$2,423,243 |
$1,781,888 |
10/31/23 |
$1,680,635 |
$2,372,291 |
$1,727,324 |
11/30/23 |
$1,823,148 |
$2,588,941 |
$1,874,787 |
12/31/23 |
$1,914,722 |
$2,706,559 |
$1,972,506 |
1/31/24 |
$1,910,815 |
$2,752,040 |
$1,975,127 |
2/29/24 |
$1,981,151 |
$2,898,987 |
$2,046,910 |
3/31/24 |
$2,039,850 |
$2,992,260 |
$2,107,001 |
4/30/24 |
$1,967,932 |
$2,870,043 |
$2,038,052 |
5/31/24 |
$2,052,926 |
$3,012,353 |
$2,117,914 |
6/30/24 |
$2,084,391 |
$3,120,443 |
$2,148,100 |
7/31/24 |
$2,131,763 |
$3,158,426 |
$2,199,901 |
8/31/24 |
$2,181,768 |
$3,235,039 |
$2,246,882 |
9/30/24 |
$2,232,139 |
$3,304,130 |
$2,293,013 |
10/31/24 |
$2,175,211 |
$3,274,166 |
$2,239,087 |
11/30/24 |
$2,250,674 |
$3,466,363 |
$2,315,901 |
12/31/24 |
$2,186,145 |
$3,383,732 |
$2,254,606 |
1/31/25 |
$2,248,800 |
$3,477,960 |
$2,317,602 |
2/28/25 |
$2,254,249 |
$3,432,579 |
$2,308,956 |
3/31/25 |
$2,185,254 |
$3,239,172 |
$2,237,599 |
4/30/25 |
$2,193,438 |
$3,217,208 |
$2,252,692 |
5/31/25 |
$2,298,472 |
$3,419,714 |
$2,359,623 |
6/30/25 |
$2,394,603 |
$3,593,616 |
$2,450,963 |
|
|
| Average Annual Return [Table Text Block] |
Class/Index Name |
1 Year |
5 Years |
10 Years |
Institutional Class |
14.88% |
12.08% |
9.12% |
S&P 500 Index |
15.16% |
16.64% |
13.65% |
S&P Target Date 2050 Index |
14.10% |
12.42% |
9.38% | |
|
| No Deduction of Taxes [Text Block] |
Returns shown do not reflect the deduction of taxes that a shareholder would pay on Fund distributions or the redemption of Fund shares.
|
|
| Performance Table Market Index Changed [Text Block] |
Differences in the Fund’s performance versus an index and related attribution information with respect to particular categories of securities or individual positions may be attributable, in part, to differences in the pricing methodologies used by the Fund and the index.
|
|
| Updated Performance Information Location [Text Block] |
For performance current to the most recent month-end, visit www.pimco.com/literature or via 888.87.PIMCO (888.877.4626).
|
|
| AssetsNet |
$ 534,823,000
|
|
| Holdings Count | Holding |
19
|
|
| Advisory Fees Paid, Amount |
$ 150,000
|
|
| InvestmentCompanyPortfolioTurnover |
16.00%
|
|
| Additional Fund Statistics [Text Block] |
Key Fund StatisticsFootnote Reference† (as of the end of the reporting period)
Total Net Assets |
$534,823 |
# of Portfolio Holdings |
19 |
Portfolio Turnover Rate |
16% |
Total Net Advisory Fees Paid During the Reporting Period |
$150 |
| Footnote |
Description |
Footnote† |
Dollar amounts displayed in 000's | |
|
| Holdings [Text Block] |
Security Type Breakdown (% of Net Asset Value)Footnote Reference*
Mutual Funds |
85.9% |
Short-Term Instruments |
0.1% |
Affiliated Investments |
14.2% |
Financial Derivative Instruments |
(0.1%) |
Other Assets and Liabilities, Net |
(0.1%) |
Total |
100.0% |
| Footnote |
Description |
Footnote* |
% of Net Asset Value includes derivatives instruments, if any, valued at the value used for determining the Fund's net asset value. The notional exposure of such derivatives investments therefore may be greater than what is depicted. | |
|
| Largest Holdings [Text Block] |
Top Holdings (% of Net Asset Value)Footnote Reference**
Vanguard Institutional Index Fund 'Institutional Plus' |
49.7% |
Vanguard Developed Markets Index Fund 'Institutional' |
24.7% |
Vanguard Emerging Markets Stock Index Fund 'Institutional' |
8.0% |
Vanguard Small-Cap Index Fund 'Institutional' |
3.5% |
PIMCO Total Return Fund |
2.5% |
PIMCO Long-Term U.S. Government Fund |
1.7% |
PIMCO Long-Term Real Return Fund |
1.5% |
PIMCO Real Return Fund |
1.4% |
PIMCO Income Fund |
1.1% |
PIMCO Emerging Markets Local Currency and Bond Fund |
0.6% |
| Footnote |
Description |
Footnote** |
Short-Term Instruments/Foreign Currency Contracts are not included in Top Holdings table. | |
|
| Material Fund Change [Text Block] |
This is a summary of certain changes and planned changes of the Fund since the beginning of the reporting period. For more information, you may refer to the Fund's next prospectus, which we expect to be available by October 31, 2025 or upon request at 888.87.PIMCO (888.877.4626). Change to REALPATH Blend Glide Path. Effective February 28, 2025, the Fund’s REALPATH Blend Glide Path, which forms the basis of the Fund’s long-term asset allocations, was changed based on data relating to risk metrics, long-term market trends, correlation of asset types and actuarial assumptions of life expectancy and retirement. |
|
| Material Fund Change Objectives [Text Block] |
Change to REALPATH Blend Glide Path. Effective February 28, 2025, the Fund’s REALPATH Blend Glide Path, which forms the basis of the Fund’s long-term asset allocations, was changed based on data relating to risk metrics, long-term market trends, correlation of asset types and actuarial assumptions of life expectancy and retirement.
|
|
| Summary of Change Legend [Text Block] |
This is a summary of certain changes and planned changes of the Fund since the beginning of the reporting period. For more information, you may refer to the Fund's next prospectus, which we expect to be available by October 31, 2025 or upon request at 888.87.PIMCO (888.877.4626).
|
|
| C000150089 |
|
|
| Shareholder Report [Line Items] |
|
|
| Fund Name |
PIMCO REALPATH<sup style="box-sizing: border-box; color: rgb(0, 0, 0); display: inline; flex-wrap: nowrap; font-size: 19px; font-weight: 700; grid-area: auto; line-height: 0px; margin: 0px; overflow: visible; position: relative; text-align: left; text-align-last: auto; white-space-collapse: preserve-breaks;">®</sup> Blend 2055 Fund
|
|
| Class Name |
Class A
|
|
| Trading Symbol |
PRQAX
|
|
| Annual or Semi-Annual Statement [Text Block] |
This annual shareholder report contains important information about the PIMCO REALPATH® Blend 2055 Fund (the "Fund") for the period of July 1, 2024 to June 30, 2025 (the "reporting period").
|
|
| Shareholder Report Annual or Semi-Annual |
Annual Shareholder Report
|
|
| Additional Information [Text Block] |
You can find additional information about the Fund at www.pimco.com/literature. You can also request this information by contacting us at 888.87.PIMCO (888.877.4626).
|
|
| Material Fund Change Notice [Text Block] |
This report describes changes to the Fund that occurred during the reporting period.
|
|
| Additional Information Website |
www.pimco.com/literature
|
|
| Expenses [Text Block] |
What were the Fund costs for the reporting period?(based on a hypothetical $10,000 investment)
Class Name |
Cost of a $10,000 investment |
Costs paid as a percentage of a $10,000 investment |
Class A |
$54 |
0.50% | |
|
| Expenses Paid, Amount |
$ 54
|
|
| Expense Ratio, Percent |
0.50%
|
|
| Factors Affecting Performance [Text Block] |
How did the Fund perform during the reporting period and what affected its performance?The following affected performance (on a gross basis) during the reporting period: Exposure to U.S. large cap equities contributed to absolute performance, as U.S. large cap equities posted positive returns. Exposure to global equities contributed to absolute performance, as global equities posted positive returns. Exposure to emerging market equities contributed to absolute performance, as emerging market equities posted positive returns. There were no material detractors from absolute performance for this Fund.
|
|
| Performance Past Does Not Indicate Future [Text] |
Performance quoted represents past performance. Past performance is not a guarantee or a reliable indicator of future results.
|
|
| Line Graph [Table Text Block] |
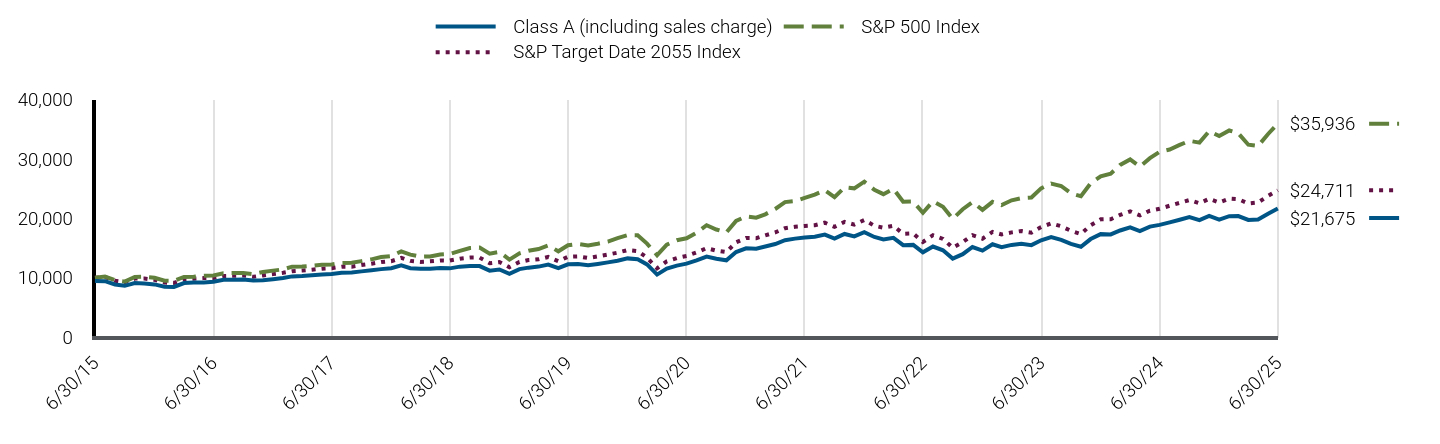
|
Class A (including sales charge) |
S&P 500 Index |
S&P Target Date 2055 Index |
6/30/15 |
$9,448 |
$10,000 |
$10,000 |
7/31/15 |
$9,438 |
$10,210 |
$10,124 |
8/31/15 |
$8,876 |
$9,594 |
$9,522 |
9/30/15 |
$8,661 |
$9,356 |
$9,257 |
10/31/15 |
$9,139 |
$10,145 |
$9,870 |
11/30/15 |
$9,064 |
$10,176 |
$9,884 |
12/31/15 |
$8,893 |
$10,015 |
$9,665 |
1/31/16 |
$8,514 |
$9,518 |
$9,207 |
2/29/16 |
$8,466 |
$9,505 |
$9,148 |
3/31/16 |
$9,129 |
$10,150 |
$9,774 |
4/30/16 |
$9,205 |
$10,189 |
$9,862 |
5/31/16 |
$9,234 |
$10,372 |
$9,959 |
6/30/16 |
$9,359 |
$10,399 |
$9,962 |
7/31/16 |
$9,684 |
$10,783 |
$10,319 |
8/31/16 |
$9,694 |
$10,798 |
$10,350 |
9/30/16 |
$9,732 |
$10,800 |
$10,388 |
10/31/16 |
$9,550 |
$10,603 |
$10,180 |
11/30/16 |
$9,588 |
$10,996 |
$10,408 |
12/31/16 |
$9,763 |
$11,213 |
$10,626 |
1/31/17 |
$9,975 |
$11,426 |
$10,847 |
2/28/17 |
$10,246 |
$11,879 |
$11,122 |
3/31/17 |
$10,295 |
$11,893 |
$11,226 |
4/30/17 |
$10,420 |
$12,015 |
$11,371 |
5/31/17 |
$10,566 |
$12,184 |
$11,545 |
6/30/17 |
$10,634 |
$12,260 |
$11,627 |
7/31/17 |
$10,866 |
$12,512 |
$11,876 |
8/31/17 |
$10,915 |
$12,551 |
$11,878 |
9/30/17 |
$11,088 |
$12,810 |
$12,148 |
10/31/17 |
$11,263 |
$13,109 |
$12,376 |
11/30/17 |
$11,467 |
$13,511 |
$12,650 |
12/31/17 |
$11,625 |
$13,661 |
$12,801 |
1/31/18 |
$12,101 |
$14,443 |
$13,361 |
2/28/18 |
$11,625 |
$13,911 |
$12,853 |
3/31/18 |
$11,516 |
$13,557 |
$12,685 |
4/30/18 |
$11,546 |
$13,609 |
$12,776 |
5/31/18 |
$11,635 |
$13,937 |
$12,935 |
6/30/18 |
$11,596 |
$14,023 |
$12,902 |
7/31/18 |
$11,883 |
$14,544 |
$13,226 |
8/31/18 |
$11,982 |
$15,018 |
$13,401 |
9/30/18 |
$11,980 |
$15,104 |
$13,402 |
10/31/18 |
$11,205 |
$14,072 |
$12,453 |
11/30/18 |
$11,404 |
$14,358 |
$12,657 |
12/31/18 |
$10,673 |
$13,062 |
$11,781 |
1/31/19 |
$11,464 |
$14,109 |
$12,661 |
2/28/19 |
$11,714 |
$14,562 |
$12,993 |
3/31/19 |
$11,893 |
$14,845 |
$13,112 |
4/30/19 |
$12,237 |
$15,446 |
$13,514 |
5/31/19 |
$11,622 |
$14,464 |
$12,788 |
6/30/19 |
$12,275 |
$15,483 |
$13,550 |
7/31/19 |
$12,307 |
$15,706 |
$13,607 |
8/31/19 |
$12,108 |
$15,457 |
$13,333 |
9/30/19 |
$12,340 |
$15,746 |
$13,613 |
10/31/19 |
$12,603 |
$16,087 |
$13,925 |
11/30/19 |
$12,876 |
$16,671 |
$14,237 |
12/31/19 |
$13,272 |
$17,175 |
$14,665 |
1/31/20 |
$13,121 |
$17,168 |
$14,494 |
2/29/20 |
$12,252 |
$15,755 |
$13,405 |
3/31/20 |
$10,547 |
$13,809 |
$11,609 |
4/30/20 |
$11,555 |
$15,579 |
$12,788 |
5/31/20 |
$12,049 |
$16,321 |
$13,332 |
6/30/20 |
$12,380 |
$16,645 |
$13,670 |
7/31/20 |
$12,949 |
$17,584 |
$14,278 |
8/31/20 |
$13,582 |
$18,848 |
$15,003 |
9/30/20 |
$13,206 |
$18,132 |
$14,576 |
10/31/20 |
$12,949 |
$17,650 |
$14,332 |
11/30/20 |
$14,345 |
$19,582 |
$15,983 |
12/31/20 |
$14,973 |
$20,334 |
$16,697 |
1/31/21 |
$14,908 |
$20,129 |
$16,672 |
2/28/21 |
$15,264 |
$20,684 |
$17,147 |
3/31/21 |
$15,682 |
$21,590 |
$17,644 |
4/30/21 |
$16,335 |
$22,742 |
$18,344 |
5/31/21 |
$16,597 |
$22,901 |
$18,597 |
6/30/21 |
$16,770 |
$23,436 |
$18,730 |
7/31/21 |
$16,924 |
$23,993 |
$18,847 |
8/31/21 |
$17,276 |
$24,722 |
$19,271 |
9/30/21 |
$16,606 |
$23,572 |
$18,579 |
10/31/21 |
$17,378 |
$25,224 |
$19,410 |
11/30/21 |
$16,981 |
$25,049 |
$18,954 |
12/31/21 |
$17,682 |
$26,172 |
$19,734 |
1/31/22 |
$16,879 |
$24,817 |
$18,755 |
2/28/22 |
$16,449 |
$24,074 |
$18,432 |
3/31/22 |
$16,732 |
$24,968 |
$18,745 |
4/30/22 |
$15,499 |
$22,791 |
$17,396 |
5/31/22 |
$15,544 |
$22,833 |
$17,468 |
6/30/22 |
$14,300 |
$20,948 |
$16,033 |
7/31/22 |
$15,261 |
$22,879 |
$17,177 |
8/31/22 |
$14,628 |
$21,946 |
$16,550 |
9/30/22 |
$13,239 |
$19,925 |
$15,060 |
10/31/22 |
$13,986 |
$21,538 |
$16,010 |
11/30/22 |
$15,186 |
$22,742 |
$17,170 |
12/31/22 |
$14,583 |
$21,432 |
$16,583 |
1/31/23 |
$15,645 |
$22,778 |
$17,737 |
2/28/23 |
$15,149 |
$22,223 |
$17,301 |
3/31/23 |
$15,536 |
$23,038 |
$17,648 |
4/30/23 |
$15,744 |
$23,398 |
$17,876 |
5/31/23 |
$15,502 |
$23,500 |
$17,598 |
6/30/23 |
$16,322 |
$25,053 |
$18,540 |
7/31/23 |
$16,866 |
$25,857 |
$19,156 |
8/31/23 |
$16,380 |
$25,446 |
$18,678 |
9/30/23 |
$15,700 |
$24,232 |
$17,917 |
10/31/23 |
$15,236 |
$23,723 |
$17,368 |
11/30/23 |
$16,523 |
$25,889 |
$18,853 |
12/31/23 |
$17,352 |
$27,066 |
$19,836 |
1/31/24 |
$17,305 |
$27,520 |
$19,863 |
2/29/24 |
$17,964 |
$28,990 |
$20,587 |
3/31/24 |
$18,500 |
$29,923 |
$21,193 |
4/30/24 |
$17,851 |
$28,700 |
$20,498 |
5/31/24 |
$18,618 |
$30,124 |
$21,303 |
6/30/24 |
$18,906 |
$31,204 |
$21,606 |
7/31/24 |
$19,321 |
$31,584 |
$22,130 |
8/31/24 |
$19,771 |
$32,350 |
$22,610 |
9/30/24 |
$20,219 |
$33,041 |
$23,080 |
10/31/24 |
$19,707 |
$32,742 |
$22,525 |
11/30/24 |
$20,409 |
$34,664 |
$23,300 |
12/31/24 |
$19,807 |
$33,837 |
$22,677 |
1/31/25 |
$20,369 |
$34,780 |
$23,327 |
2/28/25 |
$20,393 |
$34,326 |
$23,233 |
3/31/25 |
$19,744 |
$32,392 |
$22,505 |
4/30/25 |
$19,805 |
$32,172 |
$22,669 |
5/31/25 |
$20,794 |
$34,197 |
$23,776 |
6/30/25 |
$21,675 |
$35,936 |
$24,711 |
|
|
| Average Annual Return [Table Text Block] |
Class/Index Name |
1 Year |
5 Years |
10 Years |
Class A (excluding sales charge) |
14.64% |
11.85% |
8.66% |
Class A (including sales charge) |
8.33% |
10.60% |
8.04% |
S&P 500 Index |
15.16% |
16.64% |
13.65% |
S&P Target Date 2055 Index |
14.37% |
12.57% |
9.47% | |
|
| No Deduction of Taxes [Text Block] |
Returns shown do not reflect the deduction of taxes that a shareholder would pay on Fund distributions or the redemption of Fund shares.
|
|
| Performance Table Market Index Changed [Text Block] |
Differences in the Fund’s performance versus an index and related attribution information with respect to particular categories of securities or individual positions may be attributable, in part, to differences in the pricing methodologies used by the Fund and the index.
|
|
| Updated Performance Information Location [Text Block] |
For performance current to the most recent month-end, visit www.pimco.com/literature or via 888.87.PIMCO (888.877.4626).
|
|
| AssetsNet |
$ 460,383,000
|
|
| Holdings Count | Holding |
21
|
|
| Advisory Fees Paid, Amount |
$ 130,000
|
|
| InvestmentCompanyPortfolioTurnover |
16.00%
|
|
| Additional Fund Statistics [Text Block] |
Key Fund StatisticsFootnote Reference† (as of the end of the reporting period)
Total Net Assets |
$460,383 |
# of Portfolio Holdings |
21 |
Portfolio Turnover Rate |
16% |
Total Net Advisory Fees Paid During the Reporting Period |
$130 |
| Footnote |
Description |
Footnote† |
Dollar amounts displayed in 000's | |
|
| Holdings [Text Block] |
Security Type Breakdown (% of Net Asset Value)Footnote Reference*
Mutual Funds |
88.6% |
Short-Term Instruments |
0.1% |
Affiliated Investments |
11.2% |
Financial Derivative Instruments |
(0.1%) |
Other Assets and Liabilities, Net |
0.2% |
Total |
100.0% |
| Footnote |
Description |
Footnote* |
% of Net Asset Value includes derivatives instruments, if any, valued at the value used for determining the Fund's net asset value. The notional exposure of such derivatives investments therefore may be greater than what is depicted. | |
|
| Largest Holdings [Text Block] |
Top Holdings (% of Net Asset Value)Footnote Reference**
Vanguard Institutional Index Fund 'Institutional Plus' |
51.1% |
Vanguard Developed Markets Index Fund 'Institutional' |
25.1% |
Vanguard Emerging Markets Stock Index Fund 'Institutional' |
8.5% |
Vanguard Small-Cap Index Fund 'Institutional' |
4.0% |
PIMCO Total Return Fund |
1.8% |
PIMCO Real Return Fund |
1.1% |
PIMCO Long-Term Real Return Fund |
1.0% |
PIMCO Long-Term U.S. Government Fund |
1.0% |
PIMCO Income Fund |
0.7% |
PIMCO Emerging Markets Local Currency and Bond Fund |
0.3% |
| Footnote |
Description |
Footnote** |
Short-Term Instruments/Foreign Currency Contracts are not included in Top Holdings table. | |
|
| Material Fund Change [Text Block] |
This is a summary of certain changes and planned changes of the Fund since the beginning of the reporting period. For more information, you may refer to the Fund's next prospectus, which we expect to be available by October 31, 2025 or upon request at 888.87.PIMCO (888.877.4626). Change to REALPATH Blend Glide Path. Effective February 28, 2025, the Fund’s REALPATH Blend Glide Path, which forms the basis of the Fund’s long-term asset allocations, was changed based on data relating to risk metrics, long-term market trends, correlation of asset types and actuarial assumptions of life expectancy and retirement. |
|
| Material Fund Change Objectives [Text Block] |
Change to REALPATH Blend Glide Path. Effective February 28, 2025, the Fund’s REALPATH Blend Glide Path, which forms the basis of the Fund’s long-term asset allocations, was changed based on data relating to risk metrics, long-term market trends, correlation of asset types and actuarial assumptions of life expectancy and retirement.
|
|
| Summary of Change Legend [Text Block] |
This is a summary of certain changes and planned changes of the Fund since the beginning of the reporting period. For more information, you may refer to the Fund's next prospectus, which we expect to be available by October 31, 2025 or upon request at 888.87.PIMCO (888.877.4626).
|
|
| C000150085 |
|
|
| Shareholder Report [Line Items] |
|
|
| Fund Name |
PIMCO REALPATH<sup style="box-sizing: border-box; color: rgb(0, 0, 0); display: inline; flex-wrap: nowrap; font-size: 19px; font-weight: 700; grid-area: auto; line-height: 0px; margin: 0px; overflow: visible; position: relative; text-align: left; text-align-last: auto; white-space-collapse: preserve-breaks;">®</sup> Blend 2055 Fund
|
|
| Class Name |
Institutional Class
|
|
| Trading Symbol |
PRQZX
|
|
| Annual or Semi-Annual Statement [Text Block] |
This annual shareholder report contains important information about the PIMCO REALPATH® Blend 2055 Fund (the "Fund") for the period of July 1, 2024 to June 30, 2025 (the "reporting period").
|
|
| Shareholder Report Annual or Semi-Annual |
Annual Shareholder Report
|
|
| Additional Information [Text Block] |
You can find additional information about the Fund at www.pimco.com/literature. You can also request this information by contacting us at 888.87.PIMCO (888.877.4626).
|
|
| Material Fund Change Notice [Text Block] |
This report describes changes to the Fund that occurred during the reporting period.
|
|
| Additional Information Website |
www.pimco.com/literature
|
|
| Expenses [Text Block] |
What were the Fund costs for the reporting period?(based on a hypothetical $10,000 investment)
Class Name |
Cost of a $10,000 investment |
Costs paid as a percentage of a $10,000 investment |
Institutional Class |
$5 |
0.05% | |
|
| Expenses Paid, Amount |
$ 5
|
|
| Expense Ratio, Percent |
0.05%
|
|
| Factors Affecting Performance [Text Block] |
How did the Fund perform during the reporting period and what affected its performance?The following affected performance (on a gross basis) during the reporting period: Exposure to U.S. large cap equities contributed to absolute performance, as U.S. large cap equities posted positive returns. Exposure to global equities contributed to absolute performance, as global equities posted positive returns. Exposure to emerging market equities contributed to absolute performance, as emerging market equities posted positive returns. There were no material detractors from absolute performance for this Fund.
|
|
| Performance Past Does Not Indicate Future [Text] |
Performance quoted represents past performance. Past performance is not a guarantee or a reliable indicator of future results.
|
|
| Line Graph [Table Text Block] |

|
Institutional Class |
S&P 500 Index |
S&P Target Date 2055 Index |
6/30/15 |
$1,000,000 |
$1,000,000 |
$1,000,000 |
7/31/15 |
$1,000,000 |
$1,020,951 |
$1,012,397 |
8/31/15 |
$940,653 |
$959,353 |
$952,233 |
9/30/15 |
$918,788 |
$935,615 |
$925,688 |
10/31/15 |
$969,336 |
$1,014,539 |
$986,955 |
11/30/15 |
$961,407 |
$1,017,556 |
$988,383 |
12/31/15 |
$944,682 |
$1,001,507 |
$966,511 |
1/31/16 |
$903,434 |
$951,808 |
$920,691 |
2/29/16 |
$899,409 |
$950,524 |
$914,848 |
3/31/16 |
$969,776 |
$1,015,006 |
$977,410 |
4/30/16 |
$978,848 |
$1,018,940 |
$986,220 |
5/31/16 |
$981,873 |
$1,037,239 |
$995,852 |
6/30/16 |
$995,322 |
$1,039,926 |
$996,155 |
7/31/16 |
$1,030,869 |
$1,078,267 |
$1,031,888 |
8/31/16 |
$1,032,900 |
$1,079,781 |
$1,035,015 |
9/30/16 |
$1,037,114 |
$1,079,985 |
$1,038,831 |
10/31/16 |
$1,018,812 |
$1,060,285 |
$1,017,968 |
11/30/16 |
$1,022,879 |
$1,099,552 |
$1,040,775 |
12/31/16 |
$1,041,955 |
$1,121,286 |
$1,062,569 |
1/31/17 |
$1,064,629 |
$1,142,553 |
$1,084,683 |
2/28/17 |
$1,093,486 |
$1,187,919 |
$1,112,204 |
3/31/17 |
$1,100,700 |
$1,189,305 |
$1,122,603 |
4/30/17 |
$1,114,098 |
$1,201,519 |
$1,137,094 |
5/31/17 |
$1,130,588 |
$1,218,428 |
$1,154,478 |
6/30/17 |
$1,138,101 |
$1,226,033 |
$1,162,713 |
7/31/17 |
$1,163,920 |
$1,251,243 |
$1,187,615 |
8/31/17 |
$1,170,117 |
$1,255,074 |
$1,187,799 |
9/30/17 |
$1,187,671 |
$1,280,963 |
$1,214,835 |
10/31/17 |
$1,208,398 |
$1,310,855 |
$1,237,590 |
11/30/17 |
$1,230,162 |
$1,351,059 |
$1,264,972 |
12/31/17 |
$1,246,665 |
$1,366,081 |
$1,280,136 |
1/31/18 |
$1,299,670 |
$1,444,294 |
$1,336,125 |
2/28/18 |
$1,248,785 |
$1,391,062 |
$1,285,302 |
3/31/18 |
$1,237,124 |
$1,355,710 |
$1,268,534 |
4/30/18 |
$1,240,305 |
$1,360,912 |
$1,277,646 |
5/31/18 |
$1,250,906 |
$1,393,686 |
$1,293,487 |
6/30/18 |
$1,246,899 |
$1,402,264 |
$1,290,161 |
7/31/18 |
$1,278,762 |
$1,454,447 |
$1,322,595 |
8/31/18 |
$1,290,445 |
$1,501,841 |
$1,340,070 |
9/30/18 |
$1,290,259 |
$1,510,389 |
$1,340,187 |
10/31/18 |
$1,207,154 |
$1,407,154 |
$1,245,348 |
11/30/18 |
$1,229,529 |
$1,435,829 |
$1,265,740 |
12/31/18 |
$1,150,910 |
$1,306,187 |
$1,178,056 |
1/31/19 |
$1,236,865 |
$1,410,859 |
$1,266,127 |
2/28/19 |
$1,264,773 |
$1,456,159 |
$1,299,270 |
3/31/19 |
$1,284,128 |
$1,484,455 |
$1,311,244 |
4/30/19 |
$1,322,226 |
$1,544,560 |
$1,351,385 |
5/31/19 |
$1,254,994 |
$1,446,406 |
$1,278,757 |
6/30/19 |
$1,326,786 |
$1,548,343 |
$1,355,023 |
7/31/19 |
$1,331,287 |
$1,570,597 |
$1,360,666 |
8/31/19 |
$1,309,906 |
$1,545,718 |
$1,333,290 |
9/30/19 |
$1,334,897 |
$1,574,639 |
$1,361,277 |
10/31/19 |
$1,365,441 |
$1,608,745 |
$1,392,520 |
11/30/19 |
$1,394,854 |
$1,667,141 |
$1,423,742 |
12/31/19 |
$1,438,277 |
$1,717,458 |
$1,466,511 |
1/31/20 |
$1,422,090 |
$1,716,785 |
$1,449,443 |
2/29/20 |
$1,328,441 |
$1,575,461 |
$1,340,473 |
3/31/20 |
$1,143,743 |
$1,380,871 |
$1,160,891 |
4/30/20 |
$1,254,876 |
$1,557,890 |
$1,278,752 |
5/31/20 |
$1,308,127 |
$1,632,089 |
$1,333,204 |
6/30/20 |
$1,344,490 |
$1,664,547 |
$1,367,018 |
7/31/20 |
$1,407,133 |
$1,758,403 |
$1,427,830 |
8/31/20 |
$1,476,735 |
$1,884,798 |
$1,500,260 |
9/30/20 |
$1,436,134 |
$1,813,182 |
$1,457,555 |
10/31/20 |
$1,409,453 |
$1,764,962 |
$1,433,152 |
11/30/20 |
$1,561,418 |
$1,958,162 |
$1,598,326 |
12/31/20 |
$1,629,590 |
$2,033,450 |
$1,669,718 |
1/31/21 |
$1,624,911 |
$2,012,921 |
$1,667,186 |
2/28/21 |
$1,664,685 |
$2,068,427 |
$1,714,694 |
3/31/21 |
$1,710,462 |
$2,159,015 |
$1,764,408 |
4/30/21 |
$1,781,289 |
$2,274,239 |
$1,834,437 |
5/31/21 |
$1,810,800 |
$2,290,123 |
$1,859,749 |
6/30/21 |
$1,830,517 |
$2,343,585 |
$1,872,988 |
7/31/21 |
$1,848,428 |
$2,399,257 |
$1,884,735 |
8/31/21 |
$1,887,833 |
$2,472,208 |
$1,927,117 |
9/30/21 |
$1,815,396 |
$2,357,226 |
$1,857,867 |
10/31/21 |
$1,900,418 |
$2,522,377 |
$1,941,006 |
11/30/21 |
$1,858,506 |
$2,504,900 |
$1,895,445 |
12/31/21 |
$1,934,869 |
$2,617,160 |
$1,973,391 |
1/31/22 |
$1,848,766 |
$2,481,730 |
$1,875,520 |
2/28/22 |
$1,802,024 |
$2,407,423 |
$1,843,199 |
3/31/22 |
$1,832,775 |
$2,496,810 |
$1,874,481 |
4/30/22 |
$1,698,699 |
$2,279,083 |
$1,739,616 |
5/31/22 |
$1,703,620 |
$2,283,265 |
$1,746,756 |
6/30/22 |
$1,568,314 |
$2,094,795 |
$1,603,324 |
7/31/22 |
$1,674,098 |
$2,287,945 |
$1,717,680 |
8/31/22 |
$1,605,216 |
$2,194,638 |
$1,655,050 |
9/30/22 |
$1,452,772 |
$1,992,515 |
$1,505,971 |
10/31/22 |
$1,536,563 |
$2,153,832 |
$1,600,987 |
11/30/22 |
$1,668,409 |
$2,274,196 |
$1,717,031 |
12/31/22 |
$1,603,692 |
$2,143,170 |
$1,658,295 |
1/31/23 |
$1,720,667 |
$2,277,834 |
$1,773,690 |
2/28/23 |
$1,666,581 |
$2,222,257 |
$1,730,076 |
3/31/23 |
$1,710,268 |
$2,303,845 |
$1,764,798 |
4/30/23 |
$1,734,214 |
$2,339,805 |
$1,787,644 |
5/31/23 |
$1,707,747 |
$2,349,975 |
$1,759,801 |
6/30/23 |
$1,798,621 |
$2,505,250 |
$1,854,037 |
7/31/23 |
$1,859,121 |
$2,585,731 |
$1,915,629 |
8/31/23 |
$1,806,184 |
$2,544,562 |
$1,867,797 |
9/30/23 |
$1,730,844 |
$2,423,243 |
$1,791,667 |
10/31/23 |
$1,681,500 |
$2,372,291 |
$1,736,761 |
11/30/23 |
$1,824,471 |
$2,588,941 |
$1,885,320 |
12/31/23 |
$1,917,162 |
$2,706,559 |
$1,983,580 |
1/31/24 |
$1,912,022 |
$2,752,040 |
$1,986,306 |
2/29/24 |
$1,985,265 |
$2,898,987 |
$2,058,737 |
3/31/24 |
$2,045,405 |
$2,992,260 |
$2,119,290 |
4/30/24 |
$1,974,473 |
$2,870,043 |
$2,049,845 |
5/31/24 |
$2,059,591 |
$3,012,353 |
$2,130,323 |
6/30/24 |
$2,091,886 |
$3,120,443 |
$2,160,566 |
7/31/24 |
$2,138,545 |
$3,158,426 |
$2,213,007 |
8/31/24 |
$2,189,092 |
$3,235,039 |
$2,260,969 |
9/30/24 |
$2,239,946 |
$3,304,130 |
$2,307,957 |
10/31/24 |
$2,185,218 |
$3,274,166 |
$2,252,467 |
11/30/24 |
$2,262,098 |
$3,466,363 |
$2,330,024 |
12/31/24 |
$2,197,616 |
$3,383,732 |
$2,267,654 |
1/31/25 |
$2,261,819 |
$3,477,960 |
$2,332,685 |
2/28/25 |
$2,264,494 |
$3,432,579 |
$2,323,339 |
3/31/25 |
$2,192,715 |
$3,239,172 |
$2,250,455 |
4/30/25 |
$2,200,752 |
$3,217,208 |
$2,266,940 |
5/31/25 |
$2,311,928 |
$3,419,714 |
$2,377,597 |
6/30/25 |
$2,409,698 |
$3,593,616 |
$2,471,120 |
|
|
| Average Annual Return [Table Text Block] |
Class/Index Name |
1 Year |
5 Years |
10 Years |
Institutional Class |
15.19% |
12.38% |
9.19% |
S&P 500 Index |
15.16% |
16.64% |
13.65% |
S&P Target Date 2055 Index |
14.37% |
12.57% |
9.47% | |
|
| No Deduction of Taxes [Text Block] |
Returns shown do not reflect the deduction of taxes that a shareholder would pay on Fund distributions or the redemption of Fund shares.
|
|
| Performance Table Market Index Changed [Text Block] |
Differences in the Fund’s performance versus an index and related attribution information with respect to particular categories of securities or individual positions may be attributable, in part, to differences in the pricing methodologies used by the Fund and the index.
|
|
| Updated Performance Information Location [Text Block] |
For performance current to the most recent month-end, visit www.pimco.com/literature or via 888.87.PIMCO (888.877.4626).
|
|
| AssetsNet |
$ 460,383,000
|
|
| Holdings Count | Holding |
21
|
|
| Advisory Fees Paid, Amount |
$ 130,000
|
|
| InvestmentCompanyPortfolioTurnover |
16.00%
|
|
| Additional Fund Statistics [Text Block] |
Key Fund StatisticsFootnote Reference† (as of the end of the reporting period)
Total Net Assets |
$460,383 |
# of Portfolio Holdings |
21 |
Portfolio Turnover Rate |
16% |
Total Net Advisory Fees Paid During the Reporting Period |
$130 |
| Footnote |
Description |
Footnote† |
Dollar amounts displayed in 000's | |
|
| Holdings [Text Block] |
Security Type Breakdown (% of Net Asset Value)Footnote Reference*
Mutual Funds |
88.6% |
Short-Term Instruments |
0.1% |
Affiliated Investments |
11.2% |
Financial Derivative Instruments |
(0.1%) |
Other Assets and Liabilities, Net |
0.2% |
Total |
100.0% |
| Footnote |
Description |
Footnote* |
% of Net Asset Value includes derivatives instruments, if any, valued at the value used for determining the Fund's net asset value. The notional exposure of such derivatives investments therefore may be greater than what is depicted. | |
|
| Largest Holdings [Text Block] |
Top Holdings (% of Net Asset Value)Footnote Reference**
Vanguard Institutional Index Fund 'Institutional Plus' |
51.1% |
Vanguard Developed Markets Index Fund 'Institutional' |
25.1% |
Vanguard Emerging Markets Stock Index Fund 'Institutional' |
8.5% |
Vanguard Small-Cap Index Fund 'Institutional' |
4.0% |
PIMCO Total Return Fund |
1.8% |
PIMCO Real Return Fund |
1.1% |
PIMCO Long-Term Real Return Fund |
1.0% |
PIMCO Long-Term U.S. Government Fund |
1.0% |
PIMCO Income Fund |
0.7% |
PIMCO Emerging Markets Local Currency and Bond Fund |
0.3% |
| Footnote |
Description |
Footnote** |
Short-Term Instruments/Foreign Currency Contracts are not included in Top Holdings table. | |
|
| Material Fund Change [Text Block] |
This is a summary of certain changes and planned changes of the Fund since the beginning of the reporting period. For more information, you may refer to the Fund's next prospectus, which we expect to be available by October 31, 2025 or upon request at 888.87.PIMCO (888.877.4626). Change to REALPATH Blend Glide Path. Effective February 28, 2025, the Fund’s REALPATH Blend Glide Path, which forms the basis of the Fund’s long-term asset allocations, was changed based on data relating to risk metrics, long-term market trends, correlation of asset types and actuarial assumptions of life expectancy and retirement. |
|
| Material Fund Change Objectives [Text Block] |
Change to REALPATH Blend Glide Path. Effective February 28, 2025, the Fund’s REALPATH Blend Glide Path, which forms the basis of the Fund’s long-term asset allocations, was changed based on data relating to risk metrics, long-term market trends, correlation of asset types and actuarial assumptions of life expectancy and retirement.
|
|
| Summary of Change Legend [Text Block] |
This is a summary of certain changes and planned changes of the Fund since the beginning of the reporting period. For more information, you may refer to the Fund's next prospectus, which we expect to be available by October 31, 2025 or upon request at 888.87.PIMCO (888.877.4626).
|
|
| C000215697 |
|
|
| Shareholder Report [Line Items] |
|
|
| Fund Name |
PIMCO REALPATH<sup style="box-sizing: border-box; color: rgb(0, 0, 0); display: inline; flex-wrap: nowrap; font-size: 19px; font-weight: 700; grid-area: auto; line-height: 0px; margin: 0px; overflow: visible; position: relative; text-align: left; text-align-last: auto; white-space-collapse: preserve-breaks;">®</sup> Blend 2060 Fund
|
|
| Class Name |
Class A
|
|
| Trading Symbol |
PRBAX
|
|
| Annual or Semi-Annual Statement [Text Block] |
This annual shareholder report contains important information about the PIMCO REALPATH® Blend 2060 Fund (the "Fund") for the period of July 1, 2024 to June 30, 2025 (the "reporting period").
|
|
| Shareholder Report Annual or Semi-Annual |
Annual Shareholder Report
|
|
| Additional Information [Text Block] |
You can find additional information about the Fund at www.pimco.com/literature. You can also request this information by contacting us at 888.87.PIMCO (888.877.4626).
|
|
| Material Fund Change Notice [Text Block] |
This report describes changes to the Fund that occurred during the reporting period.
|
|
| Additional Information Website |
www.pimco.com/literature
|
|
| Expenses [Text Block] |
What were the Fund costs for the reporting period?(based on a hypothetical $10,000 investment)
Class Name |
Cost of a $10,000 investment |
Costs paid as a percentage of a $10,000 investment |
Class A |
$54 |
0.50% | |
|
| Expenses Paid, Amount |
$ 54
|
|
| Expense Ratio, Percent |
0.50%
|
|
| Factors Affecting Performance [Text Block] |
How did the Fund perform during the reporting period and what affected its performance?The following affected performance (on a gross basis) during the reporting period: Exposure to U.S. large cap equities contributed to absolute performance, as U.S. large cap equities posted positive returns. Exposure to global equities contributed to absolute performance, as global equities posted positive returns. Exposure to emerging market equities contributed to absolute performance, as emerging market equities posted positive returns. There were no material detractors from absolute performance for this Fund.
|
|
| Performance Past Does Not Indicate Future [Text] |
Performance quoted represents past performance. Past performance is not a guarantee or a reliable indicator of future results.
|
|
| Line Graph [Table Text Block] |
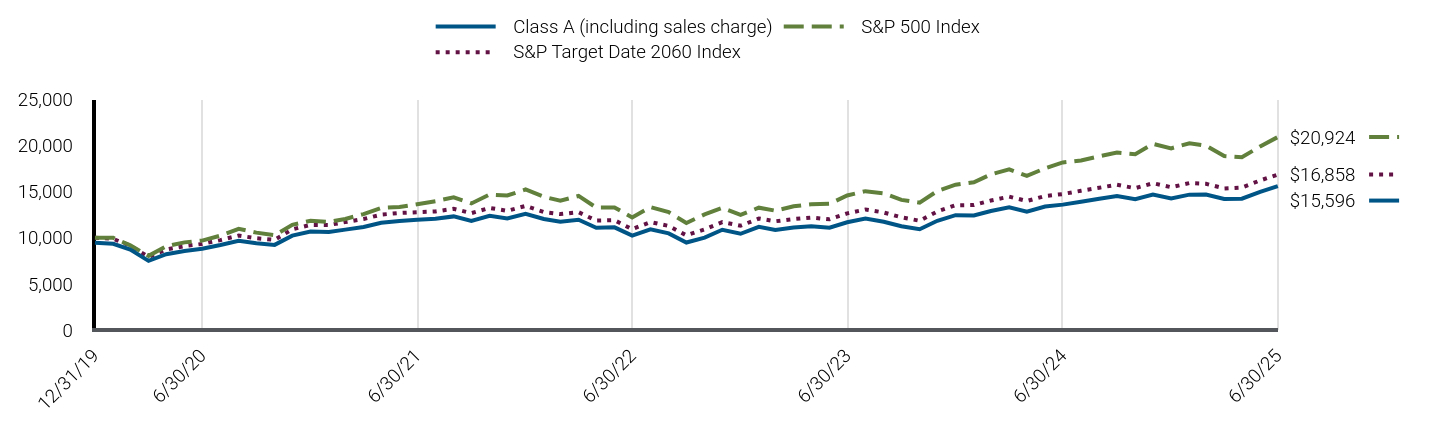
|
Class A (including sales charge) |
S&P 500 Index |
S&P Target Date 2060 Index |
12/31/19 |
$9,452 |
$10,000 |
$10,000 |
1/31/20 |
$9,348 |
$9,996 |
$9,884 |
2/29/20 |
$8,724 |
$9,173 |
$9,137 |
3/31/20 |
$7,495 |
$8,040 |
$7,914 |
4/30/20 |
$8,223 |
$9,071 |
$8,725 |
5/31/20 |
$8,573 |
$9,503 |
$9,101 |
6/30/20 |
$8,809 |
$9,692 |
$9,333 |
7/31/20 |
$9,216 |
$10,238 |
$9,747 |
8/31/20 |
$9,669 |
$10,974 |
$10,240 |
9/30/20 |
$9,409 |
$10,557 |
$9,950 |
10/31/20 |
$9,230 |
$10,277 |
$9,784 |
11/30/20 |
$10,232 |
$11,402 |
$10,911 |
12/31/20 |
$10,675 |
$11,840 |
$11,399 |
1/31/21 |
$10,627 |
$11,720 |
$11,382 |
2/28/21 |
$10,884 |
$12,044 |
$11,703 |
3/31/21 |
$11,173 |
$12,571 |
$12,038 |
4/30/21 |
$11,632 |
$13,242 |
$12,513 |
5/31/21 |
$11,823 |
$13,334 |
$12,688 |
6/30/21 |
$11,954 |
$13,646 |
$12,776 |
7/31/21 |
$12,069 |
$13,970 |
$12,853 |
8/31/21 |
$12,319 |
$14,395 |
$13,143 |
9/30/21 |
$11,834 |
$13,725 |
$12,670 |
10/31/21 |
$12,393 |
$14,687 |
$13,236 |
11/30/21 |
$12,104 |
$14,585 |
$12,922 |
12/31/21 |
$12,609 |
$15,239 |
$13,456 |
1/31/22 |
$12,033 |
$14,450 |
$12,786 |
2/28/22 |
$11,740 |
$14,017 |
$12,567 |
3/31/22 |
$11,960 |
$14,538 |
$12,780 |
4/30/22 |
$11,080 |
$13,270 |
$11,860 |
5/31/22 |
$11,133 |
$13,294 |
$11,908 |
6/30/22 |
$10,243 |
$12,197 |
$10,929 |
7/31/22 |
$10,923 |
$13,322 |
$11,709 |
8/31/22 |
$10,473 |
$12,778 |
$11,281 |
9/30/22 |
$9,483 |
$11,602 |
$10,263 |
10/31/22 |
$10,017 |
$12,541 |
$10,912 |
11/30/22 |
$10,866 |
$13,242 |
$11,704 |
12/31/22 |
$10,437 |
$12,479 |
$11,302 |
1/31/23 |
$11,190 |
$13,263 |
$12,088 |
2/28/23 |
$10,840 |
$12,939 |
$11,791 |
3/31/23 |
$11,111 |
$13,414 |
$12,032 |
4/30/23 |
$11,260 |
$13,624 |
$12,190 |
5/31/23 |
$11,101 |
$13,683 |
$12,002 |
6/30/23 |
$11,685 |
$14,587 |
$12,649 |
7/31/23 |
$12,079 |
$15,056 |
$13,071 |
8/31/23 |
$11,739 |
$14,816 |
$12,742 |
9/30/23 |
$11,250 |
$14,109 |
$12,222 |
10/31/23 |
$10,920 |
$13,813 |
$11,844 |
11/30/23 |
$11,846 |
$15,074 |
$12,858 |
12/31/23 |
$12,456 |
$15,759 |
$13,533 |
1/31/24 |
$12,424 |
$16,024 |
$13,548 |
2/29/24 |
$12,908 |
$16,880 |
$14,044 |
3/31/24 |
$13,300 |
$17,423 |
$14,460 |
4/30/24 |
$12,836 |
$16,711 |
$13,985 |
5/31/24 |
$13,387 |
$17,540 |
$14,534 |
6/30/24 |
$13,595 |
$18,169 |
$14,741 |
7/31/24 |
$13,899 |
$18,390 |
$15,104 |
8/31/24 |
$14,224 |
$18,836 |
$15,429 |
9/30/24 |
$14,538 |
$19,238 |
$15,755 |
10/31/24 |
$14,190 |
$19,064 |
$15,378 |
11/30/24 |
$14,691 |
$20,183 |
$15,920 |
12/31/24 |
$14,266 |
$19,702 |
$15,487 |
1/31/25 |
$14,677 |
$20,251 |
$15,932 |
2/28/25 |
$14,688 |
$19,986 |
$15,857 |
3/31/25 |
$14,200 |
$18,860 |
$15,350 |
4/30/25 |
$14,244 |
$18,732 |
$15,453 |
5/31/25 |
$14,978 |
$19,911 |
$16,216 |
6/30/25 |
$15,596 |
$20,924 |
$16,858 |
|
|
| Average Annual Return [Table Text Block] |
Class/Index Name |
1 Year |
5 Years |
Since Inception 12/31/19 |
Class A (excluding sales charge) |
14.71% |
12.10% |
9.54% |
Class A (including sales charge) |
8.40% |
10.85% |
8.42% |
S&P 500 Index |
15.16% |
16.64% |
14.37% |
S&P Target Date 2060 Index |
14.36% |
12.55% |
9.96% | |
|
| No Deduction of Taxes [Text Block] |
Returns shown do not reflect the deduction of taxes that a shareholder would pay on Fund distributions or the redemption of Fund shares.
|
|
| Performance Table Market Index Changed [Text Block] |
Differences in the Fund’s performance versus an index and related attribution information with respect to particular categories of securities or individual positions may be attributable, in part, to differences in the pricing methodologies used by the Fund and the index.
|
|
| Updated Performance Information Location [Text Block] |
For performance current to the most recent month-end, visit www.pimco.com/literature or via 888.87.PIMCO (888.877.4626).
|
|
| AssetsNet |
$ 205,871,000
|
|
| Holdings Count | Holding |
22
|
|
| Advisory Fees Paid, Amount |
$ 53,000
|
|
| InvestmentCompanyPortfolioTurnover |
18.00%
|
|
| Additional Fund Statistics [Text Block] |
Key Fund StatisticsFootnote Reference† (as of the end of the reporting period)
Total Net Assets |
$205,871 |
# of Portfolio Holdings |
22 |
Portfolio Turnover Rate |
18% |
Total Net Advisory Fees Paid During the Reporting Period |
$53 |
| Footnote |
Description |
Footnote† |
Dollar amounts displayed in 000's | |
|
| Holdings [Text Block] |
Security Type Breakdown (% of Net Asset Value)Footnote Reference*
Mutual Funds |
89.8% |
Short-Term Instruments |
0.4% |
Affiliated Investments |
11.2% |
Financial Derivative Instruments |
0.0%Footnote Reference^ |
Other Assets and Liabilities, Net |
(1.4%) |
Total |
100.0% |
| Footnote |
Description |
Footnote* |
% of Net Asset Value includes derivatives instruments, if any, valued at the value used for determining the Fund's net asset value. The notional exposure of such derivatives investments therefore may be greater than what is depicted. |
Footnote^ |
Rounded value of investments is less than 0.1% of net assets. | |
|
| Largest Holdings [Text Block] |
Top Holdings (% of Net Asset Value)Footnote Reference**
Vanguard Institutional Index Fund 'Institutional' |
52.2% |
Vanguard Developed Markets Index Fund 'Institutional' |
25.0% |
Vanguard Emerging Markets Stock Index Fund 'Institutional' |
8.4% |
Vanguard Small-Cap Index Fund 'Institutional' |
4.2% |
PIMCO Total Return Fund |
1.3% |
PIMCO Real Return Fund |
1.1% |
PIMCO Long-Term Real Return Fund |
0.8% |
PIMCO Long-Term U.S. Government Fund |
0.7% |
PIMCO Income Fund |
0.6% |
PIMCO Emerging Markets Local Currency and Bond Fund |
0.3% |
| Footnote |
Description |
Footnote** |
Short-Term Instruments/Foreign Currency Contracts are not included in Top Holdings table. | |
|
| Material Fund Change [Text Block] |
This is a summary of certain changes and planned changes of the Fund since the beginning of the reporting period. For more information, you may refer to the Fund's next prospectus, which we expect to be available by October 31, 2025 or upon request at 888.87.PIMCO (888.877.4626). Change to REALPATH Blend Glide Path. Effective February 28, 2025, the Fund’s REALPATH Blend Glide Path, which forms the basis of the Fund’s long-term asset allocations, was changed based on data relating to risk metrics, long-term market trends, correlation of asset types and actuarial assumptions of life expectancy and retirement. |
|
| Material Fund Change Objectives [Text Block] |
Change to REALPATH Blend Glide Path. Effective February 28, 2025, the Fund’s REALPATH Blend Glide Path, which forms the basis of the Fund’s long-term asset allocations, was changed based on data relating to risk metrics, long-term market trends, correlation of asset types and actuarial assumptions of life expectancy and retirement.
|
|
| Summary of Change Legend [Text Block] |
This is a summary of certain changes and planned changes of the Fund since the beginning of the reporting period. For more information, you may refer to the Fund's next prospectus, which we expect to be available by October 31, 2025 or upon request at 888.87.PIMCO (888.877.4626).
|
|
| C000215695 |
|
|
| Shareholder Report [Line Items] |
|
|
| Fund Name |
PIMCO REALPATH<sup style="box-sizing: border-box; color: rgb(0, 0, 0); display: inline; flex-wrap: nowrap; font-size: 19px; font-weight: 700; grid-area: auto; line-height: 0px; margin: 0px; overflow: visible; position: relative; text-align: left; text-align-last: auto; white-space-collapse: preserve-breaks;">®</sup> Blend 2060 Fund
|
|
| Class Name |
Institutional Class
|
|
| Trading Symbol |
PRBMX
|
|
| Annual or Semi-Annual Statement [Text Block] |
This annual shareholder report contains important information about the PIMCO REALPATH® Blend 2060 Fund (the "Fund") for the period of July 1, 2024 to June 30, 2025 (the "reporting period").
|
|
| Shareholder Report Annual or Semi-Annual |
Annual Shareholder Report
|
|
| Additional Information [Text Block] |
You can find additional information about the Fund at www.pimco.com/literature. You can also request this information by contacting us at 888.87.PIMCO (888.877.4626).
|
|
| Material Fund Change Notice [Text Block] |
This report describes changes to the Fund that occurred during the reporting period.
|
|
| Additional Information Website |
www.pimco.com/literature
|
|
| Expenses [Text Block] |
What were the Fund costs for the reporting period?(based on a hypothetical $10,000 investment)
Class Name |
Cost of a $10,000 investment |
Costs paid as a percentage of a $10,000 investment |
Institutional Class |
$5 |
0.05% | |
|
| Expenses Paid, Amount |
$ 5
|
|
| Expense Ratio, Percent |
0.05%
|
|
| Factors Affecting Performance [Text Block] |
How did the Fund perform during the reporting period and what affected its performance?The following affected performance (on a gross basis) during the reporting period: Exposure to U.S. large cap equities contributed to absolute performance, as U.S. large cap equities posted positive returns. Exposure to global equities contributed to absolute performance, as global equities posted positive returns. Exposure to emerging market equities contributed to absolute performance, as emerging market equities posted positive returns. There were no material detractors from absolute performance for this Fund.
|
|
| Performance Past Does Not Indicate Future [Text] |
Performance quoted represents past performance. Past performance is not a guarantee or a reliable indicator of future results.
|
|
| Line Graph [Table Text Block] |
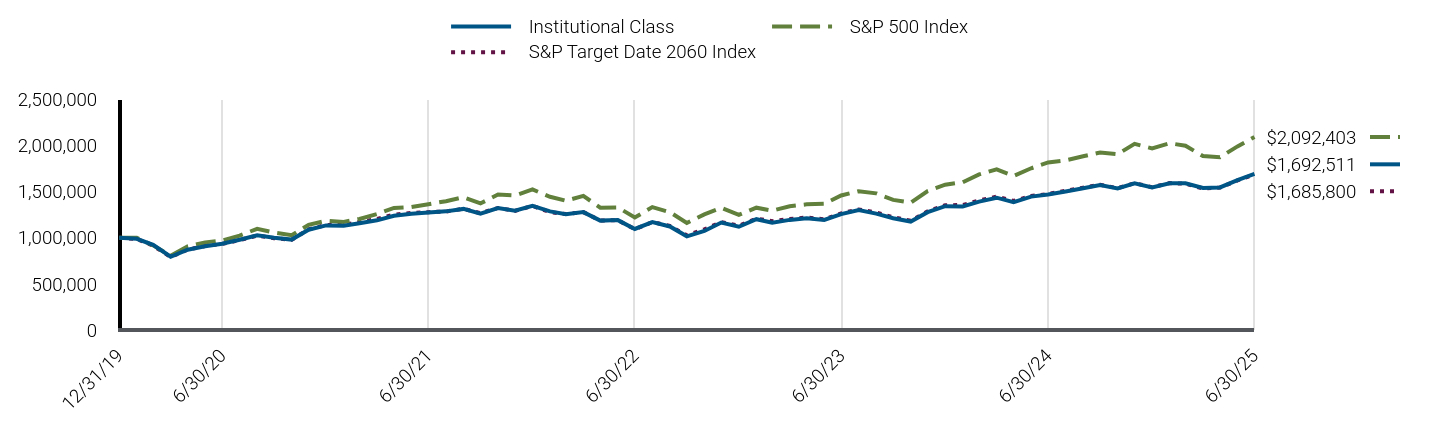
|
Institutional Class |
S&P 500 Index |
S&P Target Date 2060 Index |
12/31/19 |
$1,000,000 |
$1,000,000 |
$1,000,000 |
1/31/20 |
$989,000 |
$999,608 |
$988,414 |
2/29/20 |
$924,000 |
$917,321 |
$913,747 |
3/31/20 |
$794,000 |
$804,020 |
$791,444 |
4/30/20 |
$871,000 |
$907,090 |
$872,480 |
5/31/20 |
$909,000 |
$950,293 |
$910,056 |
6/30/20 |
$935,000 |
$969,192 |
$933,318 |
7/31/20 |
$978,000 |
$1,023,840 |
$974,688 |
8/31/20 |
$1,026,000 |
$1,097,434 |
$1,024,037 |
9/30/20 |
$999,240 |
$1,055,735 |
$995,048 |
10/31/20 |
$980,217 |
$1,027,659 |
$978,365 |
11/30/20 |
$1,087,350 |
$1,140,151 |
$1,091,113 |
12/31/20 |
$1,134,171 |
$1,183,988 |
$1,139,901 |
1/31/21 |
$1,130,135 |
$1,172,035 |
$1,138,169 |
2/28/21 |
$1,157,380 |
$1,204,353 |
$1,170,323 |
3/31/21 |
$1,189,119 |
$1,257,099 |
$1,203,826 |
4/30/21 |
$1,238,835 |
$1,324,188 |
$1,251,256 |
5/31/21 |
$1,260,142 |
$1,333,437 |
$1,268,763 |
6/30/21 |
$1,273,249 |
$1,364,566 |
$1,277,551 |
7/31/21 |
$1,286,523 |
$1,396,981 |
$1,285,307 |
8/31/21 |
$1,313,070 |
$1,439,457 |
$1,314,268 |
9/30/21 |
$1,262,576 |
$1,372,508 |
$1,266,997 |
10/31/21 |
$1,323,040 |
$1,468,669 |
$1,323,645 |
11/30/21 |
$1,293,321 |
$1,458,492 |
$1,292,205 |
12/31/21 |
$1,346,436 |
$1,523,856 |
$1,345,618 |
1/31/22 |
$1,286,298 |
$1,445,001 |
$1,278,597 |
2/28/22 |
$1,255,115 |
$1,401,736 |
$1,256,748 |
3/31/22 |
$1,278,502 |
$1,453,782 |
$1,278,029 |
4/30/22 |
$1,186,067 |
$1,327,009 |
$1,185,953 |
5/31/22 |
$1,191,635 |
$1,329,444 |
$1,190,842 |
6/30/22 |
$1,095,859 |
$1,219,707 |
$1,092,935 |
7/31/22 |
$1,170,475 |
$1,332,169 |
$1,170,939 |
8/31/22 |
$1,122,587 |
$1,277,841 |
$1,128,100 |
9/30/22 |
$1,015,860 |
$1,160,153 |
$1,026,343 |
10/31/22 |
$1,073,846 |
$1,254,081 |
$1,091,162 |
11/30/22 |
$1,165,284 |
$1,324,164 |
$1,170,371 |
12/31/22 |
$1,119,976 |
$1,247,873 |
$1,130,226 |
1/31/23 |
$1,201,429 |
$1,326,282 |
$1,208,826 |
2/28/23 |
$1,164,096 |
$1,293,922 |
$1,179,062 |
3/31/23 |
$1,193,993 |
$1,341,427 |
$1,203,203 |
4/30/23 |
$1,211,001 |
$1,362,365 |
$1,218,986 |
5/31/23 |
$1,192,859 |
$1,368,286 |
$1,200,232 |
6/30/23 |
$1,256,830 |
$1,458,696 |
$1,264,850 |
7/31/23 |
$1,299,935 |
$1,505,557 |
$1,307,149 |
8/31/23 |
$1,262,502 |
$1,481,586 |
$1,274,206 |
9/30/23 |
$1,211,340 |
$1,410,947 |
$1,222,226 |
10/31/23 |
$1,176,080 |
$1,381,280 |
$1,184,423 |
11/30/23 |
$1,277,309 |
$1,507,426 |
$1,285,847 |
12/31/23 |
$1,343,071 |
$1,575,909 |
$1,353,284 |
1/31/24 |
$1,339,621 |
$1,602,391 |
$1,354,801 |
2/29/24 |
$1,392,516 |
$1,687,952 |
$1,404,391 |
3/31/24 |
$1,434,719 |
$1,742,261 |
$1,445,970 |
4/30/24 |
$1,385,007 |
$1,671,099 |
$1,398,470 |
5/31/24 |
$1,446,280 |
$1,753,960 |
$1,453,373 |
6/30/24 |
$1,469,015 |
$1,816,895 |
$1,474,134 |
7/31/24 |
$1,501,531 |
$1,839,012 |
$1,510,449 |
8/31/24 |
$1,537,531 |
$1,883,620 |
$1,542,901 |
9/30/24 |
$1,572,481 |
$1,923,849 |
$1,575,476 |
10/31/24 |
$1,535,152 |
$1,906,402 |
$1,537,824 |
11/30/24 |
$1,591,146 |
$2,018,310 |
$1,592,034 |
12/31/24 |
$1,545,332 |
$1,970,197 |
$1,548,683 |
1/31/25 |
$1,590,608 |
$2,025,062 |
$1,593,204 |
2/28/25 |
$1,590,608 |
$1,998,639 |
$1,585,698 |
3/31/25 |
$1,539,682 |
$1,886,027 |
$1,534,971 |
4/30/25 |
$1,545,649 |
$1,873,238 |
$1,545,331 |
5/31/25 |
$1,624,424 |
$1,991,148 |
$1,621,625 |
6/30/25 |
$1,692,511 |
$2,092,403 |
$1,685,800 |
|
|
| Average Annual Return [Table Text Block] |
Class/Index Name |
1 Year |
5 Years |
Since Inception 12/31/19 |
Institutional Class |
15.21% |
12.60% |
10.04% |
S&P 500 Index |
15.16% |
16.64% |
14.37% |
S&P Target Date 2060 Index |
14.36% |
12.55% |
9.96% | |
|
| No Deduction of Taxes [Text Block] |
Returns shown do not reflect the deduction of taxes that a shareholder would pay on Fund distributions or the redemption of Fund shares.
|
|
| Performance Table Market Index Changed [Text Block] |
Differences in the Fund’s performance versus an index and related attribution information with respect to particular categories of securities or individual positions may be attributable, in part, to differences in the pricing methodologies used by the Fund and the index.
|
|
| Updated Performance Information Location [Text Block] |
For performance current to the most recent month-end, visit www.pimco.com/literature or via 888.87.PIMCO (888.877.4626).
|
|
| AssetsNet |
$ 205,871,000
|
|
| Holdings Count | Holding |
22
|
|
| Advisory Fees Paid, Amount |
$ 53,000
|
|
| InvestmentCompanyPortfolioTurnover |
18.00%
|
|
| Additional Fund Statistics [Text Block] |
Key Fund StatisticsFootnote Reference† (as of the end of the reporting period)
Total Net Assets |
$205,871 |
# of Portfolio Holdings |
22 |
Portfolio Turnover Rate |
18% |
Total Net Advisory Fees Paid During the Reporting Period |
$53 |
| Footnote |
Description |
Footnote† |
Dollar amounts displayed in 000's | |
|
| Holdings [Text Block] |
Security Type Breakdown (% of Net Asset Value)Footnote Reference*
Mutual Funds |
89.8% |
Short-Term Instruments |
0.4% |
Affiliated Investments |
11.2% |
Financial Derivative Instruments |
0.0%Footnote Reference^ |
Other Assets and Liabilities, Net |
(1.4%) |
Total |
100.0% |
| Footnote |
Description |
Footnote* |
% of Net Asset Value includes derivatives instruments, if any, valued at the value used for determining the Fund's net asset value. The notional exposure of such derivatives investments therefore may be greater than what is depicted. |
Footnote^ |
Rounded value of investments is less than 0.1% of net assets. | |
|
| Largest Holdings [Text Block] |
Top Holdings (% of Net Asset Value)Footnote Reference**
Vanguard Institutional Index Fund 'Institutional' |
52.2% |
Vanguard Developed Markets Index Fund 'Institutional' |
25.0% |
Vanguard Emerging Markets Stock Index Fund 'Institutional' |
8.4% |
Vanguard Small-Cap Index Fund 'Institutional' |
4.2% |
PIMCO Total Return Fund |
1.3% |
PIMCO Real Return Fund |
1.1% |
PIMCO Long-Term Real Return Fund |
0.8% |
PIMCO Long-Term U.S. Government Fund |
0.7% |
PIMCO Income Fund |
0.6% |
PIMCO Emerging Markets Local Currency and Bond Fund |
0.3% |
| Footnote |
Description |
Footnote** |
Short-Term Instruments/Foreign Currency Contracts are not included in Top Holdings table. | |
|
| Material Fund Change [Text Block] |
This is a summary of certain changes and planned changes of the Fund since the beginning of the reporting period. For more information, you may refer to the Fund's next prospectus, which we expect to be available by October 31, 2025 or upon request at 888.87.PIMCO (888.877.4626). Change to REALPATH Blend Glide Path. Effective February 28, 2025, the Fund’s REALPATH Blend Glide Path, which forms the basis of the Fund’s long-term asset allocations, was changed based on data relating to risk metrics, long-term market trends, correlation of asset types and actuarial assumptions of life expectancy and retirement. |
|
| Material Fund Change Objectives [Text Block] |
Change to REALPATH Blend Glide Path. Effective February 28, 2025, the Fund’s REALPATH Blend Glide Path, which forms the basis of the Fund’s long-term asset allocations, was changed based on data relating to risk metrics, long-term market trends, correlation of asset types and actuarial assumptions of life expectancy and retirement.
|
|
| Summary of Change Legend [Text Block] |
This is a summary of certain changes and planned changes of the Fund since the beginning of the reporting period. For more information, you may refer to the Fund's next prospectus, which we expect to be available by October 31, 2025 or upon request at 888.87.PIMCO (888.877.4626).
|
|
| C000238901 |
|
|
| Shareholder Report [Line Items] |
|
|
| Fund Name |
PIMCO REALPATH<sup style="box-sizing: border-box; color: rgb(0, 0, 0); display: inline; flex-wrap: nowrap; font-size: 19px; font-weight: 700; grid-area: auto; line-height: 0px; margin: 0px; overflow: visible; position: relative; text-align: left; text-align-last: auto; white-space-collapse: preserve-breaks;">®</sup> Blend 2065 Fund
|
|
| Class Name |
Class A
|
|
| Trading Symbol |
PBLLX
|
|
| Annual or Semi-Annual Statement [Text Block] |
This annual shareholder report contains important information about the PIMCO REALPATH® Blend 2065 Fund (the "Fund") for the period of July 1, 2024 to June 30, 2025 (the "reporting period").
|
|
| Shareholder Report Annual or Semi-Annual |
Annual Shareholder Report
|
|
| Additional Information [Text Block] |
You can find additional information about the Fund at www.pimco.com/literature. You can also request this information by contacting us at 888.87.PIMCO (888.877.4626).
|
|
| Material Fund Change Notice [Text Block] |
This report describes changes to the Fund that occurred during the reporting period.
|
|
| Additional Information Website |
www.pimco.com/literature
|
|
| Expenses [Text Block] |
What were the Fund costs for the reporting period?(based on a hypothetical $10,000 investment)
Class Name |
Cost of a $10,000 investment |
Costs paid as a percentage of a $10,000 investment |
Class A |
$54 |
0.50% | |
|
| Expenses Paid, Amount |
$ 54
|
|
| Expense Ratio, Percent |
0.50%
|
|
| Factors Affecting Performance [Text Block] |
How did the Fund perform during the reporting period and what affected its performance?The following affected performance (on a gross basis) during the reporting period: Exposure to U.S. large cap equities contributed to absolute performance, as U.S. large cap equities posted positive returns. Exposure to global equities contributed to absolute performance, as global equities posted positive returns. Exposure to emerging market equities contributed to absolute performance, as emerging market equities posted positive returns. There were no material detractors from absolute performance for this Fund.
|
|
| Performance Past Does Not Indicate Future [Text] |
Performance quoted represents past performance. Past performance is not a guarantee or a reliable indicator of future results.
|
|
| Line Graph [Table Text Block] |
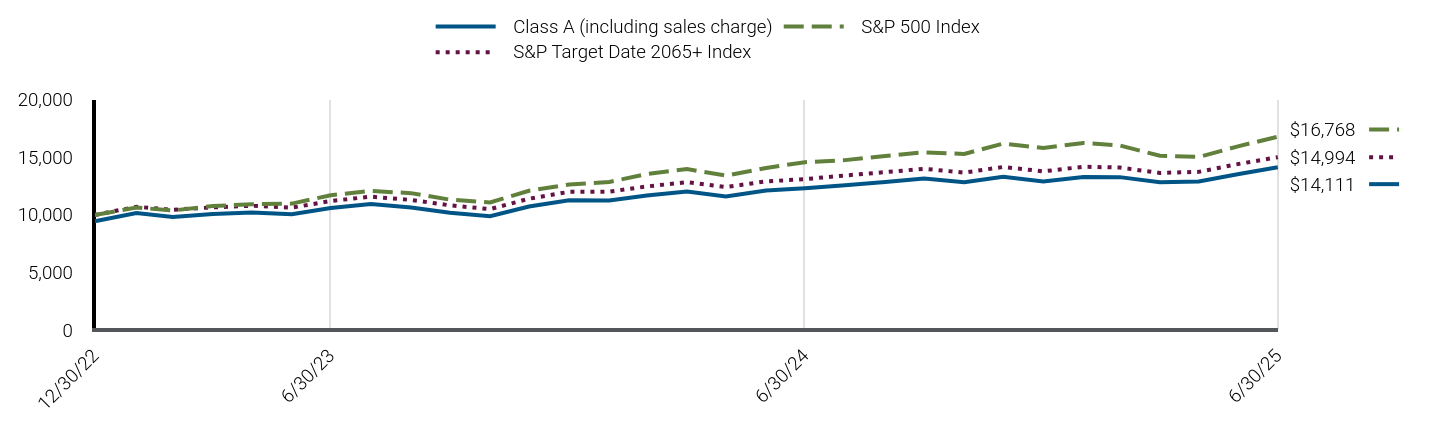
|
Class A (including sales charge) |
S&P 500 Index |
S&P Target Date 2065+ Index |
12/30/22 |
$9,452 |
$10,000 |
$10,000 |
12/31/22 |
$9,452 |
$10,000 |
$10,000 |
1/31/23 |
$10,142 |
$10,628 |
$10,694 |
2/28/23 |
$9,811 |
$10,369 |
$10,429 |
3/31/23 |
$10,056 |
$10,750 |
$10,641 |
4/30/23 |
$10,198 |
$10,917 |
$10,777 |
5/31/23 |
$10,046 |
$10,965 |
$10,613 |
6/30/23 |
$10,585 |
$11,689 |
$11,192 |
7/31/23 |
$10,935 |
$12,065 |
$11,570 |
8/31/23 |
$10,623 |
$11,873 |
$11,280 |
9/30/23 |
$10,176 |
$11,307 |
$10,816 |
10/31/23 |
$9,873 |
$11,069 |
$10,484 |
11/30/23 |
$10,716 |
$12,080 |
$11,387 |
12/31/23 |
$11,255 |
$12,629 |
$11,984 |
1/31/24 |
$11,226 |
$12,841 |
$12,003 |
2/29/24 |
$11,676 |
$13,527 |
$12,453 |
3/31/24 |
$12,021 |
$13,962 |
$12,823 |
4/30/24 |
$11,590 |
$13,392 |
$12,399 |
5/31/24 |
$12,098 |
$14,056 |
$12,893 |
6/30/24 |
$12,289 |
$14,560 |
$13,088 |
7/31/24 |
$12,558 |
$14,737 |
$13,402 |
8/31/24 |
$12,847 |
$15,095 |
$13,695 |
9/30/24 |
$13,136 |
$15,417 |
$13,984 |
10/31/24 |
$12,818 |
$15,277 |
$13,653 |
11/30/24 |
$13,290 |
$16,174 |
$14,144 |
12/31/24 |
$12,894 |
$15,788 |
$13,762 |
1/31/25 |
$13,272 |
$16,228 |
$14,162 |
2/28/25 |
$13,262 |
$16,016 |
$14,093 |
3/31/25 |
$12,826 |
$15,114 |
$13,628 |
4/30/25 |
$12,885 |
$15,011 |
$13,721 |
5/31/25 |
$13,541 |
$15,956 |
$14,412 |
6/30/25 |
$14,111 |
$16,768 |
$14,994 |
|
|
| Average Annual Return [Table Text Block] |
Class/Index Name |
1 Year |
Since Inception 12/30/22 |
Class A (excluding sales charge) |
14.82% |
17.39% |
Class A (including sales charge) |
8.53% |
14.78% |
S&P 500 Index |
15.16% |
22.98% |
S&P Target Date 2065+ Index |
14.57% |
17.60% | |
|
| No Deduction of Taxes [Text Block] |
Returns shown do not reflect the deduction of taxes that a shareholder would pay on Fund distributions or the redemption of Fund shares.
|
|
| Performance Table Market Index Changed [Text Block] |
Differences in the Fund’s performance versus an index and related attribution information with respect to particular categories of securities or individual positions may be attributable, in part, to differences in the pricing methodologies used by the Fund and the index.
|
|
| Updated Performance Information Location [Text Block] |
For performance current to the most recent month-end, visit www.pimco.com/literature or via 888.87.PIMCO (888.877.4626).
|
|
| AssetsNet |
$ 39,537,000
|
|
| Holdings Count | Holding |
19
|
|
| Advisory Fees Paid, Amount |
$ 8,000
|
|
| InvestmentCompanyPortfolioTurnover |
28.00%
|
|
| Additional Fund Statistics [Text Block] |
Key Fund StatisticsFootnote Reference† (as of the end of the reporting period)
Total Net Assets |
$39,537 |
# of Portfolio Holdings |
19 |
Portfolio Turnover Rate |
28% |
Total Net Advisory Fees Paid During the Reporting Period |
$8 |
| Footnote |
Description |
Footnote† |
Dollar amounts displayed in 000's | |
|
| Holdings [Text Block] |
Security Type Breakdown (% of Net Asset Value)Footnote Reference*
Mutual Funds |
95.2% |
Short-Term Instruments |
0.4% |
Affiliated Investments |
9.7% |
Financial Derivative Instruments |
(0.1%) |
Other Assets and Liabilities, Net |
(5.2%) |
Total |
100.0% |
| Footnote |
Description |
Footnote* |
% of Net Asset Value includes derivatives instruments, if any, valued at the value used for determining the Fund's net asset value. The notional exposure of such derivatives investments therefore may be greater than what is depicted. | |
|
| Largest Holdings [Text Block] |
Top Holdings (% of Net Asset Value)Footnote Reference**
Vanguard Institutional Index Fund 'Institutional' |
55.5% |
Vanguard Developed Markets Index Fund 'Institutional' |
26.1% |
Vanguard Emerging Markets Stock Index Fund 'Admiral' |
8.9% |
Vanguard Small-Cap Index Fund 'Admiral' |
4.7% |
PIMCO Real Return Fund |
1.1% |
PIMCO Long-Term Real Return Fund |
0.7% |
PIMCO Total Return Fund |
0.7% |
PIMCO Long-Term U.S. Government Fund |
0.7% |
PIMCO Emerging Markets Local Currency and Bond Fund |
0.3% |
PIMCO Income Fund |
0.3% |
| Footnote |
Description |
Footnote** |
Short-Term Instruments/Foreign Currency Contracts are not included in Top Holdings table. | |
|
| Material Fund Change [Text Block] |
This is a summary of certain changes and planned changes of the Fund since the beginning of the reporting period. For more information, you may refer to the Fund's next prospectus, which we expect to be available by October 31, 2025 or upon request at 888.87.PIMCO (888.877.4626). Change to REALPATH Blend Glide Path. Effective February 28, 2025, the Fund’s REALPATH Blend Glide Path, which forms the basis of the Fund’s long-term asset allocations, was changed based on data relating to risk metrics, long-term market trends, correlation of asset types and actuarial assumptions of life expectancy and retirement. |
|
| Material Fund Change Objectives [Text Block] |
Change to REALPATH Blend Glide Path. Effective February 28, 2025, the Fund’s REALPATH Blend Glide Path, which forms the basis of the Fund’s long-term asset allocations, was changed based on data relating to risk metrics, long-term market trends, correlation of asset types and actuarial assumptions of life expectancy and retirement.
|
|
| Summary of Change Legend [Text Block] |
This is a summary of certain changes and planned changes of the Fund since the beginning of the reporting period. For more information, you may refer to the Fund's next prospectus, which we expect to be available by October 31, 2025 or upon request at 888.87.PIMCO (888.877.4626).
|
|
| C000238902 |
|
|
| Shareholder Report [Line Items] |
|
|
| Fund Name |
PIMCO REALPATH<sup style="box-sizing: border-box; color: rgb(0, 0, 0); display: inline; flex-wrap: nowrap; font-size: 19px; font-weight: 700; grid-area: auto; line-height: 0px; margin: 0px; overflow: visible; position: relative; text-align: left; text-align-last: auto; white-space-collapse: preserve-breaks;">®</sup> Blend 2065 Fund
|
|
| Class Name |
Institutional Class
|
|
| Trading Symbol |
PBLIX
|
|
| Annual or Semi-Annual Statement [Text Block] |
This annual shareholder report contains important information about the PIMCO REALPATH® Blend 2065 Fund (the "Fund") for the period of July 1, 2024 to June 30, 2025 (the "reporting period").
|
|
| Shareholder Report Annual or Semi-Annual |
Annual Shareholder Report
|
|
| Additional Information [Text Block] |
You can find additional information about the Fund at www.pimco.com/literature. You can also request this information by contacting us at 888.87.PIMCO (888.877.4626).
|
|
| Material Fund Change Notice [Text Block] |
This report describes changes to the Fund that occurred during the reporting period.
|
|
| Additional Information Website |
www.pimco.com/literature
|
|
| Expenses [Text Block] |
What were the Fund costs for the reporting period?(based on a hypothetical $10,000 investment)
Class Name |
Cost of a $10,000 investment |
Costs paid as a percentage of a $10,000 investment |
Institutional Class |
$5 |
0.05% | |
|
| Expenses Paid, Amount |
$ 5
|
|
| Expense Ratio, Percent |
0.05%
|
|
| Factors Affecting Performance [Text Block] |
How did the Fund perform during the reporting period and what affected its performance?The following affected performance (on a gross basis) during the reporting period: Exposure to U.S. large cap equities contributed to absolute performance, as U.S. large cap equities posted positive returns. Exposure to global equities contributed to absolute performance, as global equities posted positive returns. Exposure to emerging market equities contributed to absolute performance, as emerging market equities posted positive returns. There were no material detractors from absolute performance for this Fund.
|
|
| Performance Past Does Not Indicate Future [Text] |
Performance quoted represents past performance. Past performance is not a guarantee or a reliable indicator of future results.
|
|
| Line Graph [Table Text Block] |
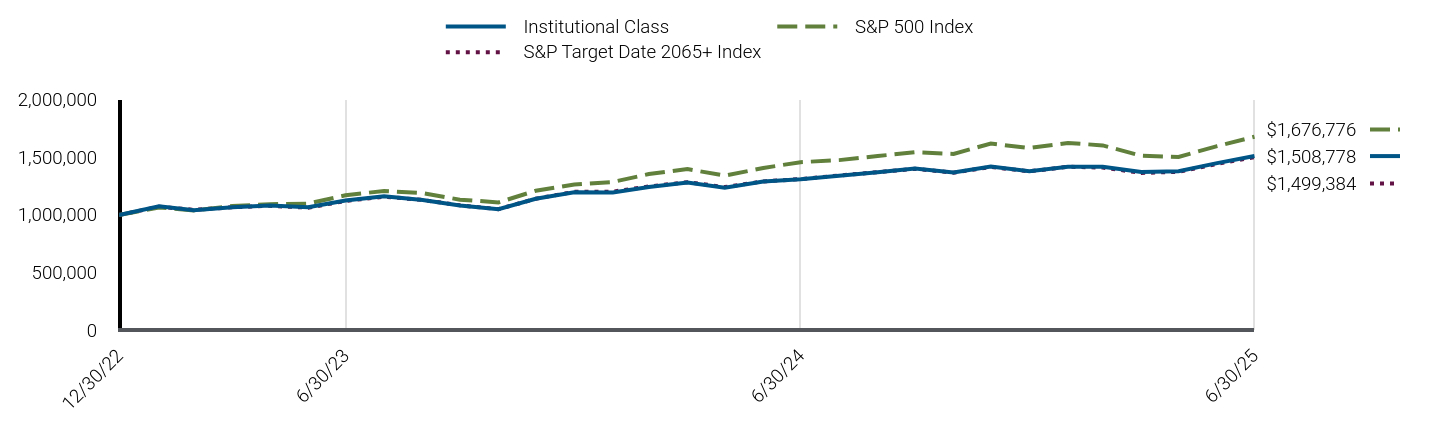
|
Institutional Class |
S&P 500 Index |
S&P Target Date 2065+ Index |
12/30/22 |
$1,000,000 |
$1,000,000 |
$1,000,000 |
12/31/22 |
$1,000,000 |
$1,000,000 |
$1,000,000 |
1/31/23 |
$1,074,000 |
$1,062,834 |
$1,069,371 |
2/28/23 |
$1,039,000 |
$1,036,902 |
$1,042,922 |
3/31/23 |
$1,065,771 |
$1,074,971 |
$1,064,104 |
4/30/23 |
$1,079,794 |
$1,091,750 |
$1,077,664 |
5/31/23 |
$1,064,769 |
$1,096,495 |
$1,061,302 |
6/30/23 |
$1,122,866 |
$1,168,946 |
$1,119,242 |
7/31/23 |
$1,159,927 |
$1,206,499 |
$1,157,010 |
8/31/23 |
$1,127,874 |
$1,187,289 |
$1,127,983 |
9/30/23 |
$1,080,337 |
$1,130,682 |
$1,081,587 |
10/31/23 |
$1,048,208 |
$1,106,907 |
$1,048,414 |
11/30/23 |
$1,138,571 |
$1,207,996 |
$1,138,742 |
12/31/23 |
$1,195,719 |
$1,262,876 |
$1,198,363 |
1/31/24 |
$1,192,674 |
$1,284,098 |
$1,200,269 |
2/29/24 |
$1,241,396 |
$1,352,663 |
$1,245,321 |
3/31/24 |
$1,279,266 |
$1,396,184 |
$1,282,304 |
4/30/24 |
$1,233,432 |
$1,339,158 |
$1,239,941 |
5/31/24 |
$1,287,414 |
$1,405,560 |
$1,289,252 |
6/30/24 |
$1,308,033 |
$1,455,994 |
$1,308,753 |
7/31/24 |
$1,337,691 |
$1,473,717 |
$1,340,244 |
8/31/24 |
$1,369,395 |
$1,509,464 |
$1,369,494 |
9/30/24 |
$1,400,326 |
$1,541,702 |
$1,398,408 |
10/31/24 |
$1,367,522 |
$1,527,721 |
$1,365,348 |
11/30/24 |
$1,417,753 |
$1,617,400 |
$1,414,434 |
12/31/24 |
$1,376,367 |
$1,578,844 |
$1,376,219 |
1/31/25 |
$1,416,568 |
$1,622,811 |
$1,416,227 |
2/28/25 |
$1,416,568 |
$1,601,636 |
$1,409,279 |
3/31/25 |
$1,370,318 |
$1,511,393 |
$1,362,770 |
4/30/25 |
$1,377,737 |
$1,501,145 |
$1,372,072 |
5/31/25 |
$1,447,683 |
$1,595,634 |
$1,441,219 |
6/30/25 |
$1,508,778 |
$1,676,776 |
$1,499,384 |
|
|
| Average Annual Return [Table Text Block] |
Class/Index Name |
1 Year |
Since Inception 12/30/22 |
Institutional Class |
15.35% |
17.89% |
S&P 500 Index |
15.16% |
22.98% |
S&P Target Date 2065+ Index |
14.57% |
17.60% | |
|
| No Deduction of Taxes [Text Block] |
Returns shown do not reflect the deduction of taxes that a shareholder would pay on Fund distributions or the redemption of Fund shares.
|
|
| Performance Table Market Index Changed [Text Block] |
Differences in the Fund’s performance versus an index and related attribution information with respect to particular categories of securities or individual positions may be attributable, in part, to differences in the pricing methodologies used by the Fund and the index.
|
|
| Updated Performance Information Location [Text Block] |
For performance current to the most recent month-end, visit www.pimco.com/literature or via 888.87.PIMCO (888.877.4626).
|
|
| AssetsNet |
$ 39,537,000
|
|
| Holdings Count | Holding |
19
|
|
| Advisory Fees Paid, Amount |
$ 8,000
|
|
| InvestmentCompanyPortfolioTurnover |
28.00%
|
|
| Additional Fund Statistics [Text Block] |
Key Fund StatisticsFootnote Reference† (as of the end of the reporting period)
Total Net Assets |
$39,537 |
# of Portfolio Holdings |
19 |
Portfolio Turnover Rate |
28% |
Total Net Advisory Fees Paid During the Reporting Period |
$8 |
| Footnote |
Description |
Footnote† |
Dollar amounts displayed in 000's | |
|
| Holdings [Text Block] |
Security Type Breakdown (% of Net Asset Value)Footnote Reference*
Mutual Funds |
95.2% |
Short-Term Instruments |
0.4% |
Affiliated Investments |
9.7% |
Financial Derivative Instruments |
(0.1%) |
Other Assets and Liabilities, Net |
(5.2%) |
Total |
100.0% |
| Footnote |
Description |
Footnote* |
% of Net Asset Value includes derivatives instruments, if any, valued at the value used for determining the Fund's net asset value. The notional exposure of such derivatives investments therefore may be greater than what is depicted. | |
|
| Largest Holdings [Text Block] |
Top Holdings (% of Net Asset Value)Footnote Reference**
Vanguard Institutional Index Fund 'Institutional' |
55.5% |
Vanguard Developed Markets Index Fund 'Institutional' |
26.1% |
Vanguard Emerging Markets Stock Index Fund 'Admiral' |
8.9% |
Vanguard Small-Cap Index Fund 'Admiral' |
4.7% |
PIMCO Real Return Fund |
1.1% |
PIMCO Long-Term Real Return Fund |
0.7% |
PIMCO Total Return Fund |
0.7% |
PIMCO Long-Term U.S. Government Fund |
0.7% |
PIMCO Emerging Markets Local Currency and Bond Fund |
0.3% |
PIMCO Income Fund |
0.3% |
| Footnote |
Description |
Footnote** |
Short-Term Instruments/Foreign Currency Contracts are not included in Top Holdings table. | |
|
| Material Fund Change [Text Block] |
This is a summary of certain changes and planned changes of the Fund since the beginning of the reporting period. For more information, you may refer to the Fund's next prospectus, which we expect to be available by October 31, 2025 or upon request at 888.87.PIMCO (888.877.4626). Change to REALPATH Blend Glide Path. Effective February 28, 2025, the Fund’s REALPATH Blend Glide Path, which forms the basis of the Fund’s long-term asset allocations, was changed based on data relating to risk metrics, long-term market trends, correlation of asset types and actuarial assumptions of life expectancy and retirement. |
|
| Material Fund Change Objectives [Text Block] |
Change to REALPATH Blend Glide Path. Effective February 28, 2025, the Fund’s REALPATH Blend Glide Path, which forms the basis of the Fund’s long-term asset allocations, was changed based on data relating to risk metrics, long-term market trends, correlation of asset types and actuarial assumptions of life expectancy and retirement.
|
|
| Summary of Change Legend [Text Block] |
This is a summary of certain changes and planned changes of the Fund since the beginning of the reporting period. For more information, you may refer to the Fund's next prospectus, which we expect to be available by October 31, 2025 or upon request at 888.87.PIMCO (888.877.4626).
|
|
| C000255110 |
|
|
| Shareholder Report [Line Items] |
|
|
| Fund Name |
PIMCO REALPATH<sup style="box-sizing: border-box; color: rgb(0, 0, 0); display: inline; flex-wrap: nowrap; font-size: 19px; font-weight: 700; grid-area: auto; line-height: 0px; margin: 0px; overflow: visible; position: relative; text-align: left; text-align-last: auto; white-space-collapse: preserve-breaks;">®</sup> Blend 2070 Fund
|
|
| Class Name |
Class A
|
|
| Trading Symbol |
PAJEX
|
|
| Annual or Semi-Annual Statement [Text Block] |
This annual shareholder report contains important information about the PIMCO REALPATH® Blend 2070 Fund (the "Fund") for the period of December 31, 2024 to June 30, 2025 (the "reporting period").
|
|
| Shareholder Report Annual or Semi-Annual |
Annual Shareholder Report
|
|
| Additional Information [Text Block] |
You can find additional information about the Fund at www.pimco.com/literature. You can also request this information by contacting us at 888.87.PIMCO (888.877.4626).
|
|
| Material Fund Change Notice [Text Block] |
This report describes changes to the Fund that occurred during the reporting period.
|
|
| Additional Information Website |
www.pimco.com/literature
|
|
| Expenses [Text Block] |
What were the Fund costs for the reporting period?(based on a hypothetical $10,000 investment)
Class Name |
Cost of a $10,000 investment |
Costs paid as a percentage of a $10,000 investment |
Class A |
$26 |
0.50%Footnote Reference1 |
| Footnote |
Description |
Footnote1 |
Annualized. The Fund commenced operations on December 31, 2024. | |
|
| Expenses Paid, Amount |
$ 26
|
|
| Expense Ratio, Percent |
0.50%
|
[1] |
| Factors Affecting Performance [Text Block] |
How did the Fund perform during the reporting period and what affected its performance?The following affected performance (on a gross basis) during the reporting period: Exposure to global equities contributed to absolute performance, as global equities posted positive returns. Exposure to U.S. large cap equities contributed to absolute performance, as U.S. large cap equities posted positive returns. Exposure to emerging market equities contributed to absolute performance, as emerging market equities posted positive returns. There were no material detractors from absolute performance for this Fund.
|
|
| Performance Past Does Not Indicate Future [Text] |
Performance quoted represents past performance. Past performance is not a guarantee or a reliable indicator of future results.
|
|
| Line Graph [Table Text Block] |
|
Class A (including sales charge) |
S&P 500 Index |
S&P Target Date 2065+ Index |
12/31/24 |
$9,452 |
$10,000 |
$10,000 |
1/31/25 |
$9,716 |
$10,278 |
$10,291 |
2/28/25 |
$9,716 |
$10,144 |
$10,240 |
3/31/25 |
$9,395 |
$9,573 |
$9,902 |
4/30/25 |
$9,414 |
$9,508 |
$9,970 |
5/31/25 |
$9,896 |
$10,106 |
$10,472 |
6/30/25 |
$10,321 |
$10,620 |
$10,895 |
|
|
| Average Annual Return [Table Text Block] |
Class/Index Name |
Since Inception 12/31/24 |
Class A (excluding sales charge) |
9.20% |
Class A (including sales charge) |
3.21% |
S&P 500 Index |
6.20% |
S&P Target Date 2065+ Index |
8.95% | |
|
| Performance Inception Date |
Dec. 31, 2024
|
|
| No Deduction of Taxes [Text Block] |
Returns shown do not reflect the deduction of taxes that a shareholder would pay on Fund distributions or the redemption of Fund shares.
|
|
| Performance Table Market Index Changed [Text Block] |
Differences in the Fund’s performance versus an index and related attribution information with respect to particular categories of securities or individual positions may be attributable, in part, to differences in the pricing methodologies used by the Fund and the index.
|
|
| Updated Performance Information Location [Text Block] |
For performance current to the most recent month-end, visit www.pimco.com/literature or via 888.87.PIMCO (888.877.4626).
|
|
| AssetsNet |
$ 3,350,000
|
|
| Holdings Count | Holding |
14
|
|
| Advisory Fees Paid, Amount |
$ 1,000
|
|
| InvestmentCompanyPortfolioTurnover |
23.00%
|
|
| Additional Fund Statistics [Text Block] |
Key Fund StatisticsFootnote Reference† (as of the end of the reporting period)
Total Net Assets |
$3,350 |
# of Portfolio Holdings |
14 |
Portfolio Turnover Rate |
23% |
Total Net Advisory Fees Paid During the Reporting Period |
$1 |
| Footnote |
Description |
Footnote† |
Dollar amounts displayed in 000's | |
|
| Holdings [Text Block] |
Security Type Breakdown (% of Net Asset Value)Footnote Reference*
Mutual Funds |
91.4% |
Affiliated Investments |
4.3% |
Financial Derivative Instruments |
0.0%Footnote Reference^ |
Other Assets and Liabilities, Net |
4.3% |
Total |
100.0% |
| Footnote |
Description |
Footnote* |
% of Net Asset Value includes derivatives instruments, if any, valued at the value used for determining the Fund's net asset value. The notional exposure of such derivatives investments therefore may be greater than what is depicted. |
Footnote^ |
Rounded value of investments is less than 0.1% of net assets. | |
|
| Largest Holdings [Text Block] |
Top Holdings (% of Net Asset Value)Footnote Reference**
Vanguard S&P 500 ETF |
53.4% |
Vanguard Developed Markets Index Fund 'Admiral' |
25.0% |
Vanguard Emerging Markets Stock Index Fund 'Admiral' |
8.4% |
Vanguard Small-Cap Index Fund 'Admiral' |
4.5% |
PIMCO Real Return Fund |
1.1% |
PIMCO Long-Term Real Return Fund |
0.8% |
PIMCO Long-Term U.S. Government Fund |
0.7% |
PIMCO Total Return Fund |
0.7% |
PIMCO Emerging Markets Local Currency and Bond Fund |
0.3% |
PIMCO Income Fund |
0.3% |
| Footnote |
Description |
Footnote** |
Short-Term Instruments/Foreign Currency Contracts are not included in Top Holdings table. | |
|
| Material Fund Change [Text Block] |
This is a summary of certain changes and planned changes of the Fund since the beginning of the reporting period. For more information, you may refer to the Fund's next prospectus, which we expect to be available by October 31, 2025 or upon request at 888.87.PIMCO (888.877.4626). Change to REALPATH Blend Glide Path. Effective February 28, 2025, the Fund’s REALPATH Blend Glide Path, which forms the basis of the Fund’s long-term asset allocations, was changed based on data relating to risk metrics, long-term market trends, correlation of asset types and actuarial assumptions of life expectancy and retirement. |
|
| Material Fund Change Objectives [Text Block] |
Change to REALPATH Blend Glide Path. Effective February 28, 2025, the Fund’s REALPATH Blend Glide Path, which forms the basis of the Fund’s long-term asset allocations, was changed based on data relating to risk metrics, long-term market trends, correlation of asset types and actuarial assumptions of life expectancy and retirement.
|
|
| Summary of Change Legend [Text Block] |
This is a summary of certain changes and planned changes of the Fund since the beginning of the reporting period. For more information, you may refer to the Fund's next prospectus, which we expect to be available by October 31, 2025 or upon request at 888.87.PIMCO (888.877.4626).
|
|
| C000255109 |
|
|
| Shareholder Report [Line Items] |
|
|
| Fund Name |
PIMCO REALPATH<sup style="box-sizing: border-box; color: rgb(0, 0, 0); display: inline; flex-wrap: nowrap; font-size: 19px; font-weight: 700; grid-area: auto; line-height: 0px; margin: 0px; overflow: visible; position: relative; text-align: left; text-align-last: auto; white-space-collapse: preserve-breaks;">®</sup> Blend 2070 Fund
|
|
| Class Name |
Institutional Class
|
|
| Trading Symbol |
PAJDX
|
|
| Annual or Semi-Annual Statement [Text Block] |
This annual shareholder report contains important information about the PIMCO REALPATH® Blend 2070 Fund (the "Fund") for the period of December 31, 2024 to June 30, 2025 (the "reporting period").
|
|
| Shareholder Report Annual or Semi-Annual |
Annual Shareholder Report
|
|
| Additional Information [Text Block] |
You can find additional information about the Fund at www.pimco.com/literature. You can also request this information by contacting us at 888.87.PIMCO (888.877.4626).
|
|
| Material Fund Change Notice [Text Block] |
This report describes changes to the Fund that occurred during the reporting period.
|
|
| Additional Information Website |
www.pimco.com/literature
|
|
| Expenses [Text Block] |
What were the Fund costs for the reporting period?(based on a hypothetical $10,000 investment)
Class Name |
Cost of a $10,000 investment |
Costs paid as a percentage of a $10,000 investment |
Institutional Class |
$3 |
0.05%Footnote Reference1 |
| Footnote |
Description |
Footnote1 |
Annualized. The Fund commenced operations on December 31, 2024. | |
|
| Expenses Paid, Amount |
$ 3
|
|
| Expense Ratio, Percent |
0.05%
|
[2] |
| Factors Affecting Performance [Text Block] |
How did the Fund perform during the reporting period and what affected its performance?The following affected performance (on a gross basis) during the reporting period: Exposure to global equities contributed to absolute performance, as global equities posted positive returns. Exposure to U.S. large cap equities contributed to absolute performance, as U.S. large cap equities posted positive returns. Exposure to emerging market equities contributed to absolute performance, as emerging market equities posted positive returns. There were no material detractors from absolute performance for this Fund.
|
|
| Performance Past Does Not Indicate Future [Text] |
Performance quoted represents past performance. Past performance is not a guarantee or a reliable indicator of future results.
|
|
| Line Graph [Table Text Block] |
|
Institutional Class |
S&P 500 Index |
S&P Target Date 2065+ Index |
12/31/24 |
$1,000,000 |
$1,000,000 |
$1,000,000 |
1/31/25 |
$1,029,000 |
$1,027,847 |
$1,029,072 |
2/28/25 |
$1,029,000 |
$1,014,436 |
$1,024,023 |
3/31/25 |
$995,000 |
$957,278 |
$990,228 |
4/30/25 |
$998,000 |
$950,787 |
$996,987 |
5/31/25 |
$1,049,000 |
$1,010,634 |
$1,047,231 |
6/30/25 |
$1,094,000 |
$1,062,027 |
$1,089,495 |
|
|
| Average Annual Return [Table Text Block] |
Class/Index Name |
Since Inception 12/31/24 |
Institutional Class |
9.40% |
S&P 500 Index |
6.20% |
S&P Target Date 2065+ Index |
8.95% | |
|
| Performance Inception Date |
Dec. 31, 2024
|
|
| No Deduction of Taxes [Text Block] |
Returns shown do not reflect the deduction of taxes that a shareholder would pay on Fund distributions or the redemption of Fund shares.
|
|
| Performance Table Market Index Changed [Text Block] |
Differences in the Fund’s performance versus an index and related attribution information with respect to particular categories of securities or individual positions may be attributable, in part, to differences in the pricing methodologies used by the Fund and the index.
|
|
| Updated Performance Information Location [Text Block] |
For performance current to the most recent month-end, visit www.pimco.com/literature or via 888.87.PIMCO (888.877.4626).
|
|
| AssetsNet |
$ 3,350,000
|
|
| Holdings Count | Holding |
14
|
|
| Advisory Fees Paid, Amount |
$ 1,000
|
|
| InvestmentCompanyPortfolioTurnover |
23.00%
|
|
| Additional Fund Statistics [Text Block] |
Key Fund StatisticsFootnote Reference† (as of the end of the reporting period)
Total Net Assets |
$3,350 |
# of Portfolio Holdings |
14 |
Portfolio Turnover Rate |
23% |
Total Net Advisory Fees Paid During the Reporting Period |
$1 |
| Footnote |
Description |
Footnote† |
Dollar amounts displayed in 000's | |
|
| Holdings [Text Block] |
Security Type Breakdown (% of Net Asset Value)Footnote Reference*
Mutual Funds |
91.4% |
Affiliated Investments |
4.3% |
Financial Derivative Instruments |
0.0%Footnote Reference^ |
Other Assets and Liabilities, Net |
4.3% |
Total |
100.0% |
| Footnote |
Description |
Footnote* |
% of Net Asset Value includes derivatives instruments, if any, valued at the value used for determining the Fund's net asset value. The notional exposure of such derivatives investments therefore may be greater than what is depicted. |
Footnote^ |
Rounded value of investments is less than 0.1% of net assets. | |
|
| Largest Holdings [Text Block] |
Top Holdings (% of Net Asset Value)Footnote Reference**
Vanguard S&P 500 ETF |
53.4% |
Vanguard Developed Markets Index Fund 'Admiral' |
25.0% |
Vanguard Emerging Markets Stock Index Fund 'Admiral' |
8.4% |
Vanguard Small-Cap Index Fund 'Admiral' |
4.5% |
PIMCO Real Return Fund |
1.1% |
PIMCO Long-Term Real Return Fund |
0.8% |
PIMCO Long-Term U.S. Government Fund |
0.7% |
PIMCO Total Return Fund |
0.7% |
PIMCO Emerging Markets Local Currency and Bond Fund |
0.3% |
PIMCO Income Fund |
0.3% |
| Footnote |
Description |
Footnote** |
Short-Term Instruments/Foreign Currency Contracts are not included in Top Holdings table. | |
|
| Material Fund Change [Text Block] |
This is a summary of certain changes and planned changes of the Fund since the beginning of the reporting period. For more information, you may refer to the Fund's next prospectus, which we expect to be available by October 31, 2025 or upon request at 888.87.PIMCO (888.877.4626). Change to REALPATH Blend Glide Path. Effective February 28, 2025, the Fund’s REALPATH Blend Glide Path, which forms the basis of the Fund’s long-term asset allocations, was changed based on data relating to risk metrics, long-term market trends, correlation of asset types and actuarial assumptions of life expectancy and retirement. |
|
| Material Fund Change Objectives [Text Block] |
Change to REALPATH Blend Glide Path. Effective February 28, 2025, the Fund’s REALPATH Blend Glide Path, which forms the basis of the Fund’s long-term asset allocations, was changed based on data relating to risk metrics, long-term market trends, correlation of asset types and actuarial assumptions of life expectancy and retirement.
|
|
| Summary of Change Legend [Text Block] |
This is a summary of certain changes and planned changes of the Fund since the beginning of the reporting period. For more information, you may refer to the Fund's next prospectus, which we expect to be available by October 31, 2025 or upon request at 888.87.PIMCO (888.877.4626).
|
|
| C000150033 |
|
|
| Shareholder Report [Line Items] |
|
|
| Fund Name |
PIMCO REALPATH<sup style="box-sizing: border-box; color: rgb(0, 0, 0); display: inline; flex-wrap: nowrap; font-size: 19px; font-weight: 700; grid-area: auto; line-height: 0px; margin: 0px; overflow: visible; position: relative; text-align: left; text-align-last: auto; white-space-collapse: preserve-breaks;">®</sup> Blend Income Fund
|
|
| Class Name |
Class A
|
|
| Trading Symbol |
PBRAX
|
|
| Annual or Semi-Annual Statement [Text Block] |
This annual shareholder report contains important information about the PIMCO REALPATH® Blend Income Fund (the "Fund") for the period of July 1, 2024 to June 30, 2025 (the "reporting period").
|
|
| Shareholder Report Annual or Semi-Annual |
Annual Shareholder Report
|
|
| Additional Information [Text Block] |
You can find additional information about the Fund at www.pimco.com/literature. You can also request this information by contacting us at 888.87.PIMCO (888.877.4626).
|
|
| Material Fund Change Notice [Text Block] |
This report describes changes to the Fund that occurred during the reporting period.
|
|
| Additional Information Website |
www.pimco.com/literature
|
|
| Expenses [Text Block] |
What were the Fund costs for the reporting period?(based on a hypothetical $10,000 investment)
Class Name |
Cost of a $10,000 investment |
Costs paid as a percentage of a $10,000 investment |
Class A |
$50 |
0.48% | |
|
| Expenses Paid, Amount |
$ 50
|
|
| Expense Ratio, Percent |
0.48%
|
|
| Factors Affecting Performance [Text Block] |
How did the Fund perform during the reporting period and what affected its performance?The following affected performance (on a gross basis) during the reporting period: Exposure to U.S. large cap equities contributed to absolute performance, as U.S. large cap equities posted positive returns. Exposure to global equities contributed to absolute performance, as global equities posted positive returns. Exposure to U.S. core bonds contributed to absolute performance, as U.S. core bonds posted positive returns. There were no material detractors from absolute performance for this Fund.
|
|
| Performance Past Does Not Indicate Future [Text] |
Performance quoted represents past performance. Past performance is not a guarantee or a reliable indicator of future results.
|
|
| Line Graph [Table Text Block] |
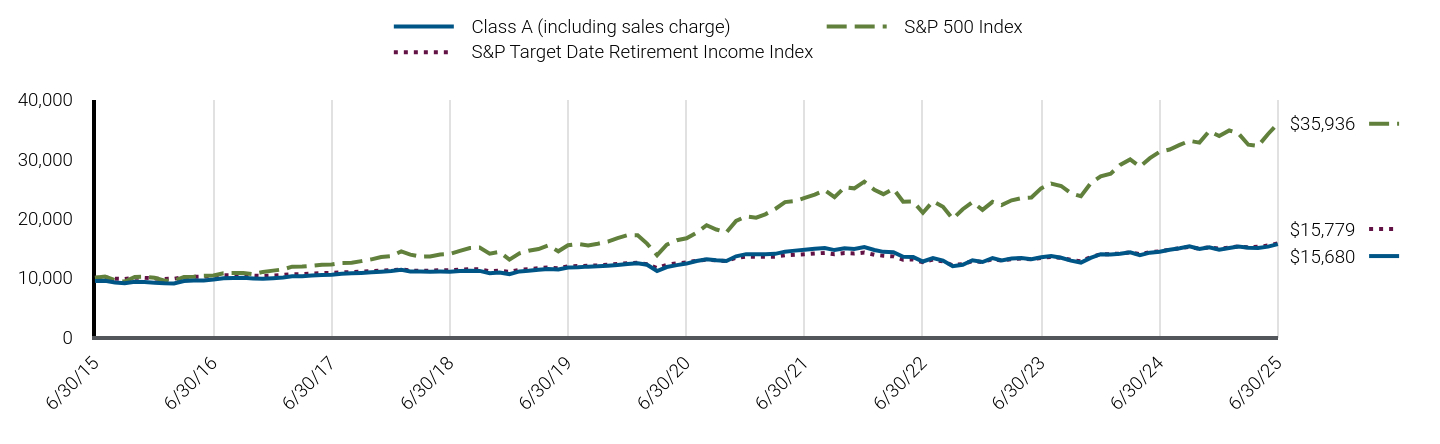
|
Class A (including sales charge) |
S&P 500 Index |
S&P Target Date Retirement Income Index |
6/30/15 |
$9,449 |
$10,000 |
$10,000 |
7/31/15 |
$9,506 |
$10,210 |
$10,080 |
8/31/15 |
$9,221 |
$9,594 |
$9,862 |
9/30/15 |
$9,100 |
$9,356 |
$9,791 |
10/31/15 |
$9,338 |
$10,145 |
$10,015 |
11/30/15 |
$9,281 |
$10,176 |
$9,997 |
12/31/15 |
$9,174 |
$10,015 |
$9,902 |
1/31/16 |
$9,078 |
$9,518 |
$9,813 |
2/29/16 |
$9,068 |
$9,505 |
$9,849 |
3/31/16 |
$9,453 |
$10,150 |
$10,119 |
4/30/16 |
$9,550 |
$10,189 |
$10,170 |
5/31/16 |
$9,569 |
$10,372 |
$10,201 |
6/30/16 |
$9,709 |
$10,399 |
$10,307 |
7/31/16 |
$9,944 |
$10,783 |
$10,451 |
8/31/16 |
$9,963 |
$10,798 |
$10,455 |
9/30/16 |
$10,013 |
$10,800 |
$10,477 |
10/31/16 |
$9,905 |
$10,603 |
$10,373 |
11/30/16 |
$9,836 |
$10,996 |
$10,317 |
12/31/16 |
$9,945 |
$11,213 |
$10,398 |
1/31/17 |
$10,075 |
$11,426 |
$10,482 |
2/28/17 |
$10,263 |
$11,879 |
$10,603 |
3/31/17 |
$10,287 |
$11,893 |
$10,627 |
4/30/17 |
$10,387 |
$12,015 |
$10,716 |
5/31/17 |
$10,497 |
$12,184 |
$10,800 |
6/30/17 |
$10,523 |
$12,260 |
$10,817 |
7/31/17 |
$10,673 |
$12,512 |
$10,924 |
8/31/17 |
$10,753 |
$12,551 |
$10,970 |
9/30/17 |
$10,827 |
$12,810 |
$11,040 |
10/31/17 |
$10,927 |
$13,109 |
$11,119 |
11/30/17 |
$11,027 |
$13,511 |
$11,209 |
12/31/17 |
$11,141 |
$13,661 |
$11,286 |
1/31/18 |
$11,353 |
$14,443 |
$11,421 |
2/28/18 |
$11,080 |
$13,911 |
$11,222 |
3/31/18 |
$11,060 |
$13,557 |
$11,196 |
4/30/18 |
$11,029 |
$13,609 |
$11,197 |
5/31/18 |
$11,050 |
$13,937 |
$11,278 |
6/30/18 |
$11,039 |
$14,023 |
$11,274 |
7/31/18 |
$11,161 |
$14,544 |
$11,383 |
8/31/18 |
$11,192 |
$15,018 |
$11,473 |
9/30/18 |
$11,166 |
$15,104 |
$11,449 |
10/31/18 |
$10,789 |
$14,072 |
$11,115 |
11/30/18 |
$10,881 |
$14,358 |
$11,207 |
12/31/18 |
$10,629 |
$13,062 |
$11,000 |
1/31/19 |
$11,084 |
$14,109 |
$11,359 |
2/28/19 |
$11,197 |
$14,562 |
$11,471 |
3/31/19 |
$11,370 |
$14,845 |
$11,613 |
4/30/19 |
$11,505 |
$15,446 |
$11,752 |
5/31/19 |
$11,391 |
$14,464 |
$11,610 |
6/30/19 |
$11,730 |
$15,483 |
$11,941 |
7/31/19 |
$11,761 |
$15,706 |
$11,982 |
8/31/19 |
$11,886 |
$15,457 |
$12,038 |
9/30/19 |
$11,930 |
$15,746 |
$12,097 |
10/31/19 |
$12,046 |
$16,087 |
$12,215 |
11/30/19 |
$12,161 |
$16,671 |
$12,327 |
12/31/19 |
$12,335 |
$17,175 |
$12,466 |
1/31/20 |
$12,464 |
$17,168 |
$12,535 |
2/29/20 |
$12,206 |
$15,755 |
$12,279 |
3/31/20 |
$11,152 |
$13,809 |
$11,633 |
4/30/20 |
$11,819 |
$15,579 |
$12,193 |
5/31/20 |
$12,141 |
$16,321 |
$12,431 |
6/30/20 |
$12,399 |
$16,645 |
$12,584 |
7/31/20 |
$12,840 |
$17,584 |
$12,883 |
8/31/20 |
$13,141 |
$18,848 |
$13,043 |
9/30/20 |
$12,947 |
$18,132 |
$12,927 |
10/31/20 |
$12,818 |
$17,650 |
$12,830 |
11/30/20 |
$13,626 |
$19,582 |
$13,358 |
12/31/20 |
$13,983 |
$20,334 |
$13,564 |
1/31/21 |
$13,950 |
$20,129 |
$13,524 |
2/28/21 |
$13,972 |
$20,684 |
$13,531 |
3/31/21 |
$14,032 |
$21,590 |
$13,569 |
4/30/21 |
$14,407 |
$22,742 |
$13,797 |
5/31/21 |
$14,578 |
$22,901 |
$13,884 |
6/30/21 |
$14,720 |
$23,436 |
$13,984 |
7/31/21 |
$14,880 |
$23,993 |
$14,101 |
8/31/21 |
$15,029 |
$24,722 |
$14,195 |
9/30/21 |
$14,669 |
$23,572 |
$13,980 |
10/31/21 |
$14,980 |
$25,224 |
$14,176 |
11/30/21 |
$14,853 |
$25,049 |
$14,089 |
12/31/21 |
$15,161 |
$26,172 |
$14,258 |
1/31/22 |
$14,676 |
$24,817 |
$13,876 |
2/28/22 |
$14,368 |
$24,074 |
$13,728 |
3/31/22 |
$14,321 |
$24,968 |
$13,613 |
4/30/22 |
$13,528 |
$22,791 |
$13,057 |
5/31/22 |
$13,492 |
$22,833 |
$13,102 |
6/30/22 |
$12,747 |
$20,948 |
$12,621 |
7/31/22 |
$13,317 |
$22,879 |
$13,063 |
8/31/22 |
$12,901 |
$21,946 |
$12,760 |
9/30/22 |
$11,946 |
$19,925 |
$12,119 |
10/31/22 |
$12,185 |
$21,538 |
$12,324 |
11/30/22 |
$12,948 |
$22,742 |
$12,821 |
12/31/22 |
$12,660 |
$21,432 |
$12,665 |
1/31/23 |
$13,332 |
$22,778 |
$13,136 |
2/28/23 |
$12,941 |
$22,223 |
$12,901 |
3/31/23 |
$13,241 |
$23,038 |
$13,152 |
4/30/23 |
$13,339 |
$23,398 |
$13,255 |
5/31/23 |
$13,130 |
$23,500 |
$13,127 |
6/30/23 |
$13,459 |
$25,053 |
$13,362 |
7/31/23 |
$13,668 |
$25,857 |
$13,528 |
8/31/23 |
$13,373 |
$25,446 |
$13,366 |
9/30/23 |
$12,893 |
$24,232 |
$13,013 |
10/31/23 |
$12,571 |
$23,723 |
$12,781 |
11/30/23 |
$13,364 |
$25,889 |
$13,472 |
12/31/23 |
$13,976 |
$27,066 |
$13,975 |
1/31/24 |
$13,926 |
$27,520 |
$13,991 |
2/29/24 |
$14,039 |
$28,990 |
$14,080 |
3/31/24 |
$14,285 |
$29,923 |
$14,300 |
4/30/24 |
$13,828 |
$28,700 |
$13,977 |
5/31/24 |
$14,234 |
$30,124 |
$14,304 |
6/30/24 |
$14,388 |
$31,204 |
$14,461 |
7/31/24 |
$14,735 |
$31,584 |
$14,743 |
8/31/24 |
$14,991 |
$32,350 |
$14,976 |
9/30/24 |
$15,290 |
$33,041 |
$15,207 |
10/31/24 |
$14,864 |
$32,742 |
$14,895 |
11/30/24 |
$15,148 |
$34,664 |
$15,140 |
12/31/24 |
$14,733 |
$33,837 |
$14,889 |
1/31/25 |
$15,008 |
$34,780 |
$15,105 |
2/28/25 |
$15,284 |
$34,326 |
$15,272 |
3/31/25 |
$15,061 |
$32,392 |
$15,129 |
4/30/25 |
$15,022 |
$32,172 |
$15,213 |
5/31/25 |
$15,245 |
$34,197 |
$15,435 |
6/30/25 |
$15,680 |
$35,936 |
$15,779 |
|
|
| Average Annual Return [Table Text Block] |
Class/Index Name |
1 Year |
5 Years |
10 Years |
Class A (excluding sales charge) |
8.97% |
4.81% |
5.20% |
Class A (including sales charge) |
3.00% |
3.63% |
4.60% |
S&P 500 Index |
15.16% |
16.64% |
13.65% |
S&P Target Date Retirement Income Index |
9.12% |
4.63% |
4.67% | |
|
| No Deduction of Taxes [Text Block] |
Returns shown do not reflect the deduction of taxes that a shareholder would pay on Fund distributions or the redemption of Fund shares.
|
|
| Performance Table Market Index Changed [Text Block] |
Differences in the Fund’s performance versus an index and related attribution information with respect to particular categories of securities or individual positions may be attributable, in part, to differences in the pricing methodologies used by the Fund and the index.
|
|
| Updated Performance Information Location [Text Block] |
For performance current to the most recent month-end, visit www.pimco.com/literature or via 888.87.PIMCO (888.877.4626).
|
|
| AssetsNet |
$ 666,921,000
|
|
| Holdings Count | Holding |
23
|
|
| Advisory Fees Paid, Amount |
$ 49,000
|
|
| InvestmentCompanyPortfolioTurnover |
14.00%
|
|
| Additional Fund Statistics [Text Block] |
Key Fund StatisticsFootnote Reference† (as of the end of the reporting period)
Total Net Assets |
$666,921 |
# of Portfolio Holdings |
23 |
Portfolio Turnover Rate |
14% |
Total Net Advisory Fees Paid During the Reporting Period |
$49 |
| Footnote |
Description |
Footnote† |
Dollar amounts displayed in 000's | |
|
| Holdings [Text Block] |
Security Type Breakdown (% of Net Asset Value)Footnote Reference*
Mutual Funds |
34.6% |
Short-Term Instruments |
0.2% |
Affiliated Investments |
65.4% |
Financial Derivative Instruments |
(0.1%) |
Other Assets and Liabilities, Net |
(0.1%) |
Total |
100.0% |
| Footnote |
Description |
Footnote* |
% of Net Asset Value includes derivatives instruments, if any, valued at the value used for determining the Fund's net asset value. The notional exposure of such derivatives investments therefore may be greater than what is depicted. | |
|
| Largest Holdings [Text Block] |
Top Holdings (% of Net Asset Value)Footnote Reference**
Vanguard Institutional Index Fund 'Institutional Plus' |
22.3% |
PIMCO Total Return Fund |
18.1% |
PIMCO Income Fund |
11.4% |
PIMCO Long-Term Real Return Fund |
9.4% |
Vanguard Developed Markets Index Fund 'Institutional' |
8.5% |
PIMCO Long-Term U.S. Government Fund |
8.2% |
PIMCO Real Return Fund |
6.1% |
PIMCO Emerging Markets Local Currency and Bond Fund |
3.3% |
Vanguard Emerging Markets Stock Index Fund 'Institutional' |
3.0% |
PIMCO International Bond Fund (U.S. Dollar-Hedged) |
2.9% |
| Footnote |
Description |
Footnote** |
Short-Term Instruments/Foreign Currency Contracts are not included in Top Holdings table. | |
|
| Material Fund Change [Text Block] |
This is a summary of certain changes and planned changes of the Fund since the beginning of the reporting period. For more information, you may refer to the Fund's next prospectus, which we expect to be available by October 31, 2025 or upon request at 888.87.PIMCO (888.877.4626). Change to REALPATH Blend Glide Path. Effective February 28, 2025, the Fund’s REALPATH Blend Glide Path, which forms the basis of the Fund’s long-term asset allocations, was changed based on data relating to risk metrics, long-term market trends, correlation of asset types and actuarial assumptions of life expectancy and retirement. Changes to Total Annual Fund Operating Expenses. Annual fund operating expenses increased during the year by 0.11% as a result of the Fund’s exposure to fees and expenses related to the Fund’s investment in underlying funds. Reorganization. On January 10, 2025, the PIMCO REALPATH® Blend 2025 Fund (the "Target Fund") was reorganized with and into the PIMCO REALPATH® Blend Income Fund (the "Acquiring Fund") and holders of the Institutional Class shares of the Target Fund received Institutional Class shares of the Acquiring Fund (the "Reorganization"). As part of the Reorganization, the Acquiring Fund acquired all of the assets and liabilities of the Target Fund. |
|
| Material Fund Change Objectives [Text Block] |
Change to REALPATH Blend Glide Path. Effective February 28, 2025, the Fund’s REALPATH Blend Glide Path, which forms the basis of the Fund’s long-term asset allocations, was changed based on data relating to risk metrics, long-term market trends, correlation of asset types and actuarial assumptions of life expectancy and retirement.
|
|
| Material Fund Change Expenses [Text Block] |
Changes to Total Annual Fund Operating Expenses. Annual fund operating expenses increased during the year by 0.11% as a result of the Fund’s exposure to fees and expenses related to the Fund’s investment in underlying funds.
|
|
| Summary of Change Legend [Text Block] |
This is a summary of certain changes and planned changes of the Fund since the beginning of the reporting period. For more information, you may refer to the Fund's next prospectus, which we expect to be available by October 31, 2025 or upon request at 888.87.PIMCO (888.877.4626).
|
|
| C000150029 |
|
|
| Shareholder Report [Line Items] |
|
|
| Fund Name |
PIMCO REALPATH<sup style="box-sizing: border-box; color: rgb(0, 0, 0); display: inline; flex-wrap: nowrap; font-size: 19px; font-weight: 700; grid-area: auto; line-height: 0px; margin: 0px; overflow: visible; position: relative; text-align: left; text-align-last: auto; white-space-collapse: preserve-breaks;">®</sup> Blend Income Fund
|
|
| Class Name |
Institutional Class
|
|
| Trading Symbol |
PBRNX
|
|
| Annual or Semi-Annual Statement [Text Block] |
This annual shareholder report contains important information about the PIMCO REALPATH® Blend Income Fund (the "Fund") for the period of July 1, 2024 to June 30, 2025 (the "reporting period").
|
|
| Shareholder Report Annual or Semi-Annual |
Annual Shareholder Report
|
|
| Additional Information [Text Block] |
You can find additional information about the Fund at www.pimco.com/literature. You can also request this information by contacting us at 888.87.PIMCO (888.877.4626).
|
|
| Material Fund Change Notice [Text Block] |
This report describes changes to the Fund that occurred during the reporting period.
|
|
| Additional Information Website |
www.pimco.com/literature
|
|
| Expenses [Text Block] |
What were the Fund costs for the reporting period?(based on a hypothetical $10,000 investment)
Class Name |
Cost of a $10,000 investment |
Costs paid as a percentage of a $10,000 investment |
Institutional Class |
$3 |
0.03% | |
|
| Expenses Paid, Amount |
$ 3
|
|
| Expense Ratio, Percent |
0.03%
|
|
| Factors Affecting Performance [Text Block] |
How did the Fund perform during the reporting period and what affected its performance?The following affected performance (on a gross basis) during the reporting period: Exposure to U.S. large cap equities contributed to absolute performance, as U.S. large cap equities posted positive returns. Exposure to global equities contributed to absolute performance, as global equities posted positive returns. Exposure to U.S. core bonds contributed to absolute performance, as U.S. core bonds posted positive returns. There were no material detractors from absolute performance for this Fund.
|
|
| Performance Past Does Not Indicate Future [Text] |
Performance quoted represents past performance. Past performance is not a guarantee or a reliable indicator of future results.
|
|
| Line Graph [Table Text Block] |
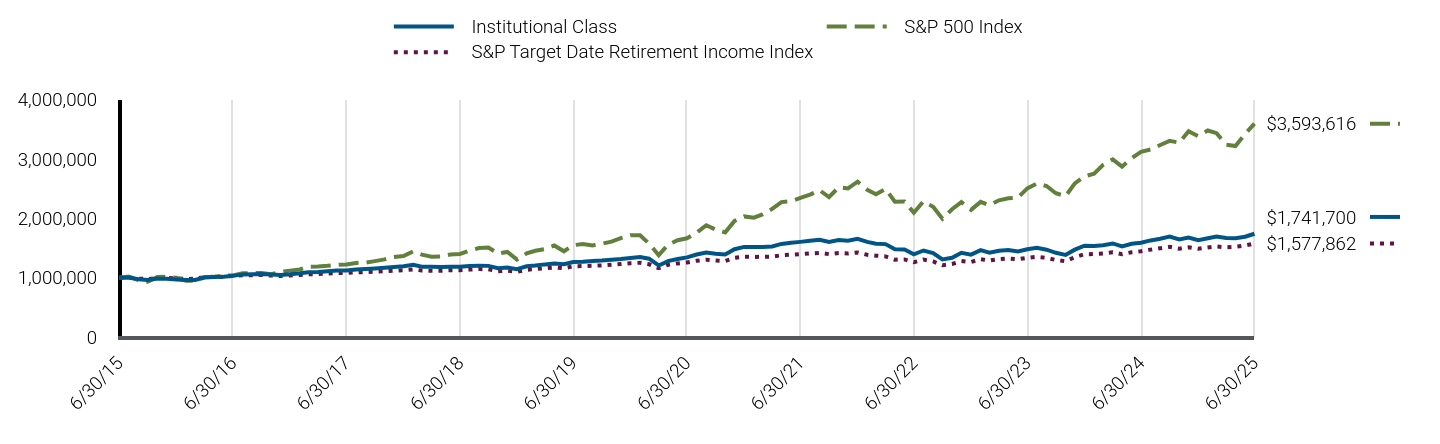
|
Institutional Class |
S&P 500 Index |
S&P Target Date Retirement Income Index |
6/30/15 |
$1,000,000 |
$1,000,000 |
$1,000,000 |
7/31/15 |
$1,007,035 |
$1,020,951 |
$1,007,975 |
8/31/15 |
$976,884 |
$959,353 |
$986,197 |
9/30/15 |
$965,087 |
$935,615 |
$979,058 |
10/31/15 |
$990,246 |
$1,014,539 |
$1,001,505 |
11/30/15 |
$985,214 |
$1,017,556 |
$999,664 |
12/31/15 |
$973,362 |
$1,001,507 |
$990,229 |
1/31/16 |
$964,131 |
$951,808 |
$981,275 |
2/29/16 |
$963,105 |
$950,524 |
$984,942 |
3/31/16 |
$1,003,947 |
$1,015,006 |
$1,011,855 |
4/30/16 |
$1,015,250 |
$1,018,940 |
$1,017,016 |
5/31/16 |
$1,017,305 |
$1,037,239 |
$1,020,083 |
6/30/16 |
$1,033,255 |
$1,039,926 |
$1,030,685 |
7/31/16 |
$1,058,253 |
$1,078,267 |
$1,045,104 |
8/31/16 |
$1,061,378 |
$1,079,781 |
$1,045,453 |
9/30/16 |
$1,066,533 |
$1,079,985 |
$1,047,746 |
10/31/16 |
$1,056,087 |
$1,060,285 |
$1,037,282 |
11/30/16 |
$1,048,775 |
$1,099,552 |
$1,031,652 |
12/31/16 |
$1,059,943 |
$1,121,286 |
$1,039,825 |
1/31/17 |
$1,075,826 |
$1,142,553 |
$1,048,176 |
2/28/17 |
$1,094,886 |
$1,187,919 |
$1,060,251 |
3/31/17 |
$1,098,529 |
$1,189,305 |
$1,062,720 |
4/30/17 |
$1,109,143 |
$1,201,519 |
$1,071,565 |
5/31/17 |
$1,121,880 |
$1,218,428 |
$1,079,987 |
6/30/17 |
$1,124,731 |
$1,226,033 |
$1,081,695 |
7/31/17 |
$1,141,805 |
$1,251,243 |
$1,092,418 |
8/31/17 |
$1,150,342 |
$1,255,074 |
$1,097,012 |
9/30/17 |
$1,158,401 |
$1,280,963 |
$1,103,971 |
10/31/17 |
$1,170,188 |
$1,310,855 |
$1,111,939 |
11/30/17 |
$1,181,976 |
$1,351,059 |
$1,120,932 |
12/31/17 |
$1,195,032 |
$1,366,081 |
$1,128,646 |
1/31/18 |
$1,217,764 |
$1,444,294 |
$1,142,139 |
2/28/18 |
$1,188,538 |
$1,391,062 |
$1,122,217 |
3/31/18 |
$1,187,455 |
$1,355,710 |
$1,119,613 |
4/30/18 |
$1,184,208 |
$1,360,912 |
$1,119,708 |
5/31/18 |
$1,187,455 |
$1,393,686 |
$1,127,778 |
6/30/18 |
$1,186,797 |
$1,402,264 |
$1,127,413 |
7/31/18 |
$1,199,839 |
$1,454,447 |
$1,138,286 |
8/31/18 |
$1,203,099 |
$1,501,841 |
$1,147,328 |
9/30/18 |
$1,201,256 |
$1,510,389 |
$1,144,878 |
10/31/18 |
$1,161,906 |
$1,407,154 |
$1,111,471 |
11/30/18 |
$1,171,744 |
$1,435,829 |
$1,120,708 |
12/31/18 |
$1,145,491 |
$1,306,187 |
$1,099,980 |
1/31/19 |
$1,194,282 |
$1,410,859 |
$1,135,902 |
2/28/19 |
$1,206,480 |
$1,456,159 |
$1,147,134 |
3/31/19 |
$1,226,249 |
$1,484,455 |
$1,161,269 |
4/30/19 |
$1,241,842 |
$1,544,560 |
$1,175,165 |
5/31/19 |
$1,229,590 |
$1,446,406 |
$1,161,045 |
6/30/19 |
$1,266,305 |
$1,548,343 |
$1,194,120 |
7/31/19 |
$1,270,795 |
$1,570,597 |
$1,198,234 |
8/31/19 |
$1,284,266 |
$1,545,718 |
$1,203,762 |
9/30/19 |
$1,290,006 |
$1,574,639 |
$1,209,710 |
10/31/19 |
$1,302,443 |
$1,608,745 |
$1,221,494 |
11/30/19 |
$1,316,010 |
$1,667,141 |
$1,232,739 |
12/31/19 |
$1,334,244 |
$1,717,458 |
$1,246,612 |
1/31/20 |
$1,349,314 |
$1,716,785 |
$1,253,541 |
2/29/20 |
$1,321,493 |
$1,575,461 |
$1,227,935 |
3/31/20 |
$1,207,422 |
$1,380,871 |
$1,163,253 |
4/30/20 |
$1,281,654 |
$1,557,890 |
$1,219,299 |
5/31/20 |
$1,317,610 |
$1,632,089 |
$1,243,076 |
6/30/20 |
$1,344,299 |
$1,664,547 |
$1,258,433 |
7/31/20 |
$1,393,056 |
$1,758,403 |
$1,288,254 |
8/31/20 |
$1,426,722 |
$1,884,798 |
$1,304,316 |
9/30/20 |
$1,406,884 |
$1,813,182 |
$1,292,749 |
10/31/20 |
$1,392,920 |
$1,764,962 |
$1,283,024 |
11/30/20 |
$1,481,359 |
$1,958,162 |
$1,335,807 |
12/31/20 |
$1,520,534 |
$2,033,450 |
$1,356,446 |
1/31/21 |
$1,518,113 |
$2,012,921 |
$1,352,388 |
2/28/21 |
$1,520,534 |
$2,068,427 |
$1,353,074 |
3/31/21 |
$1,528,585 |
$2,159,015 |
$1,356,871 |
4/30/21 |
$1,570,397 |
$2,274,239 |
$1,379,685 |
5/31/21 |
$1,588,843 |
$2,290,123 |
$1,388,363 |
6/30/21 |
$1,604,756 |
$2,343,585 |
$1,398,392 |
7/31/21 |
$1,623,387 |
$2,399,257 |
$1,410,066 |
8/31/21 |
$1,640,776 |
$2,472,208 |
$1,419,545 |
9/30/21 |
$1,601,784 |
$2,357,226 |
$1,398,000 |
10/31/21 |
$1,636,741 |
$2,522,377 |
$1,417,607 |
11/30/21 |
$1,623,008 |
$2,504,900 |
$1,408,862 |
12/31/21 |
$1,657,198 |
$2,617,160 |
$1,425,755 |
1/31/22 |
$1,604,527 |
$2,481,730 |
$1,387,600 |
2/28/22 |
$1,572,411 |
$2,407,423 |
$1,372,798 |
3/31/22 |
$1,567,144 |
$2,496,810 |
$1,361,263 |
4/30/22 |
$1,479,724 |
$2,279,083 |
$1,305,674 |
5/31/22 |
$1,477,152 |
$2,283,265 |
$1,310,217 |
6/30/22 |
$1,396,504 |
$2,094,795 |
$1,262,075 |
7/31/22 |
$1,459,805 |
$2,287,945 |
$1,306,345 |
8/31/22 |
$1,414,590 |
$2,194,638 |
$1,276,040 |
9/30/22 |
$1,310,453 |
$1,992,515 |
$1,211,926 |
10/31/22 |
$1,336,428 |
$2,153,832 |
$1,232,430 |
11/30/22 |
$1,420,848 |
$2,274,196 |
$1,282,052 |
12/31/22 |
$1,390,381 |
$2,143,170 |
$1,266,455 |
1/31/23 |
$1,464,890 |
$2,277,834 |
$1,313,615 |
2/28/23 |
$1,422,314 |
$2,222,257 |
$1,290,149 |
3/31/23 |
$1,456,238 |
$2,303,845 |
$1,315,250 |
4/30/23 |
$1,466,966 |
$2,339,805 |
$1,325,457 |
5/31/23 |
$1,444,170 |
$2,349,975 |
$1,312,714 |
6/30/23 |
$1,480,371 |
$2,505,250 |
$1,336,159 |
7/31/23 |
$1,504,596 |
$2,585,731 |
$1,352,788 |
8/31/23 |
$1,473,642 |
$2,544,562 |
$1,336,562 |
9/30/23 |
$1,421,172 |
$2,423,243 |
$1,301,321 |
10/31/23 |
$1,385,947 |
$2,372,291 |
$1,278,098 |
11/30/23 |
$1,474,009 |
$2,588,941 |
$1,347,238 |
12/31/23 |
$1,541,581 |
$2,706,559 |
$1,397,473 |
1/31/24 |
$1,537,448 |
$2,752,040 |
$1,399,055 |
2/29/24 |
$1,549,846 |
$2,898,987 |
$1,408,006 |
3/31/24 |
$1,578,183 |
$2,992,260 |
$1,429,992 |
4/30/24 |
$1,526,826 |
$2,870,043 |
$1,397,667 |
5/31/24 |
$1,574,019 |
$3,012,353 |
$1,430,377 |
6/30/24 |
$1,589,928 |
$3,120,443 |
$1,446,051 |
7/31/24 |
$1,629,324 |
$3,158,426 |
$1,474,294 |
8/31/24 |
$1,658,871 |
$3,235,039 |
$1,497,583 |
9/30/24 |
$1,693,062 |
$3,304,130 |
$1,520,673 |
10/31/24 |
$1,646,308 |
$3,274,166 |
$1,489,524 |
11/30/24 |
$1,677,477 |
$3,466,363 |
$1,513,979 |
12/31/24 |
$1,632,811 |
$3,383,732 |
$1,488,881 |
1/31/25 |
$1,664,516 |
$3,477,960 |
$1,510,465 |
2/28/25 |
$1,694,780 |
$3,432,579 |
$1,527,151 |
3/31/25 |
$1,671,824 |
$3,239,172 |
$1,512,905 |
4/30/25 |
$1,667,482 |
$3,217,208 |
$1,521,340 |
5/31/25 |
$1,692,089 |
$3,419,714 |
$1,543,466 |
6/30/25 |
$1,741,700 |
$3,593,616 |
$1,577,862 |
|
|
| Average Annual Return [Table Text Block] |
Class/Index Name |
1 Year |
5 Years |
10 Years |
Institutional Class |
9.55% |
5.32% |
5.71% |
S&P 500 Index |
15.16% |
16.64% |
13.65% |
S&P Target Date Retirement Income Index |
9.12% |
4.63% |
4.67% | |
|
| No Deduction of Taxes [Text Block] |
Returns shown do not reflect the deduction of taxes that a shareholder would pay on Fund distributions or the redemption of Fund shares.
|
|
| Performance Table Market Index Changed [Text Block] |
Differences in the Fund’s performance versus an index and related attribution information with respect to particular categories of securities or individual positions may be attributable, in part, to differences in the pricing methodologies used by the Fund and the index.
|
|
| Updated Performance Information Location [Text Block] |
For performance current to the most recent month-end, visit www.pimco.com/literature or via 888.87.PIMCO (888.877.4626).
|
|
| AssetsNet |
$ 666,921,000
|
|
| Holdings Count | Holding |
23
|
|
| Advisory Fees Paid, Amount |
$ 49,000
|
|
| InvestmentCompanyPortfolioTurnover |
14.00%
|
|
| Additional Fund Statistics [Text Block] |
Key Fund StatisticsFootnote Reference† (as of the end of the reporting period)
Total Net Assets |
$666,921 |
# of Portfolio Holdings |
23 |
Portfolio Turnover Rate |
14% |
Total Net Advisory Fees Paid During the Reporting Period |
$49 |
| Footnote |
Description |
Footnote† |
Dollar amounts displayed in 000's | |
|
| Holdings [Text Block] |
Security Type Breakdown (% of Net Asset Value)Footnote Reference*
Mutual Funds |
34.6% |
Short-Term Instruments |
0.2% |
Affiliated Investments |
65.4% |
Financial Derivative Instruments |
(0.1%) |
Other Assets and Liabilities, Net |
(0.1%) |
Total |
100.0% |
| Footnote |
Description |
Footnote* |
% of Net Asset Value includes derivatives instruments, if any, valued at the value used for determining the Fund's net asset value. The notional exposure of such derivatives investments therefore may be greater than what is depicted. | |
|
| Largest Holdings [Text Block] |
Top Holdings (% of Net Asset Value)Footnote Reference**
Vanguard Institutional Index Fund 'Institutional Plus' |
22.3% |
PIMCO Total Return Fund |
18.1% |
PIMCO Income Fund |
11.4% |
PIMCO Long-Term Real Return Fund |
9.4% |
Vanguard Developed Markets Index Fund 'Institutional' |
8.5% |
PIMCO Long-Term U.S. Government Fund |
8.2% |
PIMCO Real Return Fund |
6.1% |
PIMCO Emerging Markets Local Currency and Bond Fund |
3.3% |
Vanguard Emerging Markets Stock Index Fund 'Institutional' |
3.0% |
PIMCO International Bond Fund (U.S. Dollar-Hedged) |
2.9% |
| Footnote |
Description |
Footnote** |
Short-Term Instruments/Foreign Currency Contracts are not included in Top Holdings table. | |
|
| Material Fund Change [Text Block] |
This is a summary of certain changes and planned changes of the Fund since the beginning of the reporting period. For more information, you may refer to the Fund's next prospectus, which we expect to be available by October 31, 2025 or upon request at 888.87.PIMCO (888.877.4626). Change to REALPATH Blend Glide Path. Effective February 28, 2025, the Fund’s REALPATH Blend Glide Path, which forms the basis of the Fund’s long-term asset allocations, was changed based on data relating to risk metrics, long-term market trends, correlation of asset types and actuarial assumptions of life expectancy and retirement. Changes to Total Annual Fund Operating Expenses. Annual fund operating expenses increased during the year by 0.11% as a result of the Fund’s exposure to fees and expenses related to the Fund’s investment in underlying funds. Reorganization. On January 10, 2025, the PIMCO REALPATH® Blend 2025 Fund (the "Target Fund") was reorganized with and into the PIMCO REALPATH® Blend Income Fund (the "Acquiring Fund") and holders of the Institutional Class shares of the Target Fund received Institutional Class shares of the Acquiring Fund (the "Reorganization"). As part of the Reorganization, the Acquiring Fund acquired all of the assets and liabilities of the Target Fund. |
|
| Material Fund Change Objectives [Text Block] |
Change to REALPATH Blend Glide Path. Effective February 28, 2025, the Fund’s REALPATH Blend Glide Path, which forms the basis of the Fund’s long-term asset allocations, was changed based on data relating to risk metrics, long-term market trends, correlation of asset types and actuarial assumptions of life expectancy and retirement.
|
|
| Material Fund Change Expenses [Text Block] |
Changes to Total Annual Fund Operating Expenses. Annual fund operating expenses increased during the year by 0.11% as a result of the Fund’s exposure to fees and expenses related to the Fund’s investment in underlying funds.
|
|
| Summary of Change Legend [Text Block] |
This is a summary of certain changes and planned changes of the Fund since the beginning of the reporting period. For more information, you may refer to the Fund's next prospectus, which we expect to be available by October 31, 2025 or upon request at 888.87.PIMCO (888.877.4626).
|
|
|
|