Shareholder Report
|
12 Months Ended |
|
Jun. 30, 2025
USD ($)
Holding
|
|---|
| Shareholder Report [Line Items] |
|
| Document Type |
N-CSR
|
| Amendment Flag |
false
|
| Registrant Name |
HUSSMAN INVESTMENT TRUST
|
| Entity Central Index Key |
0001110502
|
| Entity Investment Company Type |
N-1A
|
| Document Period End Date |
Jun. 30, 2025
|
| C000004198 |
|
| Shareholder Report [Line Items] |
|
| Fund Name |
Hussman Strategic Market Cycle Fund
|
| Trading Symbol |
HSGFX
|
| Annual or Semi-Annual Statement [Text Block] |
This annual shareholder report contains important information about Hussman Strategic Market Cycle Fund (the "Fund") for the period of July 1, 2024 to June 30, 2025.
|
| Shareholder Report Annual or Semi-Annual |
Annual Shareholder Report
|
| Additional Information [Text Block] |
You can find additional information about the Fund at https://funddocs.filepoint.com/hussman/. You can also request this information by contacting us at (800) 487-7626.
|
| Material Fund Change Notice [Text Block] |
This report describes changes to the Fund that occurred during the reporting period.
|
| Additional Information Phone Number |
(800) 487-7626
|
| Additional Information Website |
<span style="font-weight: 700; box-sizing: border-box; color: rgb(0, 0, 0); display: inline; flex-wrap: nowrap; font-size: 10.6667px; grid-area: auto; line-height: 12.8px; margin: 0px; overflow: visible; text-align: left; text-align-last: left; white-space-collapse: preserve-breaks;">https://funddocs.filepoint.com/hussman/</span>
|
| Expenses [Text Block] |
What were the Fund’s annualized costs for the last year?(based on a hypothetical $10,000 investment) Fund Name | Costs of a $10,000 investment | Costs paid as a percentage of a $10,000 investment |
|---|
Hussman Strategic Market Cycle Fund | $123 | 1.15% |
|---|
|
| Expenses Paid, Amount |
$ 123
|
| Expense Ratio, Percent |
1.15%
|
| Factors Affecting Performance [Text Block] |
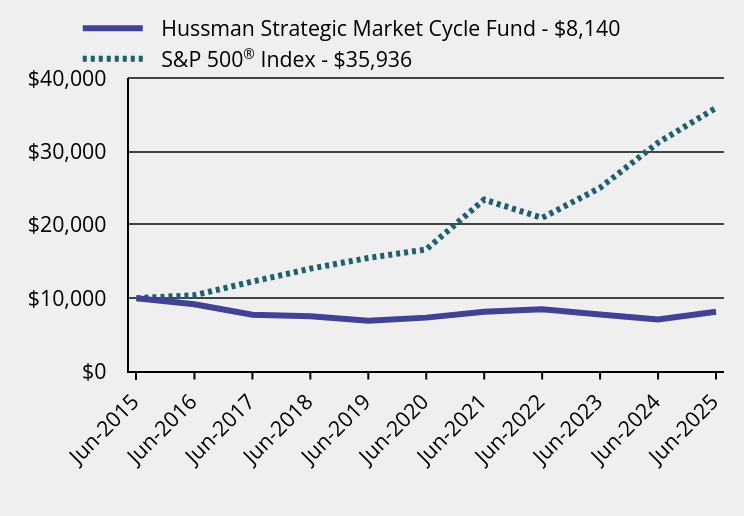
How did the Fund perform during the reporting period? During the fiscal year ended June 30, 2025, our most reliable equity market valuation measures ascended to the steepest extremes in U.S. financial history, exceeding levels observed at the 1929 and 2000 peaks. Short and intermediate-term market action also became increasingly overextended during this period. Amid these conditions, the Fund maintained a generally defensive investment stance, consistent with its long-term, full-cycle, risk-managed discipline. The Adviser continues to view the 2022-2025 period as the extended peak of the third great speculative bubble in U.S. history. For the fiscal year, the total return of the Fund was 14.69%, compared with a 15.16% total return of the benchmark S&P 500® Index. The largest peak-to-trough loss in the Fund was -8.99%, compared with an interim loss in the S&P 500® of -18.75%. The Fund’s investment stance is expected to change in response to shifts in observable market conditions. The Fund benefited from a September 2024 hedging implementation intended to vary the intensity of the Fund’s hedge positions even during extreme market conditions. The Fund also benefited from increased turnover in its stock holdings, allowing the Fund to respond to price fluctuations among individual stocks, even at unprecedented valuation extremes. The following equity holdings achieved gains in excess of $2 million during the fiscal year ended June 30, 2025: IonQ, Ubiquiti, AST SpaceMobile, AppLovin, Corcept Therapeutics, Sezzle, GeneDx Holdings, Exelixis, InterDigital, Newmont, Centrus Energy, Foot Locker and Agnico Eagle Mines. The only equity holding with a loss in excess of $2 million during this period was NovoNordisk A/S-ADR. |
| Performance Past Does Not Indicate Future [Text] |
Past performance does not ensure future results.
|
| Line Graph [Table Text Block] |
| Hussman Strategic Market Cycle Fund | S&P 500® Index |
|---|
Jun-2015 | $10,000 | $10,000 |
|---|
Jun-2016 | $9,166 | $10,399 |
|---|
Jun-2017 | $7,743 | $12,260 |
|---|
Jun-2018 | $7,525 | $14,023 |
|---|
Jun-2019 | $6,920 | $15,483 |
|---|
Jun-2020 | $7,347 | $16,645 |
|---|
Jun-2021 | $8,140 | $23,436 |
|---|
Jun-2022 | $8,501 | $20,948 |
|---|
Jun-2023 | $7,775 | $25,053 |
|---|
Jun-2024 | $7,097 | $31,204 |
|---|
Jun-2025 | $8,140 | $35,936 |
|---|
|
| Average Annual Return [Table Text Block] |
| 1 Year | 5 Years | 10 Years |
|---|
Hussman Strategic Market Cycle Fund | 14.69% | 2.07% | -2.04% |
|---|
S&P 500® Index | 15.16% | 16.64% | 13.65% |
|---|
|
| No Deduction of Taxes [Text Block] |
The graph and table do not reflect deduction of taxes that a shareholder would pay on fund distributions or redemption of fund shares.
|
| AssetsNet |
$ 362,486,086
|
| Holdings Count | Holding |
188
|
| Advisory Fees Paid, Amount |
$ 2,803,632
|
| InvestmentCompanyPortfolioTurnover |
470.00%
|
| Additional Fund Statistics [Text Block] |
- Net Assets$362,486,086
- Number of Portfolio Holdings188
- Advisory Fee (net of waivers)$2,803,632
- Portfolio Turnover470%
|
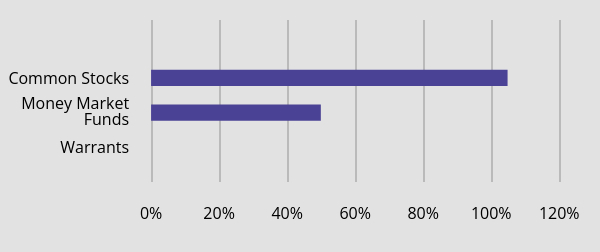
| Holdings [Text Block] |
Asset Weighting (% of total investments)Value | Value |
|---|
Warrants | 0.0% | Money Market Funds | 49.9% | Common Stocks | 104.8% |
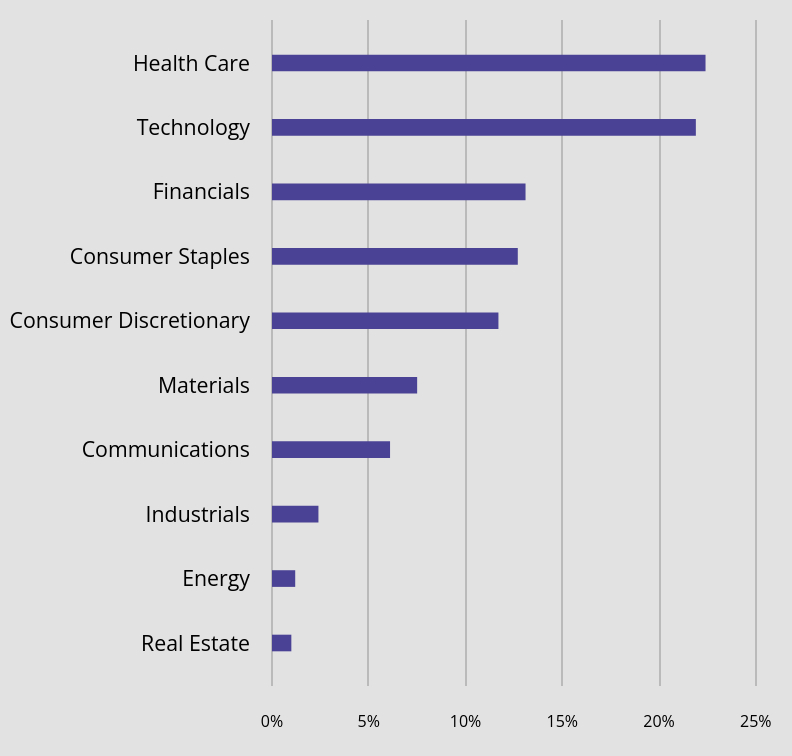
As of June 30, 2025, 98.9% of the value of the Fund's equity investments were hedged with option combinations (long put options/short call options) on the S&P 500® Index and Russell 2000 Index. A significant portion of money market holdings represent proceeds from written call options. Equity Sector Weighting (% of common stocks)Value | Value |
|---|
Real Estate | 1.0% | Energy | 1.2% | Industrials | 2.4% | Communications | 6.1% | Materials | 7.5% | Consumer Discretionary | 11.7% | Consumer Staples | 12.7% | Financials | 13.1% | Technology | 21.9% | Health Care | 22.4% |
|
| Largest Holdings [Text Block] |
Top 10 Equity Holdings (% of net assets) Holding Name | % of Net Assets |
|---|
Agnico Eagle Mines Ltd. | 2.0% |
|---|
Newmont Corporation | 1.9% |
|---|
Barrick Mining Corporation | 1.8% |
|---|
Ubiquiti, Inc. | 1.8% |
|---|
Charter Communications, Inc. - Class A | 1.6% |
|---|
Campbell's Company (The) | 1.5% |
|---|
Colgate-Palmolive Company | 1.3% |
|---|
InterDigital, Inc. | 1.2% |
|---|
Check Point Software Technologies Ltd. | 1.2% |
|---|
Exelixis, Inc. | 1.2% |
|---|
|
| Material Fund Change [Text Block] |
Effective November 1, 2024, the Fund changed its name from the Hussman Strategic Growth Fund to the Hussman Strategic Market Cycle Fund. |
| C000212809 |
|
| Shareholder Report [Line Items] |
|
| Fund Name |
Hussman Strategic Allocation Fund
|
| Trading Symbol |
HSAFX
|
| Annual or Semi-Annual Statement [Text Block] |
This annual shareholder report contains important information about Hussman Strategic Allocation Fund (the "Fund") for the period of July 1, 2024 to June 30, 2025.
|
| Shareholder Report Annual or Semi-Annual |
Annual Shareholder Report
|
| Additional Information [Text Block] |
You can find additional information about the Fund at https://funddocs.filepoint.com/hussman/. You can also request this information by contacting us at (800) 487-7626.
|
| Additional Information Phone Number |
(800) 487-7626
|
| Additional Information Website |
<span style="font-weight: 700; box-sizing: border-box; color: rgb(0, 0, 0); display: inline; flex-wrap: nowrap; font-size: 10.6667px; grid-area: auto; line-height: 16px; margin: 0px; overflow: visible; text-align: left; text-align-last: left; white-space-collapse: preserve-breaks;">https://funddocs.filepoint.com/hussman/</span>
|
| Expenses [Text Block] |
What were the Fund’s annualized costs for the last year?(based on a hypothetical $10,000 investment) Fund Name | Costs of a $10,000 investment | Costs paid as a percentage of a $10,000 investment |
|---|
Hussman Strategic Allocation Fund | $131 | 1.25% |
|---|
|
| Expenses Paid, Amount |
$ 131
|
| Expense Ratio, Percent |
1.25%
|
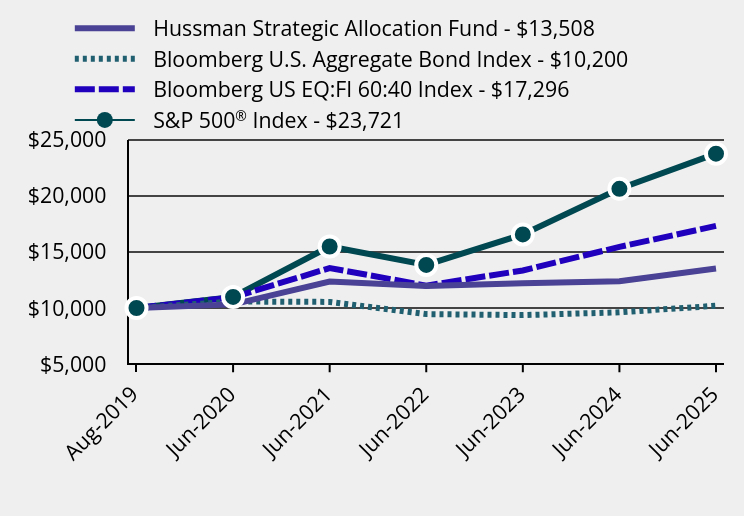
| Factors Affecting Performance [Text Block] |
How did the Fund perform during the reporting period? During the fiscal year ended June 30, 2025, our most reliable equity market valuation measures ascended to the steepest extremes in U.S. financial history, exceeding levels observed at the 1929 and 2000 peaks. Short and intermediate-term market action also became increasingly overextended during this period. The Adviser continues to view the 2022-2025 period as the extended peak of the third great speculative bubble in U.S. history. Amid these conditions, the Fund maintained a largely hedged investment stance in equities, consistent with its long-term, full-cycle, risk-managed discipline. Based on benchmarks used by the Adviser to gauge the adequacy of long-term Treasury yields, the Fund increased its exposure to longer-term bonds as the year progressed, generally with an average duration of 6-8 years inside the Fund’s fixed income component. The Fund’s investment stance is expected to change in response to shifts in observable market conditions. For the fiscal year, the total return of the Fund was 9.07%, compared with total returns of 15.16% and 6.08% for the S&P 500® Index and the Bloomberg U.S. Aggregate Bond Index, respectively. The largest peak-to-trough loss in the Fund was -1.70%, compared with interim losses in the S&P 500® Index and Bloomberg U.S. Aggregate Bond Index of -18.75% and -4.87%, respectively. The following equity holdings achieved gains in excess of $150,000 during the fiscal year ended June 30, 2025: IonQ, Ubiquiti, AST SpaceMobile, AppLovin and Corcept Therapeutics. The only equity holding with a loss in excess of $150,000 during this period was NovoNordisk A/S-ADR. |
| Performance Past Does Not Indicate Future [Text] |
Past performance does not ensure future results.
|
| Line Graph [Table Text Block] |
| Hussman Strategic Allocation Fund | Bloomberg U.S. Aggregate Bond Index | Bloomberg US EQ:FI 60:40 Index | S&P 500® Index |
|---|
Aug-2019 | $10,000 | $10,000 | $10,000 | $10,000 |
|---|
Jun-2020 | $10,323 | $10,579 | $10,950 | $10,988 |
|---|
Jun-2021 | $12,357 | $10,543 | $13,554 | $15,470 |
|---|
Jun-2022 | $11,963 | $9,458 | $11,992 | $13,828 |
|---|
Jun-2023 | $12,210 | $9,369 | $13,340 | $16,537 |
|---|
Jun-2024 | $12,384 | $9,616 | $15,433 | $20,598 |
|---|
Jun-2025 | $13,508 | $10,200 | $17,296 | $23,721 |
|---|
|
| Average Annual Return [Table Text Block] |
| 1 Year | 5 Years | Since Inception (August 27, 2019) |
|---|
Hussman Strategic Allocation Fund | 9.07% | 5.52% | 5.28% |
|---|
Bloomberg U.S. Aggregate Bond Index | 6.08% | -0.73% | 0.34% |
|---|
Bloomberg US EQ:FI 60:40 Index | 12.07% | 9.57% | 9.83% |
|---|
S&P 500® Index | 15.16% | 16.64% | 15.93% |
|---|
|
| Performance Inception Date |
Aug. 27, 2019
|
| No Deduction of Taxes [Text Block] |
The graph and table do not reflect deduction of taxes that a shareholder would pay on fund distributions or redemption of fund shares.
|
| AssetsNet |
$ 28,417,953
|
| Holdings Count | Holding |
192
|
| Advisory Fees Paid, Amount |
$ 0
|
| InvestmentCompanyPortfolioTurnover |
468.00%
|
| Additional Fund Statistics [Text Block] |
- Net Assets$28,417,953
- Number of Portfolio Holdings192
- Advisory Fee (net of waivers)$0
- Portfolio Turnover468%
|
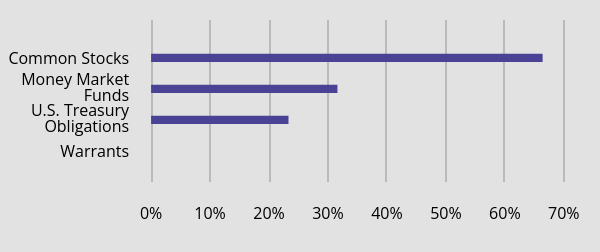
| Holdings [Text Block] |
Asset Weighting (% of total investments)Value | Value |
|---|
Warrants | 0.0% | U.S. Treasury Obligations | 23.3% | Money Market Funds | 31.6% | Common Stocks | 66.4% |
As of June 30, 2025, 91.7% of the value of the Fund's equity investments were hedged with option combinations (long put options/short call options) on the S&P 500® Index and Russell 2000 Index. A significant portion of money market holdings represent proceeds from written call options. Equity Sector Weighting (% of common stocks)Value | Value |
|---|
Real Estate | 1.0% | Energy | 1.2% | Industrials | 2.4% | Communications | 6.1% | Materials | 7.5% | Consumer Discretionary | 11.7% | Consumer Staples | 12.7% | Financials | 13.1% | Technology | 21.9% | Health Care | 22.4% |
|
| Largest Holdings [Text Block] |
Top 10 Holdings (% of net assets)Holding Name | % of Net Assets |
|---|
U.S. Treasury Notes, 4.625%, due 02/15/35 | 16.4% |
|---|
U.S. Treasury Bonds, 4.750%, due 02/15/45 | 3.5% |
|---|
U.S. Treasury Inflation-Protected Notes, 1.750%, due 01/15/34 | 1.8% |
|---|
U.S. Treasury Inflation-Protected Bonds, 2.125%, due 02/15/54 | 1.7% |
|---|
Agnico Eagle Mines Ltd. | 1.3% |
|---|
Newmont Corporation | 1.2% |
|---|
Barrick Mining Corporation | 1.2% |
|---|
Ubiquiti, Inc. | 1.2% |
|---|
Charter Communications, Inc. - Class A | 1.0% |
|---|
Campbell's Company (The) | 1.0% |
|---|
|
| Material Fund Change [Text Block] |
No material changes occurred during the year ended June 30, 2025. |
| C000004199 |
|
| Shareholder Report [Line Items] |
|
| Fund Name |
Hussman Strategic Total Return Fund
|
| Trading Symbol |
HSTRX
|
| Annual or Semi-Annual Statement [Text Block] |
This annual shareholder report contains important information about Hussman Strategic Total Return Fund (the "Fund") for the period of July 1, 2024 to June 30, 2025.
|
| Shareholder Report Annual or Semi-Annual |
Annual Shareholder Report
|
| Additional Information [Text Block] |
You can find additional information about the Fund at https://funddocs.filepoint.com/hussman/. You can also request this information by contacting us at (800) 487-7626.
|
| Additional Information Phone Number |
(800) 487-7626
|
| Additional Information Website |
<span style="font-weight: 700; box-sizing: border-box; color: rgb(0, 0, 0); display: inline; flex-wrap: nowrap; font-size: 10.6667px; grid-area: auto; line-height: 16px; margin: 0px; overflow: visible; text-align: left; text-align-last: left; white-space-collapse: preserve-breaks;">https://funddocs.filepoint.com/hussman/</span>
|
| Expenses [Text Block] |
What were the Fund’s annualized costs for the last year?(based on a hypothetical $10,000 investment) Fund Name | Costs of a $10,000 investment | Costs paid as a percentage of a $10,000 investment |
|---|
Hussman Strategic Total Return Fund | $81 | 0.75% |
|---|
|
| Expenses Paid, Amount |
$ 81
|
| Expense Ratio, Percent |
0.75%
|
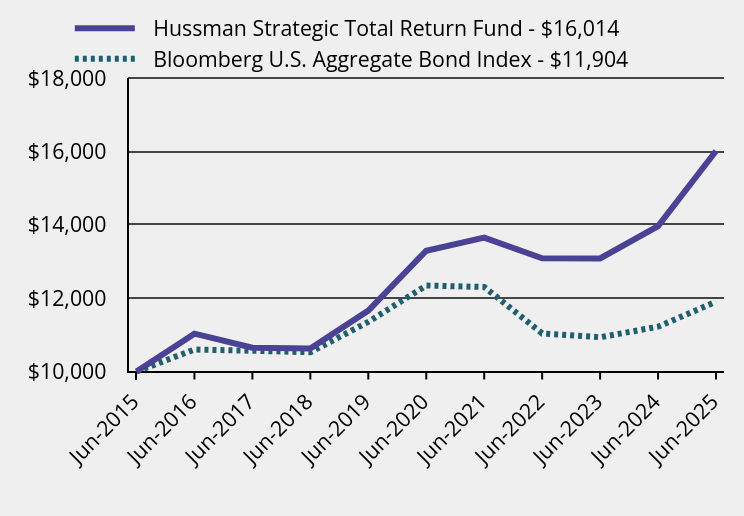
| Factors Affecting Performance [Text Block] |
How did the Fund perform during the reporting period? During the fiscal year ended June 30, 2025, the relationship between yields on U.S. Treasury securities shifted, with short-term yields moving below long-term yields. Based on benchmarks used by the Adviser to gauge the adequacy of long-term Treasury yields, the Fund increased its exposure to longer-term bonds as the year progressed, generally with an average duration of 6-8 years, and an overall portfolio duration between 4-6 years. The Fund held varying exposure in stocks of companies in the precious metals industry, ranging between 5-25% of net assets. Historically, the strongest performance of precious metals shares has typically emerged either during periods of falling interest rates, or amid quite rapid and accelerating inflation. The Fund had minor exposure to the utility and energy industries during the year. The Fund’s investment stance is expected to change in response to shifts in observable market conditions. For the fiscal year, the total return of the Fund was 14.69%, compared with a 6.08% gain in its benchmark, the Bloomberg U.S. Aggregate Bond Index. The Fund benefited from both the fixed income and equity holdings in the portfolio. The deepest peak-to-trough loss in the Fund was -2.61% compared with -4.87% for the benchmark. The Fund has outperformed its benchmark for the past 1, 3, 5, 7, and 10 years, and since inception on September 12, 2002. The following holdings achieved gains in excess of $1 million during the fiscal year ended June 30, 2025: Newmont, Agnico Eagle Mines, AngloGold Ashanti, U.S. Treasury Notes 4.35% due 11/15/2034, Kinross Gold and Barrick Mining. There were no portfolio losses in excess of $1 million during this period. |
| Performance Past Does Not Indicate Future [Text] |
Past performance does not ensure future results.
|
| Line Graph [Table Text Block] |
| Hussman Strategic Total Return Fund | Bloomberg U.S. Aggregate Bond Index |
|---|
Jun-2015 | $10,000 | $10,000 |
|---|
Jun-2016 | $11,033 | $10,600 |
|---|
Jun-2017 | $10,647 | $10,567 |
|---|
Jun-2018 | $10,627 | $10,525 |
|---|
Jun-2019 | $11,660 | $11,353 |
|---|
Jun-2020 | $13,292 | $12,345 |
|---|
Jun-2021 | $13,651 | $12,304 |
|---|
Jun-2022 | $13,086 | $11,038 |
|---|
Jun-2023 | $13,082 | $10,934 |
|---|
Jun-2024 | $13,963 | $11,222 |
|---|
Jun-2025 | $16,014 | $11,904 |
|---|
|
| Average Annual Return [Table Text Block] |
| 1 Year | 5 Years | 10 Years |
|---|
Hussman Strategic Total Return Fund | 14.69% | 3.80% | 4.82% |
|---|
Bloomberg U.S. Aggregate Bond Index | 6.08% | -0.73% | 1.76% |
|---|
|
| No Deduction of Taxes [Text Block] |
The graph and table do not reflect deduction of taxes that a shareholder would pay on fund distributions or redemption of fund shares.
|
| AssetsNet |
$ 223,027,214
|
| Holdings Count | Holding |
50
|
| Advisory Fees Paid, Amount |
$ 798,523
|
| InvestmentCompanyPortfolioTurnover |
270.00%
|
| Additional Fund Statistics [Text Block] |
- Net Assets$223,027,214
- Number of Portfolio Holdings50
- Advisory Fee (net of waivers)$798,523
- Portfolio Turnover270%
|
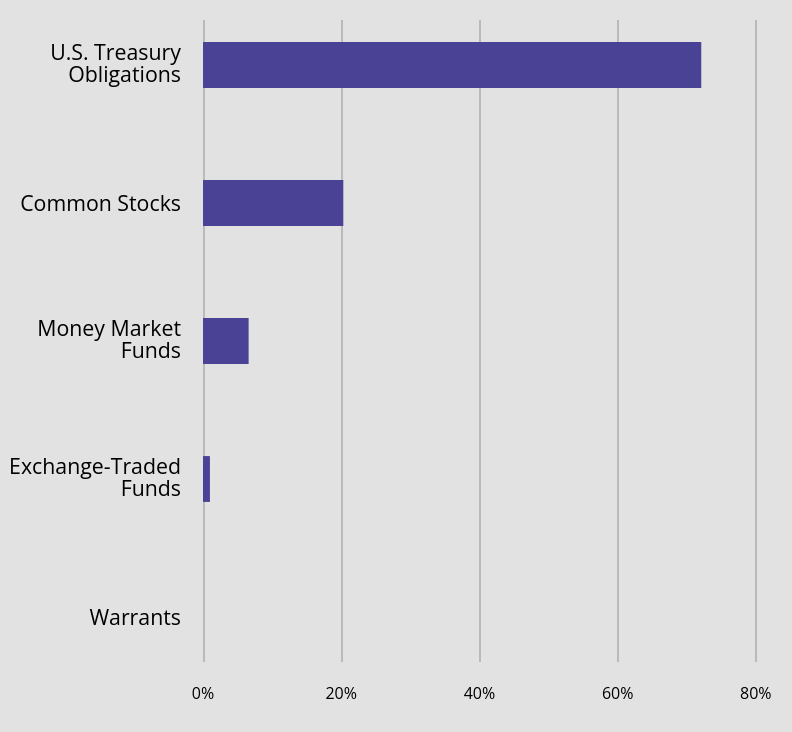
| Holdings [Text Block] |
Asset Weighting (% of total investments)Value | Value |
|---|
Warrants | 0.0% | Exchange-Traded Funds | 1.0% | Money Market Funds | 6.6% | Common Stocks | 20.3% | U.S. Treasury Obligations | 72.1% |
|
| Largest Holdings [Text Block] |
Top 10 Holdings (% of net assets)Holding Name | % of Net Assets |
|---|
U.S. Treasury Notes, 4.625%, due 02/15/35 | 34.7% |
|---|
U.S. Treasury Bonds, 4.750%, due 02/15/45 | 11.2% |
|---|
U.S. Treasury Inflation-Protected Notes, 2.500%, due 01/15/29 | 7.0% |
|---|
U.S. Treasury Inflation-Protected Notes, 0.125%, due 01/15/30 | 5.3% |
|---|
Agnico Eagle Mines Ltd. | 4.8% |
|---|
Newmont Corporation | 4.7% |
|---|
Barrick Mining Corporation | 4.5% |
|---|
U.S. Treasury Notes, 2.125%, due 05/31/26 | 4.4% |
|---|
U.S. Treasury Notes, 1.500%, due 08/15/26 | 4.4% |
|---|
U.S. Treasury Inflation-Protected Notes, 1.750%, due 01/15/34 | 2.3% |
|---|
|
| Material Fund Change [Text Block] |
No material changes occurred during the year ended June 30, 2025. |