Shareholder Report
Jun. 30, 2025
USD ($)
Holding
https://www.williamblairfunds.com/literature/forms
1-800-742-7272
.
What were the Fund costs for the last six months?
(Based on a hypothetical $10,000 investment)
Fund |
Cost of $10,000 Investment |
Cost of $10,000 Investment as a percentage |
| Growth Fund Class I | $ 47 |
0.92 % |
Management’s Discussion of Fund Performance
SUMMARY OF RESULTS
The Fund returned 3.74% (net of fees) for the 6 months ended June 30, 2025. The Fund underperformed its benchmark, the Russell 3000
®
Growth Index, which returned 5.80% and underperformed the S&P 500®
Index, a broad measure of market performance, which returned 6.20%.The Fund’s underperformance was driven by a combination of stock-specific dynamics and style factors. From a style perspective, our bias towards small and mid-caps was a headwind. The top detractors for the period came from stock selection in Health Care, including our positions in UnitedHealth Group, West Pharmaceuticals and Agilent Technologies. Other top detractors included ACV Auctions (Industrials) and EPAM Systems (Information Technology). Not owning Netflix (Communication Services) was also a headwind to performance. The top contributors to performance included Cameco (Energy), NVIDIA (Information Technology), Intuit (Information Technology), and Oracle (Information Technology), as well as our underweight to Apple (Information Technology). Not owning Tesla (Consumer Discretionary) was also a tailwind to performance.
TOP PERFORMANCE CONTRIBUTORS
Cameco
is a company focused on the mining, trading, and processing of uranium, a key input into nuclear power generation.NVIDIA
is a leading fabless semiconductor company specializing in the design and marketing of high-performance graphics processing unit (“GPU”) chipsets and software systems.TOP PERFORMANCE DETRACTORS
UnitedHealth Group
is a diversified healthcare company, operating through UnitedHealthcare, offering health insurance across various markets, and Optum, which provides healthcare services, including software and data consultancy.West Pharmaceuticals
a leading supplier of packaging components for injectable drugs and accessories for prefilled syringes and cartridge components.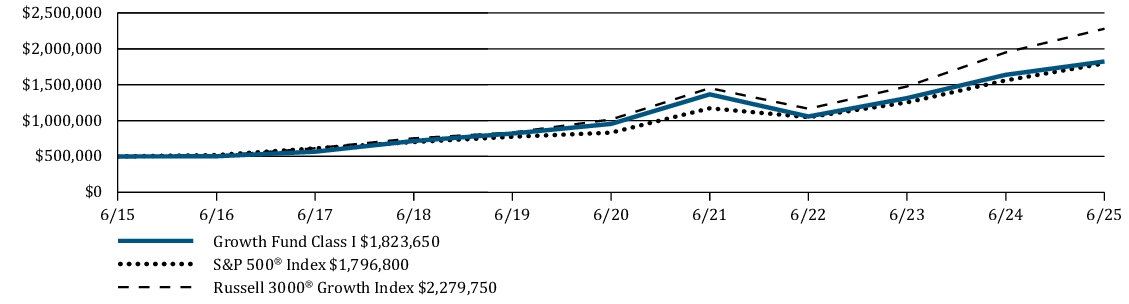
Average Annual Total Returns |
6 Months |
1 Year |
5 Years |
10 Years |
Growth Fund Class I |
3.74 % |
11.34 % |
13.83 % |
13.81 % |
S&P 500® Index |
6.20 % |
15.16 % |
16.64 % |
13.65 % |
Russell 3000 ® Growth Index |
5.80 % |
16.89 % |
17.55 % |
16.38 % |
www.williamblairfunds.com/funds/total-returns
Key Fund Statistics
Fund net assets (in $000s) |
$ 237,002 |
Number of portfolio holdings |
47 |
Net advisory fees paid (in $000s) |
$ 836 |
Portfolio turnover rate (six months) |
45 % |
Graphical Representation of Holdings
The tables below show the investment makeup of the Fund, representing percentage of the total net assets of the Fund.
Top Ten Holdings
| NVIDIA Corp. | 10.7 % |
| Microsoft Corp. | 8.7 % |
| Amazon.com, Inc. | 5.3 % |
| Apple, Inc. | 4.9 % |
| Broadcom, Inc. | 4.8 % |
| Meta Platforms, Inc. | 4.3 % |
| Alphabet, Inc. | 3.5 % |
| Mastercard, Inc. | 3.4 % |
| Walmart, Inc. | 3.3 % |
| ServiceNow, Inc. | 3.0 % |
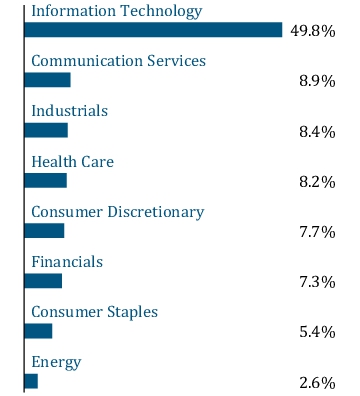
Sector Allocation

Top Ten Holdings
| NVIDIA Corp. | 10.7 % |
| Microsoft Corp. | 8.7 % |
| Amazon.com, Inc. | 5.3 % |
| Apple, Inc. | 4.9 % |
| Broadcom, Inc. | 4.8 % |
| Meta Platforms, Inc. | 4.3 % |
| Alphabet, Inc. | 3.5 % |
| Mastercard, Inc. | 3.4 % |
| Walmart, Inc. | 3.3 % |
| ServiceNow, Inc. | 3.0 % |
https://www.williamblairfunds.com/literature/forms
.
What were the Fund costs for the last six months?
(Based on a hypothetical $10,000 investment)
Fund | Cost of $10,000 Investment | Cost of $10,000 Investment as a percentage |
| Growth Fund Class N | $ 61 | 1.20 % |
Management’s Discussion of Fund Performance
SUMMARY OF RESULTS
The Fund returned 3.53% (net of fees) for the 6 months ended June 30, 2025. The Fund underperformed its benchmark, the Russell 3000
®
Growth Index, which returned 5.80% and underperformed the S&P 500®
Index, a broad measure of market performance, which returned 6.20%.The Fund’s underperformance was driven by a combination of stock-specific dynamics and style factors. From a style perspective, our bias towards small and mid-caps was a headwind. The top detractors for the period came from stock selection in Health Care, including our positions in UnitedHealth Group, West Pharmaceuticals and Agilent Technologies. Other top detractors included ACV Auctions (Industrials) and EPAM Systems (Information Technology). Not owning Netflix (Communication Services) was also a headwind to performance. The top contributors to performance included Cameco (Energy), NVIDIA (Information Technology), Intuit (Information Technology), and Oracle (Information Technology), as well as our underweight to Apple (Information Technology). Not owning Tesla (Consumer Discretionary) was also a tailwind to performance.
TOP PERFORMANCE CONTRIBUTORS
Cameco
is a company focused on the mining, trading, and processing of uranium, a key input into nuclear power generation.NVIDIA
is a leading fabless semiconductor company specializing in the design and marketing of high-performance graphics processing unit (“GPU”) chipsets and software systems.TOP PERFORMANCE DETRACTORS
UnitedHealth Group
is a diversified healthcare company, operating through UnitedHealthcare, offering health insurance across various markets, and Optum, which provides healthcare services, including software and data consultancy.West Pharmaceuticals
a leading supplier of packaging components for injectable drugs and accessories for prefilled syringes and cartridge components.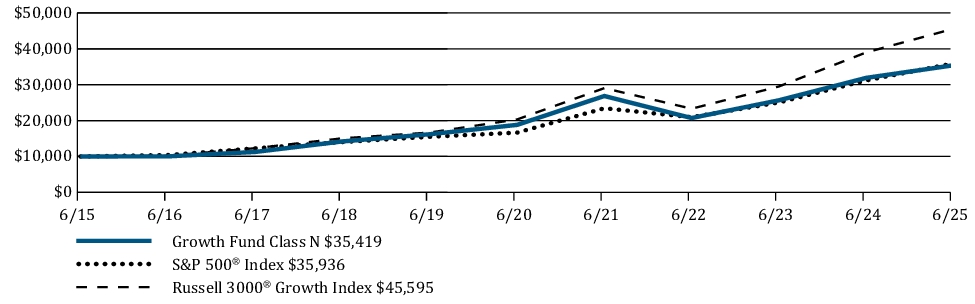
Average Annual Total Returns | 6 Months | 1 Year | 5 Years | 10 Years |
Growth Fund Class N | 3.53 % | 11.00 % | 13.50 % | 13.48 % |
S&P 500® Index | 6.20 % | 15.16 % | 16.64 % | 13.65 % |
Russell 3000 ® Growth Index | 5.80 % | 16.89 % | 17.55 % | 16.38 % |
www.williamblairfunds.com/funds/total-returns
Key Fund
Statistics
Fund net assets (in $000s) | $ 237,002 |
Number of portfolio holdings | 47 |
Net advisory fees paid (in $000s) | $ 836 |
Portfolio turnover rate (six months) | 45 % |
Graphical Representation of Holdings
The tables below show the investment makeup of the Fund, representing percentage of the total net assets of the Fund.
Top Ten Holdings
| NVIDIA Corp. | 10.7 % |
| Microsoft Corp. | 8.7 % |
| Amazon.com, Inc. | 5.3 % |
| Apple, Inc. | 4.9 % |
| Broadcom, Inc. | 4.8 % |
| Meta Platforms, Inc. | 4.3 % |
| Alphabet, Inc. | 3.5 % |
| Mastercard, Inc. | 3.4 % |
| Walmart, Inc. | 3.3 % |
| ServiceNow, Inc. | 3.0 % |
Sector Allocation
Top Ten Holdings
| NVIDIA Corp. | 10.7 % |
| Microsoft Corp. | 8.7 % |
| Amazon.com, Inc. | 5.3 % |
| Apple, Inc. | 4.9 % |
| Broadcom, Inc. | 4.8 % |
| Meta Platforms, Inc. | 4.3 % |
| Alphabet, Inc. | 3.5 % |
| Mastercard, Inc. | 3.4 % |
| Walmart, Inc. | 3.3 % |
| ServiceNow, Inc. | 3.0 % |
https://www.williamblairfunds.com/literature/forms
1-800-742-7272
.
What were the Fund costs for the last six months?
(Based on a hypothetical $10,000 investment)
Fund |
Cost of $10,000 Investment |
Cost of $10,000 Investment as a percentage |
| Growth Fund Class R6 | $ 45 |
0.88 % |
Management’s Discussion of Fund Performance
SUMMARY OF RESULTS
The Fund returned 3.71% (net of fees) for the 6 months ended June 30, 2025. The Fund underperformed its benchmark, the Russell 3000
®
Growth Index, which returned 5.80% and underperformed the S&P 500®
Index, a broad measure of market performance, which returned 6.20%.The Fund’s underperformance was driven by a combination of stock-specific dynamics and style factors. From a style perspective, our bias towards small and mid-caps was a headwind. The top detractors for the period came from stock selection in Health Care, including our positions in UnitedHealth Group, West Pharmaceuticals and Agilent Technologies. Other top detractors included ACV Auctions (Industrials) and EPAM Systems (Information Technology). Not owning Netflix (Communication Services) was also a headwind to performance. The top contributors to performance included Cameco (Energy), NVIDIA (Information Technology), Intuit (Information Technology), and Oracle (Information Technology), as well as our underweight to Apple (Information Technology). Not owning Tesla (Consumer Discretionary) was also a tailwind to performance.
TOP PERFORMANCE CONTRIBUTORS
Cameco
is a company focused on the mining, trading, and processing of uranium, a key input into nuclear power generation.NVIDIA
is a leading fabless semiconductor company specializing in the design and marketing of high-performance graphics processing unit (“GPU”) chipsets and software systems.TOP PERFORMANCE DETRACTORS
UnitedHealth Group
is a diversified healthcare company, operating through UnitedHealthcare, offering health insurance across various markets, and Optum, which provides healthcare services, including software and data consultancy.West Pharmaceuticals
a leading supplier of packaging components for injectable drugs and accessories for prefilled syringes and cartridge components.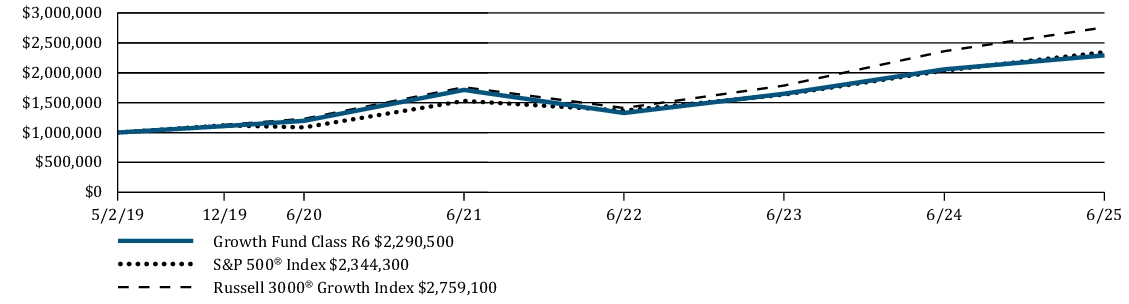
Average Annual Total Returns |
6 Months |
1 Year |
5 Years |
Since Inception |
Growth Fund Class R6 |
3.71 % |
11.35 % |
13.88 % |
14.39 % |
S&P 500® Index |
6.20 % |
15.16 % |
16.64 % |
14.82 % |
Russell 3000 ® Growth Index |
5.80 % |
16.89 % |
17.55 % |
17.90 % |
www.williamblairfunds.com/funds/total-returns
Key Fund Statistics
Fund net assets (in $000s) |
$ 237,002 |
Number of portfolio holdings |
47 |
Net advisory fees paid (in $000s) |
$ 836 |
Portfolio turnover rate (six months) |
45 % |
Graphical Representation of
Holdings
The tables below show the investment makeup of the Fund, representing percentage of the total net assets of the Fund.
Top Ten Holdings
| NVIDIA Corp. | 10.7 % |
| Microsoft Corp. | 8.7 % |
| Amazon.com, Inc. | 5.3 % |
| Apple, Inc. | 4.9 % |
| Broadcom, Inc. | 4.8 % |
| Meta Platforms, Inc. | 4.3 % |
| Alphabet, Inc. | 3.5 % |
| Mastercard, Inc. | 3.4 % |
| Walmart, Inc. | 3.3 % |
| ServiceNow, Inc. | 3.0 % |
Sector Allocation

Top Ten Holdings
| NVIDIA Corp. | 10.7 % |
| Microsoft Corp. | 8.7 % |
| Amazon.com, Inc. | 5.3 % |
| Apple, Inc. | 4.9 % |
| Broadcom, Inc. | 4.8 % |
| Meta Platforms, Inc. | 4.3 % |
| Alphabet, Inc. | 3.5 % |
| Mastercard, Inc. | 3.4 % |
| Walmart, Inc. | 3.3 % |
| ServiceNow, Inc. | 3.0 % |
https://www.williamblairfunds.com/literature/forms
1-800-742-7272
.
What were the Fund costs for the last six months?
(Based on a hypothetical $10,000 investment)
Fund |
Cost of $10,000 Investment |
Cost of $10,000 Investment as a percentage |
| Large Cap Growth Fund Class I | $ 33 |
0.65 % |
Management’s Discussion of Fund Performance
SUMMARY OF RESULTS
The Fund returned 5.83% (net of fees) for the 6 months ended June 30, 2025. The Fund underperformed its benchmark, the Russell 1000
®
Growth Index (the "Index"), which returned 6.09% and underperformed the Russell 1000®
Index, a broad measure of market performance, which returned 6.12%.The top detractors for the period came from stock selection in Health Care, including our positions in UnitedHealth Group, West Pharmaceuticals and Agilent Technologies. Other top detractors included Salesforce (Information Technology) and Chipotle Mexican Grill (Consumer Discretionary), as well as not owning Netflix (Communication Services) and Palantir Technologies (Information Technology). The top contributors to performance included Meta Platforms (Communication Services), Uber Technologies (Industrials), IDEXX Laboratories (Health Care), Intuit (Information Technology), as well as our underweight to Apple (Information Technology). Not owning Tesla (Consumer Discretionary) and Alphabet (Communication Services) were also tailwinds to performance.
TOP PERFORMANCE CONTRIBUTORS
Meta Platforms
is a market leader in social media and digital advertising, best known for its platforms including Facebook, Instagram and WhatsApp. The stock outperformed driven by strong digital advertising growth across its family of apps and early momentum in artificial intelligence initiatives. Uber Technologies
is a technology platform that develops and operates networks facilitating the movement of products and people. The stock outperformed due to strong demand across mobility and delivery verticals.TOP PERFORMANCE DETRACTORS
UnitedHealth Group
is a diversified healthcare company, operating through UnitedHealthcare, offering health insurance across various markets, and Optum, which provides healthcare services, including software and data consultancy. The stock lagged as results fell short of expectations primarily due to underperformance in Optum Health and Medicare Advantage due to higher-than-expected patient use. West Pharmaceuticals
a leading supplier of packaging components for injectable drugs and accessories for prefilled syringes and cartridge components. The stock underperformed as forward guidance was below expectations, driven by the loss of two major contract manufacturing customers and weaker-than-expected incentive payments for its SmartDose manufacturing segment. 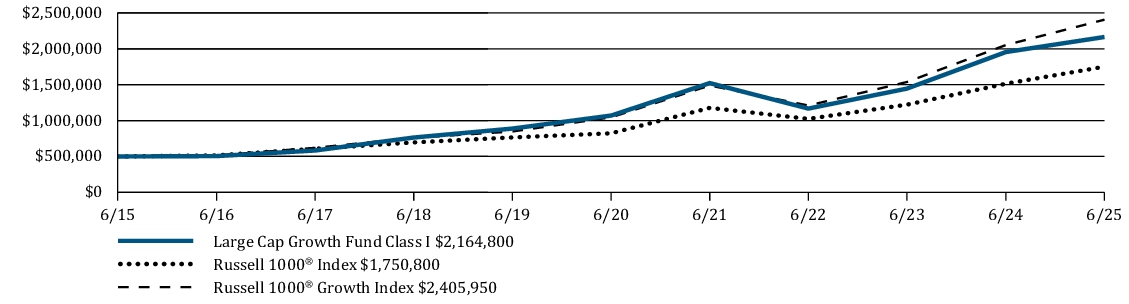
Average Annual Total Returns |
6 Months |
1 Year |
5 Years |
10 Years |
Large Cap Growth Fund Class I |
5.83 % |
10.74 % |
15.13 % |
15.78 % |
Russell 1000® Index |
6.12 % |
15.66 % |
16.30 % |
13.35 % |
Russell 1000® Growth Index |
6.09 % |
17.22 % |
18.15 % |
17.01 % |
www.williamblairfunds.com/funds/total-returns
Key Fund Statistics
Fund net assets (in $000s) |
$ 2,793,210 |
Number of portfolio holdings |
32 |
Net advisory fees paid (in $000s) |
$ 6,743 |
Portfolio turnover rate (six months) |
20 % |
Graphical Representation of Holdings
The tables below
show
the investment makeup of the Fund, representing percentage of the total net assets of the Fund.Top Ten Holdings
| Microsoft Corp. | 13.9 % |
| NVIDIA Corp. | 13.4 % |
| Amazon.com, Inc. | 8.0 % |
| Apple, Inc. | 7.3 % |
| Meta Platforms, Inc. | 6.9 % |
| Broadcom, Inc. | 4.9 % |
| Mastercard, Inc. | 4.5 % |
| Costco Wholesale Corp. | 2.7 % |
| IDEXX Laboratories, Inc. | 2.5 % |
| Intuit, Inc. | 2.5 % |
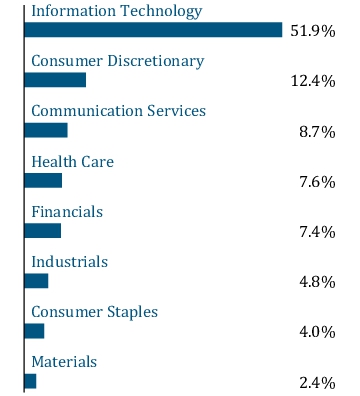
Sector Allocation

Top Ten Holdings
| Microsoft Corp. | 13.9 % |
| NVIDIA Corp. | 13.4 % |
| Amazon.com, Inc. | 8.0 % |
| Apple, Inc. | 7.3 % |
| Meta Platforms, Inc. | 6.9 % |
| Broadcom, Inc. | 4.9 % |
| Mastercard, Inc. | 4.5 % |
| Costco Wholesale Corp. | 2.7 % |
| IDEXX Laboratories, Inc. | 2.5 % |
| Intuit, Inc. | 2.5 % |
https://www.williamblairfunds.com/literature/forms
1-800-742-7272
.
What were the Fund costs for the last six months?
(Based on a hypothetical $10,000 investment)
Fund | Cost of $10,000 Investment | Cost of $10,000 Investment as a percentage |
| Large Cap Growth Fund Class N | $ 46 | 0.90 % |
Management’s Discussion of Fund Performance
SUMMARY OF RESULTS
The Fund returned 5.67% (net of fees) for the 6 months ended June 30, 2025. The Fund underperformed its benchmark, the Russell 1000
®
Growth Index (the "Index"), which returned 6.09% and underperformed the Russell 1000®
Index, a broad measure of market performance, which returned 6.12%.The top detractors for the period came from stock selection in Health Care, including our positions in UnitedHealth Group, West Pharmaceuticals and Agilent Technologies. Other top detractors included Salesforce (Information Technology) and Chipotle Mexican Grill (Consumer Discretionary), as well as not owning Netflix (Communication Services) and Palantir The top contributors to performance included Meta Platforms (Communication Services), Uber Technologies (Industrials), IDEXX Laboratories (Health Care), Intuit (Information Technology), as well as our underweight to Apple (Information Technology). Not owning Tesla (Consumer Discretionary) and Alphabet (Communication Services) were also tailwinds to performance.
Tec
hnologies (Information Technology).TOP PERFORMANCE CONTRIBUTORS
Meta Platforms
is a market leader in social media and digital advertising, best known for its platforms including Facebook, Instagram and WhatsApp. The stock outperformed driven by strong digital advertising growth across its family of apps and early momentum in artificial intelligence initiatives. Uber Technologies
is a technology platform that develops and operates networks facilitating the movement of products and people. The stock outperformed due to strong demand across mobility and delivery verticals.TOP PERFORMANCE DETRACTORS
UnitedHealth Group
is a diversified healthcare company, operating through UnitedHealthcare, offering health insurance across various markets, and Optum, which provides healthcare services, including software and data consultancy. The stock lagged as results fell short of expectations primarily due to underperformance in Optum Health and Medicare Advantage due to higher-than-expected patient use. West Pharmaceuticals
a leading supplier of packaging components for injectable drugs and accessories for prefilled syringes and cartridge components. The stock underperformed as forward guidance was below expectations, driven by the loss of two major contract manufacturing customers and weaker-than-expected incentive payments for its SmartDose manufacturing segment. 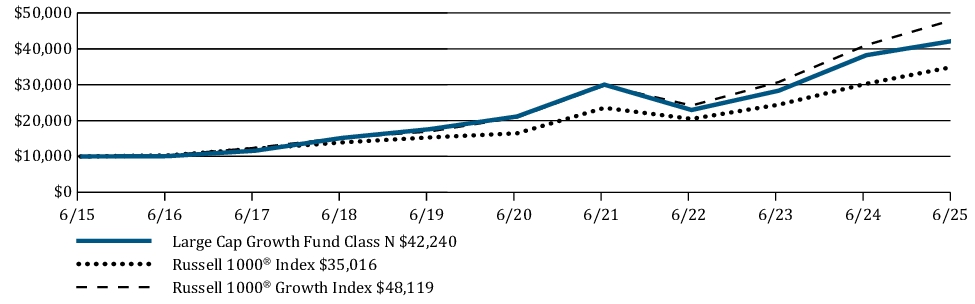
Average Annual Total Returns | 6 Months | 1 Year | 5 Years | 10 Years |
Large Cap Growth Fund Class N | 5.67 % | 10.49 % | 14.84 % | 15.50 % |
Russell 1000® Index | 6.12 % | 15.66 % | 16.30 % | 13.35 % |
Russell 1000® Growth Index | 6.09 % | 17.22 % | 18.15 % | 17.01 % |
www.williamblairfunds.com/funds/total-returns
Key Fund Statistics
Fund net assets (in $000s) | $ 2,793,210 |
Number of portfolio holdings | 32 |
Net advisory fees paid (in $000s) | $ 6,743 |
Portfolio turnover rate (six months) | 20 % |
Graphical Representation of Holdings
The tables below show the investment makeup of the Fund, representing percentage of the total net assets of the Fund.
Top Ten Holdings
| Microsoft Corp. | 13.9 % |
| NVIDIA Corp. | 13.4 % |
| Amazon.com, Inc. | 8.0 % |
| Apple, Inc. | 7.3 % |
| Meta Platforms, Inc. | 6.9 % |
| Broadcom, Inc. | 4.9 % |
| Mastercard, Inc. | 4.5 % |
| Costco Wholesale Corp. | 2.7 % |
| IDEXX Laboratories, Inc. | 2.5 % |
| Intuit, Inc. | 2.5 % |
Sector Allocation
Top Ten Holdings
| Microsoft Corp. | 13.9 % |
| NVIDIA Corp. | 13.4 % |
| Amazon.com, Inc. | 8.0 % |
| Apple, Inc. | 7.3 % |
| Meta Platforms, Inc. | 6.9 % |
| Broadcom, Inc. | 4.9 % |
| Mastercard, Inc. | 4.5 % |
| Costco Wholesale Corp. | 2.7 % |
| IDEXX Laboratories, Inc. | 2.5 % |
| Intuit, Inc. | 2.5 % |
https://www.williamblairfunds.com/literature/forms
1-800-742-7272
.
What were the Fund costs for the last six months?
(Based on a hypothetical $10,000 investment)
Fund | Cost of $10,000 Investment | Cost of $10,000 Investment as a percentage |
| Large Cap Growth Fund Class R6 | $ 31 | 0.60 % |
Management’s Discussion of Fund Performance
SUMMARY OF RESULTS
The Fund returned 5.83% (net of fees) for the 6 months ended June 30, 2025. The Fund underperformed its benchmark, the Russell 1000
®
Growth Index (the "Index"), which returned 6.09% and underperformed the Russell 1000®
Index, a broad measure of market performance, which returned 6.12%.The top detractors for the period came from stock selection in Health Care, including our positions in UnitedHealth Group, West Pharmaceuticals and Agilent Technologies. Other top detractors included Salesforce (Information Technology) and Chipotle Mexican Grill (Consumer Discretionary), as well as not owning Netflix (Communication Services) and Palantir Technologies (Information Technology). The top contributors to performance included Meta Platforms (Communication S
er
vices), Uber Technologies (Industrials), IDEXX Laboratories (Health Care), Intuit (Information Technology), as well as our underweight to Apple (Information Technology). Not owning Tesla (Consumer Discretionary) and Alphabet (Communication Services) were also tailwinds to performance.Uber Technologies
is a technology platform that develops and operates networks facilitating the movement of products and people. The stock outperformed due to strong demand across mobility and delivery verticals.West Pharmaceuticals
a leading supplier of packaging components for injectable drugs and accessories for prefilled syringes and cartridge components. The stock underperformed as forward guidance was below expectations, driven by the loss of two major contract manufacturing customers and weaker-than-expected incentive payments for its SmartDose manufacturing segment. 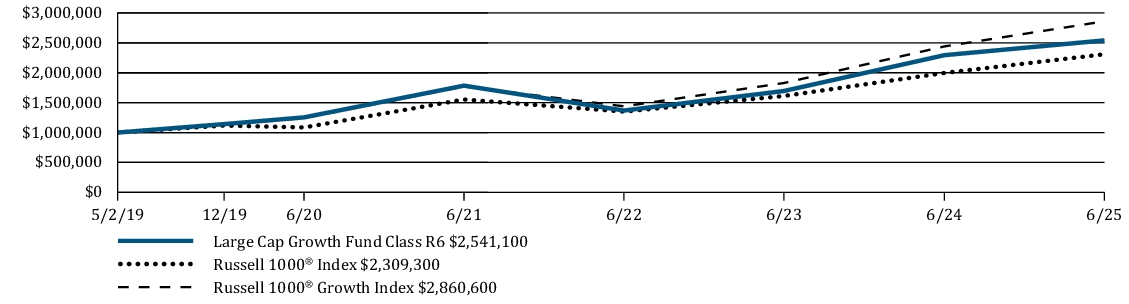
Average Annual Total Returns | 6 Months | 1 Year | 5 Years | Since Inception |
Large Cap Growth Fund Class R6 | 5.83 % | 10.79 % | 15.18 % | 16.33 % |
Russell 1000® Index | 6.12 % | 15.66 % | 16.30 % | 14.53 % |
Russell 1000® Growth Index | 6.09 % | 17.22 % | 18.15 % | 18.59 % |
www.williamblairfunds.com/funds/total-returns
Key Fund Statistics
Fund net assets (in $000s) | $ 2,793,210 |
Number of portfolio holdings | 32 |
Net advisory fees paid (in $000s) | $ 6,743 |
Portfolio turnover rate (six months) | 20 % |
Graphical Representation of Holdings
The tables below show the investment makeup of the Fund, representing percentage of the total net assets of the Fund.
Top Ten Holdings
| Microsoft Corp. | 13.9 % |
| NVIDIA Corp. | 13.4 % |
| Amazon.com, Inc. | 8.0 % |
| Apple, Inc. | 7.3 % |
| Meta Platforms, Inc. | 6.9 % |
| Broadcom, Inc. | 4.9 % |
| Mastercard, Inc. | 4.5 % |
| Costco Wholesale Corp. | 2.7 % |
| IDEXX Laboratories, Inc. | 2.5 % |
| Intuit, Inc. | 2.5 % |
Sector Allocation

Top Ten Holdings
| Microsoft Corp. | 13.9 % |
| NVIDIA Corp. | 13.4 % |
| Amazon.com, Inc. | 8.0 % |
| Apple, Inc. | 7.3 % |
| Meta Platforms, Inc. | 6.9 % |
| Broadcom, Inc. | 4.9 % |
| Mastercard, Inc. | 4.5 % |
| Costco Wholesale Corp. | 2.7 % |
| IDEXX Laboratories, Inc. | 2.5 % |
| Intuit, Inc. | 2.5 % |
https://www.williamblairfunds.com/literature/forms
1-800-742-7272
.
What were the Fund costs for the last six months?
(Based on a hypothetical $10,000 investment)
Fund | Cost of $10,000 Investment | Cost of $10,000 Investment as a percentage |
| Mid Cap Value Fund Class I | $ 38 | 0.75 % |
Management’s Discussion of Fund Performance
SUMMARY OF RESULTS
The Fund returned 1.96% (net of fees) for the 6 months ended June 30, 2025. The Fund underperformed its benchmark, the Russell Midcap
®
Value Index, which returned 3.12% and underperformed the Russell 3000®
Index, a broad measure of market performance, which returned 5.75%.The Fund’s underperformance Poor sector allocations in 6 of the 11 Global Industry Classification Standard economic sectors also detracted from relative performance. Conversely, positive stock selection in the Information Technology, Materials, and Health Care sectors contributed to relative performance in the period.
versus
its benchmark was driven by poor stock selection in the Financials, Consumer Discretionary, and Real Estate sectors. TOP PERFORMANCE CONTRIBUTORS
Jabil, Inc.
is a manufacturing services company, which serves automotive, consumer health, data centers, energy, and aerospace & defense sectors worldwide. Jabil has benefited from its diversified revenue segments with success in their cloud and data centers business fueled by artificial intelligence adoption. CACI International, Inc.
engages in the provision of information solutions and services in support of national security missions and government transformation for intelligence, defense, and federal civilian customers. CACI has benefited from increased defense spending caused by geopolitical uncertainty.Johnson Controls International, plc.
engages in the provision of products, solutions, and infrastructure which include fire detection & suppression, security, HVAC equipment, building automation and controls, digital, industrial refrigeration, residential & smart home, retail, distributed energy storage, and batteries. Johnson Controls has benefited from strong organic growth and a healthy order backlog.TOP PERFORMANCE DETRACTORS
ON Semiconductor Corp.
engages in the provision of intelligent power and sensing solutions with a primary focus on automative and industrial markets. The company’s large auto exposure has led to margin contraction, causing an overhang in the stock during most of the year-to-date period.Teleflex, Inc.
engages in the provision of medical technology products. Teleflex’s large supply chain exposure to China and Mexico coupled with weakness in their urology, interventional, anesthesia, and OEM businesses have continually hurt the stock.ICON plc.
is a clinical research organization, which engages in the provision of outsourced development services to the pharmaceutical, biotechnology, and medical device industries. ICON has suffered from their lowest book-to-bill ratio since 2016 caused by depressed R&D spend post COVID-19.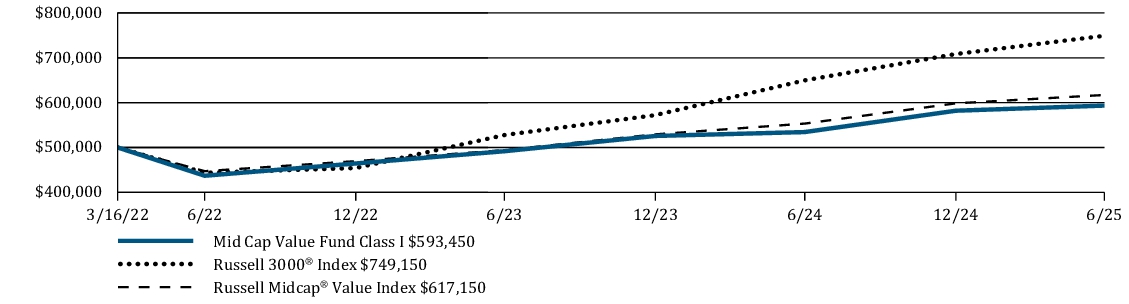
Average Annual Total Returns | 6 Months | 1 Year | Since Inception |
Mid Cap Value Fund Class I | 1.96 % | 11.05 % | 5.34 % |
Russell 3000 ® Index | 5.75 % | 15.30 % | 13.05 % |
Russell Midcap ® Value Index | 3.12 % | 11.53 % | 6.60 % |
www.williamblairfunds.com/funds/total-returns
Key
Fund
StatisticsFund net assets (in $000s) | $ 1,684 |
Number of portfolio holdings | 58 |
Net advisory fees paid (in $000s) | $ 0 |
Portfolio turnover rate (six months) | 21 % |
Graphical Representation of Holdings
The tables below show the investment makeup of the
Fund
, representing percentage of the total net assets of the Fund.Top Ten Holdings
| STMicroelectronics N.V. | 2.2 % |
| Kirby Corporation | 2.1 % |
| KKR & Co., Inc. | 2.1 % |
| Amdocs Ltd. | 2.0 % |
| Regency Centers Corp. | 2.0 % |
| Flex Ltd. | 2.0 % |
| State Street Corporation | 2.0 % |
| Willis Towers Watson PLC | 2.0 % |
| Everest Group Ltd. | 2.0 % |
| Encompass Health Corp. | 2.0 % |
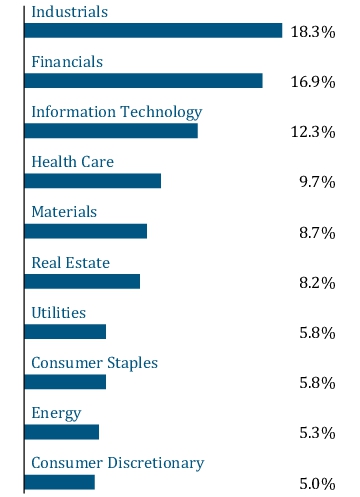
Sector Allocation

Top Ten Holdings
| STMicroelectronics N.V. | 2.2 % |
| Kirby Corporation | 2.1 % |
| KKR & Co., Inc. | 2.1 % |
| Amdocs Ltd. | 2.0 % |
| Regency Centers Corp. | 2.0 % |
| Flex Ltd. | 2.0 % |
| State Street Corporation | 2.0 % |
| Willis Towers Watson PLC | 2.0 % |
| Everest Group Ltd. | 2.0 % |
| Encompass Health Corp. | 2.0 % |
https://www.williamblairfunds.com/literature/forms
1-800-742-7272
.
What were the Fund costs for the last six months?
(Based on a hypothetical $10,000 investment)
Fund |
Cost of $10,000 Investment |
Cost of $10,000 Investment as a percentage |
| Mid Cap Value Fund Class R6 | $ 35 |
0.70 % |
Management’s Discussion of Fund Performance
SUMMARY OF RESULTS
The Fund returned 1.96% (net of fees) for the 6 months ended June 30, 2025. The Fund underperformed its benchmark, the Russell Midcap
®
Value Index, which returned 3.12% and underperformed the Russell 3000®
Index, a broad measure of market performance, which returned 5.75%.The Fund’s underperformance Poor sector allocations in 6 of the 11 Global Industry Classification Standard economic sectors also detracted from relative performance. Conversely, positive stock selection in the Information Technology, Materials, and Health Care sectors contributed to relative performance in the period.
versus
its benchmark was driven by poor stock selection in the Financials, Consumer Discretionary, and Real Estate sectors. TOP PERFORMANCE CONTRIBUTORS
Jabil, Inc.
is a manufacturing services company, which serves automotive, consumer health, data centers, energy, and aerospace & defense sectors worldwide. Jabil has benefited from its diversified revenue segments with success in their cloud and data centers business fueled by artificial intelligence adoption. CACI International, Inc.
engages in the provision of information solutions and services in support of national security missions and government transformation for intelligence, defense, and federal civilian customers. CACI has benefited from increased defense spending caused by geopolitical uncertainty.Johnson Controls International, plc.
engages in the provision of products, solutions, and infrastructure which include fire detection & suppression, security, HVAC equipment, building automation and controls, digital, industrial refrigeration, residential & smart home, retail, distributed energy storage, and batteries. Johnson Controls has benefited from strong organic growth and a healthy order backlog.TOP PERFORMANCE DETRACTORS
ON Semiconductor Corp.
engages in the provision of intelligent power and sensing solutions with a primary focus on automative and industrial markets. The company’s large auto exposure has led to margin contraction, causing an overhang in the stock during most of the year-to-date period.Teleflex, Inc.
engages in the provision of medical technology products. Teleflex’s large supply chain exposure to China and Mexico coupled with weakness in their urology, interventional, anesthesia, and OEM businesses have continually hurt the stock.ICON plc.
is a clinical research organization, which engages in the provision of outsourced development services to the pharmaceutical, biotechnology, and medical device industries. ICON has suffered from their lowest book-to-bill ratio since 2016 caused by depressed R&D spend post COVID-19.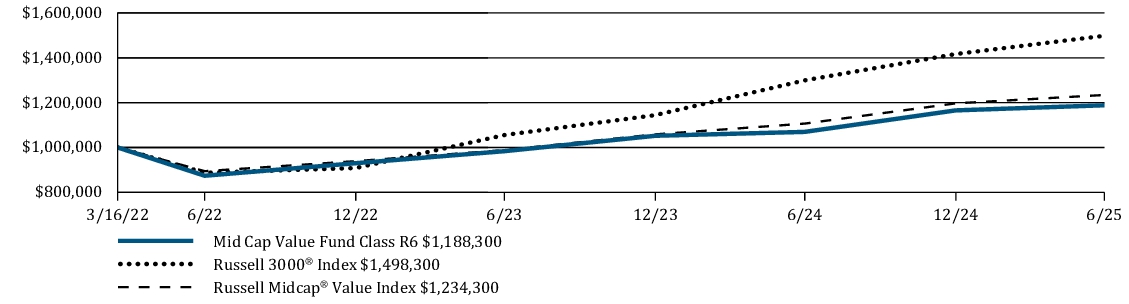
Average Annual Total Returns |
6 Months |
1 Year |
Since Inception |
Mid Cap Value Fund Class R6 |
1.96 % |
11.10 % |
5.37 % |
Russell 3000 ® Index |
5.75 % |
15.30 % |
13.05 % |
Russell Midcap ® Value Index |
3.12 % |
11.53 % |
6.60 % |
www.williamblairfunds.com/funds/total-returns
Key
Fund
StatisticsFund net assets (in $000s) |
$ 1,684 |
Number of portfolio holdings |
58 |
Net advisory fees paid (in $000s) |
$ 0 |
Portfolio turnover rate (six months) |
21 % |
Graphical Representation of Holdings
The tables below show the investment makeup of the
Fund
, representing percentage of the total net assets of the Fund.Top Ten Holdings
| STMicroelectronics N.V. | 2.2 % |
| Kirby Corporation | 2.1 % |
| KKR & Co., Inc. | 2.1 % |
| Amdocs Ltd. | 2.0 % |
| Regency Centers Corp. | 2.0 % |
| Flex Ltd. | 2.0 % |
| State Street Corporation | 2.0 % |
| Willis Towers Watson PLC | 2.0 % |
| Everest Group Ltd. | 2.0 % |
| Encompass Health Corp. | 2.0 % |
Sector Allocation
Top Ten Holdings
| STMicroelectronics N.V. | 2.2 % |
| Kirby Corporation | 2.1 % |
| KKR & Co., Inc. | 2.1 % |
| Amdocs Ltd. | 2.0 % |
| Regency Centers Corp. | 2.0 % |
| Flex Ltd. | 2.0 % |
| State Street Corporation | 2.0 % |
| Willis Towers Watson PLC | 2.0 % |
| Everest Group Ltd. | 2.0 % |
| Encompass Health Corp. | 2.0 % |
https://www.williamblairfunds.com/literature/forms
1-800-742-7272
.
What
were the Fund costs for the last six months?(Based on a hypothetical $10,000 investment)
Fund |
Cost of $10,000 Investment |
Cost of $10,000 Investment as a percentage |
| Small-Mid Cap Core Fund Class I | $ 47 |
0.95 % |
Management’s Discussion of Fund Performance
SUMMARY OF RESULTS
The Fund returned -3.08% (net of fees) for the 6 months ended June 30, 2025. The Fund underperformed its benchmark, the Russell 2500
™
Index, which returned 0.44% and underperformed the Russell 3000®
Index, a broad measure of market performance, which returned 5.75%.Relative performance was driven by a
combination
of stock-specific dynamics and style headwinds. From a style perspective, our underweight to unprofitable companies and bias towards more consistent business models were headwinds, which were concentrated in the latter half of the period. The Fund notably outperformed during the acute market correction from late February through the April 8th bottom but lagged during the strong recovery that followed, from April 9th to the end of the period. From a stock-specific perspective, our top individual detractors included New Fortress (Energy), Embecta (Health Care), e.l.f. Beauty (Consumer Staples), Neogen (Health Care) and ACV Auctions (Industrials). Stock selection in Consumer Staples and Information Technology also detracted from relative returns. Our top individual contributors included Talen Energy (Utilities), Gogo (Communication Services), Marex Group (Financials), Cameco (Energy) and Stride (Consumer Discretionary). TOP PERFORMANCE CONTRIBUTORS
Talen Energy
is an integrated independent power producer that sells to utilities and end users. Shares advanced during the period, in part due to an expanded relationship with Amazon. Talen announced a long-term power purchase agreement for its Susquehanna nuclear plant to provide carbon-free power to Amazon Web Services data centers in the region.Gogo Inc.
is a provider of telecommunication services (e.g., internet, phone, text) to personal and business jets via an owned network of air-to-ground cellular towers and Low-Earth-Orbit (“LEO”) satellites. The company reported earnings results that exceeded expectations, reiterated 2025 revenue guidance and provided commentary on a strong and growing pipeline for its LEO satellite internet product, Galileo.TOP PERFORMANCE DETRACTORS
New Fortress Energy
develops, finances and constructs liquified natural gas (LNG) assets and related infrastructure. Shares were pressured during the period as the likelihood of the company winning a material long-term gas contract with Puerto Rico declined, in part due to uncertainty regarding the terms of the contract. We liquidated our position.Embecta
is a manufacturer of the consumable needle used with multidose insulin and GLP-1 pens. The company reduced guidance in anticipation of store closures following the recent private equity purchase of Walgreens.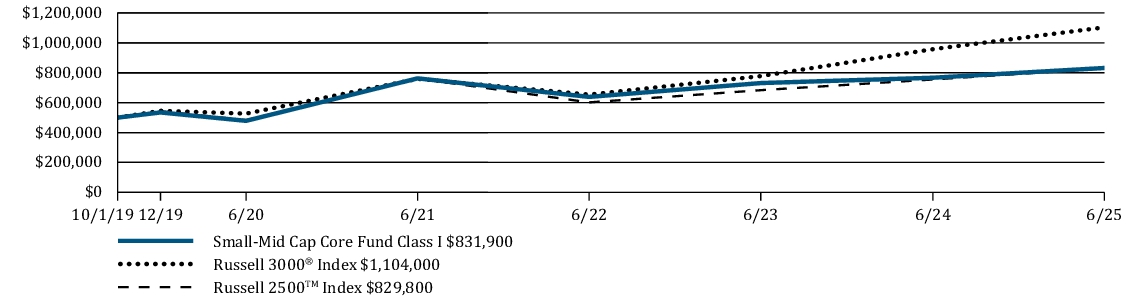
Average Annual Total Returns |
6 Months |
1 Year |
5 Years |
Since Inception |
Small-Mid Cap Core Fund Class I |
-3.08 % |
8.52 % |
11.71 % |
9.26 % |
Russell 3000 ® Index |
5.75 % |
15.30 % |
15.96 % |
14.76 % |
Russell 2500 ™ Index |
0.44 % |
9.91 % |
11.44 % |
9.21 % |
www.williamblairfunds.com/funds/total-returns
Key
Fund
StatisticsFund net assets (in $000s) |
$ 128,710 |
Number of portfolio holdings |
85 |
Net advisory fees paid (in $000s) |
$ 391 |
Portfolio turnover rate (six months) |
40 % |
Graphical
Representation of HoldingsThe tables below show the investment makeup of the Fund, representing percentage of the total net assets of the Fund.
Top
Ten
Holdings| Talen Energy Corporation | 2.2 % |
| Baldwin Insurance Group, Inc. | 2.0 % |
| Everest Group Ltd. | 2.0 % |
| CACI International, Inc. | 1.9 % |
| Primo Brands Corporation | 1.9 % |
| Diebold Nixdorf, Inc. | 1.9 % |
| Carlyle Group, Inc. | 1.8 % |
| Doximity, Inc. | 1.8 % |
| Western Alliance Bancorp | 1.8 % |
| SharkNinja, Inc. | 1.7 % |
Sector Allocation
Top
Ten
Holdings| Talen Energy Corporation | 2.2 % |
| Baldwin Insurance Group, Inc. | 2.0 % |
| Everest Group Ltd. | 2.0 % |
| CACI International, Inc. | 1.9 % |
| Primo Brands Corporation | 1.9 % |
| Diebold Nixdorf, Inc. | 1.9 % |
| Carlyle Group, Inc. | 1.8 % |
| Doximity, Inc. | 1.8 % |
| Western Alliance Bancorp | 1.8 % |
| SharkNinja, Inc. | 1.7 % |
https://www.williamblairfunds.com/literature/forms
1-800-742-7272
.
What were the Fund costs for the last six months?
(Based on a hypothetical $10,000 investment)
Fund | Cost of $10,000 Investment | Cost of $10,000 Investment as a percentage |
| Small-Mid Cap Core Fund Class R6 | $ 44 | 0.90 % |
Management’s Discussion of Fund Performance
SUMMARY OF RESULTS
The Fund returned -3.07% (net of fees) for the 6 months ended June 30, 2025. The Fund underperformed its benchmark, the Russell 2500
™
Index, which returned 0.44% and underperformed the Russell 3000®
Index, a broad measure of market performance, which returned 5.75%.Relative performance
was
driven by a combination of stock-specific dynamics and style headwinds. From a style perspective, our underweight to unprofitable companies and bias towards more consistent business models were headwinds, which were concentrated in the latter half of the period. The Fund notably outperformed during the acute market correction from late February through the April 8th bottom but lagged during the strong recovery that followed, from April 9th to the end of the period. From a stock-specific perspective, our top individual detractors included New Fortress (Energy), Embecta (Health Care), e.l.f. Beauty (Consumer Staples), Neogen (Health Care) and ACV Auctions (Industrials). Stock selection in Consumer Staples and Information Technology also detracted from relative returns. Our top individual contributors included Talen Energy (Utilities), Gogo (Communication Services), Marex Group (Financials), Cameco (Energy) and Stride (Consumer Discretionary). TOP PERFORMANCE CONTRIBUTORS
Talen Energy
is an integrated independent power producer that sells to utilities and end users. Shares advanced during the period, in part due to an expanded relationship with Amazon. Talen announced a long-term power purchase agreement for its Susquehanna nuclear plant to provide carbon-free power to Amazon Web Services data centers in the region.Gogo Inc.
is a provider of telecommunication services (e.g., internet, phone, text) to personal and business jets via an owned network of air-to-ground cellular towers and Low-Earth-Orbit (“LEO”) satellites. The company reported earnings results that exceeded expectations, reiterated 2025 revenue guidance and provided commentary on a strong and growing pipeline for its LEO satellite internet product, Galileo.TOP PERFORMANCE DETRACTORS
New Fortress Energy
develops, finances and constructs liquified natural gas (LNG) assets and related infrastructure. Shares were pressured during the period as the likelihood of the company winning a material long-term gas contract with Puerto Rico declined, in part due to uncertainty regarding the terms of the contract. We liquidated our position.Embecta
is a manufacturer of the consumable needle used with multidose insulin and GLP-1 pens. The company reduced guidance in anticipation of store closures following the recent private equity purchase of Walgreens.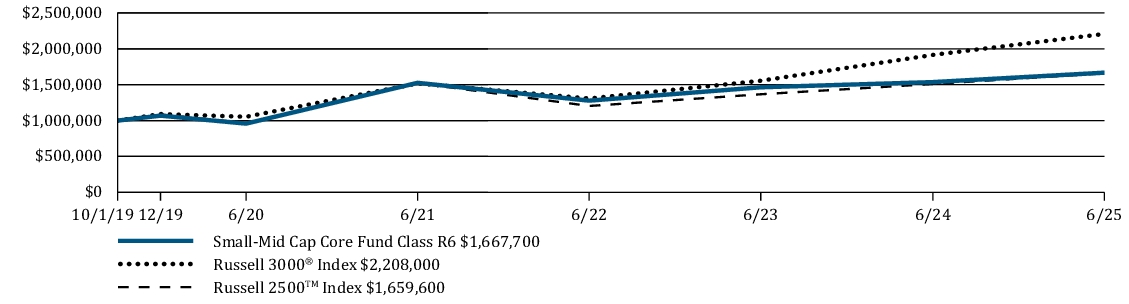
Average Annual Total Returns | 6 Months | 1 Year | 5 Years | Since Inception |
Small-Mid Cap Core Fund Class R6 | -3.07 % | 8.57 % | 11.73 % | 9.30 % |
Russell 3000 ® Index | 5.75 % | 15.30 % | 15.96 % | 14.76 % |
Russell 2500 ™ Index | 0.44 % | 9.91 % | 11.44 % | 9.21 % |
www.williamblairfunds.com/funds/total-returns
Key
Fund
StatisticsFund net assets (in $000s) | $ 128,710 |
Number of portfolio holdings | 85 |
Net advisory fees paid (in $000s) | $ 391 |
Portfolio turnover rate (six months) | 40 % |
Graphical
Representation of HoldingsThe tables below show the investment makeup of the Fund, representing percentage of the total net assets of the Fund.
Top Ten Holdings
| Talen Energy Corporation | 2.2 % |
| Baldwin Insurance Group, Inc. | 2.0 % |
| Everest Group Ltd. | 2.0 % |
| CACI International, Inc. | 1.9 % |
| Primo Brands Corporation | 1.9 % |
| Diebold Nixdorf, Inc. | 1.9 % |
| Carlyle Group, Inc. | 1.8 % |
| Doximity, Inc. | 1.8 % |
| Western Alliance Bancorp | 1.8 % |
| SharkNinja, Inc. | 1.7 % |
Sector Allocation

Top Ten Holdings
| Talen Energy Corporation | 2.2 % |
| Baldwin Insurance Group, Inc. | 2.0 % |
| Everest Group Ltd. | 2.0 % |
| CACI International, Inc. | 1.9 % |
| Primo Brands Corporation | 1.9 % |
| Diebold Nixdorf, Inc. | 1.9 % |
| Carlyle Group, Inc. | 1.8 % |
| Doximity, Inc. | 1.8 % |
| Western Alliance Bancorp | 1.8 % |
| SharkNinja, Inc. | 1.7 % |
https://www.williamblairfunds.com/literature/forms
1-800-742-7272
.
What were the Fund costs for the last six months?
(Based on a hypothetical $10,000 investment)
Fund |
Cost of $10,000 Investment |
Cost of $10,000 Investment as a percentage |
| Small-Mid Cap Growth Fund Class I | $ 48 |
0.99 % |
Management’s Discussion of Fund Performance
SUMMARY OF RESULTS
The Fund returned -6.39% (net of fees) for the 6 months ended June 30, 2025. The Fund underperformed its benchmark, the Russell 2500
™
Growth Index, which returned -0.71% and underperformed the Russell 3000®
Index, a broad measure of market performance, which returned 5.75%.The Fund's relative performance was driven by a combination of stock-specific dynamics and style headwinds. From a style perspective, our underweight to unprofitable companies and bias towards more consistent business models were headwinds, which were concentrated in the latter half of the period. The Fund notably outperformed during the acute market correction from late February through the April 8th bottom but lagged during the strong recovery that followed, from April 9th to the end of the period. From a stock-specific perspective, our selection in Consumer Staples, including our positions in e.l.f. Beauty and Freshpet, and Financials, including our position in Flywire, detracted from relative performance. Other laggards included New Fortress (Energy) and Neogen (Health Care). Our top individual contributors included Talen Energy (Utilities), Stride (Consumer Discretionary), Cameco (Energy), Curtiss-Wright (Industrials) and Blueprint Medicines (Health Care).
TOP PERFORMANCE CONTRIBUTORS
Talen Energy
is an integrated independent power producer that sells to utilities and end users. Shares advanced during the period, in part due to an expanded relationship with Amazon. Talen announced a long-term power purchase agreement for its Susquehanna nuclear plant to provide carbon-free power to Amazon Web Services data centers in the region. Stride
is a leading provider of online and blended education programs. The company reported strong enrollment growth across its general and career education segments.TOP PERFORMANCE DETRACTORS
New Fortress Energy
develops, finances and constructs liquified natural gas (LNG) assets and related infrastructure. Shares were pressured during the period as the likelihood of the company winning a material long-term gas contract with Puerto Rico declined, in part due to uncertainty regarding the terms of the contract. We liquidated our position.e.l.f. Beauty
designs and manufactures premium quality cosmetic and skincare products with broad appeal at accessible price points under the e.l.f., Well People, Keys Soulcare and Naturium brands. Shares declined during the period on disappointing new product innovations and tariff headwinds.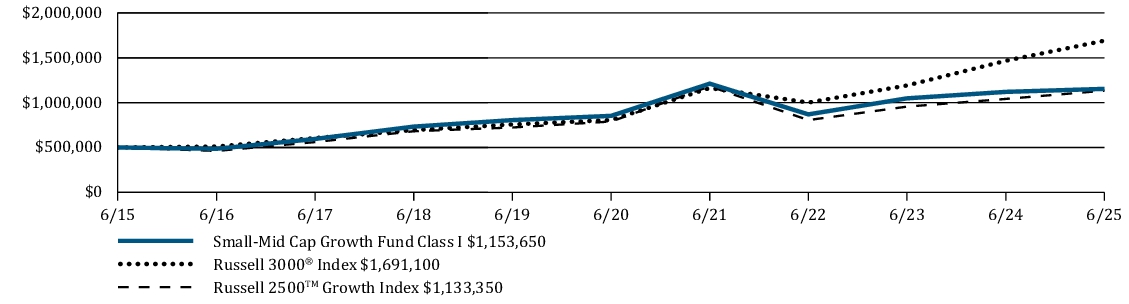
Average Annual Total Returns |
6 Months |
1 Year |
5 Years |
10 Years |
Small-Mid Cap Growth Fund Class I |
-6.39 % |
3.01 % |
6.23 % |
8.72 % |
Russell 3000 ® Index |
5.75 % |
15.30 % |
15.96 % |
12.96 % |
Russell 2500 ™ Growth Index |
-0.71 % |
8.81 % |
7.50 % |
8.53 % |
www.williamblairfunds.com/funds/total-returns
Key
Fund StatisticsFund net assets (in $000s) |
$ 1,443,299 |
Number of portfolio holdings |
75 |
Net advisory fees paid (in $000s) |
$ 6,371 |
Portfolio turnover rate (six months) |
29 % |
Graphical Representation of Holdings
The tables below show the investment makeup of the Fund, representing percentage of the total net assets of the Fund.
Top Ten Holdings
| Talen Energy Corporation | 3.1 % |
| Pure Storage, Inc. | 2.6 % |
| Cameco Corp. | 2.5 % |
| Primo Brands Corporation | 2.4 % |
| Doximity, Inc. | 2.4 % |
| nVent Electric PLC | 2.1 % |
| Mercury Systems, Inc. | 2.0 % |
| Dynatrace, Inc. | 2.0 % |
| Ciena Corporation | 2.0 % |
| Manhattan Associates, Inc. | 1.9 % |
Sector Allocation

Top Ten Holdings
| Talen Energy Corporation | 3.1 % |
| Pure Storage, Inc. | 2.6 % |
| Cameco Corp. | 2.5 % |
| Primo Brands Corporation | 2.4 % |
| Doximity, Inc. | 2.4 % |
| nVent Electric PLC | 2.1 % |
| Mercury Systems, Inc. | 2.0 % |
| Dynatrace, Inc. | 2.0 % |
| Ciena Corporation | 2.0 % |
| Manhattan Associates, Inc. | 1.9 % |
https://www.williamblairfunds.com/literature/forms
1-800-742-7272
.
What were the Fund costs for the last six months?
(Based on a hypothetical $10,000 investment)
Fund | Cost of $10,000 Investment | Cost of $10,000 Investment as a percentage |
| Small-Mid Cap Growth Fund Class N | $ 60 | 1.24 % |
Management’s Discussion of Fund Performance
SUMMARY OF RESULTS
The Fund returned -6.52% (net of fees) for the 6 months ended June 30, 2025. The Fund underperformed its benchmark, the Russell 2500
™
Growth Index, which returned -0.71% and underperformed the Russell 3000®
Index, a broad measure of market performance, which returned 5.75%.The Fund's relative performance was driven by a combination of stock-specific dynamics and style headwinds. From a style perspective, our underweight to unprofitable companies and bias towards more consistent business models were headwinds, which were concentrated in the latter half of the period. The Fund notably outperformed during the acute market correction from late February through the April 8th bottom but lagged during the strong recovery that followed, from April 9th to the end of the period. From a stock-specific perspective, our selection in Consumer Staples, including our positions in e.l.f. Beauty and Freshpet, and Financials, including our position in Flywire, detracted from relative performance. Other laggards included New Fortress (Energy) and Neogen (Health Care). Our top individual contributors included Talen Energy (Utilities), Stride (Consumer Discretionary), Cameco (Energy), Curtiss-Wright (Industrials) and Blueprint Medicines (Health Care).
TOP PERFORMANCE CONTRIBUTORS
Talen Energy
is an integrated independent power producer that sells to utilities and end users. Shares advanced during the period, in part due to an expanded relationship with Amazon. Talen announced a long-term power purchase agreement for its Susquehanna nuclear plant to provide carbon-free power to Amazon Web Services data centers in the region. Stride
is a leading provider of online and blended education programs. The company reported strong enrollment growth across its general and career education segments.TOP PERFORMANCE DETRACTORS
New Fortress Energy
develops, finances and constructs liquified natural gas (LNG) assets and related infrastructure. Shares were pressured during the period as the likelihood of the company winning a material long-term gas contract with Puerto Rico declined, in part due to uncertainty regarding the terms of the contract. We liquidated our position.e.l.f. Beauty
designs and manufactures premium quality cosmetic and skincare products with broad appeal at accessible price points under the e.l.f., Well People, Keys Soulcare and Naturium brands. Shares declined during the period on disappointing new product innovations and tariff headwinds.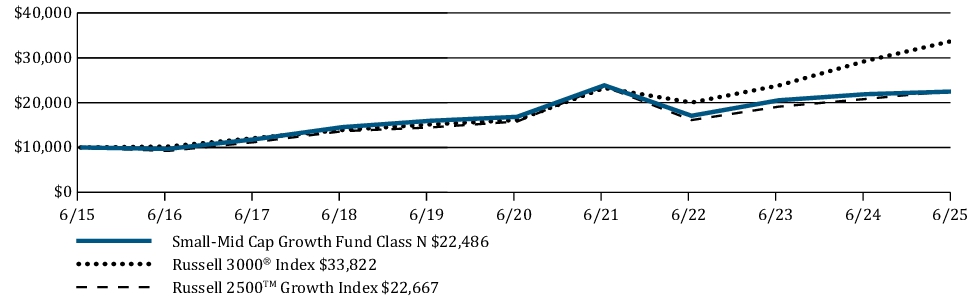
Average Annual Total Returns | 6 Months | 1 Year | 5 Years | 10 Years |
Small-Mid Cap Growth Fund Class N | -6.52 % | 2.73 % | 5.96 % | 8.44 % |
Russell 3000 ® Index | 5.75 % | 15.30 % | 15.96 % | 12.96 % |
Russell 2500 ™ Growth Index | -0.71 % | 8.81 % | 7.50 % | 8.53 % |
www.williamblairfunds.com/funds/total-returns
Key Fund Statistics
Fund net assets (in $000s) | $ 1,443,299 |
Number of portfolio holdings | 75 |
Net advisory fees paid (in $000s) | $ 6,371 |
Portfolio turnover rate (six months) | 29 % |
Graphical Representation of Holdings
The tables below show the investment makeup of the Fund, representing percentage of the total net assets of the Fund.
Top Ten Holdings
| Talen Energy Corporation | 3.1 % |
| Pure Storage, Inc. | 2.6 % |
| Cameco Corp. | 2.5 % |
| Primo Brands Corporation | 2.4 % |
| Doximity, Inc. | 2.4 % |
| nVent Electric PLC | 2.1 % |
| Mercury Systems, Inc. | 2.0 % |
| Dynatrace, Inc. | 2.0 % |
| Ciena Corporation | 2.0 % |
| Manhattan Associates, Inc. | 1.9 % |
Sector Allocation

Top Ten Holdings
| Talen Energy Corporation | 3.1 % |
| Pure Storage, Inc. | 2.6 % |
| Cameco Corp. | 2.5 % |
| Primo Brands Corporation | 2.4 % |
| Doximity, Inc. | 2.4 % |
| nVent Electric PLC | 2.1 % |
| Mercury Systems, Inc. | 2.0 % |
| Dynatrace, Inc. | 2.0 % |
| Ciena Corporation | 2.0 % |
| Manhattan Associates, Inc. | 1.9 % |
https://www.williamblairfunds.com/literature/forms
1-800-742-7272
.
What were the Fund costs for the last six months?
(Based on a hypothetical $10,000 investment)
Fund | Cost of $10,000 Investment | Cost of $10,000 Investment as a percentage |
| Small-Mid Cap Growth Fund Class R6 | $ 46 | 0.94 % |
Management’s Discussion of Fund Performance
SUMMARY OF RESULTS
The Fund returned -6.36% (net of fees) for the 6 months ended June 30, 2025. The Fund underperformed its benchmark, the Russell 2500
™
Growth Index, which returned -0.71% and underperformed the Russell 3000®
Index, a broad measure of market performance, which returned 5.75%.The Fund's relative performance was driven by a combination of stock-specific dynamics and style headwinds. From a style perspective, our underweight to unprofitable companies and bias towards more consistent business models were headwinds, which were concentrated in the latter half of the period. The Fund notably outperformed during the acute market correction from late February through the April 8th bottom but lagged during the strong recovery that followed, from April 9th to the end of the period. From a stock-specific perspective, our selection in Consumer Staples, including our positions in e.l.f. Beauty and Freshpet, and Financials, including our position in Flywire, detracted from relative performance. Other laggards included New Fortress (Energy) and Neogen (Health Care). Our top individual contributors included Talen Energy (Utilities), Stride (Consumer Discretionary), Cameco (Energy), Curtiss-Wright (Industrials) and Blueprint Medicines (Health Care).
TOP PERFORMANCE CONTRIBUTORS
Talen Energy
is an integrated independent power producer that sells to utilities and end users. Shares advanced during the period, in part due to an expanded relationship with Amazon. Talen announced a long-term power purchase agreement for its Susquehanna nuclear plant to provide carbon-free power to Amazon Web Services data centers in the region. Stride
is a leading provider of online and blended education programs. The company reported strong enrollment growth across its general and career education segments.TOP PERFORMANCE DETRACTORS
New Fortress Energy
develops, finances and constructs liquified natural gas (LNG) assets and related infrastructure. Shares were pressured during the period as the likelihood of the company winning a material long-term gas contract with Puerto Rico declined, in part due to uncertainty regarding the terms of the contract. We liquidated our position.e.l.f. Beauty
designs and manufactures premium quality cosmetic and skincare products with broad appeal at accessible price points under the e.l.f., Well People, Keys Soulcare and Naturium brands. Shares declined during the period on disappointing new product innovations and tariff headwinds.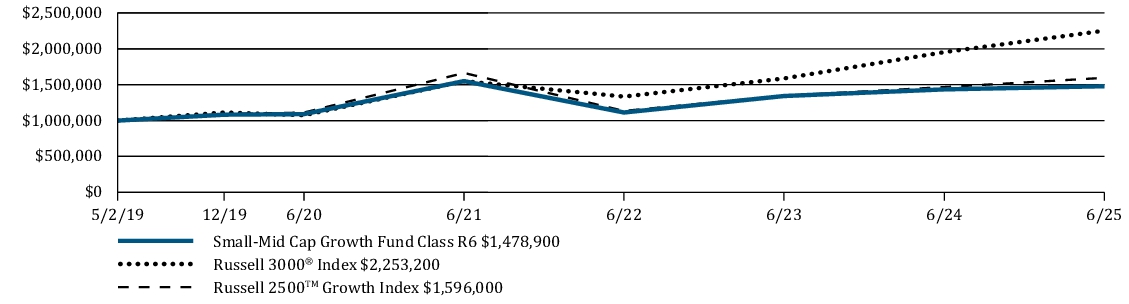
Average Annual Total Returns | 6 Months | 1 Year | 5 Years | Since Inception |
Small-Mid Cap Growth Fund Class R6 | -6.36 % | 3.07 % | 6.28 % | 6.55 % |
Russell 3000 ® Index | 5.75 % | 15.30 % | 15.96 % | 14.07 % |
Russell 2500 ™ Growth Index | -0.71 % | 8.81 % | 7.50 % | 7.88 % |
www.williamblairfunds.com/funds/total-returns
Key Fund Statistics
Fund net assets (in $000s) | $ 1,443,299 |
Number of portfolio holdings | 75 |
Net advisory fees paid (in $000s) | $ 6,371 |
Portfolio turnover rate (six months) | 29 % |
Graphical
Representation of HoldingsThe tables below show the investment makeup of the Fund, representing percentage of the total net assets of the Fund.
Top Ten Holdings
| Talen Energy Corporation | 3.1 % |
| Pure Storage, Inc. | 2.6 % |
| Cameco Corp. | 2.5 % |
| Primo Brands Corporation | 2.4 % |
| Doximity, Inc. | 2.4 % |
| nVent Electric PLC | 2.1 % |
| Mercury Systems, Inc. | 2.0 % |
| Dynatrace, Inc. | 2.0 % |
| Ciena Corporation | 2.0 % |
| Manhattan Associates, Inc. | 1.9 % |
Sector Allocation
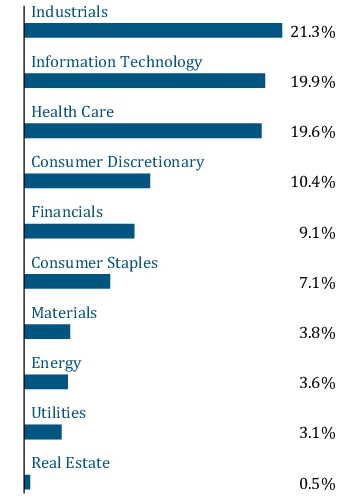
Top Ten Holdings
| Talen Energy Corporation | 3.1 % |
| Pure Storage, Inc. | 2.6 % |
| Cameco Corp. | 2.5 % |
| Primo Brands Corporation | 2.4 % |
| Doximity, Inc. | 2.4 % |
| nVent Electric PLC | 2.1 % |
| Mercury Systems, Inc. | 2.0 % |
| Dynatrace, Inc. | 2.0 % |
| Ciena Corporation | 2.0 % |
| Manhattan Associates, Inc. | 1.9 % |
https://www.williamblairfunds.com/literature/forms
1-800-742-7272
.
What were the Fund costs for the last six months?
(Based on a hypothetical $10,000 investment)
Fund | Cost of $10,000 Investment | Cost of $10,000 Investment as a percentage |
| Small-Mid Cap Value Fund Class I | $ 42 | 0.85 % |
Management’s Discussion of Fund Performance
SUMMARY OF RESULTS
The Fund returned -3.92% (net of fees) for the 6 months ended June 30, 2025. The Fund underperformed its benchmark, the Russell 2500
®
Value Index, which returned 1.03% and underperformed the Russell 3000®
Index, a broad measure of market performance, which returned 5.75%.The Fund’s underperformance versus its benchmark was driven by poor sector stock selection in the Financials, Energy, and Consumer Discretionary sectors. Conversely, the Fund had positive sector allocations in 6 of the 11 Global Industry Classification Standard economic sectors during the period. Positive stock selection contributed to relative performance in the Materials, Real Estate, and Information Technology sectors in the period.
TOP PERFORMANCE CONTRIBUTORS
Jabil, Inc.
is a manufacturing services company, which serves automotive, consumer health, data centers, energy, and aerospace & defense sectors worldwide. Jabil has benefited from its diversified revenue segments with success in their cloud and data centers business fueled by artificial intelligence adoption. Flex, Ltd.
is an electronics manufacturing services company that designs and develops original design manufacturing products for aerospace & defense, cloud, digital health, lighting, housing, energy, industrial, and communication industries. Flex has been able to achieve strong operating margins, thus generating significant free cash flow. CACI International, Inc.
engages in the provision of information solutions and services in support of national security missions and government transformation for intelligence, defense, and federal civilian customers. CACI has benefited from increased defense spending
caused by geopolitical uncertainty.TOP PERFORMANCE DETRACTORS
Compass Diversified Holdings
is an investment holding company, which acquires controlling interests in small to middle-market businesses. A restatement of financials in their largest portfolio company due to accounting irregularities caused a sharp sell-off.Acadia Healthcare Co., Inc.
engages in the provision of behavioral healthcare services across the U.S. Acadia’s fundamentals have been weaker on the heels of damaging headlines in the press, as well as lawsuits citing abuse in multiple facilities.SM Energy Co.
is an independent energy & production company, which specializes in natural gas and crude oil. E&P companies have broadly struggled due to oil price volatility caused by geopolitical tensions and OPEC supply.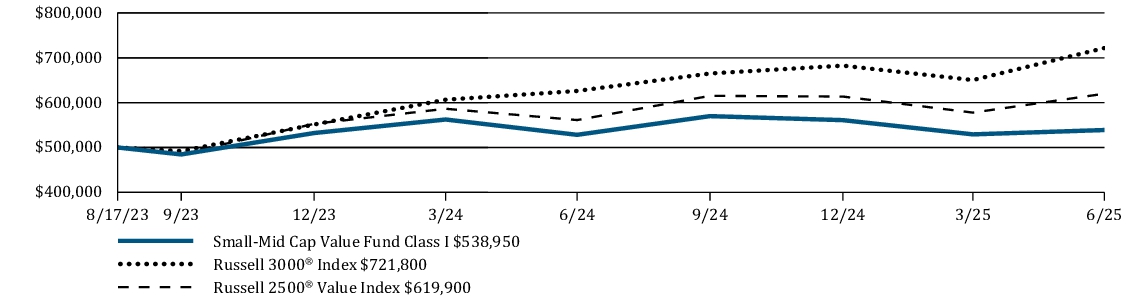
Average Annual Total Returns | 6 Months | 1 Year | Since Inception |
Small-Mid Cap Value Fund Class I | -3.92 % | 2.03 % | 4.09 % |
Russell 3000 ® Index | 5.75 % | 15.30 % | 21.68 % |
Russell 2500 ® Value Index | 1.03 % | 10.47 % | 12.17 % |
www.williamblairfunds.com/funds/total-returns
Key Fund Statistics
Fund net assets (in $000s) | $ 3,221 |
Number of portfolio holdings | 82 |
Net advisory fees paid (in $000s) | $ 0 |
Portfolio turnover rate (six months) | 27 % |
Graphical Representation of Holdings
The tables below show the investment makeup of the Fund, representing percentage of the total net assets of the
Fund
.Top Ten Holdings
| American Financial Group, Inc. | 1.5 % |
| Selective Insurance Group, Inc. | 1.5 % |
| Allison Transmission Holdings, Inc. | 1.5 % |
| Flex Ltd. | 1.5 % |
| Carlyle Group, Inc. | 1.5 % |
| Everest Group Ltd. | 1.5 % |
| Allegion PLC | 1.5 % |
| Amdocs Ltd. | 1.4 % |
| Openlane, Inc. | 1.4 % |
| Crown Holdings, Inc. | 1.4 % |
Sector Allocation
Top Ten Holdings
| American Financial Group, Inc. | 1.5 % |
| Selective Insurance Group, Inc. | 1.5 % |
| Allison Transmission Holdings, Inc. | 1.5 % |
| Flex Ltd. | 1.5 % |
| Carlyle Group, Inc. | 1.5 % |
| Everest Group Ltd. | 1.5 % |
| Allegion PLC | 1.5 % |
| Amdocs Ltd. | 1.4 % |
| Openlane, Inc. | 1.4 % |
| Crown Holdings, Inc. | 1.4 % |
https://www.williamblairfunds.com/literature/forms
1-800-742-7272
.
What were the Fund costs for the last six months?
(Based on a hypothetical $10,000 investment)
Fund | Cost of $10,000 Investment | Cost of $10,000 Investment as a percentage |
| Small-Mid Cap Value Fund Class R6 | $ 39 | 0.80 % |
Management’s Discussion of Fund Performance
SUMMARY OF RESULTS
The Fund returned -3.83% (net of fees) for the 6 months ended June 30, 2025. The Fund underperformed its benchmark, the Russell 2500
®
Value Index, which returned 1.03% and underperformed the Russell 3000®
Index, a broad measure of market performance, which returned 5.75%.The Fund’s underperformance versus its benchmark was driven by poor sector stock selection in the Financials, Energy, and Consumer Discretionary sectors. Conversely, the Fund had positive sector allocations in 6 of the 11 Global Industry Classification Standard economic sectors during the period. Positive stock selection contributed to relative performance in the Materials, Real Estate, and Information Technology sectors in the period.
TOP PERFORMANCE CONTRIBUTORS
Jabil, Inc.
is a manufacturing services company, which serves automotive, consumer health, data centers, energy, and aerospace & defense sectors worldwide. Jabil has benefited from its diversified revenue segments with success in their cloud and data centers business fueled by artificial intelligence adoption. Flex, Ltd.
is an electronics manufacturing services company that designs and develops original design manufacturing products for aerospace & defense, cloud, digital health, lighting, housing, energy, industrial, and communication industries. Flex has been able to achieve strong operating margins, thus generating significant free cash flow. CACI International, Inc.
engages in the provision of information solutions and services in support of national security missions and government transformation for intelligence, defense, and federal civilian customers. CACI has benefited from increased defense spending caused by geopolitical uncertainty.TOP PERFORMANCE DETRACTORS
Compass Diversified Holdings
is an investment holding company, which acquires controlling interests in small to middle-market businesses. A restatement of financials in their largest portfolio company due to accounting irregularities caused a sharp sell-off.Acadia Healthcare Co., Inc.
engages in the provision of behavioral healthcare services across the U.S. Acadia’s
fundamentals have been weaker on the heels of damaging headlines in the press, as well as lawsuits citing abuse in multiple facilities.SM Energy Co.
is an independent energy & production company, which specializes in natural gas and crude oil. E&P companies have broadly struggled due to oil price volatility caused by geopolitical tensions and OPEC supply.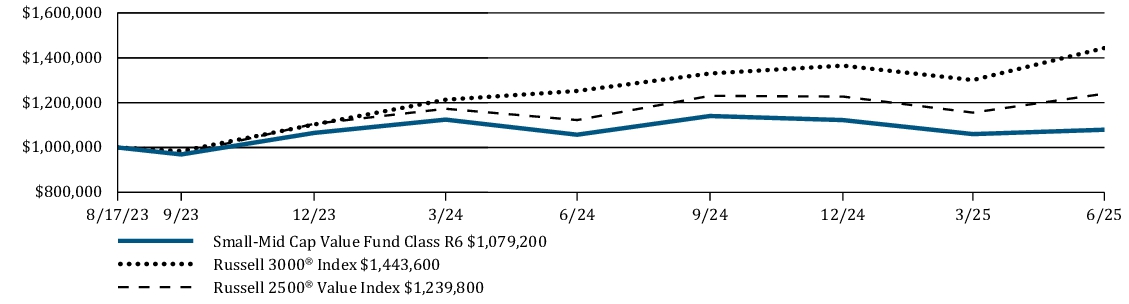
Average Annual Total Returns | 6 Months | 1 Year | Since Inception |
Small-Mid Cap Value Fund Class R6 | -3.83 % | 2.10 % | 4.15 % |
Russell 3000 ® Index | 5.75 % | 15.30 % | 21.68 % |
Russell 2500 ® Value Index | 1.03 % | 10.47 % | 12.17 % |
www.williamblairfunds.com/funds/total-returns
Key Fund Statistics
Fund net assets (in $000s) | $ 3,221 |
Number of portfolio holdings | 82 |
Net advisory fees paid (in $000s) | $ 0 |
Portfolio turnover rate (six months) | 27 % |
Graphical Representation of Holdings
The tables below show the investment makeup of the Fund, representing percentage of the total net assets of the Fund.
Top Ten Holdings
| American Financial Group, Inc. | 1.5 % |
| Selective Insurance Group, Inc. | 1.5 % |
| Allison Transmission Holdings, Inc. | 1.5 % |
| Flex Ltd. | 1.5 % |
| Carlyle Group, Inc. | 1.5 % |
| Everest Group Ltd. | 1.5 % |
| Allegion PLC | 1.5 % |
| Amdocs Ltd. | 1.4 % |
| Openlane, Inc. | 1.4 % |
| Crown Holdings, Inc. | 1.4 % |
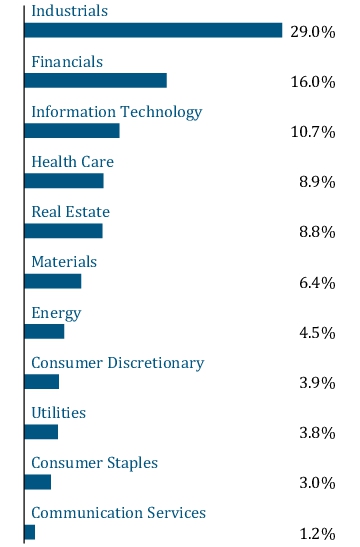
Sector Allocation

Top Ten Holdings
| American Financial Group, Inc. | 1.5 % |
| Selective Insurance Group, Inc. | 1.5 % |
| Allison Transmission Holdings, Inc. | 1.5 % |
| Flex Ltd. | 1.5 % |
| Carlyle Group, Inc. | 1.5 % |
| Everest Group Ltd. | 1.5 % |
| Allegion PLC | 1.5 % |
| Amdocs Ltd. | 1.4 % |
| Openlane, Inc. | 1.4 % |
| Crown Holdings, Inc. | 1.4 % |
https://www.williamblairfunds.com/literature/forms
1-800-742-7272
.
What were the Fund costs for the last six months?
(Based on a hypothetical $10,000 investment)
Fund |
Cost of $10,000 Investment |
Cost of $10,000 Investment as a percentage |
| Small Cap Growth Fund Class I | $ 48 |
0.99 % |
Management’s Discussion of Fund Performance
SUMMARY OF RESULTS
The Fund returned -5.26% (net of fees) for the 6 months ended June 30, 2025. The Fund underperformed its benchmark, the Russell 2000
®
Growth Index, which returned -0.48% and underperformed the Russell 3000®
Index, a broad measure of market performance, which returned 5.75%.The Fund’s underperformance was primarily driven by stock-specific dynamics. The Fund notably outperformed during the acute market correction from late February through the April 8th bottom but lagged during the strong recovery that followed, from April 9th to the end of the period. The top detractors included New Fortress Energy (Energy), Credo Technologies (Information Technology), Flywire (Financials), Neogen (Health Care), and Acadia Healthcare (Health Care). The top contributors were Gogo Inc. (Information Technology), JFrog (Information Technology), Marex Group (Financials), Alignment Healthcare (Health Care), and Mercury Systems (Industrials).
TOP PERFORMANCE
CONTRIBUTORS
Gogo Inc.
is a provider of telecommunication services (e.g., internet, phone, text) to personal and business jets via an owned network of air-to-ground cellular towers and Low-Earth-Orbit (“LEO”) satellites. The company reported earnings results that exceeded expectations, reiterated 2025 revenue guidance and provided commentary on a strong and growing pipeline for its LEO satellite internet product, Galileo.JFrog
is the dominant provider of binary repositories, a very strategic component in modern software development workflows. The stock outperformed due to strong cloud revenue growth and key performance indicators. The company also secured a deal with a major artificial intelligence technology leader to manage their model delivery and agent services. TOP PERFORMANCE DETRACTORS
New Fortress Energy
develops, finances and constructs liquified natural gas (LNG) assets and related infrastructure. Shares were pressured during the period as the likelihood of the company winning a material long-term gas contract with Puerto Rico declined, in part due to uncertainty regarding the terms of the contract. We liquidated our position.Flywire
is a leading, global payments enablement and software company. Shares underperformed due to a decline in international student visa approvals impacting education demand. Compounding concerns, the company initiated a restructuring plan and announced a broad strategic review. We sold our position during the period. 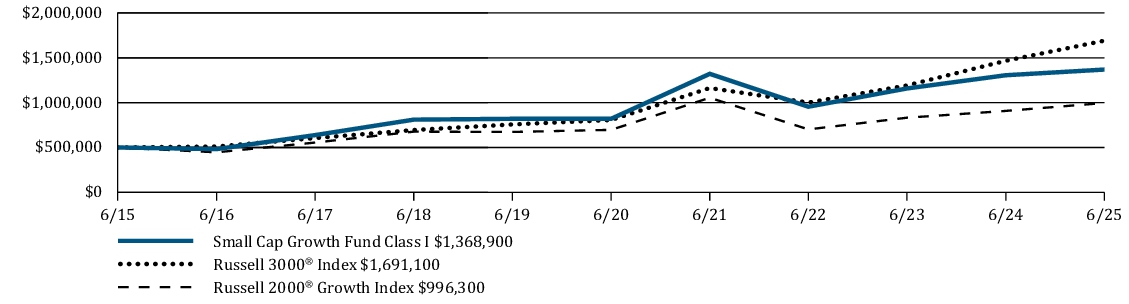
Average Annual Total Returns |
6 Months |
1 Year |
5 Years |
10 Years |
Small Cap Growth Fund Class I |
-5.26 % |
4.85 % |
10.79 % |
10.60 % |
Russell 3000 ® Index |
5.75 % |
15.30 % |
15.96 % |
12.96 % |
Russell 2000 ® Growth Index |
-0.48 % |
9.73 % |
7.42 % |
7.14 % |
www.williamblairfunds.com/funds/total-returns
Key Fund Statistics
Fund net assets (in $000s) |
$ 897,307 |
Number of portfolio holdings |
92 |
Net advisory fees paid (in $000s) |
$ 3,633 |
Portfolio turnover rate (six months) |
36 % |
Graphical Representation of
Holdings
The tables below show the investment makeup of the Fund, representing percentage of the total net assets of the Fund.
Top Ten Holdings
| Casella Waste Systems, Inc. | 2.0 % |
| BWX Technologies, Inc. | 2.0 % |
| Brink's Co. | 1.9 % |
| Varonis Systems, Inc. | 1.8 % |
| Confluent, Inc. | 1.7 % |
| Montrose Environmental Group, Inc. | 1.7 % |
| Doximity, Inc. | 1.7 % |
| FirstService Corp. | 1.6 % |
| Q2 Holdings, Inc. | 1.6 % |
| Rush Street Interactive, Inc. | 1.5 % |
Sector Allocation

Top Ten Holdings
| Casella Waste Systems, Inc. | 2.0 % |
| BWX Technologies, Inc. | 2.0 % |
| Brink's Co. | 1.9 % |
| Varonis Systems, Inc. | 1.8 % |
| Confluent, Inc. | 1.7 % |
| Montrose Environmental Group, Inc. | 1.7 % |
| Doximity, Inc. | 1.7 % |
| FirstService Corp. | 1.6 % |
| Q2 Holdings, Inc. | 1.6 % |
| Rush Street Interactive, Inc. | 1.5 % |
https://www.williamblairfunds.com/literature/forms
1-800-742-7272
.
What were the Fund costs for the last six months?
(Based on a hypothetical $10,000 investment)
Fund | Cost of $10,000 Investment | Cost of $10,000 Investment as a percentage |
| Small Cap Growth Fund Class N | $ 60 | 1.24 % |
Management’s Discussion of Fund Performance
SUMMARY OF RESULTS
The Fund returned -5.38% (net of fees) for the 6 months ended June 30, 2025. The Fund underperformed its benchmark, the Russell 2000
®
Growth Index, which returned -0.48% and underperformed the Russell 3000®
Index, a broad measure of market performance, which returned 5.75%.The Fund’s underperformance was primarily driven by stock-specific dynamics. The Fund notably outperformed during the acute market correction from late February through the April 8th bottom but lagged during the strong recovery that followed, from April 9th to the end of the period. The top detractors included New Fortress Energy (Energy), Credo Technologies (Information Technology), Flywire (Financials), Neogen (Health Care), and Acadia Healthcare (Health Care). The top contributors were Gogo Inc. (Information Technology), JFrog (Information Technology), Marex Group (Financials), Alignment Healthcare (Health Care), and Mercury Systems (Industrials).
TOP PERFORMANCE
CONTRIBUTORS
Gogo Inc.
is a provider of telecommunication services (e.g., internet, phone, text) to personal and business jets via an owned network of air-to-ground cellular towers and Low-Earth-Orbit (“LEO”) satellites. The company reported earnings results that exceeded expectations, reiterated 2025 revenue guidance and provided commentary on a strong and growing pipeline for its LEO satellite internet product, Galileo.JFrog
is the dominant provider of binary repositories, a very strategic component in modern software development workflows. The stock outperformed due to strong cloud revenue growth and key performance indicators. The company also secured a deal with a major artificial intelligence technology leader to manage their model delivery and agent services. TOP PERFORMANCE DETRACTORS
New Fortress Energy
develops, finances and constructs liquified natural gas (LNG) assets and related infrastructure. Shares were pressured during the period as the likelihood of the company winning a material long-term gas contract with Puerto Rico declined, in part due to uncertainty regarding the terms of the contract. We liquidated our position.Flywire
is a leading, global payments enablement and software company. Shares underperformed due to a decline in international student visa approvals impacting education demand. Compounding concerns, the company initiated a restructuring plan and announced a broad strategic review. We sold our position during the period. 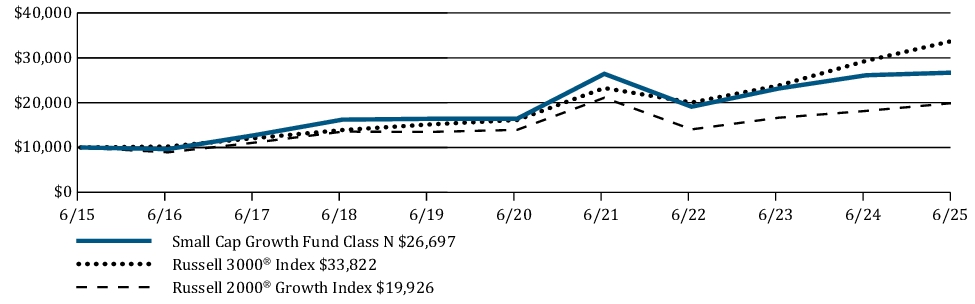
Average Annual Total Returns | 6 Months | 1 Year | 5 Years | 10 Years |
Small Cap Growth Fund Class N | -5.38 % | 4.59 % | 10.52 % | 10.32 % |
Russell 3000 ® Index | 5.75 % | 15.30 % | 15.96 % | 12.96 % |
Russell 2000 ® Growth Index | -0.48 % | 9.73 % | 7.42 % | 7.14 % |
www.williamblairfunds.com/funds/total-returns
Key Fund Statistics
Fund net assets (in $000s) | $ 897,307 |
Number of portfolio holdings | 92 |
Net advisory fees paid (in $000s) | $ 3,633 |
Portfolio turnover rate (six months) | 36 % |
Graphical Representation of
Holdings
The tables below show the investment makeup of the Fund, representing percentage of the total net assets of the Fund.
Top Ten Holdings
| Casella Waste Systems, Inc. | 2.0 % |
| BWX Technologies, Inc. | 2.0 % |
| Brink's Co. | 1.9 % |
| Varonis Systems, Inc. | 1.8 % |
| Confluent, Inc. | 1.7 % |
| Montrose Environmental Group, Inc. | 1.7 % |
| Doximity, Inc. | 1.7 % |
| FirstService Corp. | 1.6 % |
| Q2 Holdings, Inc. | 1.6 % |
| Rush Street Interactive, Inc. | 1.5 % |
Sector Allocation
Top Ten Holdings
| Casella Waste Systems, Inc. | 2.0 % |
| BWX Technologies, Inc. | 2.0 % |
| Brink's Co. | 1.9 % |
| Varonis Systems, Inc. | 1.8 % |
| Confluent, Inc. | 1.7 % |
| Montrose Environmental Group, Inc. | 1.7 % |
| Doximity, Inc. | 1.7 % |
| FirstService Corp. | 1.6 % |
| Q2 Holdings, Inc. | 1.6 % |
| Rush Street Interactive, Inc. | 1.5 % |
https://www.williamblairfunds.com/literature/forms
1-800-742-7272
.
What were the Fund costs for the last six months?
(Based on a hypothetical $10,000 investment)
Fund | Cost of $10,000 Investment | Cost of $10,000 Investment as a percentage |
| Small Cap Growth Fund Class R6 | $ 46 | 0.94 % |
Management’s Discussion of Fund Performance
SUMMARY OF RESULTS
The Fund returned -5.24% (net of fees) for the 6 months ended June 30, 2025. The Fund underperformed its benchmark, the Russell 2000
®
Growth Index, which returned -0.48% and underperformed the Russell 3000®
Index, a broad measure of market performance, which returned 5.75%.The Fund’s underperformance was primarily driven by stock-specific dynamics. The Fund notably outperformed during the acute market correction from late February through the April 8th bottom but lagged during the strong recovery that followed, from April 9th to the end of the period. The top detractors included New Fortress Energy (Energy), Credo Technologies (Information Technology), Flywire (Financials), Neogen (Health Care), and Acadia Healthcare (Health Care). The top contributors were Gogo Inc. (Information Technology), JFrog (Information Technology), Marex Group (Financials), Alignment Healthcare (Health Care), and Mercury Systems (Industrials).
TOP PERFORMANCE CONTRIBUTORS
Gogo Inc.
is a provider of telecommunication services (e.g., internet, phone, text) to personal and business jets via an owned network of air-to-ground cellular towers and Low-Earth-Orbit (“LEO”) satellites. The company reported earnings results that exceeded expectations, reiterated 2025 revenue guidance and provided commentary on a strong and growing pipeline for its LEO satellite internet product, Galileo.JFrog
is the dominant provider of binary repositories, a very strategic component in modern software development workflows. The stock outperformed due to strong cloud revenue growth and key performance indicators. The company also secured a deal with a major artificial intelligence technology leader to manage their model delivery and agent
services. TOP PERFORMANCE DETRACTORS
New Fortress Energy
develops, finances and constructs liquified natural gas (LNG) assets and related infrastructure. Shares were pressured during the period as the likelihood of the company winning a material long-term gas contract with Puerto Rico declined, in part due to uncertainty regarding the terms of the contract. We liquidated our position.Flywire
is a leading, global payments enablement and software company. Shares underperformed due to a decline in international student visa approvals impacting education demand. Compounding concerns, the company initiated a restructuring plan and announced a broad strategic review. We sold our position during the period. 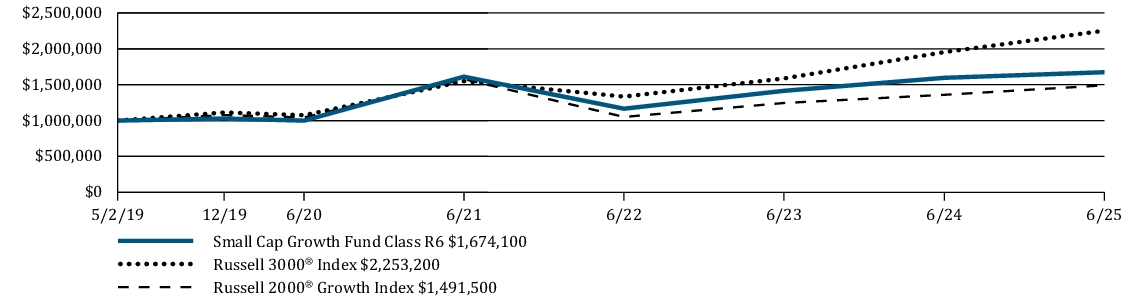
Average Annual Total Returns | 6 Months | 1 Year | 5 Years | Since Inception |
Small Cap Growth Fund Class R6 | -5.24 % | 4.89 % | 10.87 % | 8.72 % |
Russell 3000 ® Index | 5.75 % | 15.30 % | 15.96 % | 14.07 % |
Russell 2000 ® Growth Index | -0.48 % | 9.73 % | 7.42 % | 6.70 % |
www.williamblairfunds.com/funds/total-returns
Key Fund Statistics
Fund net assets (in $000s) | $ 897,307 |
Number of portfolio holdings | 92 |
Net advisory fees paid (in $000s) | $ 3,633 |
Portfolio turnover rate (six months) | 36 % |
Graphical Representation of Holdings
The tables below show the investment makeup of the Fund, representing percentage of the total net assets of the
Fund
.Top Ten Holdings
| Casella Waste Systems, Inc. | 2.0 % |
| BWX Technologies, Inc. | 2.0 % |
| Brink's Co. | 1.9 % |
| Varonis Systems, Inc. | 1.8 % |
| Confluent, Inc. | 1.7 % |
| Montrose Environmental Group, Inc. | 1.7 % |
| Doximity, Inc. | 1.7 % |
| FirstService Corp. | 1.6 % |
| Q2 Holdings, Inc. | 1.6 % |
| Rush Street Interactive, Inc. | 1.5 % |
Sector Allocation

Top Ten Holdings
| Casella Waste Systems, Inc. | 2.0 % |
| BWX Technologies, Inc. | 2.0 % |
| Brink's Co. | 1.9 % |
| Varonis Systems, Inc. | 1.8 % |
| Confluent, Inc. | 1.7 % |
| Montrose Environmental Group, Inc. | 1.7 % |
| Doximity, Inc. | 1.7 % |
| FirstService Corp. | 1.6 % |
| Q2 Holdings, Inc. | 1.6 % |
| Rush Street Interactive, Inc. | 1.5 % |
https://www.williamblairfunds.com/literature/forms
1-800-742-7272
.
What were the Fund costs for the last six months?
(Based on a hypothetical $10,000 investment)
Fund |
Cost of $10,000 Investment |
Cost of $10,000 Investment as a percentage |
| Small Cap Value Fund Class I | $ 43 |
0.89 % |
Management’s Discussion of Fund Performance
SUMMARY OF RESULTS
The Fund returned -6.05% (net of fees) for the 6 months ended June 30, 2025. The Fund underperformed its benchmark, the Russell 2000
®
Value Index, which returned -3.16% and underperformed the Russell 3000®
Index, a broad measure of market performance, which returned 5.75%.The Fund’s underperformance versus its benchmark was driven by poor stock selection in the Financials, Consumer Discretionary, and Information Technology sectors. Conversely, the Fund had positive stock selection in 6 of the 11 Global Industry Classification Standard economic sectors during the period. Positive stock selection contributed to relative performance in the Health Care, Industrials, and Energy sectors.
TOP PERFORMANCE CONTRIBUTORS
ESCO Technologies, Inc.
is a multi-industrial company which produces engineered products and systems for various defense and other industrial applications. ESCO has benefited from a strong order flow and backlog, as well as the U.S. Department of Defense’s prioritization of naval programs, particularly submarines.CSG Systems International, Inc.
provides a suite of processing and related services, which includes software and professional services which automate customer care and billing functions. CSG Systems has benefited from management’s execution in their turnaround strategy by continuing to grow revenue outside of their legacy cable business, as well as margin expansion.WNS Holdings, Ltd.
engages in the provision of business process management solutions, which include industry-specific offerings, customer interaction, finance & accounting, human resources, procurement, and research & analytics. WNS benefitted from speculation surrounding the company potentially being acquired.TOP PERFORMANCE DETRACTORS
Compass Diversified Holdings
is an investment holding company, which acquires controlling interests in small to middle-market businesses. A restatement of financials in their largest portfolio company due to accounting irregularities caused a sharp sell-off.Steven Madden, Ltd.
designs, sources, and markets fashion-forward footwear, accessories & apparel for women, men, and children. Large supplier concentration within China and Vietnam exposed to potential tariffs, as well as a large wholesale exposure caused earnings estimates to decline in the period.Oxford Industries, Inc.
operates as an international apparel design, sourcing, and marketing company, which distributes its lifestyle branded products through a variety of upscale department stores, as well as owned stores and e-commerce platforms. Post-pandemic spend has largely rolled off and margins have come under pressure, which have caused earnings estimates to decline in the period.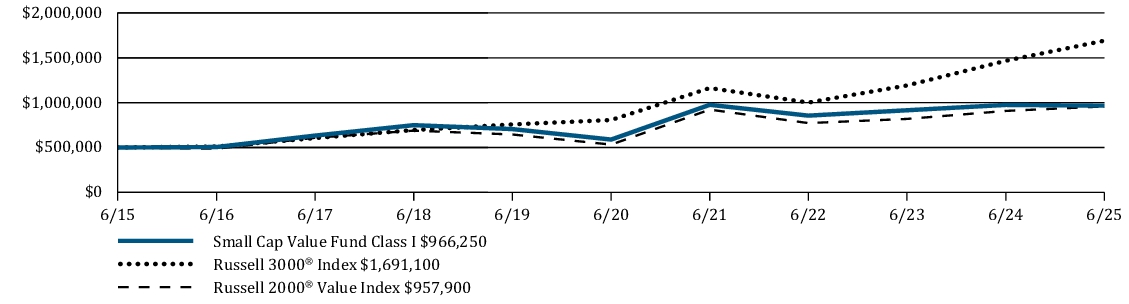
Average Annual Total Returns |
6 Months |
1 Year |
5 Years |
10 Years |
Small Cap Value Fund Class I |
-6.05 % |
-0.88 % |
10.43 % |
6.81 % |
Russell 3000 ® Index |
5.75 % |
15.30 % |
15.96 % |
12.96 % |
Russell 2000 ® Value Index |
-3.16 % |
5.54 % |
12.47 % |
6.72 % |
www.williamblairfunds.com/funds/total-returns/
Key Fund Statistics
Fund net assets (in $000s) |
$ 1,096,302 |
Number of portfolio holdings |
104 |
Net advisory fees paid (in $000s) |
$ 4,261 |
Portfolio turnover rate (six months) |
14 % |
Graphical Representation of Holdings
The tables below show the investment makeup of the Fund, representing percentage of the total net assets of the Fund.
Top Ten Holdings
| Gulfport Energy Corp. | 1.6 % |
| Ameris Bancorp | 1.5 % |
| Texas Capital Bancshares, Inc. | 1.5 % |
| CareTrust REIT, Inc. | 1.5 % |
| Taylor Morrison Home Corp. | 1.4 % |
| John Wiley & Sons, Inc. | 1.4 % |
| Old National Bancorp | 1.3 % |
| Selective Insurance Group, Inc. | 1.2 % |
| Seacoast Banking Corp. of Florida | 1.2 % |
| Hancock Whitney Corp. | 1.2 % |
Sector Allocation
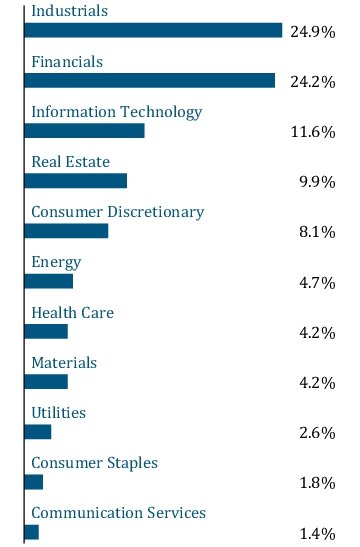
Top Ten Holdings
| Gulfport Energy Corp. | 1.6 % |
| Ameris Bancorp | 1.5 % |
| Texas Capital Bancshares, Inc. | 1.5 % |
| CareTrust REIT, Inc. | 1.5 % |
| Taylor Morrison Home Corp. | 1.4 % |
| John Wiley & Sons, Inc. | 1.4 % |
| Old National Bancorp | 1.3 % |
| Selective Insurance Group, Inc. | 1.2 % |
| Seacoast Banking Corp. of Florida | 1.2 % |
| Hancock Whitney Corp. | 1.2 % |
https://www.williamblairfunds.com/literature/forms
1-800-742-7272
.
What were the Fund costs for the last six months?
(Based on a hypothetical $10,000 investment)
Fund | Cost of $10,000 Investment | Cost of $10,000 Investment as a percentage |
| Small Cap Value Fund Class N | $ 56 | 1.15 % |
Management’s Discussion of Fund Performance
SUMMARY OF RESULTS
The Fund returned -6.17% (net of fees) for the 6 months ended June 30, 2025. The Fund underperformed its benchmark, the Russell 2000
®
Value Index, which returned -3.16% and underperformed the Russell 3000®
Index, a broad measure of market performance, which returned 5.75%.The Fund’s underperformance versus its benchmark was driven by poor stock selection in the Financials, Consumer Discretionary, and Information Technology sectors. Conversely, the Fund had positive stock selection in 6 of the 11 Global Industry Classification Standard economic sectors during the period. Positive stock selection contributed to relative performance in the Health Care, Industrials, and Energy sectors.
TOP PERFORMANCE CONTRIBUTORS
ESCO Technologies, Inc.
is a multi-industrial company which produces engineered products and systems for various defense and other industrial applications. ESCO has benefited from a strong order flow and backlog, as well as the U.S. Department of Defense’s prioritization of naval programs, particularly submarines.CSG Systems International, Inc.
provides a suite of processing and related services, which includes software and professional services which automate customer care and billing functions. CSG Systems has benefited from management’s execution in their turnaround strategy by continuing to grow revenue outside of their legacy cable business, as well as margin expansion.WNS Holdings, Ltd.
engages in the provision of business process management solutions, which include industry-specific offerings, customer interaction, finance & accounting, human resources, procurement, and research & analytics. WNS benefitted from speculation surrounding the company potentially being acquired.TOP PERFORMANCE DETRACTORS
Compass Diversified Holdings
is an investment holding company, which acquires controlling interests in small to middle-market businesses. A restatement of financials in their largest portfolio company due to accounting irregularities caused a sharp sell-off.Steven Madden, Ltd.
designs, sources, and markets fashion-forward footwear, accessories & apparel for women, men, and children. Large supplier concentration within China and Vietnam exposed to potential tariffs, as well as a large wholesale exposure caused earnings estimates to decline in the period.Oxford Industries, Inc.
operates as an international apparel design, sourcing, and marketing company, which distributes its lifestyle branded products through a variety of upscale department stores, as well as owned stores and e-commerce platforms. Post-pandemic spend has largely rolled off and margins have come under pressure, which have caused earnings estimates to decline in the period.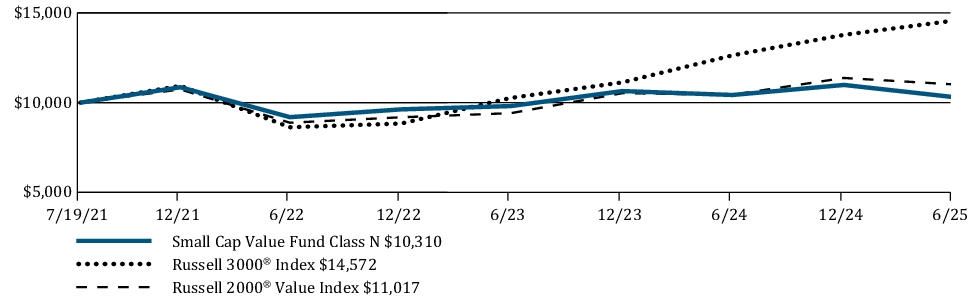
Average Annual Total Returns | 6 Months | 1 Year | Since Inception |
Small Cap Value Fund Class N | -6.17 % | -1.13 % | 0.77 % |
Russell 3000 ® Index | 5.75 % | 15.30 % | 9.99 % |
Russell 2000 ® Value Index | -3.16 % | 5.54 % | 2.48 % |
www.williamblairfunds.com/funds/total-returns
Key Fund Statistics
Fund net assets (in $000s) | $ 1,096,302 |
Number of portfolio holdings | 104 |
Net advisory fees paid (in $000s) | $ 4,261 |
Portfolio turnover rate (six months) | 14 % |
Graphical Representation of Holdings
The tables below show the investment makeup of the Fund, representing percentage of the total net assets of the Fund.
Top Ten Holdings
| Gulfport Energy Corp. | 1.6 % |
| Ameris Bancorp | 1.5 % |
| Texas Capital Bancshares, Inc. | 1.5 % |
| CareTrust REIT, Inc. | 1.5 % |
| Taylor Morrison Home Corp. | 1.4 % |
| John Wiley & Sons, Inc. | 1.4 % |
| Old National Bancorp | 1.3 % |
| Selective Insurance Group, Inc. | 1.2 % |
| Seacoast Banking Corp. of Florida | 1.2 % |
| Hancock Whitney Corp. | 1.2 % |
Sector Allocation

Top Ten Holdings
| Gulfport Energy Corp. | 1.6 % |
| Ameris Bancorp | 1.5 % |
| Texas Capital Bancshares, Inc. | 1.5 % |
| CareTrust REIT, Inc. | 1.5 % |
| Taylor Morrison Home Corp. | 1.4 % |
| John Wiley & Sons, Inc. | 1.4 % |
| Old National Bancorp | 1.3 % |
| Selective Insurance Group, Inc. | 1.2 % |
| Seacoast Banking Corp. of Florida | 1.2 % |
| Hancock Whitney Corp. | 1.2 % |
https://www.williamblairfunds.com/literature/forms
1-800-742-7272
.
What were the Fund costs for the last six months?
(Based on a hypothetical $10,000 investment)
Fund | Cost of $10,000 Investment | Cost of $10,000 Investment as a percentage |
| Small Cap Value Fund Class R6 | $ 39 | 0.80 % |
Management’s Discussion of Fund Performance
SUMMARY OF RESULTS
The Fund returned -5.98% (net of fees) for the 6 months ended June 30, 2025. The Fund underperformed its benchmark, the Russell 2000
®
Value Index, which returned -3.16% and underperformed the Russell 3000®
Index, a broad measure of market performance, which returned 5.75%.The Fund’s underperformance versus its benchmark was driven by poor stock selection in the Financials, Consumer Discretionary, and Information Technology sectors. Conversely, the Fund had positive stock selection in 6 of the 11 Global Industry Classification Standard economic sectors during the period. Positive stock selection contributed to relative performance in the Health Care, Industrials, and Energy sectors.
TOP PERFORMANCE CONTRIBUTORS
ESCO Technologies, Inc.
is a multi-industrial company which produces engineered products and systems for various defense and other industrial applications. ESCO has benefited from a strong order flow and backlog, as well as the U.S. Department of Defense’s prioritization of naval programs, particularly submarines.CSG Systems International, Inc.
provides a suite of processing and related services, which includes software and professional services which automate customer care and billing functions. CSG Systems has benefited from management’s execution in their turnaround strategy by continuing to grow revenue outside of their legacy cable business, as well as margin expansion.WNS Holdings, Ltd.
engages in the provision of business process management solutions, which include industry-specific offerings, customer interaction, finance & accounting, human resources, procurement, and research & analytics. WNS benefitted from speculation surrounding the company potentially being acquired.TOP PERFORMANCE DETRACTORS
Compass Diversified Holdings
is an investment holding company, which acquires controlling interests in small to middle-market businesses. A restatement of financials in their largest portfolio company due to accounting irregularities caused a sharp sell-off.Steven Madden, Ltd.
designs, sources, and markets fashion-forward footwear, accessories & apparel for women, men, and children. Large supplier concentration within China and Vietnam exposed to potential tariffs, as well as a large wholesale exposure caused earnings estimates to decline in the period.Oxford Industries, Inc.
operates as an international apparel design, sourcing, and marketing company, which distributes its lifestyle branded products through a variety of upscale department stores, as well as owned stores and e-commerce platforms. Post-pandemic spend has largely rolled off and margins have come under pressure, which have caused earnings estimates to decline in the period.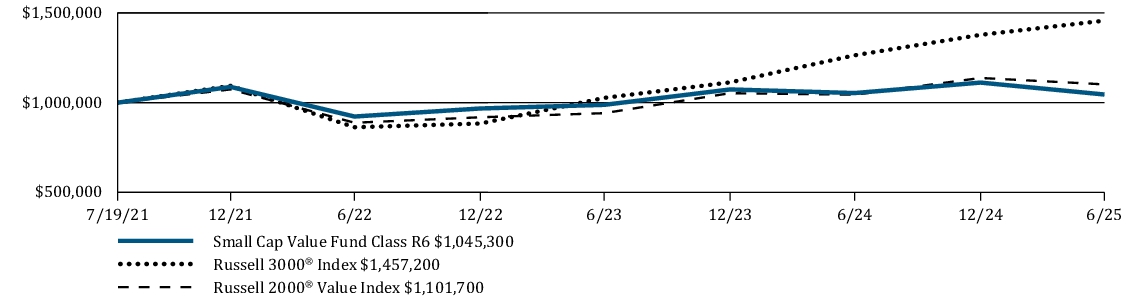
Average Annual Total Returns | 6 Months | 1 Year | Since Inception |
Small Cap Value Fund Class R6 | -5.98 % | -0.76 % | 1.13 % |
Russell 3000 ® Index | 5.75 % | 15.30 % | 9.99 % |
Russell 2000 ® Value Index | -3.16 % | 5.54 % | 2.48 % |
www.williamblairfunds.com/funds/total-returns
Key Fund Statistics
Fund net assets (in $000s) | $ 1,096,302 |
Number of portfolio holdings | 104 |
Net advisory fees paid (in $000s) | $ 4,261 |
Portfolio turnover rate (six months) | 14 % |
Graphical Representation of Holdings
The tables below show the investment makeup of the Fund, representing percentage of the total net assets of the Fund.
Top Ten Holdings
| Gulfport Energy Corp. | 1.6 % |
| Ameris Bancorp | 1.5 % |
| Texas Capital Bancshares, Inc. | 1.5 % |
| CareTrust REIT, Inc. | 1.5 % |
| Taylor Morrison Home Corp. | 1.4 % |
| John Wiley & Sons, Inc. | 1.4 % |
| Old National Bancorp | 1.3 % |
| Selective Insurance Group, Inc. | 1.2 % |
| Seacoast Banking Corp. of Florida | 1.2 % |
| Hancock Whitney Corp. | 1.2 % |
Sector Allocation

Top Ten Holdings
| Gulfport Energy Corp. | 1.6 % |
| Ameris Bancorp | 1.5 % |
| Texas Capital Bancshares, Inc. | 1.5 % |
| CareTrust REIT, Inc. | 1.5 % |
| Taylor Morrison Home Corp. | 1.4 % |
| John Wiley & Sons, Inc. | 1.4 % |
| Old National Bancorp | 1.3 % |
| Selective Insurance Group, Inc. | 1.2 % |
| Seacoast Banking Corp. of Florida | 1.2 % |
| Hancock Whitney Corp. | 1.2 % |
https://www.williamblairfunds.com/literature/forms
1-800-742-7272
.
What were the Fund costs for the last six months?
(Based on a hypothetical $10,000 investment)
Fund |
Cost of $10,000 Investment |
Cost of $10,000 Investment as a percentage |
| Global Leaders Fund Class I | $ 47 |
0.90 % |
Management’s Discussion of Fund Performance
SUMMARY OF RESULTS
The Fund returned 8.64% (net of fees) for the 6 months ended June 30, 2025. The Fund underperformed its benchmark, the MSCI All Country World IMI (net), which returned 9.82%. The Fund's benchmark is also a broad measure of market performance.
The Fund slightly underperformed the index for the year-to-date period, primarily because of weakness in the first quarter. From a sector perspective, weaker stock selection within Financials and Utilities and an overweight allocation to Consumer Discretionary hampered performance.
TOP PERFORMANCE DETRAC
TORS
Mastercard
is a global financial services company that facilitates electronic payment systems, including credit, debit, and prepaid cards, through its secure network. The share price declined late in the second quarter due to the potential impact of the passage of the GENIUS Act in the U.S. Senate, which would allow large retailers to issue their own stablecoins and possibly circumvent networks.NextEra Energy
operates the largest renewables fleet in the U.S. and is among the largest operators of wind farms in the world. The share price declined alongside solar peers as U.S. tax and spending initiatives would accelerate the end of incentives for clean electricity production.TOP PERFORMANCE CONTRIBUTORS
Hims & Hers Health, Inc. (“HIMS”)
operates in the Health Care sector, focusing on digital health services, telemedicine, and personalized wellness solutions. HIMS operates a unique business model that is built on two pillars of telemedicine (service) and generics (product). Despite some volatility, the share price outperformed on the news of a potential collaboration withOddity Tech
is a tech-driven consumer company that creates and expands digital-first brands designed to upend the traditionally offline beauty and wellness sectors. The share price accelerated amid strong earnings in the first quarter and raised revenue growth outlook for 2025. 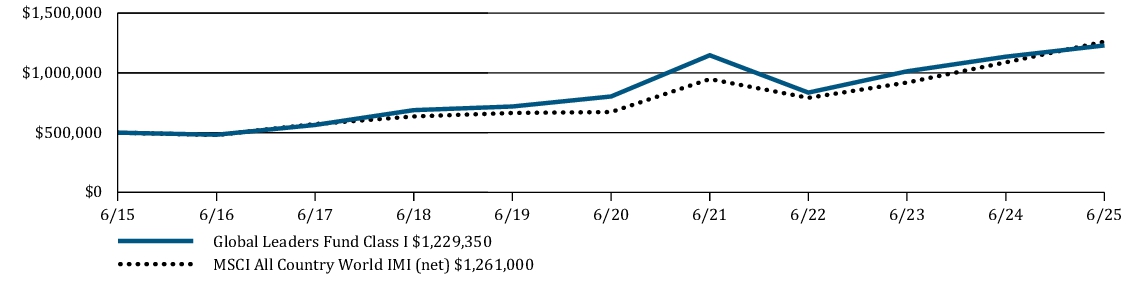
Average Annual Total Returns |
6 Months |
1 Year |
5 Years |
10 Years |
Global Leaders Fund Class I |
8.64 % |
8.28 % |
8.90 % |
9.41 % |
MSCI All Country World IMI (net) |
9.82 % |
15.89 % |
13.39 % |
9.69 % |
www.williamblairfunds.com/funds/total-returns
Key Fund Statis
tics
Fund net assets (in $000s) |
$ 49,955 |
Number of portfolio holdings |
80 |
Net advisory fees paid (in $000s) |
$ 82 |
Portfolio turnover rate (six months) |
40 % |
Graphical Representation of Holdings
The tables below show the investment makeup of the
Fund
, representing percentage of the total net assets of the Fund.Top Ten Holdings
| NVIDIA Corp. | 4.8 % |
| Microsoft Corp. | 4.2 % |
| Meta Platforms, Inc. | 3.0 % |
| Alphabet, Inc. | 2.9 % |
| Amazon.com, Inc. | 2.5 % |
| Taiwan Semiconductor Manufacturing Co. Ltd. | 2.4 % |
| Apple, Inc. | 2.4 % |
| Broadcom, Inc. | 2.4 % |
| Mastercard, Inc. | 2.3 % |
| TotalEnergies SE | 2.1 % |
Sector Allocation

Geographic Diversification

Top Ten Holdings
| NVIDIA Corp. | 4.8 % |
| Microsoft Corp. | 4.2 % |
| Meta Platforms, Inc. | 3.0 % |
| Alphabet, Inc. | 2.9 % |
| Amazon.com, Inc. | 2.5 % |
| Taiwan Semiconductor Manufacturing Co. Ltd. | 2.4 % |
| Apple, Inc. | 2.4 % |
| Broadcom, Inc. | 2.4 % |
| Mastercard, Inc. | 2.3 % |
| TotalEnergies SE | 2.1 % |
https://www.williamblairfunds.com/literature/forms
1-800-742-7272
.
What were the Fund costs for the last six months?
(Based on a hypothetical $10,000 investment)
Fund | Cost of $10,000 Investment | Cost of $10,000 Investment as a percentage |
| Global Leaders Fund Class N | $ 60 | 1.15 % |
Management’s Discussion of Fund Performance
SUMMARY OF RESULTS
The Fund returned 8.41% (net of fees) for the 6 months ended June 30, 2025. The Fund underperformed its benchmark, the MSCI All Country World IMI (net), which returned 9.82%. The Fund's benchmark is also a broad measure of market performance.
The Fund slightly underperformed the index for the year-to-date period, primarily because of weakness in the first quarter. From a sector perspective, weaker stock selection within Financials and Utilities and an overweight allocation to Consumer Discretionary hampered performance.
TOP PERFORM
ANC
E DETRACTORSMastercard
is a global financial services company that facilitates electronic payment systems, including credit, debit, and prepaid cards, through its secure network. The share price declined late in the second quarter due to the potential impact of the passage of the GENIUS Act in the U.S. Senate, which would allow large retailers to issue their own stablecoins and possibly circumvent networks.NextEra Energy
operates the largest renewables fleet in the U.S. and is among the largest operators of wind farms in the world. The share price declined alongside solar peers as U.S. tax and spending initiatives would accelerate the end of incentives for clean electricity production.TOP PERFORMANCE CONTRIBUTORS
Hims & Hers Health, Inc. (“HIMS”)
operates in the Health Care sector, focusing on digital health services, telemedicine, and personalized wellness solutions. HIMS operates a unique business model that is built on two pillars of telemedicine (service) and generics (product). Despite some volatility, the share price outperformed on the news of a potential collaboration withOddity Tech
is a tech-driven consumer company that creates and expands digital-first brands designed to upend the traditionally offline beauty and wellness sectors. The share price accelerated amid strong earnings in the first quarter and raised revenue growth outlook for 2025. 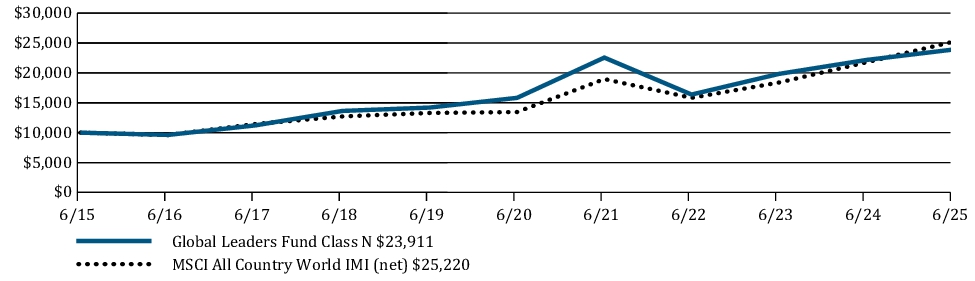
Average Annual Total Returns | 6 Months | 1 Year | 5 Years | 10 Years |
Global Leaders Fund Class N | 8.41 % | 7.93 % | 8.61 % | 9.11 % |
MSCI All Country World IMI (net) | 9.82 % | 15.89 % | 13.39 % | 9.69 % |
www.williamblairfunds.com/funds/total-returns
Key Fund Statis
tics
Fund net assets (in $000s) | $ 49,955 |
Number of portfolio holdings | 80 |
Net advisory fees paid (in $000s) | $ 82 |
Portfolio turnover rate (six months) | 40 % |
Graphical Representation of Holdings
The tables below show the investment makeup of the Fund, representing percentage of the total net assets of the Fund.
Top Ten Holdings
| NVIDIA Corp. | 4.8 % |
| Microsoft Corp. | 4.2 % |
| Meta Platforms, Inc. | 3.0 % |
| Alphabet, Inc. | 2.9 % |
| Amazon.com, Inc. | 2.5 % |
| Taiwan Semiconductor Manufacturing Co. Ltd. | 2.4 % |
| Apple, Inc. | 2.4 % |
| Broadcom, Inc. | 2.4 % |
| Mastercard, Inc. | 2.3 % |
| TotalEnergies SE | 2.1 % |
Sector Allocation
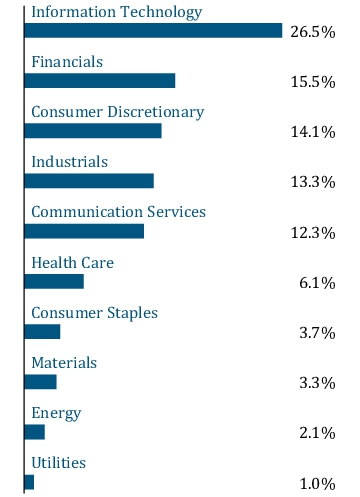
Geographic Diversification

Top Ten Holdings
| NVIDIA Corp. | 4.8 % |
| Microsoft Corp. | 4.2 % |
| Meta Platforms, Inc. | 3.0 % |
| Alphabet, Inc. | 2.9 % |
| Amazon.com, Inc. | 2.5 % |
| Taiwan Semiconductor Manufacturing Co. Ltd. | 2.4 % |
| Apple, Inc. | 2.4 % |
| Broadcom, Inc. | 2.4 % |
| Mastercard, Inc. | 2.3 % |
| TotalEnergies SE | 2.1 % |
https://www.williamblairfunds.com/literature/forms
1-800-742-7272
.
What were the Fund costs for the last six months?
(Based on a hypothetical $10,000 investment)
Fund | Cost of $10,000 Investment | Cost of $10,000 Investment as a percentage |
| Global Leaders Fund Class R6 | $ 44 | 0.85 % |
Management’s Discussion of Fund Performance
SUMMARY OF RESULTS
The Fund returned 8.54% (net of fees) for the 6 months ended June 30, 2025. The Fund underperformed its benchmark, the MSCI All Country World IMI (net), which returned 9.82%. The Fund's benchmark is also a broad measure of market performance.
The Fund slightly underperformed the index for the year-to-date period, primarily because of weakness in the first quarter. From a sector perspective, weaker stock selection within Financials and Utilities and an overweight allocation to Consumer Discretionary hampered performance.
TOP PERFORMAN
CE D
ETRACTORSMastercard
is a global financial services company that facilitates electronic payment systems, including credit, debit, and prepaid cards, through its secure network. The share price declined late in the second quarter due to the potential impact of the passage of the GENIUS Act in the U.S. Senate, which would allow large retailers to issue their own stablecoins and possibly circumvent networks.NextEra Energy
operates the largest renewables fleet in the U.S. and is among the largest operators of wind farms in the world. The share price declined alongside solar peers as U.S. tax and spending initiatives would accelerate the end of incentives for clean electricity production.TOP PERFORMANCE CONTRIBUTORS
Hims & Hers Health, Inc. (“HIMS”)
operates in the Health Care sector, focusing on digital health services, telemedicine, and personalized wellness solutions. HIMS operates a unique business model that is built on two pillars of telemedicine (service) and generics (product). Despite some volatility, the share price outperformed on the news of a potential collaboration withOddity Tech
is a tech-driven consumer company that creates and expands digital-first brands designed to upend the traditionally offline beauty and wellness sectors. The share price accelerated amid strong earnings in the first quarter and raised revenue growth outlook for 2025. 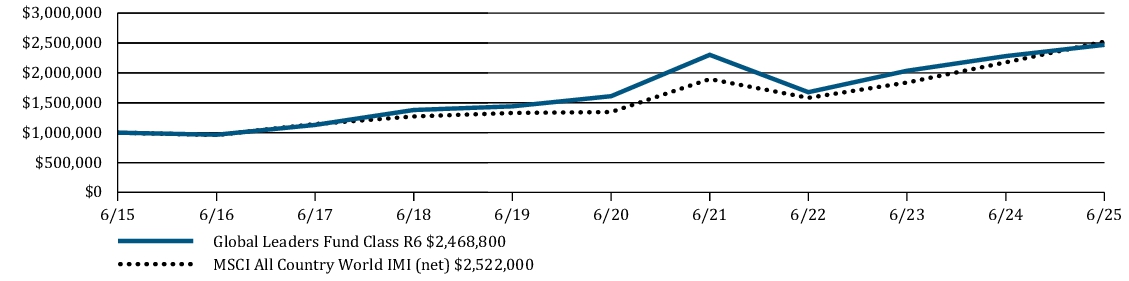
Average Annual Total Returns | 6 Months | 1 Year | 5 Years | 10 Years |
Global Leaders Fund Class R6 | 8.54 % | 8.26 % | 8.92 % | 9.46 % |
MSCI All Country World IMI (net) | 9.82 % | 15.89 % | 13.39 % | 9.69 % |
www.williamblairfunds.com/funds/total-returns
Key Fund St
atisti
csFund net assets (in $000s) | $ 49,955 |
Number of portfolio holdings | 80 |
Net advisory fees paid (in $000s) | $ 82 |
Portfolio turnover rate (six months) | 40 % |
Graphical Representation of Holdings
The tables below show the investment makeup of the Fund, representing percentage of the total net assets of the Fund.
Top Ten Holdings
| NVIDIA Corp. | 4.8 % |
| Microsoft Corp. | 4.2 % |
| Meta Platforms, Inc. | 3.0 % |
| Alphabet, Inc. | 2.9 % |
| Amazon.com, Inc. | 2.5 % |
| Taiwan Semiconductor Manufacturing Co. Ltd. | 2.4 % |
| Apple, Inc. | 2.4 % |
| Broadcom, Inc. | 2.4 % |
| Mastercard, Inc. | 2.3 % |
| TotalEnergies SE | 2.1 % |
Sector Allocation

Geographic Diversification
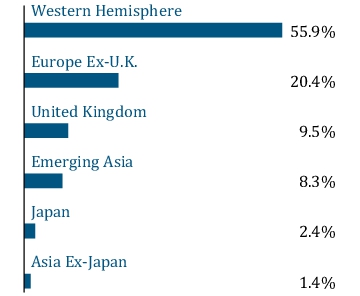
Top Ten Holdings
| NVIDIA Corp. | 4.8 % |
| Microsoft Corp. | 4.2 % |
| Meta Platforms, Inc. | 3.0 % |
| Alphabet, Inc. | 2.9 % |
| Amazon.com, Inc. | 2.5 % |
| Taiwan Semiconductor Manufacturing Co. Ltd. | 2.4 % |
| Apple, Inc. | 2.4 % |
| Broadcom, Inc. | 2.4 % |
| Mastercard, Inc. | 2.3 % |
| TotalEnergies SE | 2.1 % |
https://www.williamblairfunds.com/literature/forms
1-800-742-7272
.
What were the Fund costs for the last six months?
(Based on a hypothetical $10,000 investment)
Fund | Cost of $10,000 Investment | Cost of $10,000 Investment as a percentage |
| International Leaders Fund Class I | $ 49 | 0.90 % |
Management’s Discussion of F
un
d PerformanceSUMMARY OF RESULTS
The Fund returned 15.94% (net of fees) for the 6 months ended June 30, 2025. The Fund underperformed its benchmark, the MSCI All Country World ex-U.S. IMI (net), which returned 17.88%. The Fund's benchmark is also a broad measure of market performance.
From a sector perspective, allocation effect was negative due to overweight exposures to Information Technology and Consumer Discretionary. Selection effect was positive overall, with strong selection within Industrials and Consumer Discretionary, partially offset by negative selection within Financials.
TOP PERFORMANCE DETRACTORS
Sumitomo Mitsui Financial Group (“SMFG”)
is a Japanese bank whose share price has been rewarded over the past few years as Japan has normalized its interest rate policy, providing a boost to earnings power for SMFG. SMFG’s stock rebounded as yields recovered, yet still trails highs, partly due to earnings guidance falling short of market expectations.London Stock Exchange (“LSE”)
is a diversified global market infrastructure company with a strong mergers and acquisitions (“M&A”) track record. After strong performance of the stock over the past two years, LSE underperformed the market and financials in the first half of the year due in part to the strong UK sterling bringing down earnings estimates, as well as some uncertainty on the initial public offering and M&A market given macro risks and market volatility. We remain constructive on LSE’s resilience given its diversified revenue base, particularly in data and risk services.Trip.com
is China’s leading online travel agency with a dominant market share. It offers a comprehensive range of services, including transportation ticketing, hotel bookings, packaged tours, and destination resort tickets. While fundamental performance continues to benefit from the structural growth in Chinese consumers’ travel spending, management reduced expected margins, as it is looking to expand the platform internationally.TOP PERFORMANCE CONTRIBUTORS
BAE Systems
is the largest pure-play European defense contractor with exposure to some of the largest defense markets in the world. It boasts a large and diversified portfolio that we believe includes some of the most successful and in-demand defense programs in the world.Thales
is among the world's leading providers of critical secure communications systems, with main applications in the defense, aerospace, telecommunication, and the banking industry.Recruit Holdings
specializes in employment classifieds, including U.S.-based companies Indeed and Glassdoor. A weaker macro environment and a stronger Japanese yen have led to slower growth and a weaker outlook for full year 2026, its current fiscal year. The stock was exited because of a lack of earnings visibility.MercadoLibre, Inc.
, the leading e-commerce platform in Latin America, combines logistics, payments, and retail into a best-in-class ecosystem. The company posted 37% revenue growth year-over-year as it executed successfully across both commerce and fintech segments. We believe the expansive Latin American market offers significant potential for long-term growth and investment.Dollarama Inc.
continues to deliver on its formula of operational discipline, steady profitability, recession-resistant demand, and expansion-driven growth. Quarterly results exceeded expectations with robust same-store sales and margin improvement, and full-year guidance—still conservative, in our view—was reaffirmed.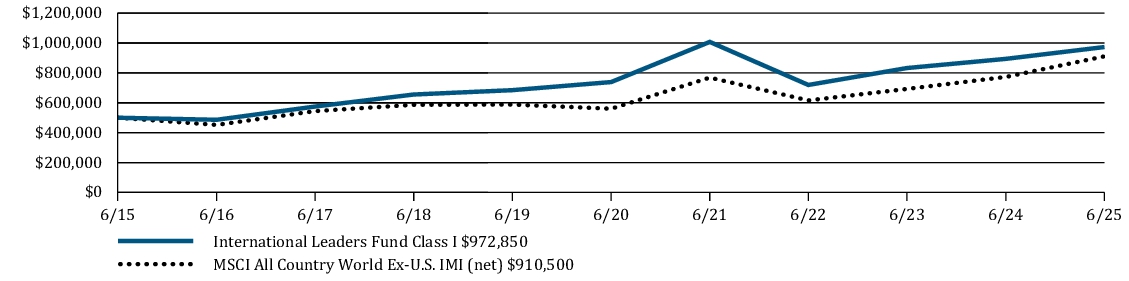
Average Annual Total Returns | 6 Months | 1 Year | 5 Years | 10 Years |
International Leaders Fund Class I | 15.94 % | 8.86 % | 5.66 % | 6.88 % |
MSCI All Country World ex-U.S. IMI (net) | 17.88 % | 17.83 % | 10.20 % | 6.18 % |
www.williamblairfunds.com/funds/total-returns
Key Fund Statistics
Fund net assets (in $000s) | $ 1,120,468 |
Number of portfolio holdings | 63 |
Net advisory fees paid (in $000s) | $ 4,353 |
Portfolio turnover rate (six months) | 47 % |
Graphical Representation of Holdings
The tables below show the investment makeup of the Fund, representing percentage of the total net assets of the Fund.
Top Ten Holdings
| Taiwan Semiconductor Manufacturing Co. Ltd. | 3.4 % |
| SK Hynix, Inc. | 2.6 % |
| UniCredit S.p.A. | 2.4 % |
| SAP SE | 2.4 % |
| Banco Bilbao Vizcaya Argentaria S.A. | 2.4 % |
| Dollarama, Inc. | 2.3 % |
| BAE Systems PLC | 2.3 % |
| Thales SA | 2.2 % |
| Intact Financial Corp. | 2.2 % |
| Sea Ltd. | 2.1 % |
Sector Allocation
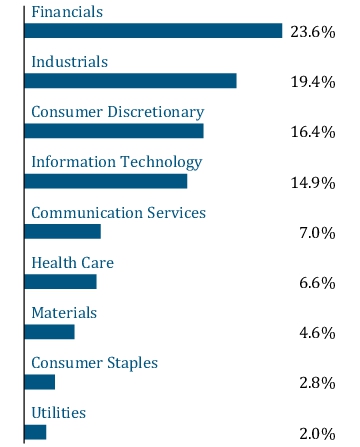
Geographic Diversification

Top Ten Holdings
| Taiwan Semiconductor Manufacturing Co. Ltd. | 3.4 % |
| SK Hynix, Inc. | 2.6 % |
| UniCredit S.p.A. | 2.4 % |
| SAP SE | 2.4 % |
| Banco Bilbao Vizcaya Argentaria S.A. | 2.4 % |
| Dollarama, Inc. | 2.3 % |
| BAE Systems PLC | 2.3 % |
| Thales SA | 2.2 % |
| Intact Financial Corp. | 2.2 % |
| Sea Ltd. | 2.1 % |
semi-annual shareholder report
contains important information about William Blair International Leaders Fund Class N (the "Fund”) for the period of January 1, 2025, to June 30, 2025.
https://www.williamblairfunds.com/literature/forms
1-800-742-7272
.
What were the Fund costs for the last six months?
(Based on a hypothetical $10,000 investment)
Fund | Cost of $10,000 Investment | Cost of $10,000 Investment as a percentage |
| International Leaders Fund Class N | $ 62 | 1.15 % |
Management’s Discussion of Fund Performance
SUMMARY OF RESULTS
The Fund returned 15.79% (net of fees) for the 6 months ended June 30, 2025. The Fund underperformed its benchmark, the MSCI All Country World ex-U.S. IMI (net), which returned 17.88%. The Fund's benchmark is also a broad measure of market performance.
From a sector perspective, allocation effect was negative due to overweight exposures to Information Technology and Consumer Discretionary. Selection effect was positive overall, with strong selection within Industrials and Consumer Discretionary, partially offset by negative selection within Financials.
TOP PERFORMANCE DETRACTORS
Sumitomo Mitsui Financial Group (“SMFG”)
is a Japanese bank whose share price has been rewarded over the past few years as Japan has normalized its interest rate policy, providing a boost to earnings power for SMFG. SMFG’s stock rebounded as yields recovered, yet still trails highs, partly due to earnings guidance falling short of market expectations.London Stock Exchange (“LSE”)
is a diversified global market infrastructure company with a strong mergers and acquisitions (“M&A”) track record. After strong performance of the stock over the past two years, LSE underperformed the market and financials in the first half of the year due in part to the strong UK sterling bringing down earnings estimates, as well as some uncertainty on the initial public offering and M&A market given macro risks and market volatility. We remain constructive on LSE’s resilience given its diversified revenue base, particularly in data and risk services.Trip.com
is China’s leading online travel agency with a dominant market share. It offers a comprehensive range of services, including transportation ticketing, hotel bookings, packaged tours, and destination resort tickets. While fundamental performance continues to benefit from the structural growth in Chinese consumers’ travel spending, management reduced expected margins, as it is looking to
expand the platform internationally.TOP PERFORMANCE CONTRIBUTORS
BAE Systems
is the largest pure-play European defense contractor with exposure to some of the largest defense markets in the world. It boasts a large and diversified portfolio that we believe includes some of the most successful and in-demand defense programs in the world.Thales
is among the world's leading providers of critical secure communications systems, with main applications in the defense, aerospace, telecommunication, and the banking industry.Recruit Holdings
specializes in employment classifieds, including U.S.-based companies Indeed and Glassdoor. A weaker macro environment and a stronger Japanese yen have led to slower growth and a weaker outlook for full year 2026, its current fiscal year. The stock was exited because of a lack of earnings visibility.MercadoLibre, Inc.
, the leading e-commerce platform in Latin America, combines logistics, payments, and retail into a best-in-class ecosystem. The company posted 37% revenue growth year-over-year as it executed successfully across both commerce and fintech segments. We believe the expansive Latin American market offers significant potential for long-term growth and investment.Dollarama Inc.
continues to deliver on its formula of operational discipline, steady profitability, recession-resistant demand, and expansion-driven growth. Quarterly results exceeded expectations with robust same-store sales and margin improvement, and full-year guidance—still conservative, in our view—was reaffirmed
.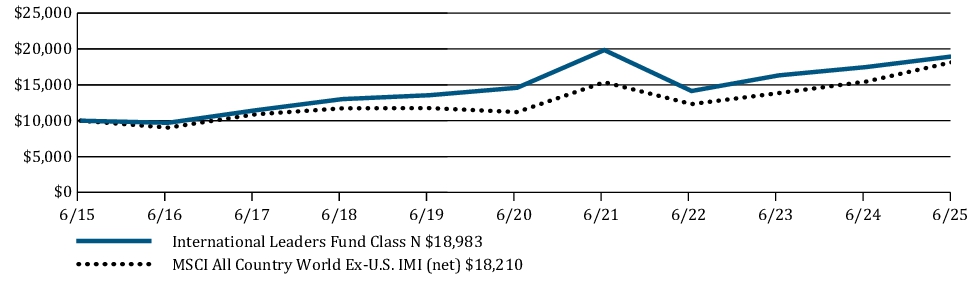
Average Annual Total Returns | 6 Months | 1 Year | 5 Years | 10 Years |
International Leaders Fund Class N | 15.79 % | 8.61 % | 5.40 % | 6.62 % |
MSCI All Country World ex-U.S. IMI (net) | 17.88 % | 17.83 % | 10.20 % | 6.18 % |
www.williamblairfunds.com/funds/total-returns
Key Fund Statistics
Fund net assets (in $000s) | $ 1,120,468 |
Number of portfolio holdings | 63 |
Net advisory fees paid (in $000s) | $ 4,353 |
Portfolio turnover rate (six months) | 47 % |
Graphical Representation of Holdings
The tables below show the investment makeup of the Fund, representing percentage of the total net assets of the Fund.
Top Ten Holdings
| Taiwan Semiconductor Manufacturing Co. Ltd. | 3.4 % |
| SK Hynix, Inc. | 2.6 % |
| UniCredit S.p.A. | 2.4 % |
| SAP SE | 2.4 % |
| Banco Bilbao Vizcaya Argentaria S.A. | 2.4 % |
| Dollarama, Inc. | 2.3 % |
| BAE Systems PLC | 2.3 % |
| Thales SA | 2.2 % |
| Intact Financial Corp. | 2.2 % |
| Sea Ltd. | 2.1 % |
Sector Allocation

Geographic Diversification
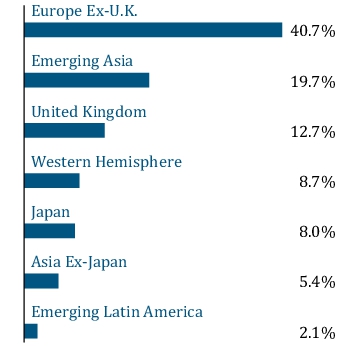
Top Ten Holdings
| Taiwan Semiconductor Manufacturing Co. Ltd. | 3.4 % |
| SK Hynix, Inc. | 2.6 % |
| UniCredit S.p.A. | 2.4 % |
| SAP SE | 2.4 % |
| Banco Bilbao Vizcaya Argentaria S.A. | 2.4 % |
| Dollarama, Inc. | 2.3 % |
| BAE Systems PLC | 2.3 % |
| Thales SA | 2.2 % |
| Intact Financial Corp. | 2.2 % |
| Sea Ltd. | 2.1 % |
https://www.williamblairfunds.com/literature/forms
1-800-742-7272
.
What were the Fund costs for the last six months?
(Based on a hypothetical $10,000 investment)
Fund | Cost of $10,000 Investment | Cost of $10,000 Investment as a percentage |
| International Leaders Fund Class R6 | $ 46 | 0.85 % |
Management’s Discussion of Fund Performance
SUMMARY OF RESULTS
The Fund returned 15.98% (net of fees) for the 6 months ended June 30, 2025. The Fund underperformed its benchmark, the MSCI All Country World ex-U.S. IMI (net), which returned 17.88%. The Fund's benchmark is also a broad measure of market performance.
From a sector perspective, allocation effect was negative due to overweight exposures to Information Technology and Consumer Discretionary. Selection effect was positive overall, with strong selection within Industrials and Consumer Discretionary, partially offset by negative selection within Financials.
TOP PERFORMANCE DETRACTORS
Sumitomo Mitsui Financial Group (“SMFG”)
is a Japanese bank whose share price has been rewarded over the past few years as Japan has normalized its interest rate policy, providing a boost to earnings power for SMFG. SMFG’s stock rebounded as yields recovered, yet still trails highs, partly due to earnings guidance falling short of market expectations.London Stock Exchange (“LSE”)
is a diversified global market infrastructure company with a strong mergers and acquisitions (“M&A”) track record. After strong performance of the stock over the past two years, LSE underperformed the market and financials in the first half of the year due in part to the strong UK sterling bringing down earnings estimates, as well as some uncertainty on the initial public offering and M&A market given macro risks and market volatility. We remain constructive on LSE’s resilience given its diversified revenue base, particularly in data and risk services.Trip.com
is China’s leading online travel agency with a dominant market share. It offers a comprehensive range of services, including transportation ticketing, hotel bookings, packaged tours, and destination resort tickets. While fundamental performance continues to benefit from the structural growth in Chinese consumers’ travel spending, management reduced expected margins, as it is looking to expand the platform internationally.Thales
is among the world's leading providers of critical secure communications systems, with main applications in the defense, aerospace, telecommunication, and the banking industry.Recruit Holdings
specializes in employment classifieds, including U.S.-based companies Indeed and Glassdoor. A weaker macro environment and a stronger Japanese yen have led to slower growth and a weaker outlook for full year 2026, its current fiscal year. The stock was exited because of a lack of earnings visibility.MercadoLibre, Inc.
, the leading e-commerce platform in Latin America, combines logistics, payments, and retail into a best-in-class ecosystem. The company posted 37% revenue growth year-over-year as it executed successfully across both commerce and fintech segments. We believe the expansive Latin American market offers significant potential for long-term growth and investment.Dollarama Inc.
continues to deliver on its formula of operational discipline, steady profitability, recession-resistant demand, and expansion-driven growth. Quarterly results exceeded expectations with robust same-store sales and margin improvement, and full-year guidance—still conservative, in our view—was reaffirmed.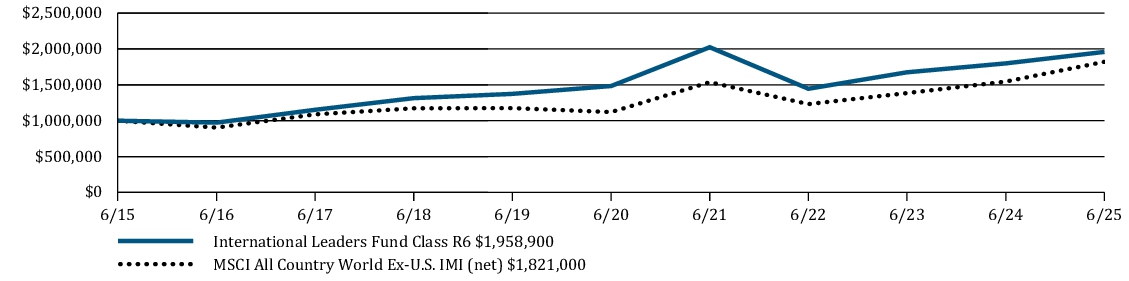
Average Annual Total Returns | 6 Months | 1 Year | 5 Years | 10 Years |
International Leaders Fund Class R6 | 15.98 % | 8.90 % | 5.72 % | 6.96 % |
MSCI All Country World ex-U.S. IMI (net) | 17.88 % | 17.83 % | 10.20 % | 6.18 % |
www.williamblairfunds.com/funds/total-returns
Key Fund Statistics
Fund net assets (in $000s) | $ 1,120,468 |
Number of portfolio holdings | 63 |
Net advisory fees paid (in $000s) | $ 4,353 |
Portfolio turnover rate (six months) | 47 % |
Graphical Representation of Holdings
The tables below show the investment makeup of the Fund, representing percentage of the total net assets of the Fund.
Top Ten Holdings
| Taiwan Semiconductor Manufacturing Co. Ltd. | 3.4 % |
| SK Hynix, Inc. | 2.6 % |
| UniCredit S.p.A. | 2.4 % |
| SAP SE | 2.4 % |
| Banco Bilbao Vizcaya Argentaria S.A. | 2.4 % |
| Dollarama, Inc. | 2.3 % |
| BAE Systems PLC | 2.3 % |
| Thales SA | 2.2 % |
| Intact Financial Corp. | 2.2 % |
| Sea Ltd. | 2.1 % |
Sector Allocation

Geographic Diversification

Top Ten Holdings
| Taiwan Semiconductor Manufacturing Co. Ltd. | 3.4 % |
| SK Hynix, Inc. | 2.6 % |
| UniCredit S.p.A. | 2.4 % |
| SAP SE | 2.4 % |
| Banco Bilbao Vizcaya Argentaria S.A. | 2.4 % |
| Dollarama, Inc. | 2.3 % |
| BAE Systems PLC | 2.3 % |
| Thales SA | 2.2 % |
| Intact Financial Corp. | 2.2 % |
| Sea Ltd. | 2.1 % |
https://www.williamblairfunds.com/literature/forms
1-800-742-7272
.
What were the Fund costs for the last six months?
(Based on a hypothetical $10,000 investment)
Fund | Cost of $10,000 Investment | Cost of $10,000 Investment as a percentage |
| International Growth Fund Class I | $ 51 | 0.96 % |
Management’s Discussion of Fund Performance
SUMMARY OF RESULTS
The Fund returned 13.07% (net of fees) for the 6 months ended June 30, 2025. The Fund underperformed its benchmark, the MSCI All Country World ex-U.S. IMI (net), which returned 17.88%. The Fund's benchmark is also a broad measure of market performance.
From a sector perspective, allocation effect was negative due to overweight exposures to Information Technology and Consumer Discretionary. Selection effect was negative primarily within Financials, Industrials, and Health Care. On a regional view, allocation effect was positive driven by an overweight to Europe ex-U.K. and underweight to emerging Asia. Selection effect was negative within emerging Asia and Europe ex-U.K.
TOP PERFORMANCE DETRACTORS
London Stock Exchange (“LSE”)
is a diversified global market infrastructure company with a strong mergers and acquisitions (“M&A”) track record. After strong performance of the stock over the past two years, LSE underperformed the market and the Financials sector in the first half of the year due in part to the strong UK sterling weighing on earnings estimates, as well as some uncertainty on the initial public offering and M&A market given macro risks and market volatility. We remain constructive on LSE’s resilience given its diversified revenue base, particularly in data and risk services.Sumitomo Mitsui Financial Group (“SMFG”)
is a Japanese bank whose share price has been rewarded over the past few years as Japan normalizes its interest rate policy, providing a boost to earnings power for SMFG. SMFG’s stock rebounded as yields recovered, yet still trails highs, partly due to earnings guidance falling short of market expectations.Bank Central Asia
declined during the first quarter amid deteriorated macroeconomic backdrop in Indonesia, rupiah weakness, and investor concerns about the new administration’s policy direction. In our view, fiscal 2025 guidance remains conservative, and as sentiment improves, we see positive catalysts for the stock to re-rate higher.Industrials selection was bolstered by strong performance of European defense companies, such as
BAE Systems (“BAE”)
and Thales
. However, selection was negative overall driven in part by underperformance of Waste Connections
, Recruit Holdings
, and Bunzl
.Waste Connections
—focused on non-hazardous waste services—offers defensive through-cycle growth and portfolio stability yet underperformed amid the late second quarter rally.Recruit Holdings
specializes in employment classifieds, including U.S.-based companies Indeed and Glassdoor. A weaker macro environment and a stronger Japanese yen have led to slower growth and a weaker outlook for its fiscal 2026.Bunzl
, a business-to-business supplier of low-cost consumables, cut full-year guidance due to trade and tariff uncertainty, and suspended its buyback program in anticipation of reduced profits. The position was exited.Teva Pharmaceuticals
was purchased last year as a turnaround story (return to growth and expand margins). However, we now have concerns about weaker margin guidance from management for fiscal 2025. The turnaround therefore may take longer to materialize into better earnings, and this was negative for the stock and the portfolio sold the position.TOP PERFORMANCE CONTRIBUTORS
BAE
is the largest pure-play European defense contractor with exposure to some of the largest defense markets in the world. It boasts a large and diversified portfolio that we believe includes some of the most successful and in-demand defense programs in the world.Thales
is among the world's leading providers of critical secure communications systems, with main applications in the defense, aerospace, telecommunication, and the banking industry.Sandoz Group
—spun out of Novartis in 2023—is a global leader in off-patent medicines, spanning generics and biosimilars. Although recent results modestly missed expectations, management reaffirmed full-year guidance, signaling confidence in its second-half performance. Multiple biosimilar launches are expected later this year, and the firm remains focused on expanding EBITDA margins through sales mix optimization, network streamlining, and continued transformation efforts.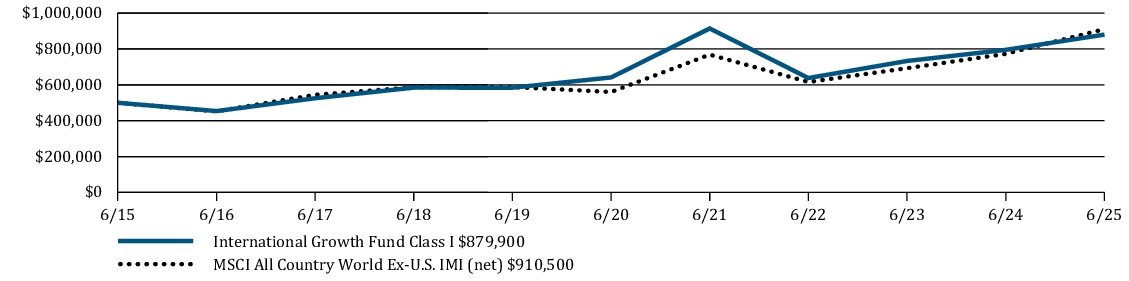
Average Annual Total Returns | 6 Months | 1 Year | 5 Years | 10 Years |
International Growth Fund Class I | 13.07 % | 10.67 % | 6.53 % | 5.81 % |
MSCI All Country World ex-U.S. IMI (net) | 17.88 % | 17.83 % | 10.20 % | 6.18 % |
www.williamblairfunds.com/funds/total-returns
Key Fund
Statist
icsFund net assets (in $000s) | $ 1,357,077 |
Number of portfolio holdings | 182 |
Net advisory fees paid (in $000s) | $ 5,312 |
Portfolio turnover rate (six months) | 37 % |
Graphical Representation of Holdings
The tables below show the investment makeup of the Fund, representing percentage of the total net assets of the Fund.
Top Ten Holdings
| Taiwan Semiconductor Manufacturing Co. Ltd. | 3.4 % |
| Tencent Holdings Ltd. | 2.3 % |
| 3i Group PLC | 1.8 % |
| SAP SE | 1.6 % |
| BAE Systems PLC | 1.5 % |
| Lonza Group AG | 1.3 % |
| UniCredit S.p.A. | 1.3 % |
| SK Hynix, Inc. | 1.3 % |
| Sea Ltd. | 1.3 % |
| London Stock Exchange Group PLC | 1.2 % |
Sector Allocation
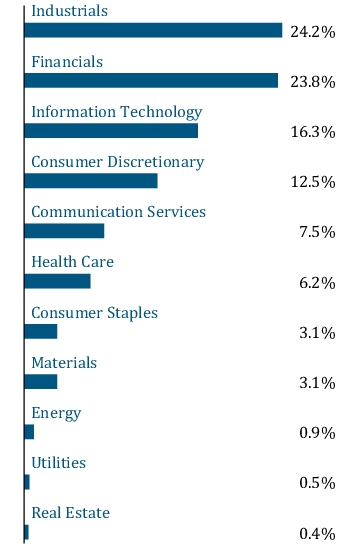
Geographic Diversification

Top Ten Holdings
| Taiwan Semiconductor Manufacturing Co. Ltd. | 3.4 % |
| Tencent Holdings Ltd. | 2.3 % |
| 3i Group PLC | 1.8 % |
| SAP SE | 1.6 % |
| BAE Systems PLC | 1.5 % |
| Lonza Group AG | 1.3 % |
| UniCredit S.p.A. | 1.3 % |
| SK Hynix, Inc. | 1.3 % |
| Sea Ltd. | 1.3 % |
| London Stock Exchange Group PLC | 1.2 % |
https://www.williamblairfunds.com/literature/forms
1-800-742-7272
.
What were the Fund costs for the last six months?
(Based on a hypothetical $10,000 investment)
Fund | Cost of $10,000 Investment | Cost of $10,000 Investment as a percentage |
| International Growth Fund Class N | $ 64 | 1.21 % |
Management’s Discussion of Fund Performance
SUMMARY OF RESULTS
The Fund returned 12.94% (net of fees) for the 6 months ended June 30, 2025. The Fund underperformed its benchmark, the MSCI All Country World ex-U.S. IMI (net), which returned 17.88%. The Fund's b
enc
hmark is also a broad measure of market performance.From a sector perspective, allocation effect was negative due to overweight exposures to Information Technology and Consumer Discretionary. Selection effect was negative primarily within Financials, Industrials, and Health Care. On a regional view, allocation effect was positive driven by an overweight to Europe ex-U.K. and underweight to emerging Asia. Selection effect was negative within emerging Asia and Europe ex-U.K.
Sumitomo Mitsui Financial Group (“SMFG”)
is a Japanese bank whose share price has been rewarded over the past few years as Japan normalizes its interest rate policy, providing a boost to earnings power for SMFG. SMFG’s stock rebounded as yields recovered, yet still trails highs, partly due to earnings guidance falling short of market expectations.Bank Central Asia
declined during the first quarter amid deteriorated macroeconomic backdrop in Indonesia, rupiah weakness, and investor concerns about the new administration’s policy direction. In our view, fiscal 2025 guidance remains conservative, and as sentiment improves, we see positive catalysts for the stock to re-rate higher.Industrials selection was bolstered by strong performance of European defense companies, such as
BAE Systems (“BAE”)
and Thales
. However, selection was negative overall driven in part by underperformance of Waste Connections
, Recruit Holdings
, and Bunzl
.Waste Connections
—focused on non-hazardous waste services—offers defensive through-cycle growth and portfolio stability yet underperformed amid the late second quarter rally.Recruit Holdings
specializes in employment classifieds, including U.S.-based companies Indeed and Glassdoor. A weaker macro environment and a stronger Japanese yen have led to slower growth and a weaker outlook for its fiscal 2026.Bunzl
, a business-to-business supplier of low-cost consumables, cut full-year guidance due to trade and tariff uncertainty, and suspended its buyback program in anticipation of reduced profits. The position was exited.Teva Pharmaceuticals
was purchased last year as a turnaround story (return to growth and expand margins). However, we now have concerns about weaker margin guidance from management for fiscal 2025. The turnaround therefore may take longer to materialize into better earnings, and this was negative for the stock and the portfolio sold the position.Thales
is among the world's leading providers of critical secure communications systems, with main applications in the defense, aerospace, telecommunication, and the banking industry.Sandoz Group
—spun out of Novartis in 2023—is a global leader in off-patent medicines, spanning generics and biosimilars. Although recent results modestly missed expectations, management reaffirmed full-year guidance, signaling confidence in its second-half performance. Multiple biosimilar launches are expected later this year, and the firm remains focused on expanding EBITDA margins through sales mix optimization, network streamlining, and continued transformation efforts.
Average Annual Total Returns | 6 Months | 1 Year | 5 Years | 10 Years |
International Growth Fund Class N | 12.94 % | 10.39 % | 6.25 % | 5.51 % |
MSCI All Country World ex-U.S. IMI (net) | 17.88 % | 17.83 % | 10.20 % | 6.18 % |
www.williamblairfunds.com/funds/total-returns
Key Fund Statistics
Fund net assets (in $000s) | $ 1,357,077 |
Number of portfolio holdings | 182 |
Net advisory fees paid (in $000s) | $ 5,312 |
Portfolio turnover rate (six months) | 37 % |
Graphical Representation of Holdings
The tables below show the investment makeup of the Fund, representing percentage of the total net assets of the Fund.
Top Ten Holdings
| Taiwan Semiconductor Manufacturing Co. Ltd. | 3.4 % |
| Tencent Holdings Ltd. | 2.3 % |
| 3i Group PLC | 1.8 % |
| SAP SE | 1.6 % |
| BAE Systems PLC | 1.5 % |
| Lonza Group AG | 1.3 % |
| UniCredit S.p.A. | 1.3 % |
| SK Hynix, Inc. | 1.3 % |
| Sea Ltd. | 1.3 % |
| London Stock Exchange Group PLC | 1.2 % |
Sector Allocation

Geographic Diversification

Top Ten Holdings
| Taiwan Semiconductor Manufacturing Co. Ltd. | 3.4 % |
| Tencent Holdings Ltd. | 2.3 % |
| 3i Group PLC | 1.8 % |
| SAP SE | 1.6 % |
| BAE Systems PLC | 1.5 % |
| Lonza Group AG | 1.3 % |
| UniCredit S.p.A. | 1.3 % |
| SK Hynix, Inc. | 1.3 % |
| Sea Ltd. | 1.3 % |
| London Stock Exchange Group PLC | 1.2 % |
https://www.williamblairfunds.com/literature/forms
1-800-742-7272
.
What were the Fund costs for the last six months?
(Based on a hypothetical $10,000 investment)
Fund | Cost of $10,000 Investment | Cost of $10,000 Investment as a percentage |
| International Growth Fund Class R6 | $ 48 | 0.91 % |
Management’s Discussion of Fund Performance
SUMMARY OF RESULTS
The Fund returned 13.09% (net of fees) for the 6 months ended June 30, 2025. The Fund underperformed its benchmark, the MSCI All Country World ex-U.S. IMI (net), which returned 17.88%. The Fund's benchmark is also a broad measure of market performance.
From a sector perspective, allocation effect was negative due to overweight exposures to Information Technology and Consumer Discretionary. Selection effect was negative primarily within Financials, Industrials, and Health Care. On a regional view, allocation effect was positive driven by an overweight to Europe ex-U.K. and underweight to emerging Asia. Selection effect was negative within emerging Asia and Europe ex-U.K.
London Stock Exchange (“LSE”)
is a diversified global market infrastructure company with a strong mergers and acquisitions (“M&A”) track record. After strong performance of the stock over the past two years, LSE underperformed the market and the Financials sector in the first half of the year due in part to the strong UK sterling weighing on earnings estimates, as well as some uncertainty on the initial public offering and M&A market given macro risks and market volatility. We remain constructive on LSE’s resilience given its diversified revenue base, particularly in data and risk services.Sumitomo Mitsui Financial Group (“SMFG”)
is a Japanese bank whose share price has been rewarded over the past few years as Japan normalizes its interest rate policy, providing a boost to earnings power for SMFG. SMFG’s stock rebounded as yields recovered, yet still trails highs, partly due to earnings guidance falling short of market expectations.Bank Central Asia
declined during the first quarter amid deteriorated macroeconomic backdrop in Indonesia, rupiah weakness, and investor concerns about the new administration’s policy direction. In our view, fiscal 2025 guidance remains conservative, and as sentiment improves, we see positive catalysts for the stock to re-rate higher.Industrials selection was bolstered by strong performance of European defense companies, such as
BAE Systems (“BAE”)
and Thales
. However, selection was negative overall driven in part by underperformance of Waste Connections
, Recruit Holdings
, and Bunzl
.Waste Connections
—focused on non-hazardous waste services—offers defensive through-cycle growth and portfolio stability yet underperformed amid the late second quarter rally.Recruit Holdings
specializes in employment classifieds, including U.S.-based companies Indeed and Glassdoor. A weaker macro environment and a stronger Japanese yen have led to slower growth and a weaker outlook for its fiscal 2026.Bunzl
, a business-to-business supplier of low-cost consumables, cut full-year guidance due to trade and tariff uncertainty, and suspended its buyback program in anticipation of reduced profits. The position was exited.Teva Pharmaceuticals
was purchased last year as a turnaround story (return to growth and expand margins). However, we now have concerns about weaker margin guidance from management for fiscal 2025. The turnaround therefore may take longer to materialize into better earnings, and this was negative for the stock and the portfolio sold the position.TOP PERFORMANCE CONTRIBUTORS
BAE
is the largest pure-play European defense contractor with exposure to some of the largest defense markets in the world. It boasts a large and diversified portfolio that we believe includes some of the most successful and in-demand defense programs in the world.Thales
is among the world's leading providers of critical secure communications systems, with main applications in the defense, aerospace, telecommunication, and the banking industry.Sandoz Group
—spun out of Novartis in 2023—is a global leader in off-patent medicines, spanning generics and biosimilars. Although recent results modestly missed expectations, management reaffirmed full-year guidance, signaling confidence in its second-half performance. Multiple biosimilar launches are expected later this year, and the firm remains focused on expanding EBITDA margins through sales mix optimization, network streamlining, and continued transformation efforts.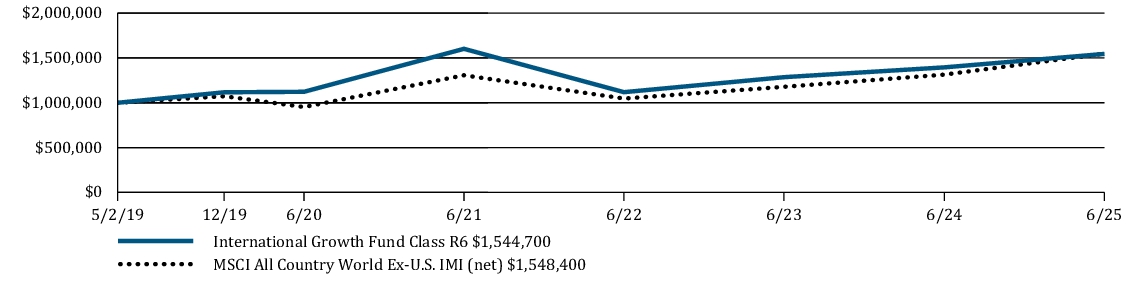
Average Annual Total Returns | 6 Months | 1 Year | 5 Years | Since Inception |
International Growth Fund Class R6 | 13.09 % | 10.75 % | 6.60 % | 7.31 % |
MSCI All Country World ex-U.S. IMI (net) | 17.88 % | 17.83 % | 10.20 % | 7.35 % |
www.williamblairfunds.com/funds/total-returns
Key Fund Statistics
Fund net assets (in $000s) | $ 1,357,077 |
Number of portfolio holdings | 182 |
Net advisory fees paid (in $000s) | $ 5,312 |
Portfolio turnover r at e (six months) | 37 % |
Graphical Representation of Holdings
The tables below show the investment makeup of the Fund, representing percentage of the total net assets of the Fund.
Top Ten Holdings
| Taiwan Semiconductor Manufacturing Co. Ltd. | 3.4 % |
| Tencent Holdings Ltd. | 2.3 % |
| 3i Group PLC | 1.8 % |
| SAP SE | 1.6 % |
| BAE Systems PLC | 1.5 % |
| Lonza Group AG | 1.3 % |
| UniCredit S.p.A. | 1.3 % |
| SK Hynix, Inc. | 1.3 % |
| Sea Ltd. | 1.3 % |
| London Stock Exchange Group PLC | 1.2 % |
Sector Allocation

Geographic Diversification
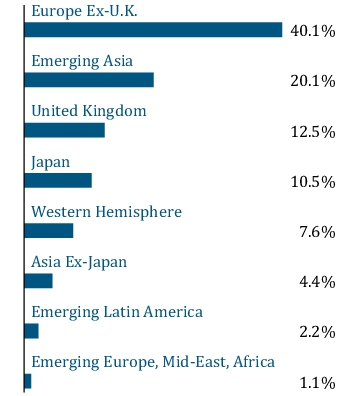
Top Ten Holdings
| Taiwan Semiconductor Manufacturing Co. Ltd. | 3.4 % |
| Tencent Holdings Ltd. | 2.3 % |
| 3i Group PLC | 1.8 % |
| SAP SE | 1.6 % |
| BAE Systems PLC | 1.5 % |
| Lonza Group AG | 1.3 % |
| UniCredit S.p.A. | 1.3 % |
| SK Hynix, Inc. | 1.3 % |
| Sea Ltd. | 1.3 % |
| London Stock Exchange Group PLC | 1.2 % |
https://www.williamblairfunds.com/literature/forms
1-800-742-7272
.
What were the Fund costs for the last six months?
(Based on a hypothetical $10,000 investment)
Fund | Cost of $10,000 Investment | Cost of $10,000 Investment as a percentage |
| Institutional International Growth Fund | $ 48 | 0.91 % |
Management’s Discussion of Fund Performance
SUMMARY OF RESULTS
The Fund returned 13.12% (net of fees) for the 6 months ended June 30, 2025. The Fund underperformed its benchmark, the MSCI All Country World ex-U.S. IMI (net), which returned 17.88%. The Fund's benchmark is also a broad measure of market performance.
From a sector perspective, allocation effect was negative due to overweight exposures to Information Technology and Consumer Discretionary. Selection effect was negative primarily within Financials, Industrials, and Health Care. On a regional view, allocation effect was positive driven by an overweight to Europe ex-U.K. and underweight to emerging Asia. Selection effect was negative within emerging Asia and Europe ex-U.K.
TOP PERFORMANCE DETRACTORS
London Stock Exchange (“LSE”)
is a diversified global market infrastructure company with a strong mergers and acquisitions (“M&A”) track record. After strong performance of the stock over the past two years, LSE underperformed the market and the Financials sector in the first half of the year due in part to the strong UK sterling weighing on earnings estimates, as well as some uncertainty on the initial public offering and M&A market given macro risks and market volatility. We remain constructive on LSE’s resilience given its diversified revenue base, particularly in data and risk services.Sumitomo Mitsui Financial Group (“SMFG”)
is a Japanese bank whose share price has been rewarded over the past few years as Japan normalizes its interest rate policy, providing a boost to earnings power for SMFG. SMFG’s stock rebounded as yields recovered, yet still trails highs, partly due to earnings guidance falling short of market expectations.Bank Central Asia
declined during the first quarter amid deteriorated macroeconomic backdrop in Indonesia, rupiah weakness, and investor concerns about the new administration’s policy direction. In our view, fiscal 2025 guidance remains conservative, and as sentiment improves, we see positive catalysts for the stock to re-rate higher.Industrials selection was bolstered by strong performance of European defense companies, such as
BAE Systems (“BAE”)
and Thales
. However, selection was negative overall driven in part by underperformance of Waste Connections
, Recruit Holdings
, and Bunzl
.Waste Connections
—focused on non-hazardous waste services—offers defensive through-cycle growth and portfolio stability yet underperformed amid the late second quarter rally.Recruit Holdings
specializes in employment classifieds, including U.S.-based companies Indeed and Glassdoor. A weaker macro environment and a stronger Japanese yen have led to slower growth and a weaker outlook for its fiscal 2026.Bunzl
, a business-to-business supplier of low-cost consumables, cut full-year guidance due to trade and tariff uncertainty, and suspended its buyback program in anticipation of reduced profits. The position was exited.Teva Pharmaceuticals was purchased last year as a turnaround story (return to growth and expand margins). However, we now have concerns about weaker margin guidance from management for fiscal 2025. The turnaround therefore may take longer to materialize into better earnings, and this was negative for the stock and the portfolio sold the position.TOP PERFORMANCE CONTRIBUTORS
BAE
is the largest pure-play European defense contractor with exposure to some of the largest defense markets in the world. It boasts a large and diversified portfolio that we believe includes some of the most successful and in-demand defense programs in the world.Thales
is among the world's leading providers of critical secure communications systems, with main applications in the defense, aerospace, telecommunication, and the banking industry.Sandoz Group
—spun out of Novartis in 2023—is a global leader in off-patent medicines, spanning generics and biosimilars. Although recent results modestly missed expectations, management reaffirmed full-year guidance, signaling confidence in its second-half performance. Multiple biosimilar launches are expected later this year, and the firm remains focused on expanding EBITDA margins through sales mix optimization, network streamlining, and continued transformation efforts.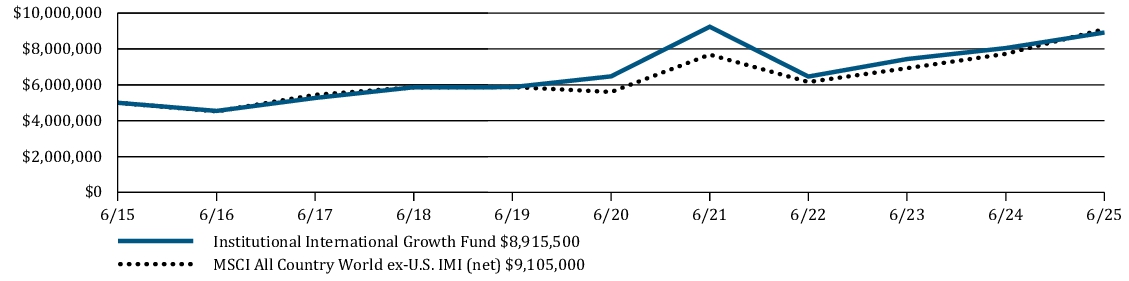
Average Annual Total Returns | 6 Months | 1 Year | 5 Years | 10 Years |
Institutional International Growth Fund | 13.12 % | 10.76 % | 6.61 % | 5.95 % |
MSCI All Country World ex-U.S. IMI (net) | 17.88 % | 17.83 % | 10.20 % | 6.18 % |
www.williamblairfunds.com/funds/total-returns
Key Fund Statistics
Fund net assets (in $000s) | $ 976,109 |
Number of portfolio holdings | 182 |
Net advisory fees paid (in $000s) | $ 3,899 |
Portfolio turnover rate (six months) | 40 % |
Graphical Representation of Holdings
The tables below show the investment makeup of the Fund, representing percentage of the total net assets of the Fund.
Top Ten Holdings
| Taiwan Semiconductor Manufacturing Co. Ltd. | 3.4 % |
| Tencent Holdings Ltd. | 2.3 % |
| 3i Group PLC | 1.8 % |
| SAP SE | 1.6 % |
| BAE Systems PLC | 1.5 % |
| Lonza Group AG | 1.3 % |
| UniCredit S.p.A. | 1.3 % |
| SK Hynix, Inc. | 1.3 % |
| Sea Ltd. | 1.3 % |
| London Stock Exchange Group PLC | 1.2 % |
Sector Allocation
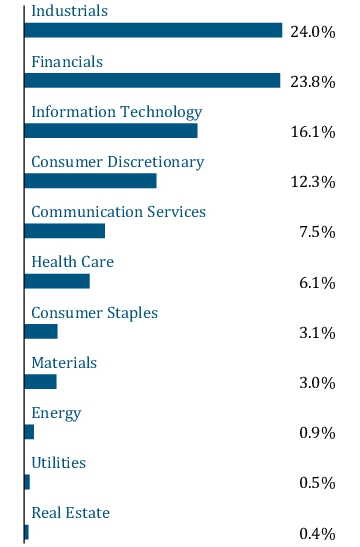
Geographic Diversification
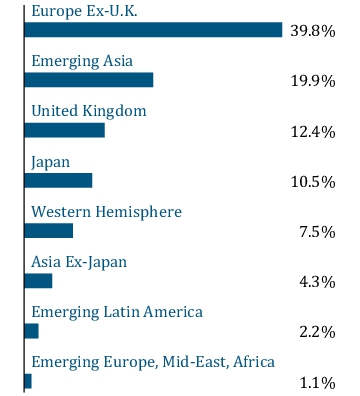
Top Ten Holdings
| Taiwan Semiconductor Manufacturing Co. Ltd. | 3.4 % |
| Tencent Holdings Ltd. | 2.3 % |
| 3i Group PLC | 1.8 % |
| SAP SE | 1.6 % |
| BAE Systems PLC | 1.5 % |
| Lonza Group AG | 1.3 % |
| UniCredit S.p.A. | 1.3 % |
| SK Hynix, Inc. | 1.3 % |
| Sea Ltd. | 1.3 % |
| London Stock Exchange Group PLC | 1.2 % |
https://www.williamblairfunds.com/literature/forms
1-800-742-7272
.
What were the Fund costs for the last six months?
(Based on a hypothetical $10,000 investment)
Fund | Cost of $10,000 Investment | Cost of $10,000 Investment as a percentage |
| International Small Cap Growth Fund Class I | $ 60 | 1.10 % |
Management’s Discussion of Fund Performance
SUMMARY OF RESULTS
The Fund returned 18.26% (net of fees) for the 6 months ended June 30, 2025. The Fund outperformed its benchmark, the MSCI All Country World ex-U.S. Small Cap Index (net), which returned 17.68% and outperformed the MSCI All Country World ex-U.S. IMI (net), a broad measure of market performance, which returned 17.88%.
The Fund outperformed the benchmark during the period on a combination of allocation effects and stock selection within Industrials and Japan. Positive sector attribution was driven by overweights to Financials and Communication Services, while overweights to Europe ex U.K. and Latin America were drivers of positive regional allocation.
TOP PERFORMANCE CONTRIBUTORS
Dassault Aviation
operates a hybrid aerospace business, manufacturing the Falcon business jet and Rafale fighter jet. The stock appreciated early in the year on strong growth in both segments, as order intake had increased 33% versus the prior year.Mildef Group
is a Swedish company specializing in rugged information technology solutions, including laptops, servers, and intelligent displays primarily designed for the defense sector. The stock appreciated in the period on strong fundamental results, including expanding margins and an uptick in orders further growing the company’s backlog.Japan Elevator Service Holdings
specializes in the OEM-agnostic maintenance and repair of elevators and escalators. The stock appreciated in the period, as earnings continue to grow and exceed what we view as conservative estimates on strong management execution.Rakuten Bank
is a leading online bank in Japan that capitalizes on the Rakuten Group's ecosystem, boasting around 100 million users to grow its customer base. The stock appreciated meaningfully in the first quarter on a combination of increasing expectations for Japanese interest rate increases and strong fundamental results, including 40% year-on-year profit growth and improved cost efficiency.TOP PERFORMANCE DETRACTORS
Hemnet Group
is Sweden’s number one online real estate marketplace. The stock underperformed in the period as fundamental results missed market expectations on lower volumes and longer listing times. We believe current valuations offer an attractive risk/reward for a company with a dominant market position.Trustpilot Group
is a global online review platform where consumers can share and read reviews about businesses, products, and services. The position had outperformed throughout the last year on a series of earnings announcements that exceeded market expectations due to strong execution as recent product launches and price increases had been well received. Share prices fell in the period despite continued strong results on market reaction to accounting adjustments in the capitalization of software development costs, share based compensation, and the exhaustion of tax credits for prior losses as the company is now profitable.In Financials, capital markets positions, including
KFin Technologies (“KFin”)
, were the primary detractors. KFin operates in a duopoly in a structurally growing business as one of the two Indian registrar and transfer agents available to mutual funds and large corporates. The company also provides SaaS-based transaction management, channel management, compliance solutions, and various other digital services to asset managers across segments. While the company continues to deliver strong fundamental results announcing 35% profit growth with strong participation across product lines in the period, the stock underperformed with the broader Indian market on a macroeconomic slowdown. The position size was increased on the cyclical market weakness and began to recover late in the period.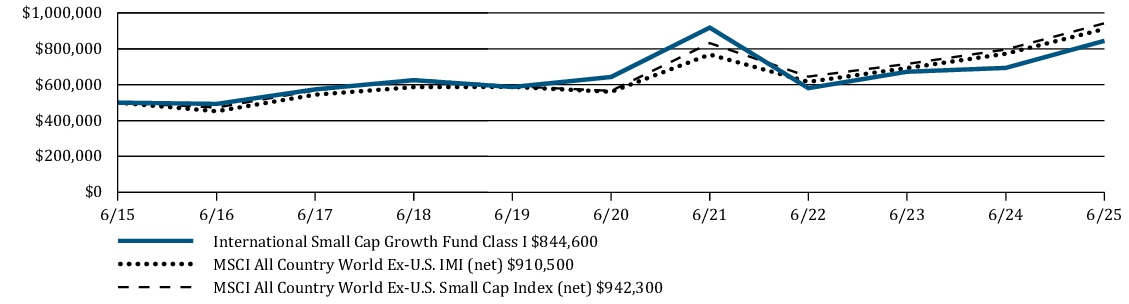
Average Annual Total Returns | 6 Months | 1 Year | 5 Years | 10 Years |
International Small Cap Growth Fund Class I | 18.26 % | 21.76 % | 5.61 % | 5.38 % |
MSCI All Country World ex-U.S. IMI (net) | 17.88 % | 17.83 % | 10.20 % | 6.18 % |
MSCI All Country World ex-U.S. Small Cap Index (net) | 17.68 % | 18.34 % | 10.74 % | 6.54 % |
www.williamblairfunds.com/funds/total-returns
Key Fu
nd
StatisticsFund net assets (in $000s) | $ 182,127 |
Number of portfolio holdings | 121 |
Net advisory fees paid (in $000s) | $ 678 |
Portfolio turnover rate (six months) | 32 % |
Graphical Representation of Holdings
The tables below show the investment makeup of the Fund, representing percentage of the
to
tal net assets of the Fund.Top Ten Holdings
| Rakuten Bank Ltd. | 2.1 % |
| BayCurrent Consulting, Inc. | 2.0 % |
| Japan Elevator Service Holdings Co. Ltd. | 2.0 % |
| Pro Medicus Ltd. | 1.9 % |
| Definity Financial Corp. | 1.8 % |
| Gjensidige Forsikring ASA | 1.7 % |
| CTS Eventim AG & Co. KGaA | 1.7 % |
| flatexDEGIRO AG | 1.6 % |
| OBIC Business Consultants Co. Ltd. | 1.5 % |
| Dassault Aviation SA | 1.5 % |
Sector Allocation
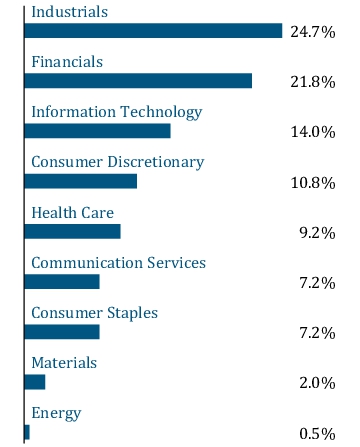
Geographic Diversification

Top Ten Holdings
| Rakuten Bank Ltd. | 2.1 % |
| BayCurrent Consulting, Inc. | 2.0 % |
| Japan Elevator Service Holdings Co. Ltd. | 2.0 % |
| Pro Medicus Ltd. | 1.9 % |
| Definity Financial Corp. | 1.8 % |
| Gjensidige Forsikring ASA | 1.7 % |
| CTS Eventim AG & Co. KGaA | 1.7 % |
| flatexDEGIRO AG | 1.6 % |
| OBIC Business Consultants Co. Ltd. | 1.5 % |
| Dassault Aviation SA | 1.5 % |
semi-annual shareholder report
contains important information about William Blair International Small Cap Growth Fund Class N (the "Fund”) for the period of January 1, 2025, to June 30, 2025.
https://www.williamblairfunds.com/literature/forms
1-800-742-7272
What were the Fund costs for the last six months?
(Based on a hypothetical $10,000 investment)
Fund | Cost of $10,000 Investment | Cost of $10,000 Investment as a percentage |
| International Small Cap Growth Fund Class N | $ 74 | 1.35 % |
Management’s Disc
ussion
of Fund PerformanceSUMMARY OF RESULTS
The Fund returned 18.03% (net of fees) for the 6 months ended June 30, 2025. The Fund outperformed its benchmark, the MSCI All Country World ex-U.S. Small Cap Index (net), which returned 17.68% and outperformed the MSCI All Country World ex-U.S. IMI (net), a broad measure of market performance, which returned 17.88%.
The Fund outperformed the benchmark during the period on a combination of allocation effects and stock selection within Industrials and Japan. Positive sector attribution was driven by overweights to Financials and Communication Services, while overweights to Europe ex U.K. and Latin America were drivers of positive regional allocation.
TOP PERFORMANCE CONTRIBUTORS
Dassault Aviation
operates a hybrid aerospace business, manufacturing the Falcon business jet and Rafale fighter jet. The stock appreciated early in the year on strong growth in both segments, as order intake had increased 33% versus the prior year.Mildef Group
is a Swedish company specializing in rugged information technology solutions, including laptops, servers, and intelligent displays primarily designed for the defense sector. The stock appreciated in the period on strong fundamental results, including expanding margins and an uptick in orders further growing the company’s backlog.Japan Elevator Service Holdings
specializes in the OEM-agnostic maintenance and repair of elevators and escalators. The stock appreciated in the period, as earnings continue to grow and exceed what we view as conservative estimates on strong management execution.Rakuten Bank
is a leading online bank in Japan that capitalizes on the Rakuten Group's ecosystem, boasting around 100 million users to grow its customer base. The stock appreciated meaningfully in the first quarter on a combination of increasing expectations for Japanese interest rate increases and strong fundamental results, including 40% year-on-year profit growth and improved cost efficiency.TOP PERFORMANCE DETRACTORS
Hemnet Group
is Sweden’s number one online real estate marketplace. The stock underperformed in the period as fundamental results missed market expectations on lower volumes and longer listing times. We believe current valuations offer an attractive risk/reward for a company with a dominant market position.Trustpilot Group
is a global online review platform where consumers can share and read reviews about businesses, products, and services. The position had outperformed throughout the last year on a series of earnings announcements that exceeded market expectations due to strong execution as recent product launches and price increases had been well received. Share prices fell in the period despite continued strong results on market reaction to accounting adjustments in the capitalization of software development costs, share based compensation, and the exhaustion of tax credits for prior losses as the company is now profitable.In Financials, capital markets positions, including
KFin Technologies (“KFin”)
, were the primary detractors. KFin operates in a duopoly in a structurally growing business as one of the two Indian registrar and transfer agents available to mutual funds and large corporates. The company also provides SaaS-based transaction management, channel management, compliance solutions, and various other digital services to asset managers across segments. While the company continues to deliver strong fundamental results announcing 35% profit growth with strong participation across product lines in the period, the stock underperformed with the broader Indian market on a macroeconomic slowdown. The position size was increased on the cyclical market weakness and began to recover late in the period.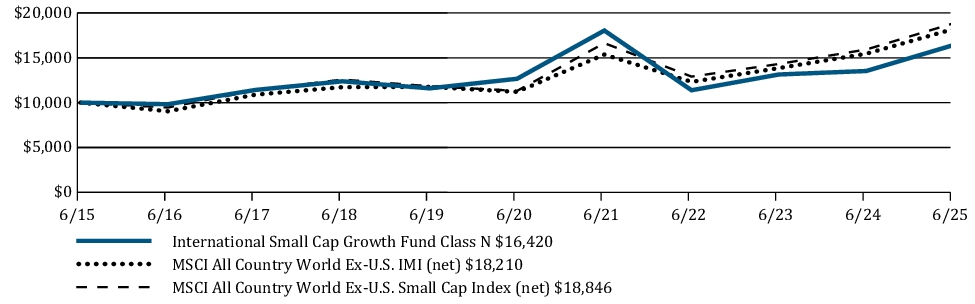
Average Annual Total Returns | 6 Months | 1 Year | 5 Years | 10 Years |
International Small Cap Growth Fund Class N | 18.03 % | 21.37 % | 5.33 % | 5.08 % |
MSCI All Country World ex-U.S. IMI (net) | 17.88 % | 17.83 % | 10.20 % | 6.18 % |
MSCI All Country World ex-U.S. Small Cap Index (net) | 17.68 % | 18.34 % | 10.74 % | 6.54 % |
www.williamblairfunds.com/funds/total-returns
Key Fund Statistics
Fund net assets (in $000s) | $ 182,127 |
Number of portfolio holdings | 121 |
Net advisory fees paid (in $000s) | $ 678 |
Portfolio turnover rate (six months) | 32 % |
Graphical Representation of Holdings
The tables below show the investment makeup of the Fund, representing percentage of the total net assets of the Fund.
Top Ten Holdings
| Rakuten Bank Ltd. | 2.1 % |
| BayCurrent Consulting, Inc. | 2.0 % |
| Japan Elevator Service Holdings Co. Ltd. | 2.0 % |
| Pro Medicus Ltd. | 1.9 % |
| Definity Financial Corp. | 1.8 % |
| Gjensidige Forsikring ASA | 1.7 % |
| CTS Eventim AG & Co. KGaA | 1.7 % |
| flatexDEGIRO AG | 1.6 % |
| OBIC Business Consultants Co. Ltd. | 1.5 % |
| Dassault Aviation SA | 1.5 % |
Sector Allocation

Geographic Diversification

Top Ten Holdings
| Rakuten Bank Ltd. | 2.1 % |
| BayCurrent Consulting, Inc. | 2.0 % |
| Japan Elevator Service Holdings Co. Ltd. | 2.0 % |
| Pro Medicus Ltd. | 1.9 % |
| Definity Financial Corp. | 1.8 % |
| Gjensidige Forsikring ASA | 1.7 % |
| CTS Eventim AG & Co. KGaA | 1.7 % |
| flatexDEGIRO AG | 1.6 % |
| OBIC Business Consultants Co. Ltd. | 1.5 % |
| Dassault Aviation SA | 1.5 % |
https://www.williamblairfunds.com/literature/forms
1-800-742-7272
.
What were the Fund costs for the last six months?
(Based on a hypothetical $10,000 investment)
Fund | Cost of $10,000 Investment | Cost of $10,000 Investment as a percentage |
| International Small Cap Growth Fund Class R6 | $ 57 | 1.05 % |
Manage
me
nt’s Discussion of Fund PerformanceSUMMARY OF RESULTS
The Fund returned 18.22% (net of fees) for the 6 months ended June 30, 2025. The Fund outperformed its benchmark, the MSCI All Country World ex-U.S. Small Cap Index (net), which returned 17.68% and outperformed the MSCI All Country World ex-U.S. IMI (net), a broad measure of market performance, which returned 17.88%.
The Fund outperformed the benchmark during the period on a combination of allocation effects and stock selection within Industrials and Japan. Positive sector attribution was driven by overweights to Financials and Communication Services, while overweights to Europe ex U.K. and Latin America were drivers of positive regional allocation.
TOP PERFORMANCE CONTRIBUTORS
Dassault Aviation
operates a hybrid aerospace business, manufacturing the Falcon business jet and Rafale fighter jet. The stock appreciated early in the year on strong growth in both segments, as order intake had increased 33% versus the prior year.Mildef Group
is a Swedish company specializing in rugged information technology solutions, including laptops, servers, and intelligent displays primarily designed for the defense sector. The stock appreciated in the period on strong fundamental results, including expanding margins and an uptick in orders further growing the company’s backlog.Japan Elevator Service Holdings
specializes in the OEM-agnostic maintenance and repair of elevators and escalators. The stock appreciated in the period, as earnings continue to grow and exceed what we view as conservative estimates on strong management execution.Rakuten Bank
is a leading online bank in Japan that capitalizes on the Rakuten Group's ecosystem, boasting around 100 million users to grow its customer base. The stock appreciated meaningfully in the first quarter on a combination of increasing expectations for Japanese interest rate increases and strong fundamental results, including 40% year-on-year profit growth and improved cost efficiency.TOP PERFORMANCE DETRACTORS
Hemnet Group
is Sweden’s number one online real estate marketplace. The stock underperformed in the period as fundamental results missed market expectations on lower volumes and longer listing times. We believe current valuations offer an attractive risk/reward for a company with a dominant market position.Trustpilot Group
is a global online review platform where consumers can share and read reviews about businesses, products, and services. The position had outperformed throughout the last year on a series of earnings announcements that exceeded market expectations due to strong execution as recent product launches and price increases had been well received. Share prices fell in the period despite continued strong results on market reaction to accounting adjustments in the capitalization of software development costs, share based compensation, and the exhaustion of tax credits for prior losses as the company is now profitable.In Financials, capital markets positions, including
KFin Technologies (“KFin”)
, were the primary detractors. KFin operates in a duopoly in a structurally growing business as one of the two Indian registrar and transfer agents available to mutual funds and large corporates. The company also provides SaaS-based transaction management, channel management, compliance solutions, and various other digital services to asset managers across segments. While the company continues to deliver strong fundamental results announcing 35% profit growth with strong participation across product lines in the period, the stock underperformed with the broader Indian market on a macroeconomic slowdown. The position size was increased on the cyclical market weakness and began to recover late in the period.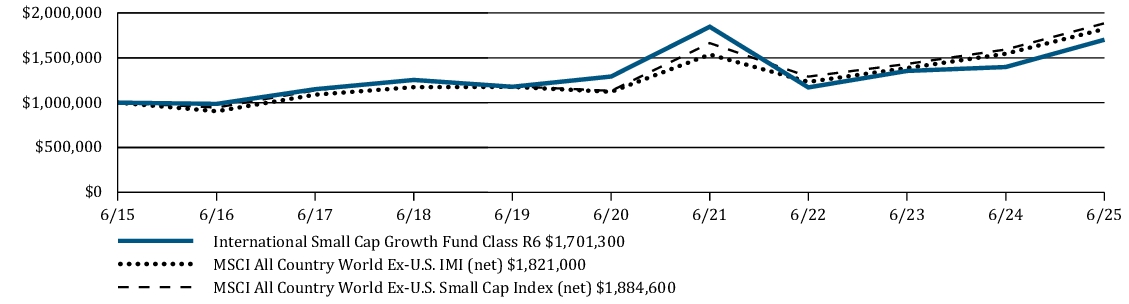
Average Annual Total Returns | 6 Months | 1 Year | 5 Years | 10 Years |
International Small Cap Growth Fund Class R6 | 18.22 % | 21.77 % | 5.67 % | 5.46 % |
MSCI All Country World ex-U.S. IMI (net) | 17.88 % | 17.83 % | 10.20 % | 6.18 % |
MSCI All Country World ex-U.S. Small Cap Index (net) | 17.68 % | 18.34 % | 10.74 % | 6.54 % |
www.williamblairfunds.com/funds/total-returns
Key Fund Statistics
Fund net assets (in $000s) | $ 182,127 |
Number of portfolio holdings | 121 |
Net advisory fees paid (in $000s) | $ 678 |
Portfolio turnover rate (six months) | 32 % |
Graphical Representation of Holdings
The tables below show the investment makeup of the Fund, representing percentage of the total net assets of the Fund.
Top Ten Holdings
| Rakuten Bank Ltd. | 2.1 % |
| BayCurrent Consulting, Inc. | 2.0 % |
| Japan Elevator Service Holdings Co. Ltd. | 2.0 % |
| Pro Medicus Ltd. | 1.9 % |
| Definity Financial Corp. | 1.8 % |
| Gjensidige Forsikring ASA | 1.7 % |
| CTS Eventim AG & Co. KGaA | 1.7 % |
| flatexDEGIRO AG | 1.6 % |
| OBIC Business Consultants Co. Ltd. | 1.5 % |
| Dassault Aviation SA | 1.5 % |
Sector Allocation

Geographic Diversification
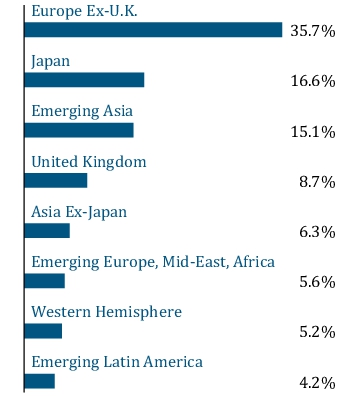
Top Ten Holdings
| Rakuten Bank Ltd. | 2.1 % |
| BayCurrent Consulting, Inc. | 2.0 % |
| Japan Elevator Service Holdings Co. Ltd. | 2.0 % |
| Pro Medicus Ltd. | 1.9 % |
| Definity Financial Corp. | 1.8 % |
| Gjensidige Forsikring ASA | 1.7 % |
| CTS Eventim AG & Co. KGaA | 1.7 % |
| flatexDEGIRO AG | 1.6 % |
| OBIC Business Consultants Co. Ltd. | 1.5 % |
| Dassault Aviation SA | 1.5 % |
https://www.williamblairfunds.com/literature/forms
1-800-742-7272
.
What were the Fund costs for the last six months?
(Based on a hypothetical $10,000 investment)
Fund |
Cost of $10,000 Investment |
Cost of $10,000 Investment as a percentage |
| Emerging Markets Leaders Fund Class I | $ 52 |
0.99 % |
Management’s Discussion of Fund Performance
SUMMARY OF RESULTS
The Fund returned 11.68% (net of fees) for the 6 months ended June 30, 2025. The Fund underperformed its benchmark, the MSCI Emerging Markets Index (net), which returned 15.27%. The Fund's benchmark is also a broad measure of market performance.
The underperformance versus the index during the period was driven by a combination of stock selection in Consumer Discretionary and Industrials, and sector allocation effects driven by overweights to Information Technology and Consumer Discretionary.
TOP PERFORMANCE DETRACTORS
Trip.com
is China’s leading online travel agency, with a dominant market share. Trip.com offers a comprehensive range of services, including transportation ticketing, hotel bookings, packaged tours, and destination resort tickets. While fundamental performance continues to benefit from the structural growth in Chinese consumers’ travel spending, management reduced expected margins as it is looking to expand the platform internationally. The position was trimmed slightly.Meituan
is the leading Chinese online platform for food delivery and local services, and it also offers hotel and travel booking services. The stock has underperformed, as a significant competitor has entered the food delivery business and is heavily subsidizing to take market share. Meituan has responded and reduced prices to maintain share but expects pricing to normalize as the competitive environment is quickly becoming more rational. We believe the market is pricing in a worst-case scenario and added to the position size on price weakness.Polycab India
is India's largest manufacturer of wires and cables and underperformed on a combination of macroeconomic headwinds and a shift in competitive dynamics with the entry of two new businesses with deep resources that will attempt to take market share; the position was trimmed on the latter.Voltronic Power Technology
is a white-label, outsourced designer and manufacturer of uninterrupted power supply units and power inverters used in applications including solar, energy storage, and EV chargers. The stock was down despite earnings that were in line with expectations and no change to forward expectations. We added to our position on price weakness.TOP PERFORMANCE CONTRIBUTORS
Sea Limited
is an Indonesian digital platform that provides e-commerce, gaming, and financial services. Sea Limited’s e-commerce business, Shopee Ptd. Ltd., is the largest pan-regional e-commerce platform in Southeast Asia and Taiwan and has a significant presence in Latin America. The stock appreciated on strong fundamental growth across all three key business segments and management’s upgraded forward guidance.SK Hynix
, which is a South Korea–based artificial intelligence enabler and a pure-play manufacturer of memory semiconductors focusing on DRAM and NAND was among the strongest performers. The stock appreciated in the period on expectations for continued artificial intelligence demand and tailwinds for Korean equities following the presidential election in early June. Bharat Electronics (“Bharat”)
is an Indian capital goods company with strong technological expertise in defense electronics. We believe Indian defense is one of the strongest secular growth stories in emerging market industrials, driven by indigenization as India is the world’s largest importer of arms, a shift in military spending toward capex from wages, and the need to replace/service older-generation military aircraft. The stock appreciated on strong fundamental results including 23% earnings growth in the period, and expectations for increased spend following a conflict with Pakistan.MercadoLibre, Inc. (“MELI”)
is a leading e‐commerce platform in Latin America with a best‐in‐class ecosystem of services such as logistics and payments. The stock has continued to appreciate on strong fundamental results across geographies with total revenue growth of 37% over the last year as it is executing across both its core e-commerce and financial technology segments. We believe the market in Latin America provides a runway for continued growth and investment given MELI’s best-in-class ecosystem.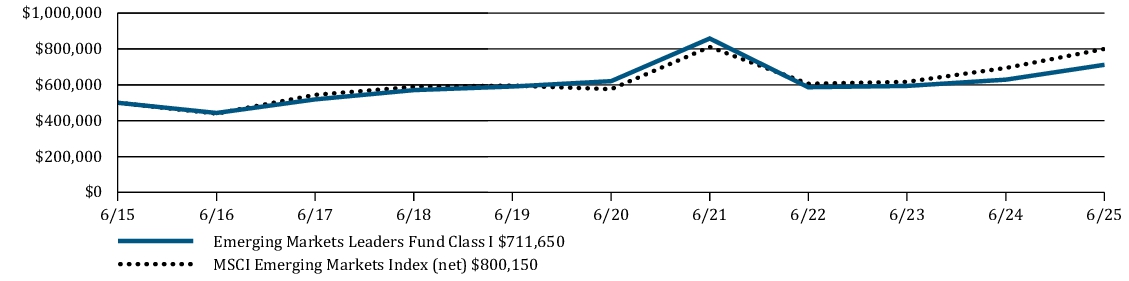
Average Annual Total Returns |
6 Months |
1 Year |
5 Years |
10 Years |
Emerging Markets Leaders Fund Class I |
11.68 % |
13.18 % |
2.78 % |
3.59 % |
MSCI Emerging Markets Index (net) |
15.27 % |
15.29 % |
6.81 % |
4.81 % |
www.williamblairfunds.com/funds/total-returns
Key Fund Statistics
Fund net assets (in $000s) |
$ 159,781 |
Number of portfolio holdings |
62 |
Net advisory fees paid (in $000s) |
$ 574 |
Portfolio turnover rate (six months) |
36 % |
Graphical Representation of Holdings
The tables below show the investment makeup of the Fund, representing percentage of the total net assets of the Fund.
Top Ten Holdings
| Taiwan Semiconductor Manufacturing Co. Ltd. | 11.4 % |
| Tencent Holdings Ltd. | 6.9 % |
| SK Hynix, Inc. | 3.4 % |
| NetEase, Inc. | 2.9 % |
| HDFC Bank Ltd. | 2.9 % |
| Bank Central Asia Tbk. PT | 2.5 % |
| Meituan | 2.3 % |
| MercadoLibre, Inc. | 2.2 % |
| Bharat Electronics Ltd. | 2.2 % |
| Itau Unibanco Holding SA. | 2.0 % |
Sector Allocation
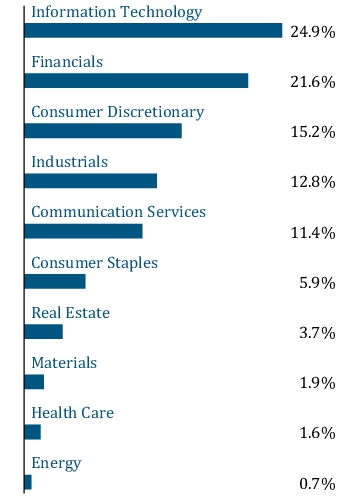
Geographic Diversification

Top Ten Holdings
| Taiwan Semiconductor Manufacturing Co. Ltd. | 11.4 % |
| Tencent Holdings Ltd. | 6.9 % |
| SK Hynix, Inc. | 3.4 % |
| NetEase, Inc. | 2.9 % |
| HDFC Bank Ltd. | 2.9 % |
| Bank Central Asia Tbk. PT | 2.5 % |
| Meituan | 2.3 % |
| MercadoLibre, Inc. | 2.2 % |
| Bharat Electronics Ltd. | 2.2 % |
| Itau Unibanco Holding SA. | 2.0 % |
https://www.williamblairfunds.com/literature/forms
1-800-742-7272
.
What were the Fund costs for the last six months?
(Based on a hypothetical $10,000 investment)
Fund | Cost of $10,000 Investment | Cost of $10,000 Investment as a percentage |
| Emerging Markets Leaders Fund Class N | $ 66 | 1.24 % |
Management’s Discussion of Fund Performance
SUMMARY OF RESULTS
The Fund returned 11.62% (net of fees) for the 6 months ended June 30, 2025. The Fund underperformed its benchmark, the MSCI Emerging Markets Index (net), which returned 15.27%. The Fund's benchmark is also a broad measure of market performance.
The underperformance versus the index during the period was driven by a combination of stock selection in Consumer Discretionary and Industrials, and sector allocation effects driven by overweights to Information Technology and Consumer Discretionary.
TOP PERFORMANCE DETRACTORS
Trip.com
is China’s leading online travel agency, with a dominant market share. Trip.com offers a comprehensive range of services, including transportation ticketing, hotel bookings, packaged tours, and destination resort tickets. While fundamental performance continues to benefit from the structural growth in Chinese consumers’ travel spending, management reduced expected margins as it is looking to expand the platform internationally. The position was trimmed slightly.Meituan
is the leading Chinese online platform for food delivery and local services, and it also offers hotel and travel booking services. The stock has underperformed, as a significant competitor has entered the food delivery business and is heavily subsidizing to take market share. Meituan has responded and reduced prices to maintain share but expects pricing to normalize as the competitive environment is quickly becoming more rational. We believe the market is pricing in a worst-case scenario and added to the position size on price weakness.Polycab India
is India's largest manufacturer of wires and cables and underperformed on a combination of macroeconomic headwinds and a shift in competitive dynamics with the entry of two new businesses with deep resources that will attempt to take market share; the position was trimmed on the latter.Voltronic Power Technology
is a white-label, outsourced designer and manufacturer of uninterrupted power supply units and power inverters used in applications including solar, energy storage, and EV chargers. The stock was down despite earnings that were in line with expectations and no change to forward expectations. We added to our position on price weakness.TOP PERFORMANCE CONTRIBUTORS
Sea Limited
is an Indonesian digital platform that provides e-commerce, gaming, and financial services. Sea Limited’s e-commerce business, Shopee Ptd. Ltd., is the largest pan-regional e-commerce platform in Southeast Asia and Taiwan and has a significant presence in Latin America. The stock appreciated on strong fundamental growth across all three key business segments and management’s upgraded forward guidance.SK Hynix
, which is a South Korea–based artificial intelligence enabler and a pure-play manufacturer of memory semiconductors focusing on DRAM and NAND was among the strongest performers. The stock appreciated in the period on expectations for continued artificial intelligence demand and tailwinds for Korean equities following the presidential election in early June. Bharat Electronics (“Bharat”)
is an Indian capital goods company with strong technological expertise in defense electronics. We believe Indian defense is one of the strongest secular growth stories in emerging market industrials, driven by indigenization as India is the world’s largest importer of arms, a shift in military spending toward capex from wages, and the need to replace/service older-generation military aircraft. The stock appreciated on strong fundamental results including 23% earnings growth in the period, and expectations for increased spend following a conflict with Pakistan.MercadoLibre, Inc. (“MELI”)
is a leading e‐commerce platform in Latin America with a best‐in‐class ecosystem of services such as logistics and payments. The stock has continued to appreciate on strong fundamental results across geographies with total revenue growth of 37% over the last year as it is executing across both its core e-commerce and financial technology segments. We believe the market in Latin America provides a runway for continued growth and investment given MELI’s best-in-class ecosystem.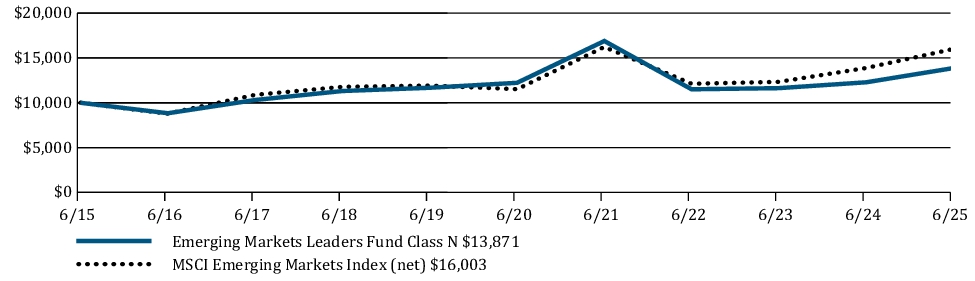
Average Annual Total Returns | 6 Months | 1 Year | 5 Years | 10 Years |
Emerging Markets Leaders Fund Class N | 11.62 % | 12.92 % | 2.56 % | 3.33 % |
MSCI Emerging Markets Index (net) | 15.27 % | 15.29 % | 6.81 % | 4.81 % |
www.williamblairfunds.com/funds/total-returns
Key Fund Statistics
Fund net assets (in $000s) | $ 159,781 |
Number of portfolio holdings | 62 |
Net advisory fees paid (in $000s) | $ 574 |
Portfolio turnover rate (six months) | 36 % |
Graphical Representation of Holdings
The tables below show the investment makeup of the Fund, representing percentage of the total net assets of the Fund.
Top Ten Holdings
| Taiwan Semiconductor Manufacturing Co. Ltd. | 11.4 % |
| Tencent Holdings Ltd. | 6.9 % |
| SK Hynix, Inc. | 3.4 % |
| NetEase, Inc. | 2.9 % |
| HDFC Bank Ltd. | 2.9 % |
| Bank Central Asia Tbk. PT | 2.5 % |
| Meituan | 2.3 % |
| MercadoLibre, Inc. | 2.2 % |
| Bharat Electronics Ltd. | 2.2 % |
| Itau Unibanco Holding SA. | 2.0 % |
Sector Allocation

Geographic Diversification
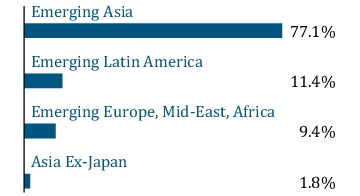
Top Ten Holdings
| Taiwan Semiconductor Manufacturing Co. Ltd. | 11.4 % |
| Tencent Holdings Ltd. | 6.9 % |
| SK Hynix, Inc. | 3.4 % |
| NetEase, Inc. | 2.9 % |
| HDFC Bank Ltd. | 2.9 % |
| Bank Central Asia Tbk. PT | 2.5 % |
| Meituan | 2.3 % |
| MercadoLibre, Inc. | 2.2 % |
| Bharat Electronics Ltd. | 2.2 % |
| Itau Unibanco Holding SA. | 2.0 % |
https://www.williamblairfunds.com/literature/forms
1-800-742-7272
.
What were the Fund costs for the last six months?
(Based on a hypothetical $10,000 investment)
Fund | Cost of $10,000 Investment | Cost of $10,000 Investment as a percentage |
| Emerging Markets Leaders Fund Class R6 | $ 50 | 0.94 % |
Management’s Dis
cus
sion of Fund PerformanceSUMMARY OF RESULTS
The Fund returned 11.80% (net of fees) for the 6 months ended June 30, 2025. The Fund underperformed its benchmark, the MSCI Emerging Markets Index (net), which returned 15.27%. The Fund's benchmark is also a broad measure of market performance.
The underperformance versus the index during the period was driven by a combination of stock selection in Consumer Discretionary and Industrials, and sector allocation effects driven by overweights to Information Technology and Consumer Discretionary.
TOP PERFORMANCE DETRACTORS
Trip.com
is China’s leading online travel agency, with a dominant market share. Trip.com offers a comprehensive range of services, including transportation ticketing, hotel bookings, packaged tours, and destination resort tickets. While fundamental performance continues to benefit from the structural growth in Chinese consumers’ travel spending, management reduced expected margins as it is looking to expand the platform internationally. The position was trimmed slightly.Meituan
is the leading Chinese online platform for food delivery and local services, and it also offers hotel and travel booking services. The stock has underperformed, as a significant competitor has entered the food delivery business and is heavily subsidizing to take market share. Meituan has responded and reduced prices to maintain share but expects pricing to normalize as the competitive environment is quickly becoming more rational. We believe the market is pricing in a worst-case scenario and added to the position size on price weakness.Polycab India
is India's largest manufacturer of wires and cables and underperformed on a combination of macroeconomic headwinds and a shift in competitive dynamics with the entry of two new businesses with deep resources that will attempt to take market share; the position was trimmed on the latter.Voltronic Power Technology
is a white-label, outsourced designer and manufacturer of uninterrupted power supply units and power inverters used in applications including solar, energy storage, and EV chargers. The stock was down despite earnings that were in line with expectations and no change to forward expectations. We added to our position on price weakness.TOP PERFORMANCE CONTRIBUTORS
Sea Limited
is an Indonesian digital platform that provides e-commerce, gaming, and financial services. Sea Limited’s e-commerce business, Shopee Ptd. Ltd., is the largest pan-regional e-commerce platform in Southeast Asia and Taiwan and has a significant presence in Latin America. The stock appreciated on strong fundamental growth across all three key business segments and management’s upgraded forward guidance.SK Hynix
, which is a South Korea–based artificial intelligence enabler and a pure-play manufacturer of memory semiconductors focusing on DRAM and NAND was among the strongest performers. The stock appreciated in the period on expectations for continued artificial intelligence demand and tailwinds for Korean equities following the presidential election in early June. Bharat Electronics (“Bharat”)
is an Indian capital goods company with strong technological expertise in defense electronics. We believe Indian defense is one of the strongest secular growth stories in emerging market industrials, driven by indigenization as India is the world’s largest importer of arms, a shift in military spending toward capex from wages, and the need to replace/service older-generation military aircraft. The stock appreciated on strong fundamental results including 23% earnings growth in the period, and expectations for increased spend following a conflict with Pakistan.MercadoLibre, Inc. (“MELI”)
is a leading e‐commerce platform in Latin America with a best‐in‐class ecosystem of services such as logistics and payments. The stock has continued to appreciate on strong fundamental results across geographies with total revenue growth of 37% over the last year as it is executing across both its core e-commerce and financial technology segments. We believe the market in Latin America provides a runway for continued growth and investment given MELI’s best-in-class ecosystem.
Average Annual Total Returns | 6 Months | 1 Year | 5 Years | 10 Years |
Emerging Markets Leaders Fund Class R6 | 11.80 % | 13.37 % | 2.85 % | 3.66 % |
MSCI Emerging Markets Index (net) | 15.27 % | 15.29 % | 6.81 % | 4.81 % |
www.williamblairfunds.com/funds/total-returns
Key Fund Statistics
Fund net assets (in $000s) | $ 159,781 |
Number of portfolio holdings | 62 |
Net advisory fees paid (in $000s) | $ 574 |
Portfolio turnover rate (six months) | 36 % |
Graphical Representation of Holdings
The tables below show the investment makeup of the Fund, representing percentage of the total net assets of the Fund.
Top Ten Holdings
| Taiwan Semiconductor Manufacturing Co. Ltd. | 11.4 % |
| Tencent Holdings Ltd. | 6.9 % |
| SK Hynix, Inc. | 3.4 % |
| NetEase, Inc. | 2.9 % |
| HDFC Bank Ltd. | 2.9 % |
| Bank Central Asia Tbk. PT | 2.5 % |
| Meituan | 2.3 % |
| MercadoLibre, Inc. | 2.2 % |
| Bharat Electronics Ltd. | 2.2 % |
| Itau Unibanco Holding SA. | 2.0 % |
Sector Allocation

Geographic Diversification

Top Ten Holdings
| Taiwan Semiconductor Manufacturing Co. Ltd. | 11.4 % |
| Tencent Holdings Ltd. | 6.9 % |
| SK Hynix, Inc. | 3.4 % |
| NetEase, Inc. | 2.9 % |
| HDFC Bank Ltd. | 2.9 % |
| Bank Central Asia Tbk. PT | 2.5 % |
| Meituan | 2.3 % |
| MercadoLibre, Inc. | 2.2 % |
| Bharat Electronics Ltd. | 2.2 % |
| Itau Unibanco Holding SA. | 2.0 % |
https://www.williamblairfunds.com/literature/forms
1-800-742-7272
.
What were the Fund costs for the last six months?
(Based on a hypothetical $10,000 investment)
Fund | Cost of $10,000 Investment | Cost of $10,000 Investment as a percentage |
| Emerging Markets Growth Fund Class I | $ 52 | 0.99 % |
Management’s Discussion of Fund Performance
SUMMARY OF RESULTS
The Fund returned 9.20% (net of fees) for the 6 months ended June 30, 2025. The Fund underperformed its benchmark, the MSCI Emerging Markets IMI (net), which returned 14.62%. The Fund's benchmark is also a broad measure of market performance.
Underperformance versus the index year-to-date was primarily driven by weak performance in the first quarter amid strong style headwinds and sharp country rotation. From a sector perspective, the underperformance was driven by negative stock selection within Consumer Discretionary and Financials.
TOP PERFORMANCE DETRACTORS
Alibaba
is e-commerce in China. Alibaba detracted the most at the beginning of the year due to the portfolio underweighting as the share price rallied. The strong outperformance was fueled by renewed investor optimism about its artificial intelligence (“AI”) initiatives and perceived government support for private enterprises. Furthermore, the overweight position in the second quarter also detracted as the stock corrected amid market rotation, renewed geopolitical concerns, and management’s lowered revenue and profit guidance primarily due to its continued investment in user growth and strategic initiatives.Trip.com
is China’s leading online travel agency, with a dominant market share. Trip.com offers a comprehensive range of services including transportation ticketing, hotel bookings, packaged tours, and destination resort tickets. Trip.com’s stock weakened in the first quarter of the year as the company announced increased marketing investments overseas to gain market share, which we expect to weigh on profit growth in the near term.Bank Central Asia
, Indonesia’s largest private bank, declined amid a deteriorated macroeconomic backdrop in Indonesia, rupiah weakness, and investor concerns about the new administration’s policy direction.Banco Galicia
, a leading Argentine financial institution, along with broader Argentine equities, posted strong gains in 2024 amid optimism about political change and early signs of macro stabilization. However, in 2025, the stock corrected as market enthusiasm moderated amid rising concerns about inflation, policy execution, and renewed currency volatility.TOP PERFORMANCE CONTRIBUTORS
SK Hynix
, a leading memory chipmaker, delivered exceptional returns on the back of its early leadership in high-bandwidth memory critical for AI servers. Strong demand and pricing power supported continued earnings momentum. Xiaomi Corp
, a global consumer electronics and smartphone manufacturer, also contributed meaningfully. The company reported record profit growth, fueled by strong smartphone sales in China, increased advertising revenue, and the successful launch of its electric vehicle, which reinforced its brand and ecosystem strategy.MercadoLibre, Inc. (“MELI”)
is a leading e-commerce platform in Latin America with a best-in-class ecosystem of services such as logistics and payments. MELI continued to benefit from its dominant market position, strong execution, and accelerating growth across both commerce and financial services platforms. The company delivered robust earnings, with strong gross merchandise value growth, improving take-rates, and a rapidly expanding credit portfolio, particularly in credit cards, driving upside surprises.Sea Limited
is an Indonesian digital platform that provides e-commerce, gaming, and financial services. Sea Limited was a strong contributor to relative performance, supported by a sharp rebound in profitability across its core businesses. Shopee Ptd. Ltd.
, Sea Limited’s e-commerce platform, saw strong user engagement and monetization improvements, while its financial technology business benefited from rising digital payments adoption and improved cost discipline, leading to upward revisions in guidance.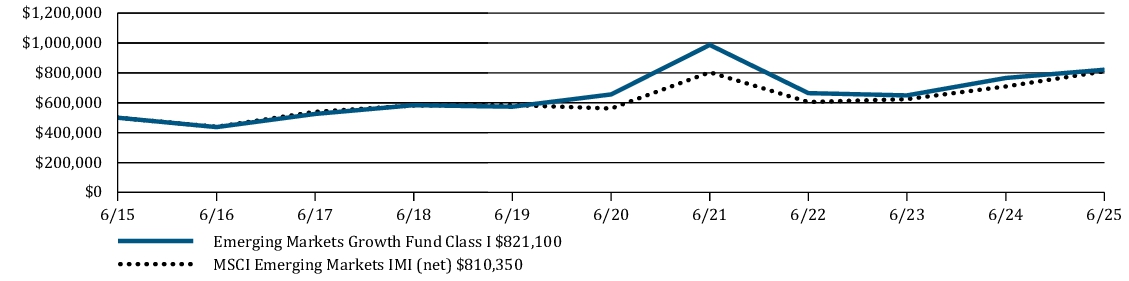
Average Annual Total Returns | 6 Months | 1 Year | 5 Years | 10 Years |
Emerging Markets Growth Fund Class I | 9.20 % | 7.22 % | 4.59 % | 5.09 % |
MSCI Emerging Markets IMI (net) | 14.62 % | 14.28 % | 7.61 % | 4.95 % |
www.williamblairfunds.com/funds/total-returns
Key Fund Statistics
Fund net assets (in $000s) | $ 890,141 |
Number of portfolio holdings | 126 |
Net advisory fees paid (in $000s) | $ 3,469 |
Portfolio turnover rate (six months) | 40 % |
Graphical Representation of Holdings
The tables below show the investment makeup of the Fund, representing percentage of the total net assets of the Fund.
Top Ten Holdings
| Taiwan Semiconductor Manufacturing Co. Ltd. | 13.3 % |
| Tencent Holdings Ltd. | 6.0 % |
| SK Hynix, Inc. | 4.2 % |
| MercadoLibre, Inc. | 3.3 % |
| Alibaba Group Holding Ltd. | 3.1 % |
| Xiaomi Corporation | 2.7 % |
| Sea Ltd. | 2.5 % |
| ICICI Bank Ltd. | 2.2 % |
| MediaTek, Inc. | 2.1 % |
| HDFC Bank Ltd. | 1.9 % |
Sector Allocation

Geographic Diversification

Top Ten Holdings
| Taiwan Semiconductor Manufacturing Co. Ltd. | 13.3 % |
| Tencent Holdings Ltd. | 6.0 % |
| SK Hynix, Inc. | 4.2 % |
| MercadoLibre, Inc. | 3.3 % |
| Alibaba Group Holding Ltd. | 3.1 % |
| Xiaomi Corporation | 2.7 % |
| Sea Ltd. | 2.5 % |
| ICICI Bank Ltd. | 2.2 % |
| MediaTek, Inc. | 2.1 % |
| HDFC Bank Ltd. | 1.9 % |
https://www.williamblairfunds.com/literature/forms
1-800-742-7272
.
What were the Fund costs for the last six months?
(Based on a hypothetical $10,000 investment)
Fund | Cost of $10,000 Investment | Cost of $10,000 Investment as a percentage |
| Emerging Markets Growth Fund Class N | $ 65 | 1.24 % |
Management
’s Discussion of Fund PerformanceSUMMARY OF RESULTS
The Fund returned 9.02% (net of fees) for the 6 months ended June 30, 2025. The Fund underperformed its benchmark, the MSCI Emerging Markets IMI (net), which returned 14.62%. The Fund's benchmark is also a broad measure of market performance.
Underperformance versus the index year-to-date was primarily driven by weak performance in the first quarter amid strong style headwinds and sharp country rotation. From a sector perspective, the underperformance was driven by negative stock selection within Consumer Discretionary and Financials.
TOP PERFORMANCE DETRACTORS
Alibaba
is e-commerce in China. Alibaba detracted the most at the beginning of the year due to the portfolio underweighting as the share price rallied. The strong outperformance was fueled by renewed investor optimism about its artificial intelligence (“AI”) initiatives and perceived government support for private enterprises. Furthermore, the overweight position in the second quarter also detracted as the stock corrected amid market rotation, renewed geopolitical concerns, and management’s lowered revenue and profit guidance primarily due to its continued investment in user growth and strategic initiatives.Trip.com
is China’s leading online travel agency, with a dominant market share. Trip.com offers a comprehensive range of services including transportation ticketing, hotel bookings, packaged tours, and destination resort tickets. Trip.com’s stock weakened in the first quarter of the year as the company announced increased marketing investments overseas to gain market share, which we expect to weigh on profit growth in the near term.Bank Central Asia
, Indonesia’s largest private bank, declined amid a deteriorated macroeconomic backdrop in Indonesia, rupiah weakness, and investor concerns about the new administration’s policy direction.Banco Galicia
, a leading Argentine financial institution, along with broader Argentine equities, posted strong gains in 2024 amid optimism about political change and early signs of macro stabilization. However, in 2025, the stock corrected as market enthusiasm moderated amid rising concerns about inflation, policy execution, and renewed currency volatility.TOP PERFORMANCE CONTRIBUTORS
SK Hynix
, a leading memory chipmaker, delivered exceptional returns on the back of its early leadership in high-bandwidth memory critical for AI servers. Strong demand and pricing power supported continued earnings momentum. Xiaomi Corp
, a global consumer electronics and smartphone manufacturer, also contributed meaningfully. The company reported record profit growth, fueled by strong smartphone sales in China, increased advertising revenue, and the successful launch of its electric vehicle, which reinforced its brand and ecosystem strategy.MercadoLibre, Inc. (“MELI”)
is a leading e-commerce platform in Latin America with a best-in-class ecosystem of services such as logistics and payments. MELI continued to benefit from its dominant market position, strong execution, and accelerating growth across both commerce and financial services platforms. The company delivered robust earnings, with strong gross merchandise value growth, improving take-rates, and a rapidly expanding credit portfolio, particularly in credit cards, driving upside surprises.Sea Limited
is an Indonesian digital platform that provides e-commerce, gaming, and financial services. Sea Limited was a strong contributor to relative performance, supported by a sharp rebound in profitability across its core businesses. Shopee Ptd. Ltd.
, Sea Limited’s e-commerce platform, saw strong user engagement and monetization improvements, while its financial technology business benefited from rising digital payments adoption and improved cost discipline, leading to upward revisions in guidance.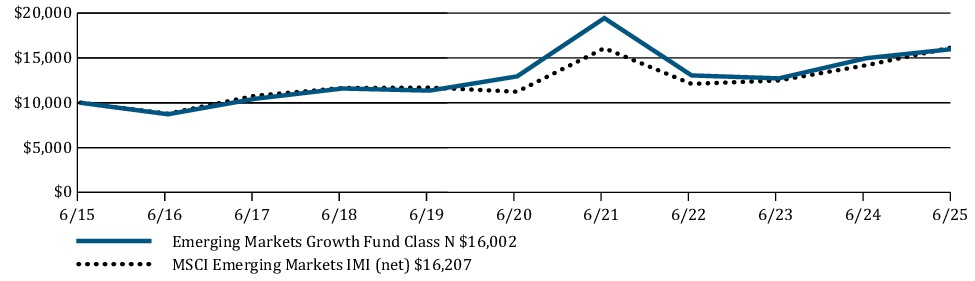
Average Annual Total Returns | 6 Months | 1 Year | 5 Years | 10 Years |
Emerging Markets Growth Fund Class N | 9.02 % | 6.89 % | 4.33 % | 4.81 % |
MSCI Emerging Markets IMI (net) | 14.62 % | 14.28 % | 7.61 % | 4.95 % |
www.williamblairfunds.com/funds/total-returns
Key Fund Statistics
Fund net assets (in $000s) | $ 890,141 |
Number of portfolio holdings | 126 |
Net advisory fees paid (in $000s) | $ 3,469 |
Portfolio turnover rate (six months) | 40 % |
Graphical Representation of Holdings
The tables below show the investment makeup of the Fund, representing percentage of the total net assets of the Fund.
Top Ten Holdings
| Taiwan Semiconductor Manufacturing Co. Ltd. | 13.3 % |
| Tencent Holdings Ltd. | 6.0 % |
| SK Hynix, Inc. | 4.2 % |
| MercadoLibre, Inc. | 3.3 % |
| Alibaba Group Holding Ltd. | 3.1 % |
| Xiaomi Corporation | 2.7 % |
| Sea Ltd. | 2.5 % |
| ICICI Bank Ltd. | 2.2 % |
| MediaTek, Inc. | 2.1 % |
| HDFC Bank Ltd. | 1.9 % |
Sector Allocation

Geographic Diversification

Top Ten Holdings
| Taiwan Semiconductor Manufacturing Co. Ltd. | 13.3 % |
| Tencent Holdings Ltd. | 6.0 % |
| SK Hynix, Inc. | 4.2 % |
| MercadoLibre, Inc. | 3.3 % |
| Alibaba Group Holding Ltd. | 3.1 % |
| Xiaomi Corporation | 2.7 % |
| Sea Ltd. | 2.5 % |
| ICICI Bank Ltd. | 2.2 % |
| MediaTek, Inc. | 2.1 % |
| HDFC Bank Ltd. | 1.9 % |
https://www.williamblairfunds.com/literature/forms
1-800-742-7272
.
What were the Fund costs for the last six months?
(Based on a hypothetical $10,000 investment)
Fund | Cost of $10,000 Investment | Cost of $10,000 Investment as a percentage |
| Emerging Markets Growth Fund Class R6 | $ 49 | 0.94 % |
Management’s Discussion of Fund Performance
SUMMARY OF RESULTS
The Fund returned 9.17% (net of fees) for the 6 months ended June 30, 2025. The Fund underperformed its benchmark, the MSCI Emerging Markets IMI (net), which returned 14.62%. The Fund's benchmark is also a broad measure of market performance.
Underperformance versus the index year-to-date was primarily driven by weak performance in the first quarter amid strong style headwinds and sharp country rotation. From a sector perspective, the underperformance was driven by negative stock selection within Consumer Discretionary and Financials.
TOP PERFORMANCE DETRACTORS
Alibaba
is e-commerce in China. Alibaba detracted the most at the beginning of the year due to the portfolio underweighting as the share price rallied. The strong outperformance was fueled by renewed investor optimism about its artificial intelligence (“AI”) initiatives and perceived government support for private enterprises. Furthermore, the overweight position in the second quarter also detracted as the stock corrected amid market rotation, renewed geopolitical concerns, and management’s lowered revenue and profit guidance primarily due to its continued investment in user growth and strategic initiatives.Trip.com
is China’s leading online travel agency, with a dominant market share. Trip.com offers a comprehensive range of services including transportation ticketing, hotel bookings, packaged tours, and destination resort tickets. Trip.com’s stock weakened in the first quarter of the year as the company announced increased marketing investments overseas to gain market share, which we expect to weigh on profit growth in the near term.Bank Central Asia
, Indonesia’s largest private bank, declined amid a deteriorated macroeconomic backdrop in Indonesia, rupiah weakness, and investor concerns about the new administration’s policy direction.Banco Galicia
, a leading Argentine financial institution, along with broader Argentine equities, posted strong gains in 2024 amid optimism about political change and early signs of macro stabilization. However, in 2025, the stock corrected as market enthusiasm moderated amid rising concerns about inflation, policy execution, and renewed currency volatility.TOP PERFORMANCE CONTRIBUTORS
SK Hynix
, a leading memory chipmaker, delivered exceptional returns on the back of its early leadership in high-bandwidth memory critical for AI servers. Strong demand and pricing power supported continued earnings momentum. Xiaomi Corp
, a global consumer electronics and smartphone manufacturer, also contributed meaningfully. The company reported record profit growth, fueled by strong smartphone sales in China, increased advertising revenue, and the successful launch of its electric vehicle, which reinforced its brand and ecosystem strategy.MercadoLibre, Inc. (“MELI”)
is a leading e-commerce platform in Latin America with a best-in-class ecosystem of services such as logistics and payments. MELI continued to benefit from its dominant market position, strong execution, and accelerating growth across both commerce and financial services platforms. The company delivered robust earnings, with strong gross merchandise value growth, improving take-rates, and a rapidly expanding credit portfolio, particularly in credit cards, driving upside surprises.Sea Limited
is an Indonesian digital platform that provides e-commerce, gaming, and financial services. Sea Limited was a strong contributor to relative performance, supported by a sharp rebound in profitability across its core businesses. Shopee Ptd. Ltd.
, Sea Limited’s e-commerce platform, saw strong user engagement and monetization improvements, while its financial technology business benefited from rising digital payments adoption and improved cost discipline, leading to upward revisions in guidance.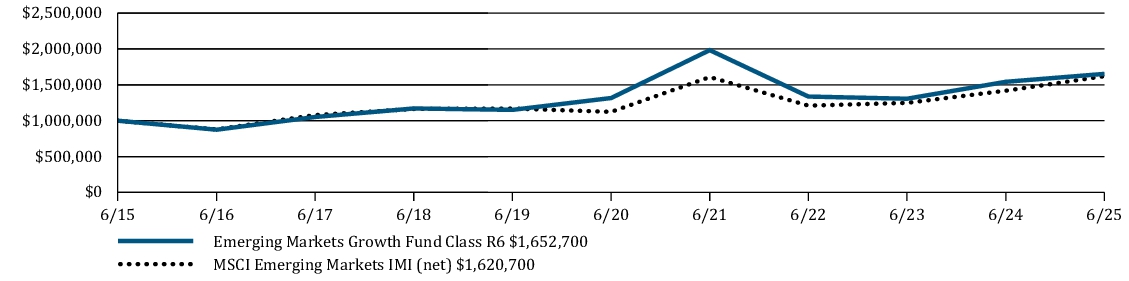
Average Annual Total Returns | 6 Months | 1 Year | 5 Years | 10 Years |
Emerging Markets Growth Fund Class R6 | 9.17 % | 7.17 % | 4.66 % | 5.15 % |
MSCI Emerging Markets IMI (net) | 14.62 % | 14.28 % | 7.61 % | 4.95 % |
www.williamblairfunds.com/funds/total-returns
Key Fund Statistics
Fund net assets (in $000s) | $ 890,141 |
Number of portfolio holdings | 126 |
Net advisory fees paid (in $000s) | $ 3,469 |
Portfolio turnover rate (six months) | 40 % |
Graphical Representation of Holdings
The tables below show the investment makeup of the Fund, representing percentage of the total net assets of the Fund.
Top Ten Holdings
| Taiwan Semiconductor Manufacturing Co. Ltd. | 13.3 % |
| Tencent Holdings Ltd. | 6.0 % |
| SK Hynix, Inc. | 4.2 % |
| MercadoLibre, Inc. | 3.3 % |
| Alibaba Group Holding Ltd. | 3.1 % |
| Xiaomi Corporation | 2.7 % |
| Sea Ltd. | 2.5 % |
| ICICI Bank Ltd. | 2.2 % |
| MediaTek, Inc. | 2.1 % |
| HDFC Bank Ltd. | 1.9 % |
Sector Allocation
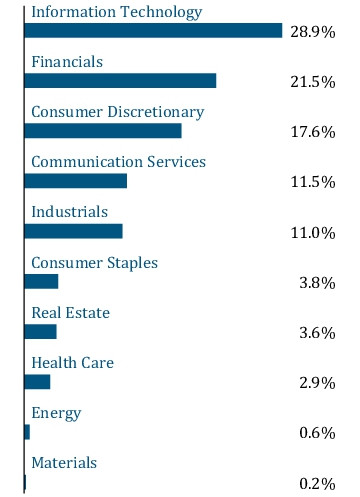
Geographic Diversification
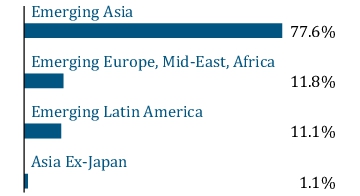
Top Ten Holdings
| Taiwan Semiconductor Manufacturing Co. Ltd. | 13.3 % |
| Tencent Holdings Ltd. | 6.0 % |
| SK Hynix, Inc. | 4.2 % |
| MercadoLibre, Inc. | 3.3 % |
| Alibaba Group Holding Ltd. | 3.1 % |
| Xiaomi Corporation | 2.7 % |
| Sea Ltd. | 2.5 % |
| ICICI Bank Ltd. | 2.2 % |
| MediaTek, Inc. | 2.1 % |
| HDFC Bank Ltd. | 1.9 % |
https://www.williamblairfunds.com/literature/forms
1-800-742-7272
.
What were the Fund costs for the last six months?
(Based on a hypothetical $10,000 investment)
Fund | Cost of $10,000 Investment | Cost of $10,000 Investment as a percentage |
| Emerging Markets ex China Growth Fund Class I | $ 52 | 0.99 % |
Management’s Discussion of Fund Performance
SUMMARY OF RESULTS
The Fund returned 8.63% (net of fees) for the 6 months ended June 30, 2025. The Fund underperformed its benchmark, the MSCI Emerging Markets ex-China IMI (net), which returned 13.62%. The Fund's benchmark is also a broad measure of market performance.
Underperformance versus the index year-to-date was primarily driven by weak performance in the first quarter amid strong style headwinds and sharp country rotation. From a sector perspective, the underperformance was driven by negative stock selection within Financials, Industrials, and Energy.
TOP PERFORMANCE DETRACTORS
Grupo Financiero Galicia SA
and Banco Bbva Argentina SA
, Argentine banks, were significant detractors to relative returns due to investor caution around Argentina’s financial sector and broad macroeconomic and foreign exchange headwinds amid a weakening peso.Apar Industries Ltd.
is a leading Indian manufacturer of conductors, cables, and specialty oils. The stock underperformed on the back of increased margin pressure due to a less favorable product mix and pricing pressure in the conductor segment, and export-related challenges, as Chinese competition intensified in key export markets.Titagarh Rail Systems Limited (“Titagarh”)
, a rail infrastructure and rolling stock manufacturer, corrected amid market rotation and the company’s disappointing results. Titagarh’s fourth quarter 2024 net profit declined 18% year-over-year due to lower wagon sales to Indian Railways amid a supply chain bottleneck, which constrained revenue realization.YPF S.A.
is Argentina’s largest integrated energy company, with a growing focus on shale development in the Vaca Muerta formation. Concerns around sustained negative free cash flow and rising leverage, alongside sensitivity to oil prices, weighed on investor sentiment. In addition, a U.S. court ruling ordering the transfer of Argentina’s 51% stake in YPF S.A. coupled with investor concerns over the government’s ability to support energy sector reforms and fund growth pressured the share price.TOP PERFORMANCE CONTRIBUTORS
Sea Limited
is an Indonesian digital platform that provides e-commerce, gaming, and financial services. Sea Limited was a strong contributor to relative performance, supported by a sharp rebound in profitability across its core businesses. Shopee Pte. Ltd
., Sea Limited’s e-commerce platform, benefited from strong user engagement and monetization improvements, while Sea Limited’s financial technology business benefited from rising digital payments adoption and improved cost discipline, leading to upward revisions in guidance.SK Hynix
, a leading memory chipmaker, delivered exceptional returns on the back of its early leadership in high-bandwidth memory critical for artificial intelligence servers. Strong demand and pricing power supported continued earnings momentum. Hanwha Aerospace Co. Ltd.
is the leading South Korean defense and aerospace manufacturer. The company benefited from rising demand for aerospace and defense systems, particularly amid heightened geopolitical tensions and increased global defense spending.MercadoLibre, Inc. (“MELI”)
is a leadi
ng e-commerce platform in Latin America with a best-in-class ecosystem of services such as logistics and payments. MELI continued to benefit from its dominant market position, strong execution, and accelerating growth across both commerce and financial services platforms. The company delivered robust earnings, with strong gross merchandise value growth, improving take-rates, and a rapidly expanding credit portfolio, particularly in credit cards, driving upside surprises.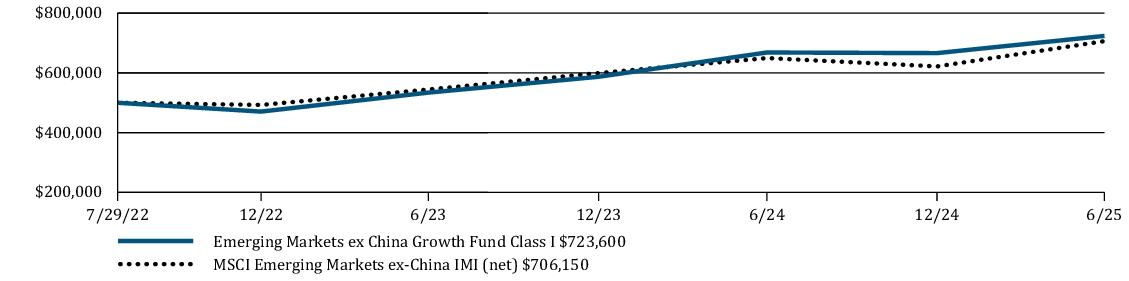
Average Annual Total Returns | 6 Months | 1 Year | Since Inception |
Emerging Markets ex China Growth Fund Class I | 8.63 % | 8.30 % | 13.47 % |
MSCI Emerging Markets ex-China IMI (net) | 13.62 % | 8.71 % | 12.53 % |
www.williamblairfunds.com/funds/total-returns
Key Fund Sta
ti
sticsFund net assets (in $000s) | $ 37,233 |
Number of portfolio holdings | 111 |
Net advisory fees paid (in $000s) | $ 0 |
Portfolio turnover rate (six months) | 42 % |
Graphical Representation of Holdings
The tables below sh
o
w the investment makeup of the Fund, representing percentage of the total net assets of the Fund.Top Ten Holdings
| Taiwan Semiconductor Manufacturing Co. Ltd. | 16.1 % |
| SK Hynix, Inc. | 4.4 % |
| MercadoLibre, Inc. | 2.7 % |
| Sea Ltd. | 2.6 % |
| MediaTek, Inc. | 2.5 % |
| HDFC Bank Ltd. | 2.2 % |
| ICICI Bank Ltd. | 2.2 % |
| Bharti Airtel Ltd. | 1.8 % |
| Bajaj Finance Limited | 1.6 % |
| Emaar Properties PJSC | 1.4 % |
Sector Allocation

Geographic Diversification

Top Ten Holdings
| Taiwan Semiconductor Manufacturing Co. Ltd. | 16.1 % |
| SK Hynix, Inc. | 4.4 % |
| MercadoLibre, Inc. | 2.7 % |
| Sea Ltd. | 2.6 % |
| MediaTek, Inc. | 2.5 % |
| HDFC Bank Ltd. | 2.2 % |
| ICICI Bank Ltd. | 2.2 % |
| Bharti Airtel Ltd. | 1.8 % |
| Bajaj Finance Limited | 1.6 % |
| Emaar Properties PJSC | 1.4 % |
https://www.williamblairfunds.com/literature/forms
1-800-742-7272
.
What were the Fund costs for the last six months?
(Based on a hypothetical $10,000 investment)
Fund | Cost of $10,000 Investment | Cost of $10,000 Investment as a percentage |
| Emerging Markets ex China Growth Fund Class R6 | $ 49 | 0.94 % |
Management’s Discu
ssio
n of Fund PerformanceSUMMARY OF RESULTS
The Fund returned 8.69% (net of fees) for the 6 months ended June 30, 2025. The Fund underperformed its benchmark, the MSCI Emerging Markets ex-China IMI (net), which returned 13.62%. The Fund's benchmark is also a broad measure of market performance.
Underperformance versus the index year-to-date was primarily driven by weak performance in the first quarter amid strong style headwinds and sharp country rotation. From a sector perspective, the underperformance was driven by negative stock selection within Financials, Industrials, and Energy.
TOP PERFORMANCE DETRACTORS
Grupo Financiero Galicia SA
and Banco Bbva Argentina SA
, Argentine banks, were significant detractors to relative returns due to investor caution around Argentina’s financial sector and broad macroeconomic and foreign exchange headwinds amid a weakening peso.Apar Industries Ltd.
is a leading Indian manufacturer of conductors, cables, and specialty oils. The stock underperformed on the back of increased margin pressure due to a less favorable product mix and pricing pressure in the conductor segment, and export-related challenges, as Chinese competition intensified in key export markets.Titagarh Rail Systems Limited (“Titagarh”)
, a rail infrastructure and rolling stock manufacturer, corrected amid market rotation and the company’s disappointing results. Titagarh’s fourth quarter 2024 net profit declined 18% year-over-year due to lower wagon sales to Indian Railways amid a supply chain bottleneck, which constrained revenue realization.YPF S.A.
is Argentina’s largest integrated energy company, with a growing focus on shale development in the Vaca Muerta formation. Concerns around sustained negative free cash flow and rising leverage, alongside sensitivity to oil prices, weighed on investor sentiment. In addition, a U.S. court ruling ordering the transfer of Argentina’s 51% stake in YPF S.A. coupled with investor concerns over the government’s ability to support energy sector reforms and fund growth pressured the share price.TOP PERFORMANCE CONTRIBUTORS
Sea Limited
is an Indonesian digital platform that provides e-commerce, gaming, and financial services. Sea Limited was a strong contributor to relative performance, supported by a sharp rebound in profitability across its core businesses. Shopee Pte. Ltd
., Sea Limited’s e-commerce platform, benefited from strong user engagement and monetization improvements, while Sea Limited’s financial technology business benefited from rising digital payments adoption and improved cost discipline, leading to upward revisions in guidance.SK Hynix
, a leading memory chipmaker, delivered exceptional returns on the back of its early leadership in high-bandwidth memory critical for artificial intelligence servers. Strong demand and pricing power supported continued earnings momentum. Hanwha Aerospace Co. Ltd.
is the leading South Korean defense and aerospace manufacturer. The company benefited from rising demand for aerospace and defense systems, particularly amid heightened geopolitical tensions and increased global defense spending.MercadoLibre, Inc. (“MELI”)
is a leading e-commerce platform in Latin America with a best-in-class ecosystem of services such as logistics and payments. MELI continued to benefit from its dominant market position, strong execution, and accelerating growth across both commerce and financial services platforms. The company delivered robust earnings, with strong gross merchandise value growth, improving take-rates, and a rapidly expanding credit portfolio, particularly in credit cards, driving upside surprises.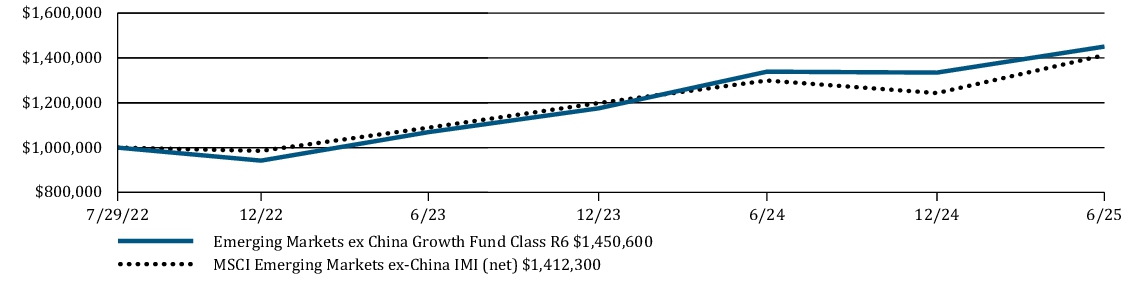
Average Annual Total Returns | 6 Months | 1 Year | Since Inception |
Emerging Markets ex China Growth Fund Class R6 | 8.69 % | 8.36 % | 13.56 % |
MSCI Emerging Markets ex-China IMI (net) | 13.62 % | 8.71 % | 12.53 % |
www.williamblairfunds.com/funds/total-returns
Key Fund Statistics
Fund net assets (in $000s) | $ 37,233 |
Number of portfolio holdings | 111 |
Net advisory fees paid (in $000s) | $ 0 |
Portfolio turnover rate (six months) | 42 % |
Graphical Representation of Holdings
The tables below show the investment makeup of the Fund, representing percentage of the total net assets of the Fund.
Top Ten Holdings
| Taiwan Semiconductor Manufacturing Co. Ltd. | 16.1 % |
| SK Hynix, Inc. | 4.4 % |
| MercadoLibre, Inc. | 2.7 % |
| Sea Ltd. | 2.6 % |
| MediaTek, Inc. | 2.5 % |
| HDFC Bank Ltd. | 2.2 % |
| ICICI Bank Ltd. | 2.2 % |
| Bharti Airtel Ltd. | 1.8 % |
| Bajaj Finance Limited | 1.6 % |
| Emaar Properties PJSC | 1.4 % |
Sector Allocation
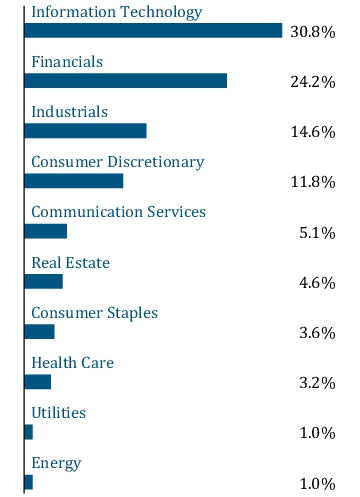
Geographic Diversification
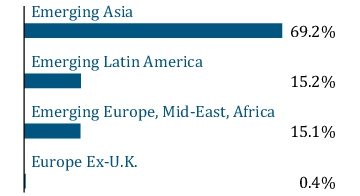
Top Ten Holdings
| Taiwan Semiconductor Manufacturing Co. Ltd. | 16.1 % |
| SK Hynix, Inc. | 4.4 % |
| MercadoLibre, Inc. | 2.7 % |
| Sea Ltd. | 2.6 % |
| MediaTek, Inc. | 2.5 % |
| HDFC Bank Ltd. | 2.2 % |
| ICICI Bank Ltd. | 2.2 % |
| Bharti Airtel Ltd. | 1.8 % |
| Bajaj Finance Limited | 1.6 % |
| Emaar Properties PJSC | 1.4 % |
https://www.williamblairfunds.com/literature/forms
1-800-742-7272
.
What were the Fund costs for the last six months?
(Based on a hypothetical $10,000 investment)
Fund |
Cost of $10,000 Investment |
Cost of $10,000 Investment as a percentage |
| Emerging Markets Small Cap Growth Fund Class I | $ 59 |
1.15 % |
Management’s Discussion of Fund Performance
SUMMARY OF RESULTS
The Fund returned 4.35% (net of fees) for the 6 months ended June 30, 2025. The Fund underperformed its benchmark, the MSCI Emerging Markets Small Cap Index (net), which returned 10.74% and underperformed the MSCI Emerging Markets IMI (net), a broad measure of market performance, which returned 14.62%.
Underperformance versus the index year-to-date was primarily driven by weak performance in the first quarter amid strong style
headwinds
and sharp country rotation. From a sector perspective, the underperformance was primarily driven by negative stock selection
within
Industrials and Financials.TOP PERFORMANCE DETRACTORS
HD Hyundai Marine Solution
, a Korean ship engine services provider, declined following softer-than-expected earnings and a share placement, despite long-term tailwinds from the shipbuilding cycle and the shift to dual-fuel engines.Transformers & Rectifiers India
, a power equipment manufacturer, fell on weaker-than-expected order inflows and margin compression, reflecting a broader slowdown in infrastructure-related capital expenditure as well as a broader rotation out of electrical equipment names.Apar Industries
, a leading Indian manufacturer of conductors, cables, and specialty oils, also corrected sharply. Despite strong fundamentals and a robust order book, the stock was impacted by profit-taking and concerns over near-term visibility in the power transmission segment.Central Depository Services India Ltd
, a key infrastructure provider for India’s capital markets, underperformed due to slowing transaction volumes and elevated technology costs, which pressured margins.Grupo Supervielle
, an Argentine bank, corrected sharply after a strong 2024, as macro volatility, inflation concerns, and renewed currency pressures resurfaced in 2025.Kaynes Technology
, an Indian electronics manufacturing services firm, also corrected after a strong 2024 rally. The stock was pressured by valuation concerns and a slight miss in operating performance, as investor sentiment turned more cautious toward high-growth, high-multiple names.PG Electroplast
, a contract manufacturer of consumer electronics and appliances, also detracted as earnings momentum slowed and margin pressures emerged amid rising input costs.TOP PERFORMANCE CONTRIBUTORS
Cencosud SA
, a leading Chilean operator of supermarkets and multi-format retail stores, rallied on improved investor sentiment and
expectations of a consumption recovery amid rising real wages and interest rate cuts in Chile. Gambol Pet Group
and Yantai China Pet Foods Co
, Chinese pet food companies, delivered strong returns supported by robust sales momentum and growing demand for high-quality pet nutrition.Within Taiwan,
ASPEED Technology
contributed the most amid strong performance in the second quarter, as the company benefited from accelerating demand for artificial intelligence (“AI”) server infrastructure and continued strength in enterprise cloud spending.Elite Materials
added to relative results as the stock outperformed on the back of strong demand from AI server and automotive electronics customers. The company delivered robust first-quarter earnings growth, boosted by favorable product mix, margin expansion, and operational leverage.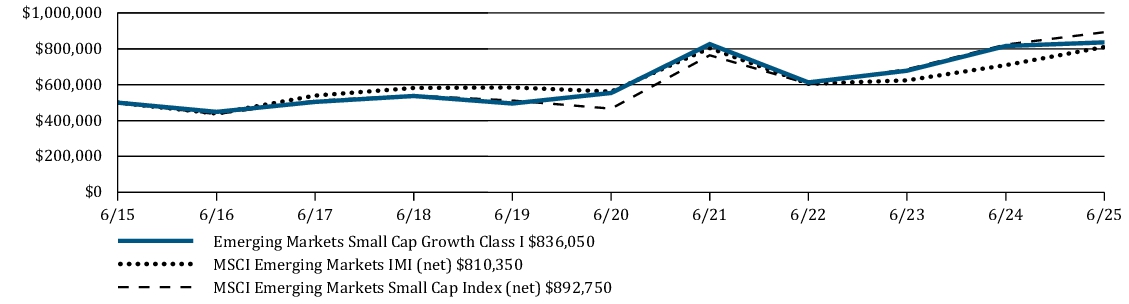
Average Annual Total Returns |
6 Months |
1 Year |
5 Years |
10 Years |
Emerging Markets Small Cap Growth Fund Class I |
4.35 % |
2.50 % |
8.58 % |
5.28 % |
MSCI Emerging Markets IMI (net) |
14.62 % |
14.28 % |
7.61 % |
4.95 % |
MSCI Emerging Markets Small Cap Index (net) |
10.74 % |
8.40 % |
13.86 % |
5.97 % |
www.williamblairfunds.com/funds/total-returns
Key Fund
Statistics
Fund net assets (in $000s) |
$ 369,576 |
Number of portfolio holdings |
141 |
Net advisory fees paid (in $000s) |
$ 1,434 |
Portfolio turnover rate (six months) |
135 % |
Graphical Representation of Holdings
The tables below show the investment makeup of the Fund, representing percentage of the total net assets of the
Fund
.Top Ten Holdings
| ASPEED Technology, Inc. | 2.3 % |
| Hyosung Heavy Industries Corporation | 1.9 % |
| Nuvama Wealth Management Ltd. | 1.8 % |
| Grupo Aeroportuario del Centro Norte SAB de CV | 1.8 % |
| Gentera SAB de CV | 1.7 % |
| Samyangfoods Co., Ltd | 1.7 % |
| JB Financial Group Co. Ltd. | 1.6 % |
| Direcional Engenharia SA | 1.6 % |
| KFin Technologies Ltd. | 1.6 % |
| Chroma ATE, Inc. | 1.5 % |
Sector Allocation
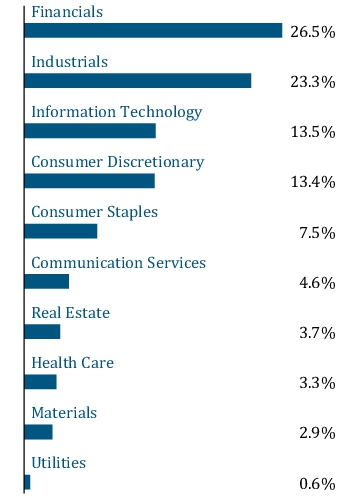
Geographic Diversification

Top Ten Holdings
| ASPEED Technology, Inc. | 2.3 % |
| Hyosung Heavy Industries Corporation | 1.9 % |
| Nuvama Wealth Management Ltd. | 1.8 % |
| Grupo Aeroportuario del Centro Norte SAB de CV | 1.8 % |
| Gentera SAB de CV | 1.7 % |
| Samyangfoods Co., Ltd | 1.7 % |
| JB Financial Group Co. Ltd. | 1.6 % |
| Direcional Engenharia SA | 1.6 % |
| KFin Technologies Ltd. | 1.6 % |
| Chroma ATE, Inc. | 1.5 % |
https://www.williamblairfunds.com/literature/forms
1-800-742-7272
.
What were the Fund costs for the last six months?
(Based on a hypothetical $10,000 investment)
Fund | Cost of $10,000 Investment | Cost of $10,000 Investment as a percentage |
| Emerging Markets Small Cap Growth Fund Class N | $ 71 | 1.40 % |
Management’s Discussion of Fund Performance
SUMMARY OF RESULTS
The Fund returned 4.24% (net of fees) for the 6 months ended June 30, 2025. The Fund underperformed its benchmark, the MSCI Emerging Markets Small Cap Index (net), which returned 10.74% and underperformed the MSCI Emerging Markets IMI (net), a broad measure of market performance, which returned 14.62%.
Underperformance versus the index year-to-date was primarily driven by weak performance in the first quarter amid strong style
headwinds
and sharp country rotation. From a sector perspective, the underperformance was primarily driven by negative stock selection
within
Industrials and Financials.TOP PERFORMANCE DETRACTORS
HD Hyundai Marine Solution
, a Korean ship engine services provider, declined following softer-than-expected earnings and a share placement, despite long-term tailwinds from the shipbuilding cycle and the shift to dual-fuel engines.Transformers & Rectifiers India
, a power equipment manufacturer, fell on weaker-than-expected order inflows and margin compression, reflecting a broader slowdown in infrastructure-related capital expenditure as well as a broader rotation out of electrical equipment names.Apar Industries
, a leading Indian manufacturer of conductors, cables, and specialty oils, also corrected sharply. Despite strong fundamentals and a robust order book, the stock was impacted by profit-taking and concerns over near-term visibility in the power transmission segment.Central Depository Services India Ltd
, a key infrastructure provider for India’s capital markets, underperformed due to slowing transaction volumes and elevated technology costs, which pressured margins.Grupo Supervielle
, an Argentine bank, corrected sharply after a strong 2024, as macro volatility, inflation concerns, and renewed currency pressures resurfaced in 2025.Kaynes Technology
, an Indian electronics manufacturing services firm, also corrected after a strong 2024 rally. The stock was pressured by valuation concerns and a slight miss in operating performance, as investor sentiment turned more cautious toward high-growth, high-multiple names.PG Electroplast
, a contract manufacturer of consumer electronics and appliances, also detracted as earnings momentum slowed and margin
pressures emerged amid rising input costs.TOP PERFORMANCE CONTRIBUTORS
Cencosud SA
, a leading Chilean operator of supermarkets and multi-format retail stores, rallied on improved investor sentiment
and expectations of a consumption recovery amid rising real wages and interest rate cuts in Chile. Gambol Pet Group
and Yantai China Pet Foods Co
, Chinese pet food companies, delivered strong returns supported by robust sales momentum and growing demand for high-quality pet nutrition.Within Taiwan,
ASPEED Technology
contributed the most amid strong performance in the second quarter, as the company benefited from accelerating demand for artificial intelligence (“AI”) server infrastructure and continued strength in enterprise cloud spending.Elite Materials
added to relative results as the stock outperformed on the back of strong demand from AI server and automotive electronics customers. The company delivered robust first-quarter earnings growth, boosted by favorable product mix, margin expansion, and operational leverage.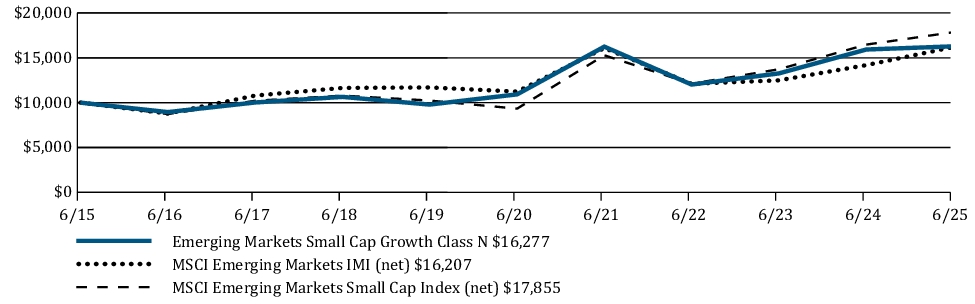
Average Annual Total Returns | 6 Months | 1 Year | 5 Years | 10 Years |
Emerging Markets Small Cap Growth Fund Class N | 4.24 % | 2.22 % | 8.30 % | 4.99 % |
MSCI Emerging Markets IMI (net) | 14.62 % | 14.28 % | 7.61 % | 4.95 % |
MSCI Emerging Markets Small Cap Index (net) | 10.74 % | 8.40 % | 13.86 % | 5.97 % |
shares
.
www.williamblairfunds.com/funds/total-returns
Key Fund Statistics
Fund net assets (in $000s) | $ 369,576 |
Number of portfolio holdings | 141 |
Net advisory fees paid (in $000s) | $ 1,434 |
Portfolio turnover rate (six months) | 135 % |
Graphical Representation of Holdings
The tables below show the investment makeup of the Fund, representing percentage of the total net assets of the
Fund
.Top Ten Holdings
| ASPEED Technology, Inc. | 2.3 % |
| Hyosung Heavy Industries Corporation | 1.9 % |
| Nuvama Wealth Management Ltd. | 1.8 % |
| Grupo Aeroportuario del Centro Norte SAB de CV | 1.8 % |
| Gentera SAB de CV | 1.7 % |
| Samyangfoods Co., Ltd | 1.7 % |
| JB Financial Group Co. Ltd. | 1.6 % |
| Direcional Engenharia SA | 1.6 % |
| KFin Technologies Ltd. | 1.6 % |
| Chroma ATE, Inc. | 1.5 % |
Sector Allocation

Geographic Diversification

Top Ten Holdings
| ASPEED Technology, Inc. | 2.3 % |
| Hyosung Heavy Industries Corporation | 1.9 % |
| Nuvama Wealth Management Ltd. | 1.8 % |
| Grupo Aeroportuario del Centro Norte SAB de CV | 1.8 % |
| Gentera SAB de CV | 1.7 % |
| Samyangfoods Co., Ltd | 1.7 % |
| JB Financial Group Co. Ltd. | 1.6 % |
| Direcional Engenharia SA | 1.6 % |
| KFin Technologies Ltd. | 1.6 % |
| Chroma ATE, Inc. | 1.5 % |
https://www.williamblairfunds.com/literature/forms
1-800-742-7272
.
What were the Fund costs for the last six months?
(Based on a hypothetical $10,000 investment)
Fund | Cost of $10,000 Investment | Cost of $10,000 Investment as a percentage |
| Emerging Markets Small Cap Growth Fund Class R6 | $ 56 | 1.10 % |
Management’s Discussion of Fund Performance
SUMMARY OF RESULTS
The Fund returned 4.38% (net of fees)
for the
6 months ended June 30, 2025. The Fund underperformed its benchmark, the MSCI Emerging Markets Small Cap Index (net), which returned 10.74% and underperformed the MSCI Emerging Markets IMI (net), a broad measure of market performance, which returned 14.62%.Underperformance versus the index year-to-date was primarily driven by weak performance in the first quarter amid strong style
headwinds
and sharp country rotation. From a sector perspective, the underperformance was primarily driven by negative stock selection within Industrials and Financials.TOP PERFORMANCE DETRACTORS
HD Hyundai Marine Solution
, a Korean ship engine services provider, declined following softer-than-expected earnings and a share placement, despite long-term tailwinds from the shipbuilding cycle and the shift to dual-fuel engines.Transformers & Rectifiers India
, a power equipment manufacturer, fell on weaker-than-expected order inflows and margin compression, reflecting a broader slowdown in infrastructure-related capital expenditure as well as a broader rotation out of electrical equipment names.Apar Industries
, a leading Indian manufacturer of conductors, cables, and specialty oils, also corrected sharply. Despite strong fundamentals and a robust order book, the stock was impacted by profit-taking and concerns over near-term visibility in the power transmission segment.Central Depository Services India Ltd
, a key infrastructure provider for India’s capital markets, underperformed due to slowing transaction volumes and elevated technology costs, which pressured margins.Grupo Supervielle
, an Argentine bank, corrected sharply after a strong 2024, as macro volatility, inflation concerns, and renewed currency pressures resurfaced in 2025.Kaynes Technology
, an Indian electronics
manufacturing services firm, also corrected after a strong 2024 rally. The stock was pressured by valuation concerns and a slight miss in operating performance, as investor sentiment turned more cautious toward high-growth, high-multiple names.PG Electroplast
, a contract manufacturer of consumer electronics and appliances, also detracted as earnings momentum slowed and margin pressures emerged amid rising input costs.TOP PERFORMANCE CONTRIBUTORS
Cencosud SA
, a leading Chilean operator of supermarkets and multi-format retail stores, rallied on improved investor sentiment and expectations of a consumption recovery amid rising real wages and interest rate cuts in Chile. Gambol Pet Group
and Yantai China Pet Foods Co
, Chinese pet food companies, delivered strong returns supported by robust sales momentum and growing demand for high-quality pet nutrition.Within Taiwan,
ASPEED Technology
contributed the most amid strong performance in the second quarter, as the company benefited from accelerating demand for artificial intelligence (“AI”) server infrastructure and continued strength in enterprise cloud spending.Elite Materials
added to relative results as the stock outperformed on the back of strong demand from AI server and automotive electronics customers. The company delivered robust first-quarter earnings growth, boosted by favorable product mix, margin expansion, and operational leverage.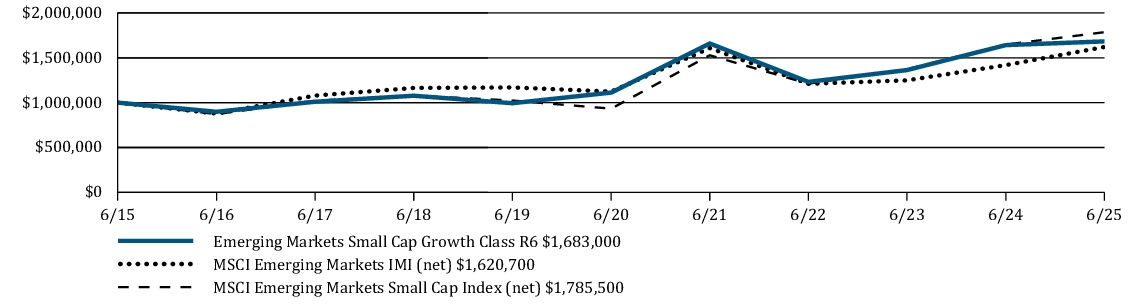
Average Annual Total Returns | 6 Months | 1 Year | 5 Years | 10 Years |
Emerging Markets Small Cap Growth Fund Class R6 | 4.38 % | 2.54 % | 8.64 % | 5.34 % |
MSCI Emerging Markets IMI (net) | 14.62 % | 14.28 % | 7.61 % | 4.95 % |
MSCI Emerging Markets Small Cap Index (net) | 10.74 % | 8.40 % | 13.86 % | 5.97 % |
shares
.
www.williamblairfunds.com/funds/total-returns
Key Fund Statistics
Fund net assets (in $000s) | $ 369,576 |
Number of portfolio holdings | 141 |
Net advisory fees paid (in $000s) | $ 1,434 |
Portfolio turnover rate (six months) | 135 % |
Graphical Representation of Holdings
The tables below show the investment makeup of the Fund, representing percentage of the total net assets of the
Fund
.Top Ten Holdings
| ASPEED Technology, Inc. | 2.3 % |
| Hyosung Heavy Industries Corporation | 1.9 % |
| Nuvama Wealth Management Ltd. | 1.8 % |
| Grupo Aeroportuario del Centro Norte SAB de CV | 1.8 % |
| Gentera SAB de CV | 1.7 % |
| Samyangfoods Co., Ltd | 1.7 % |
| JB Financial Group Co. Ltd. | 1.6 % |
| Direcional Engenharia SA | 1.6 % |
| KFin Technologies Ltd. | 1.6 % |
| Chroma ATE, Inc. | 1.5 % |
Sector Allocation

Geographic Diversification
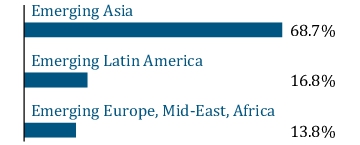
Top Ten Holdings
| ASPEED Technology, Inc. | 2.3 % |
| Hyosung Heavy Industries Corporation | 1.9 % |
| Nuvama Wealth Management Ltd. | 1.8 % |
| Grupo Aeroportuario del Centro Norte SAB de CV | 1.8 % |
| Gentera SAB de CV | 1.7 % |
| Samyangfoods Co., Ltd | 1.7 % |
| JB Financial Group Co. Ltd. | 1.6 % |
| Direcional Engenharia SA | 1.6 % |
| KFin Technologies Ltd. | 1.6 % |
| Chroma ATE, Inc. | 1.5 % |
https://www.williamblairfunds.com/literature/forms
1-800-742-7272
.
What were the Fund costs for the last six months?
(Based on a hypothetical $10,000 investment)
Fund |
Cost of $10,000 Investment |
Cost of $10,000 Investment as a percentage |
| China Growth Fund Class I | $ 52 |
0.99 % |
Management’s Discussion of Fund Performance
SUMMARY OF RESULTS
The Fund returned 11.32% (net of fees) for the 6 months ended June 30, 2025. The Fund underperformed its benchmark, the MSCI China All Shares Index (net), which returned 11.77%. The Fund's benchmark is also a broad measure of market performance.
Underperformance versus the index was driven by a combination of allocation and stock selection effects. An overweight allocation to Consumer Sectors and Industrials coupled with negative stock selection within Industrials and Financials were the primary underperformance.
drivers
ofTOP PERFORMANCE DETRACTORS
Shenzhen Envicool
is a leading precision temperature cooling and energy-saving equipment supplier in China. The stock declined during the period on weaker-than-expected full year 2024 results, with revenue up 30% year-over-year, missing consensus expectations by 3%. This was primarily due to delayed revenue recognition of certain room cooling projects in the fourth quarter of 2024. The company was also negatively affected by tariff impacts. In response, the company has established a small-scale U.S. production line as a contingency measure, although it currently lacks cost efficiency compared with its China-based operations. The company is also exploring Southeast Asia as a potential manufacturing base amid heightened geopolitical risks. East Money Information
is a leading company in the brokerage and wealth management market. Despite reporting in-line results, mixed mutual fund sales and distribution fee rate pressure weighed on earnings.TOP PERFORMANCE CONTRIBUTORS
Xiaomi
is a global leader in consumer electronics and technology. The company is executing well on its Human x Car x Home strategy with the electric vehicle success supporting Xiaomi's brand image and helping accelerate its high-end smartphone penetration and “AI Internet of Things” product growth momentum.Meitu
specializes in developing image and video editing software, with its flagship product the Meitu App. Meitu has transitioned to a sustainable business model centered on subscription services, complemented by its advertising businesses. Amid the rapid advancement of artificial intelligence (“AI”), the company has introduced a series of AI-generated content productivity tools since late 2022. The company is a leading provider of image and video editing software in China, commanding a 50% market share while actively expanding into select overseas markets.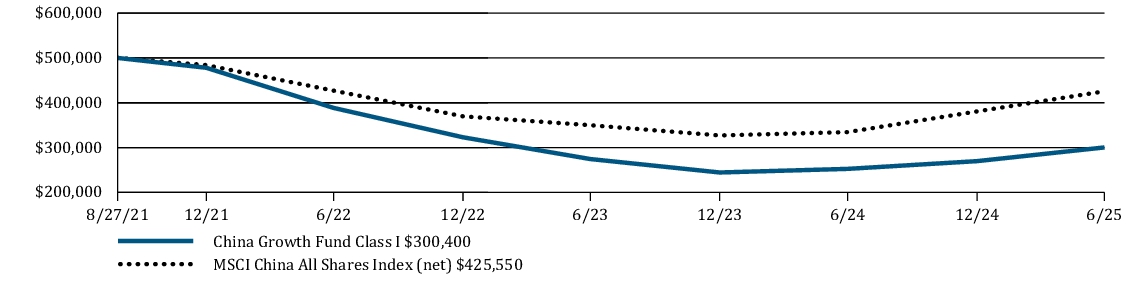
Average Annual Total Returns |
6 Months |
1 Year |
Since Inception |
China Growth Fund Class I |
11.32 % |
18.93 % |
-12.41 % |
MSCI China All Shares Index (net) |
11.77 % |
27.18 % |
-4.11 % |
shares
.
www.williamblairfunds.com/funds/total-returns
Key Fund Statistics
Fund net assets (in $000s) |
$ 1,951 |
Number of portfolio holdings |
42 |
Net advisory fees paid (in $000s) |
$ 0 |
Portfolio turnover rate (six months) |
33 % |
Graphical Representation of Holdings
The tables below show the investment makeup of the Fund, representing percentage of the total net assets of the
Fund
.Top Ten Holdings
| Tencent Holdings Ltd. | 13.1 % |
| Alibaba Group Holding Ltd. | 7.7 % |
| Xiaomi Corporation | 7.0 % |
| Pop Mart International Group Ltd. | 4.4 % |
| BYD Company Limited | 3.8 % |
| NetEase, Inc. | 3.5 % |
| Contemporary Amperex Technology Co. Ltd. | 3.3 % |
| China Merchants Bank Co. Ltd. | 3.2 % |
| Meituan | 3.0 % |
| Eastroc Beverage Group Co. Ltd. | 2.7 % |
Sector Allocation

Geographic Diversification
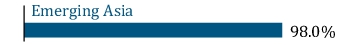
Top Ten Holdings
| Tencent Holdings Ltd. | 13.1 % |
| Alibaba Group Holding Ltd. | 7.7 % |
| Xiaomi Corporation | 7.0 % |
| Pop Mart International Group Ltd. | 4.4 % |
| BYD Company Limited | 3.8 % |
| NetEase, Inc. | 3.5 % |
| Contemporary Amperex Technology Co. Ltd. | 3.3 % |
| China Merchants Bank Co. Ltd. | 3.2 % |
| Meituan | 3.0 % |
| Eastroc Beverage Group Co. Ltd. | 2.7 % |
https://www.williamblairfunds.com/literature/forms
1-800-742-7272
.
What were the Fund costs for the last six months?
(Based on a hypothetical $10,000 investment)
Fund | Cost of $10,000 Investment | Cost of $10,000 Investment as a percentage |
| China Growth Fund Class R6 | $ 50 | 0.94 % |
Management’s Discussion of Fund Performance
SUMMARY OF RESULTS
The Fund returned 11.17% (net of fees) for the 6 months ended June 30, 2025. The Fund underperformed its benchmark, the MSCI
China
All Shares Index (net), which returned 11.77%. The Fund's benchmark is also a broad measure of market performance.Underperformance versus the index was driven by a combination of allocation and stock selection effects. An overweight allocation to Consumer Sectors and Industrials coupled with negative stock selection within Industrials and Financials were the primary drivers of underperformance.
TOP PERFORMANCE DETRACTORS
Shenzhen Envicool
is a leading precision temperature cooling and energy-saving equipment supplier in China. The stock declined during the period on weaker-than-expected full year 2024 results, with revenue up 30% year-over-year, missing consensus expectations by 3%. This was primarily due to delayed revenue recognition of certain room cooling projects in the fourth quarter of 2024. The company was also negatively affected by tariff impacts. In response, the company has established a small-scale U.S. production line as a contingency measure, although it currently lacks cost efficiency compared with its China-based operations. The company is also exploring Southeast Asia as a potential manufacturing base amid heightened geopolitical risks. East Money Information
is a leading company in the brokerage and wealth management market. Despite reporting in-line results, mixed mutual fund sales and distribution fee rate pressure weighed on earnings.TOP PERFORMANCE CONTRIBUTORS
Xiaomi
is a global leader in consumer electronics and technology. The company is executing well on its Human x Car x Home strategy with the electric vehicle success supporting Xiaomi's brand image and helping accelerate its high-end smartphone penetration and “AI Internet of Things” product growth momentum.Meitu
specializes in developing image and video editing software, with its flagship product the Meitu App. Meitu has transitioned to a sustainable business model centered on subscription services, complemented by its advertising businesses. Amid the rapid advancement of artificial intelligence (“AI”), the company has introduced a series of AI-generated content productivity tools since late 2022. The company is a leading provider of image and video editing software in China, commanding a 50% market share while actively expanding into select overseas markets.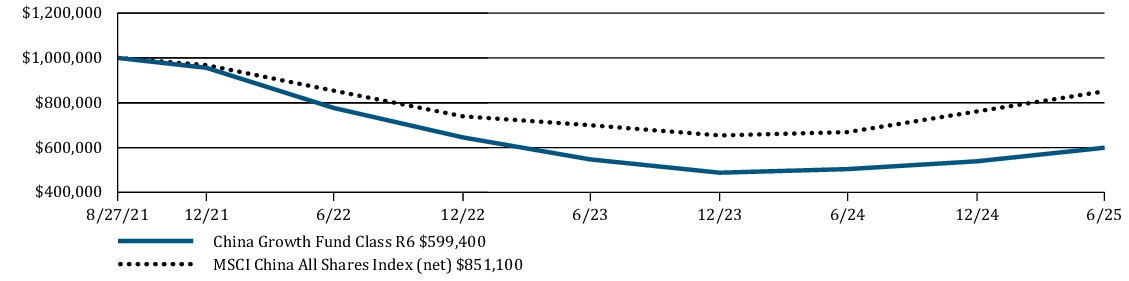
Average Annual Total Returns | 6 Months | 1 Year | Since Inception |
China Growth Fund Class R6 | 11.17 % | 18.89 % | -12.47 % |
MSCI China All Shares Index (net) | 11.77 % | 27.18 % | -4.11 % |
www.williamblairfunds.com/funds/total-returns
Key Fund
Statistics
Fund net assets (in $000s) | $ 1,951 |
Number of portfolio holdings | 42 |
Net advisory fees paid (in $000s) | $ 0 |
Portfolio turnover rate (six months) | 33 % |
Graphical Representation of Holdings
The tables below show the investment makeup of the Fund, representing percentage of the total net assets of the .
Fund
Top Ten Holdings
| Tencent Holdings Ltd. | 13.1 % |
| Alibaba Group Holding Ltd. | 7.7 % |
| Xiaomi Corporation | 7.0 % |
| Pop Mart International Group Ltd. | 4.4 % |
| BYD Company Limited | 3.8 % |
| NetEase, Inc. | 3.5 % |
| Contemporary Amperex Technology Co. Ltd. | 3.3 % |
| China Merchants Bank Co. Ltd. | 3.2 % |
| Meituan | 3.0 % |
| Eastroc Beverage Group Co. Ltd. | 2.7 % |
Sector Allocation
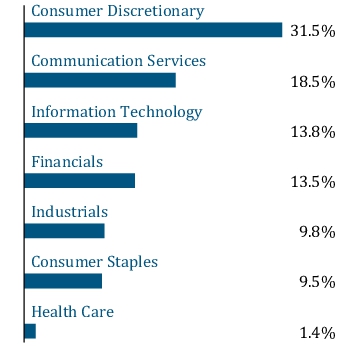
Geographic Diversification

Top Ten Holdings
| Tencent Holdings Ltd. | 13.1 % |
| Alibaba Group Holding Ltd. | 7.7 % |
| Xiaomi Corporation | 7.0 % |
| Pop Mart International Group Ltd. | 4.4 % |
| BYD Company Limited | 3.8 % |
| NetEase, Inc. | 3.5 % |
| Contemporary Amperex Technology Co. Ltd. | 3.3 % |
| China Merchants Bank Co. Ltd. | 3.2 % |
| Meituan | 3.0 % |
| Eastroc Beverage Group Co. Ltd. | 2.7 % |
https://www.williamblairfunds.com/literature/forms
1-800-742-7272
.
What were the Fund costs for the last six months?
(Based on a hypothetical $10,000 investment)
Fund | Cost of $10,000 Investment | Cost of $10,000 Investment as a percentage |
| Emerging Markets Debt Fund Class I | $ 36 | 0.70 % |
Management’s Discussion of Fund Performance
SUMMARY OF RESULTS
The Fund returned 6.64% (net of fees) for the 6 months ended June 30, 2025. The Fund outperformed its benchmark, the J.P. Morgan Emerging Markets Bond Index (EMBI) Global Diversified Index (the "Index"), which returned 5.64% and underperformed the Bloomberg Global Aggregate Index, a broad measure of market performance, which returned 7.27%.
The Fund had positive contributions from all three “beta buckets,” (or risk categories) particularly the high-beta (higher-risk) bucket.
For
all three groups, positive performance was the result of both the country allocation and security selection. Performance in the higher-risk and lower-risk buckets were predominately driven by country allocation while security selection drove performance in the medium-risk bucket.Higher-Risk Countries
In
Lebanon
, our overweight position outperformed as bonds rallied on the appointment of a new prime minister and central bank governor. Additionally, potential de-escalation of regional conflict further supported Lebanese bonds.In
Ecuador
, our overweight position added to performance. Valuations were overly depressed going into the second-round elections, and the win by incumbent Daniel Noboa led to a rapid increase in bond prices.In
Ukraine
, our overweight position underperformed as assets priced out a ceasefire agreement with Russia. There was also disappointment when Ukraine missed the deadline for its warrant payment; however, negotiations with bondholders remain ongoing.In Bolivian asset prices rose on the prospect of regime
Bolivia
, our underweight position detracted from performance.change
in the Presidential elections in the fall.Medium-Risk Countries
In
Turkey
, our overweight in the local currency carry trade contributed positively to performance in the second quarter, with a small contribution from our underweight in sovereign hard currency bonds and CDS position. This more than offset the marginal loss from exposure to hard currency corporate bonds.In
Colombia
, our overweight position in local currency instruments added to performance via security selection. Both our positions in the 2042 bonds and a supranational position outperformed duration matched USD-denominated bond. We participated in
Kyrgyzstan
’s inaugural new issue at the end of May, which was well received by the market. Although it currently trades marginally above the offer price, it has not been able to deliver a strong rally like the wider market.In
Jordan
our position marginally underperformed as geopolitical tensions in the region eased and Jordan continued to make good progress
on its reform efforts under the guidance of the International Monetary Fund.Lower-Risk Countries
In
Hungary
our underweight exposure outperformed. The opposition is polling well ahead of next year’s election and the market is concerned about the implications for fiscal policy. Monetary policy has also been kept fairly tight as inflation has not reverted back to target as quickly as previously expected.In
Saudi Arabia
, our underweight position outperformed. Spreads were not helped by a decline in oil prices as the market focused more on supply and demand dynamics as opposed to increased volatility in regional geopolitics.In
Trinidad and Tobago
, our investments underperformed due to a more hawkish policy from the Trump administration toward Venezuela. The Trump administration revoked the OFAC licenses to operate the Dragon gas field, off the coast of Venezuela and Trinidad. This led to concerns about fundamentals within Trinidad.In
India
, our underweight exposure to quasi-sovereign bonds contributed marginally to performance as spreads in India compressed less than other index countries. However, our exposure to select corporate issuers detracted from performance amid market volatility
early in the second quarter.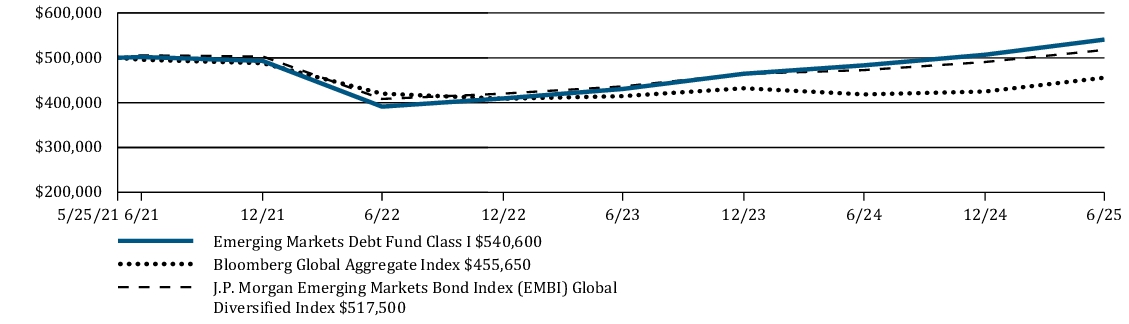
Average Annual Total Returns | 6 Months | 1 Year | Since Inception |
Emerging Markets Debt Fund Class I | 6.64 % | 11.81 % | 1.90 % |
Bloomberg Global Aggregate Index | 7.27 % | 8.91 % | -2.24 % |
J.P. Morgan Emerging Markets Bond Index (EMBI) Global Diversified Index | 5.64 % | 9.97 % | 0.62 % |
www.williamblairfunds.com/funds/total-returns
Key Fund
Statistics
Fund net assets (in $000s) | $ 59,345 |
Number of portfolio holdings | 237 |
Net advisory fees paid (in $000s) | $ 46 |
Portfolio turnover rate (six months) | 77 % |
Graphical Representation of Holdings
The tables below show the investment makeup of the Fund, representing percentage of the total net assets of the Fund. Credit quality designations range from AAA (highest) to D (lowest). Credit quality ratings on underlying securities are received
from
S&P and Moody’s which are converted to the equivalent S&P major rating category for presentation purposes only
.Top Ten Holdings
| Petroleos Mexicanos | 3.2 % |
| Oman Government International Bond | 3.1 % |
| Argentina Government International Bond | 3.0 % |
| Egypt Government International Bond | 2.9 % |
| Romania Government International Bond | 2.7 % |
| Ukraine Government International Bond | 2.4 % |
| Paraguay Government International Bond | 2.3 % |
| Dominican Republic International Bond | 2.3 % |
| Ecuador Government International Bond | 1.9 % |
| Turkey Government International Bond | 1.7 % |
Geographic Diversification

Credit Quality

Top Ten Holdings
| Petroleos Mexicanos | 3.2 % |
| Oman Government International Bond | 3.1 % |
| Argentina Government International Bond | 3.0 % |
| Egypt Government International Bond | 2.9 % |
| Romania Government International Bond | 2.7 % |
| Ukraine Government International Bond | 2.4 % |
| Paraguay Government International Bond | 2.3 % |
| Dominican Republic International Bond | 2.3 % |
| Ecuador Government International Bond | 1.9 % |
| Turkey Government International Bond | 1.7 % |
https://www.williamblairfunds.com/literature/forms
1-800-742-7272
.
What were the Fund costs for the last six months?
(Based on a hypothetical $10,000 investment)
Fund | Cost of $10,000 Investment | Cost of $10,000 Investment as a percentage |
| Emerging Markets Debt Fund Class R6 | $ 34 | 0.65 % |
Management’s Discussion of Fund Performance
SUMMARY OF RESULTS
The Fund returned 6.68% (net of fees) for the 6 months ended June 30, 2025. The Fund outperformed its benchmark, the J.P. Morgan Emerging Markets Bond Index (EMBI) Global Diversified Index (the "Index"), which returned 5.64% and underperformed the
Bloomberg
Global Aggregate Index, a broad measure of market performance, which returned 7.27%.The Fund had positive contributions from all three “beta buckets,” (or risk categories) particularly the high-beta (higher-risk) bucket. For all three groups, positive performance was the result of both the country allocation and security selection. Performance in the higher-risk and lower-risk buckets were predominately driven by country allocation while security selection drove performance in the medium-risk bucket.
Higher-Risk Countries
In
Lebanon
, our overweight position outperformed as bonds rallied on the appointment of a new prime minister and central bank governor. Additionally, potential de-escalation of regional conflict further supported Lebanese bonds.In
Ecuador
, our overweight position added to performance. Valuations were overly depressed going into the second-round elections, and the win by incumbent Daniel Noboa led to a rapid increase in bond prices.In
Ukraine
, our overweight position underperformed as assets priced out a ceasefire agreement with Russia. There was also disappointment when Ukraine missed the deadline for its warrant payment; however, negotiations with bondholders remain ongoing.In Bolivian asset prices rose on the prospect of
Bolivia
, our underweight position detracted from performance.regime
change in the Presidential elections in the fall.Medium-Risk Countries
In
Turkey
, our overweight in the local currency carry trade contributed positively to performance in the second quarter, with a small contribution from our underweight in sovereign hard currency bonds and CDS position. This more than offset the marginal loss from exposure to hard currency corporate bonds.In
Colombia
, our overweight position in local currency instruments added to performance via security selection. Both our positions in the 2042 bonds and a supranational position outperformed duration matched USD-denominated bond. We participated in
Kyrgyzstan
’s inaugural new issue at the end of May, which was well received by the market. Although it currently trades marginally above the offer price, it has not been able to deliver a strong rally like the wider market.In
Jordan
our position marginally underperformed as geopolitical tensions in the region eased and Jordan continued to make good progress on its reform efforts under the guidance of the International Monetary Fund
.Lower-Risk Countries
In
Hungary
our underweight exposure outperformed. The opposition is polling well ahead of next year’s election and the market is concerned about the implications for fiscal policy. Monetary policy has also been kept fairly tight as inflation has not reverted back to target as quickly as previously expected.In
Saudi Arabia
, our underweight position outperformed. Spreads were not helped by a decline in oil prices as the market focused more on supply and demand dynamics as opposed to increased volatility in regional geopolitics.In
Trinidad and Tobago
, our investments underperformed due to a more hawkish policy from the Trump administration toward Venezuela. The Trump administration revoked the OFAC licenses to operate the Dragon gas field, off the coast of Venezuela and Trinidad. This led to concerns about fundamentals within Trinidad.In
India
, our underweight exposure to quasi-sovereign bonds contributed marginally to performance as spreads in India compressed less than other index countries. However, our exposure to select corporate issuers detracted from performance amid market volatility early
in the second quarter.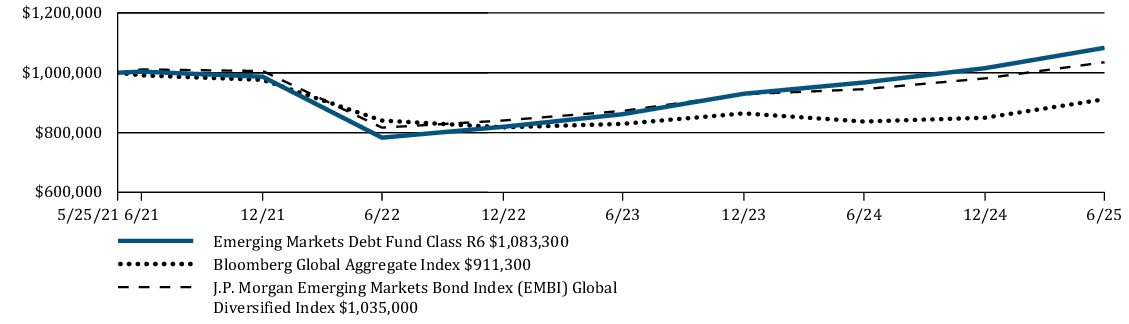
Average Annual Total Returns | 6 Months | 1 Year | Since Inception |
Emerging Markets Debt Fund Class R6 | 6.68 % | 11.90 % | 1.96 % |
Bloomberg Global Aggregate Index | 7.27 % | 8.91 % | -2.24 % |
J.P. Morgan Emerging Markets Bond Index (EMBI) Global Diversified Index | 5.64 % | 9.97 % | 0.62 % |
shares
.
www.williamblairfunds.com/funds/total-returns
Key Fund Statistics
Fund net assets (in $000s) | $ 59,345 |
Number of portfolio holdings | 237 |
Net advisory fees paid (in $000s) | $ 46 |
Portfolio turnover rate (six months) | 77 % |
Graphical Representation of Holdings
The tables below show the investment makeup of the Fund, representing percentage of the total net assets of the Fund. Credit quality designations range from AAA (highest) to D (lowest). Credit quality ratings on underlying securities are received from S&P and
Moody
’s which are converted to the equivalent S&P major rating category for presentation purposes only.Top Ten Holdings
| Petroleos Mexicanos | 3.2 % |
| Oman Government International Bond | 3.1 % |
| Argentina Government International Bond | 3.0 % |
| Egypt Government International Bond | 2.9 % |
| Romania Government International Bond | 2.7 % |
| Ukraine Government International Bond | 2.4 % |
| Paraguay Government International Bond | 2.3 % |
| Dominican Republic International Bond | 2.3 % |
| Ecuador Government International Bond | 1.9 % |
| Turkey Government International Bond | 1.7 % |
Geographic Diversification
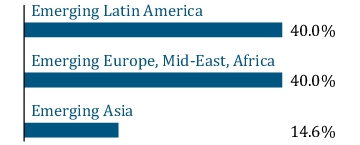
Credit Quality
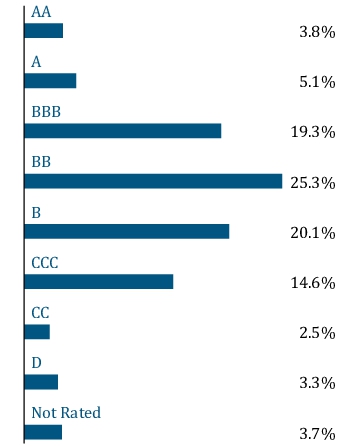
Top Ten Holdings
| Petroleos Mexicanos | 3.2 % |
| Oman Government International Bond | 3.1 % |
| Argentina Government International Bond | 3.0 % |
| Egypt Government International Bond | 2.9 % |
| Romania Government International Bond | 2.7 % |
| Ukraine Government International Bond | 2.4 % |
| Paraguay Government International Bond | 2.3 % |
| Dominican Republic International Bond | 2.3 % |
| Ecuador Government International Bond | 1.9 % |
| Turkey Government International Bond | 1.7 % |