Shareholder Report
Jun. 30, 2025
USD ($)
Holding
This report describes changes to the Fund that occurred during the reporting period.
What were the Fund costs for the last year? (based on a hypothetical $10,000 investment)
| Cost of a $10,000 investment |
Costs paid as a percentage of $10,000 investment* | |||
| Class A Shares |
$123 | 1.15% | ||
* Annualized for period less than one year.
How did the Fund perform last year? What affected the Fund’s performance?
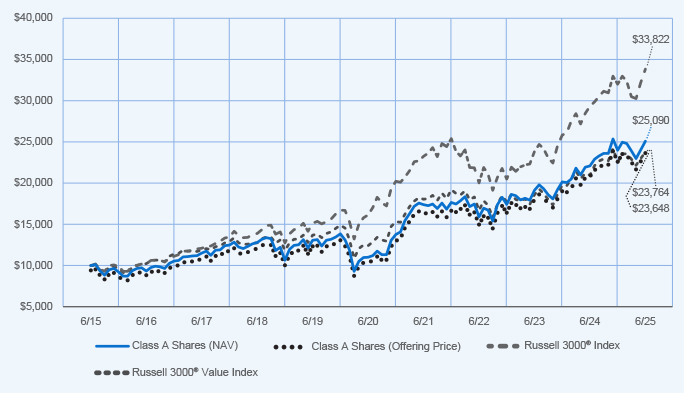
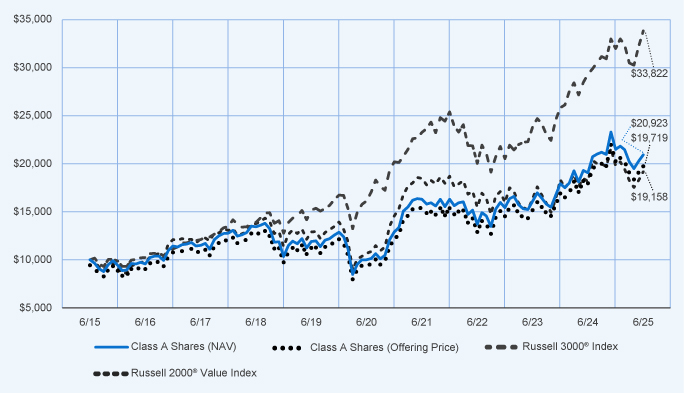
| Performance Highlights • The Nuveen Multi Cap Value Fund returned 13.69% for Class A Shares at net asset value (NAV) for the 12 months ended June 30, 2025. The Fund outperformed the Russell 3000 Value Index, which returned 13.30%. • Top contributors to relative performance • Out‑of‑benchmark position in ADMA Biologics, Inc. • Overweight to AT&T Inc. • Security selection in the financials sector, led by overweights to Discover Financial Services and Wells Fargo & Company. • Top detractors from relative performance • Although the Fund was underweight UnitedHealth Group Incorporated, which generally underperformed during the reporting period, the timing of when the stock was purchased in December detracted. • Security selection in the materials sector, including an out‑of‑benchmark position in Innospec Inc. • Overweight to Elevance Health, Inc. |
Average Annual Total Returns
| 1‑Year | 5‑Year | 10‑Year | ||||
| Class A Shares at NAV (excluding maximum sales charge) |
13.69% | 17.91% | 9.64% | |||
| Class A Shares at maximum sales charge (Offering Price) |
7.14% | 16.52% | 8.99% | |||
| Russell 3000® Index |
15.30% | 15.96% | 12.96% | |||
| Russell 3000® Value Index |
13.30% | 13.87% | 9.04% | |||
| Lipper Multi‑Cap Value Funds Classification Average |
11.95% | 14.53% | 8.96% | |||
Fund Statistics (as of June 30, 2025)
| Fund net assets |
$ | 521,544,317 | ||
| Total number of portfolio holdings |
61 | |||
| Portfolio turnover (%) |
30% | |||
| Total management fees paid for the year |
$ | 3,421,772 | ||

How has the Fund changed?
For more complete information, you may review the Fund’s next prospectus, which is expected to be available by October 31, 2025 at https://www.nuveen.com/en‑us/mutual‑funds/prospectuses or upon request at (800) 257‑8787.
For more complete information, you may review the Fund’s next prospectus, which is expected to be available by October 31, 2025 at https://www.nuveen.com/en‑us/mutual‑funds/prospectuses or upon request at (800) 257‑8787.
This report describes changes to the Fund that occurred during the reporting period.
What were the Fund costs for the last year? (based on a hypothetical $10,000 investment)
| Cost of a $10,000 investment |
Costs paid as a percentage of $10,000 investment* | |||
| Class C Shares |
$202 | 1.90% | ||
* Annualized for period less than one year.
How did the Fund perform last year? What affected the Fund’s performance?
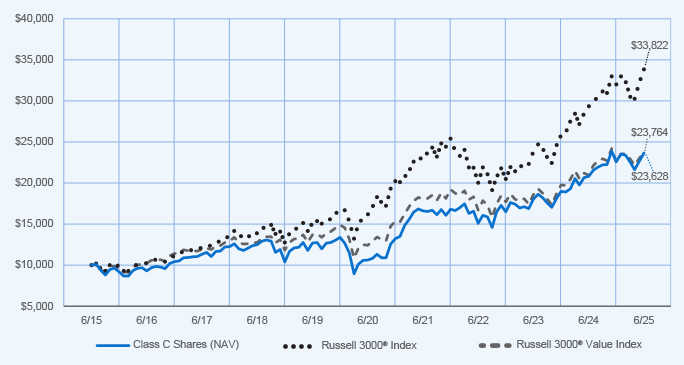
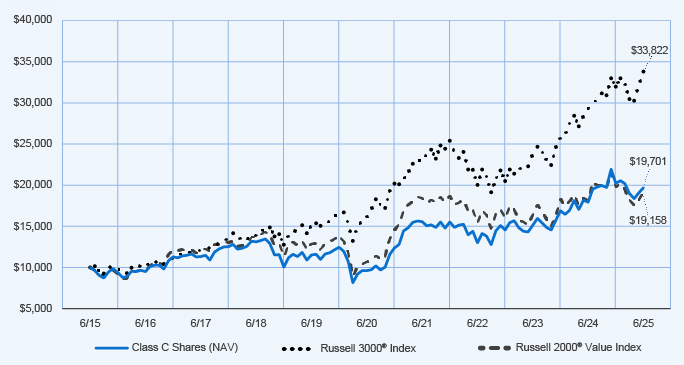
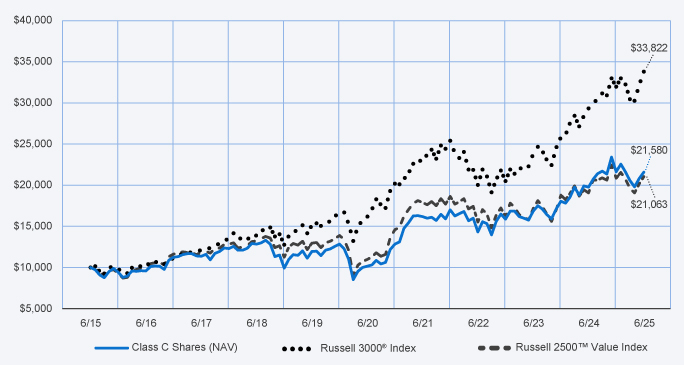
| Performance Highlights • The Nuveen Multi Cap Value Fund returned 12.84% for Class C Shares at net asset value (NAV) for the 12 months ended June 30, 2025. The Fund underperformed the Russell 3000 Value Index, which returned 13.30%. • Top contributors to relative performance • Out‑of‑benchmark position in ADMA Biologics, Inc. • Overweight to AT&T Inc. • Security selection in the financials sector, led by overweights to Discover Financial Services and Wells Fargo & Company. • Top detractors from relative performance • Although the Fund was underweight UnitedHealth Group Incorporated, which generally underperformed during the reporting period, the timing of when the stock was purchased in December detracted. • Security selection in the materials sector, including an out‑of‑benchmark position in Innospec Inc. • Overweight to Elevance Health, Inc. |
Average Annual Total Returns
| 1‑Year | 5‑Year | 10‑Year | ||||
| Class C Shares at NAV (excluding maximum sales charge) |
12.84% | 17.04% | 8.98% | |||
| Russell 3000® Index |
15.30% | 15.96% | 12.96% | |||
| Russell 3000® Value Index |
13.30% | 13.87% | 9.04% | |||
| Lipper Multi‑Cap Value Funds Classification Average |
11.95% | 14.53% | 8.96% | |||
Fund Statistics (as of June 30, 2025)
| Fund net assets |
$ | 521,544,317 | ||
| Total number of portfolio holdings |
61 | |||
| Portfolio turnover (%) |
30% | |||
| Total management fees paid for the year |
$ | 3,421,772 | ||
How has the Fund changed?
For more complete information, you may review the Fund’s next prospectus, which is expected to be available by October 31, 2025 at https://www.nuveen.com/en‑us/mutual‑funds/prospectuses or upon request at (800) 257‑8787.
For more complete information, you may review the Fund’s next prospectus, which is expected to be available by October 31, 2025 at https://www.nuveen.com/en‑us/mutual‑funds/prospectuses or upon request at (800) 257‑8787.
This report describes changes to the Fund that occurred during the reporting period.
What were the Fund costs for the last year? (based on a hypothetical $10,000 investment)
| Cost of a $10,000 investment |
Costs paid as a percentage of $10,000 investment* | |||
| Class I Shares |
$96 | 0.90% | ||
* Annualized for period less than one year.
How did the Fund perform last year? What affected the Fund’s performance?
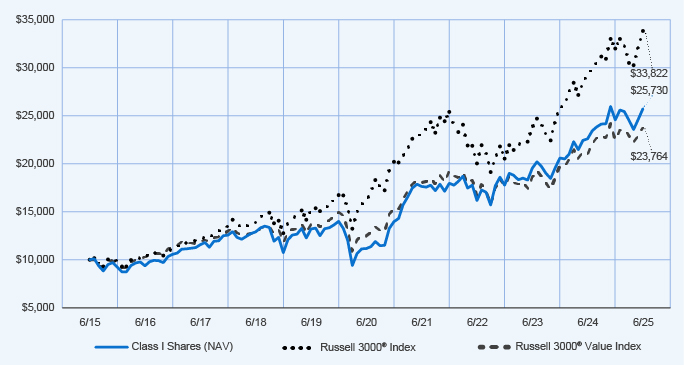
| Performance Highlights • The Nuveen Multi Cap Value Fund returned 13.98% for Class I Shares at net asset value (NAV) for the 12 months ended June 30, 2025. The Fund outperformed the Russell 3000 Value Index, which returned 13.30%. • Top contributors to relative performance • Out‑of‑benchmark position in ADMA Biologics, Inc. • Overweight to AT&T Inc. • Security selection in the financials sector, led by overweights to Discover Financial Services and Wells Fargo & Company. • Top detractors from relative performance • Although the Fund was underweight UnitedHealth Group Incorporated, which generally underperformed during the reporting period, the timing of when the stock was purchased in December detracted. • Security selection in the materials sector, including an out‑of‑benchmark position in Innospec Inc. • Overweight to Elevance Health, Inc. |
Average Annual Total Returns
| 1‑Year | 5‑Year | 10‑Year | ||||||||||
| Class I Shares at NAV |
13.98 | % | 18.21 | % | 9.91 | % | ||||||
| Russell 3000® Index |
15.30 | % | 15.96 | % | 12.96 | % | ||||||
| Russell 3000® Value Index |
13.30 | % | 13.87 | % | 9.04 | % | ||||||
| Lipper Multi‑Cap Value Funds Classification Average |
11.95 | % | 14.53 | % | 8.96 | % | ||||||
Fund Statistics (as of June 30, 2025)
| Fund net assets |
$ | 521,544,317 | ||
| Total number of portfolio holdings |
61 | |||
| Portfolio turnover (%) |
30% | |||
| Total management fees paid for the year |
$ | 3,421,772 | ||

How has the Fund changed?
For more complete information, you may review the Fund’s next prospectus, which is expected to be available by October 31, 2025 at https://www.nuveen.com/en‑us/mutual‑funds/prospectuses or upon request at (800) 257‑8787.
For more complete information, you may review the Fund’s next prospectus, which is expected to be available by October 31, 2025 at https://www.nuveen.com/en‑us/mutual‑funds/prospectuses or upon request at (800) 257‑8787.
This report describes changes to the Fund that occurred during the reporting period.
What were the Fund costs for the last year? (based on a hypothetical $10,000 investment)
| Cost of a $10,000 investment |
Costs paid as a percentage of $10,000 investment* | |||
| Class A Shares |
$126 | 1.20% | ||
* Annualized for period less than one year.
How did the Fund perform last year? What affected the Fund’s performance?
| Performance Highlights • The Nuveen Small Cap Value Opportunities Fund returned 9.85% for Class A Shares at net asset value (NAV) for the 12 months ended June 30, 2025. The Fund significantly outperformed the Russell 2000 Value Index, which returned 5.54%. • Top contributors to relative performance • Security selection in the health care sector, led by an out‑of‑benchmark position in ADMA Biologics, Inc. • Security selection in the financials sector, led by out‑of‑benchmark positions in Marex Group plc and Western Alliance Bancorp and an overweight to Skyward Specialty Insurance Group, Inc. • Security selection and an underweight allocation to the energy sector, led by an out‑of‑benchmark position in Antero Midstream Corporation. • Top detractors from relative performance • Security selection in the consumer staples sector, including an out‑of‑benchmark position in Grocery Outlet Holding Corp. • Security selection in the materials sector, including an overweight position in Materion Corporation. • Security selection and an underweight allocation to the communication services sector, including an overweight to Vimeo Inc. |
Average Annual Total Returns
| 1‑Year | 5‑Year | 10‑Year | ||||
| Class A Shares at NAV (excluding maximum sales charge) |
9.85% | 15.92% | 7.66% | |||
| Class A Shares at maximum sales charge (Offering Price) |
3.53% | 14.56% | 7.03% | |||
| Russell 3000® Index |
15.30% | 15.96% | 12.96% | |||
| Russell 2000® Value Index |
5.54% | 12.47% | 6.72% | |||
| Lipper Small‑Cap Core Funds Classification Average |
6.04% | 12.04% | 7.23% | |||
Fund Statistics (as of June 30, 2025)
| Fund net assets |
$236,210,961 | |||
| Total number of portfolio holdings |
65 | |||
| Portfolio turnover (%) |
96% | |||
| Total management fees paid for the year |
$ 1,839,283 | |||

How has the Fund changed?
For more complete information, you may review the Fund’s next prospectus, which is expected to be available by October 31, 2025 at https://www.nuveen.com/en‑us/mutual‑funds/prospectuses or upon request at (800) 257‑8787.
For more complete information, you may review the Fund’s next prospectus, which is expected to be available by October 31, 2025 at https://www.nuveen.com/en‑us/mutual‑funds/prospectuses or upon request at (800) 257‑8787.
This report describes changes to the Fund that occurred during the reporting period.
What were the Fund costs for the last year? (based on a hypothetical $10,000 investment)
| Cost of a $10,000 investment |
Costs paid as a percentage of $10,000 investment* | |||
| Class C Shares |
$204 | 1.95% | ||
* Annualized for period less than one year.
How did the Fund perform last year? What affected the Fund’s performance?
| Performance Highlights • The Nuveen Small Cap Value Opportunities Fund returned 9.03% for Class C Shares at net asset value (NAV) for the 12 months ended June 30, 2025. The Fund outperformed the Russell 2000 Value Index, which returned 5.54%. • Top contributors to relative performance • Security selection in the health care sector, led by an out‑of‑benchmark position in ADMA Biologics, Inc. • Security selection in the financials sector, led by out‑of‑benchmark positions in Marex Group plc and Western Alliance Bancorp and an overweight to Skyward Specialty Insurance Group, Inc. • Security selection and an underweight allocation to the energy sector, led by an out‑of‑benchmark position in Antero Midstream Corporation. • Top detractors from relative performance • Security selection in the consumer staples sector, including an out‑of‑benchmark position in Grocery Outlet Holding Corp. • Security selection in the materials sector, including an overweight position in Materion Corporation. • Security selection and an underweight allocation to the communication services sector, including an overweight to Vimeo Inc. |
Average Annual Total Returns
| 1‑Year | 5‑Year | 10‑Year | ||||||||||
| Class C Shares at NAV (excluding maximum sales charge) |
9.03 | % | 15.06 | % | 7.02 | % | ||||||
| Russell 3000® Index |
15.30 | % | 15.96 | % | 12.96 | % | ||||||
| Russell 2000® Value Index |
5.54 | % | 12.47 | % | 6.72 | % | ||||||
| Lipper Small‑Cap Core Funds Classification Average |
6.04 | % | 12.04 | % | 7.23 | % | ||||||
Fund Statistics (as of June 30, 2025)
| Fund net assets |
$ | 236,210,961 | ||
| Total number of portfolio holdings |
65 | |||
| Portfolio turnover (%) |
96% | |||
| Total management fees paid for the year |
$ | 1,839,283 | ||

How has the Fund changed?
For more complete information, you may review the Fund’s next prospectus, which is expected to be available by October 31, 2025 at https://www.nuveen.com/en‑us/mutual‑funds/prospectuses or upon request at (800) 257‑8787.
For more complete information, you may review the Fund’s next prospectus, which is expected to be available by October 31, 2025 at https://www.nuveen.com/en‑us/mutual‑funds/prospectuses or upon request at (800) 257‑8787.
This report describes changes to the Fund that occurred during the reporting period.
What were the Fund costs for the last year? (based on a hypothetical $10,000 investment)
| Cost of a $10,000 investment |
Costs paid as a percentage of $10,000 investment* | |||
| Class R6 Shares |
$85 | 0.81% | ||
* Annualized for period less than one year.
How did the Fund perform last year? What affected the Fund’s performance?
| Performance Highlights • The Nuveen Small Cap Value Opportunities Fund returned 10.28% for Class R6 Shares at net asset value (NAV) for the 12 months ended June 30, 2025. The Fund significantly outperformed the Russell 2000 Value Index, which returned 5.54%. • Top contributors to relative performance • Security selection in the health care sector, led by an out‑of‑benchmark position in ADMA Biologics, Inc. • Security selection in the financials sector, led by out‑of‑benchmark positions in Marex Group plc and Western Alliance Bancorp and an overweight to Skyward Specialty Insurance Group, Inc. • Security selection and an underweight allocation to the energy sector, led by an out‑of‑benchmark position in Antero Midstream Corporation. • Top detractors from relative performance • Security selection in the consumer staples sector, including an out‑of‑benchmark position in Grocery Outlet Holding Corp. • Security selection in the materials sector, including an overweight position in Materion Corporation. • Security selection and an underweight allocation to the communication services sector, including an overweight to Vimeo Inc. |
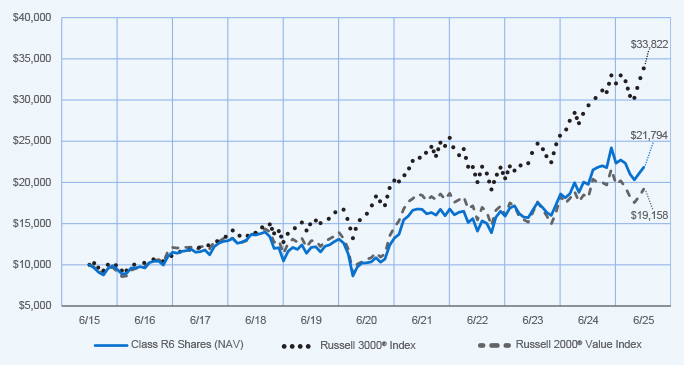
Average Annual Total Returns
| 1‑Year | 5‑Year | 10‑Year | ||||
| Class R6 Shares at NAV |
10.28% | 16.38% | 8.10% | |||
| Russell 3000® Index |
15.30% | 15.96% | 12.96% | |||
| Russell 2000® Value Index |
5.54% | 12.47% | 6.72% | |||
| Lipper Small‑Cap Core Funds Classification Average |
6.04% | 12.04% | 7.23% | |||
Fund Statistics (as of June 30, 2025)
| Fund net assets |
$236,210,961 | |||
| Total number of portfolio holdings |
65 | |||
| Portfolio turnover (%) |
96% | |||
| Total management fees paid for the year |
$ 1,839,283 | |||

How has the Fund changed?
For more complete information, you may review the Fund’s next prospectus, which is expected to be available by October 31, 2025 at https://www.nuveen.com/en‑us/mutual‑funds/prospectuses or upon request at (800) 257‑8787.
For more complete information, you may review the Fund’s next prospectus, which is expected to be available by October 31, 2025 at https://www.nuveen.com/en‑us/mutual‑funds/prospectuses or upon request at (800) 257‑8787.
This report describes changes to the Fund that occurred during the reporting period.
What were the Fund costs for the last year? (based on a hypothetical $10,000 investment)
| Cost of a $10,000 investment |
Costs paid as a percentage of $10,000 investment* | |||
| Class I Shares |
$100 | 0.95% | ||
* Annualized for period less than one year.
How did the Fund perform last year? What affected the Fund’s performance?
| Performance Highlights • The Nuveen Small Cap Value Opportunities Fund returned 10.13% for Class I Shares at net asset value (NAV) for the 12 months ended June 30, 2025. The Fund significantly outperformed the Russell 2000 Value Index, which returned 5.54%. • Top contributors to relative performance • Security selection in the health care sector, led by an out‑of‑benchmark position in ADMA Biologics, Inc. • Security selection in the financials sector, led by out‑of‑benchmark positions in Marex Group plc and Western Alliance Bancorp and an overweight to Skyward Specialty Insurance Group, Inc. • Security selection and an underweight allocation to the energy sector, led by an out‑of‑benchmark position in Antero Midstream Corporation. • Top detractors from relative performance • Security selection in the consumer staples sector, including an out‑of‑benchmark position in Grocery Outlet Holding Corp. • Security selection in the materials sector, including an overweight position in Materion Corporation. • Security selection and an underweight allocation to the communication services sector, including an overweight to Vimeo Inc. |
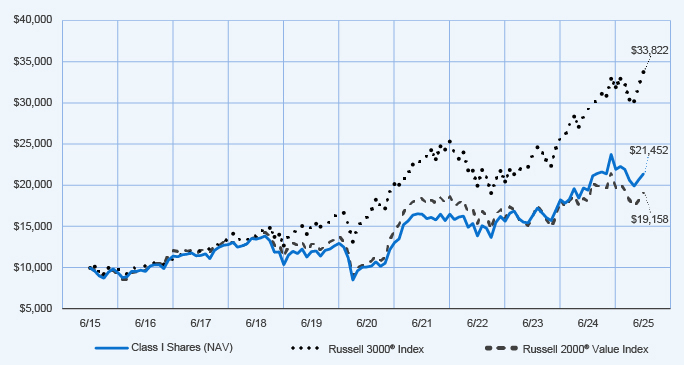
Average Annual Total Returns
| 1‑Year | 5‑Year | 10‑Year | ||||
| Class I Shares at NAV |
10.13% | 16.22% | 7.93% | |||
| Russell 3000® Index |
15.30% | 15.96% | 12.96% | |||
| Russell 2000® Value Index |
5.54% | 12.47% | 6.72% | |||
| Lipper Small‑Cap Core Funds Classification Average |
6.04% | 12.04% | 7.23% | |||
Fund Statistics (as of June 30, 2025)
| Fund net assets |
$ | 236,210,961 | ||
| Total number of portfolio holdings |
65 | |||
| Portfolio turnover (%) |
96% | |||
| Total management fees paid for the year |
$ | 1,839,283 | ||
How has the Fund changed?
For more complete information, you may review the Fund’s next prospectus, which is expected to be available by October 31, 2025 at https://www.nuveen.com/en‑us/mutual‑funds/prospectuses or upon request at (800) 257‑8787.
For more complete information, you may review the Fund’s next prospectus, which is expected to be available by October 31, 2025 at https://www.nuveen.com/en‑us/mutual‑funds/prospectuses or upon request at (800) 257‑8787.
This report describes changes to the Fund that occurred during the reporting period.
What were the Fund costs for the last year? (based on a hypothetical $10,000 investment)
| Cost of a $10,000 investment |
Costs paid as a percentage of $10,000 investment* | |||
| Class A Shares |
$108 | 1.00% | ||
* Annualized for period less than one year.
How did the Fund perform last year? What affected the Fund’s performance?
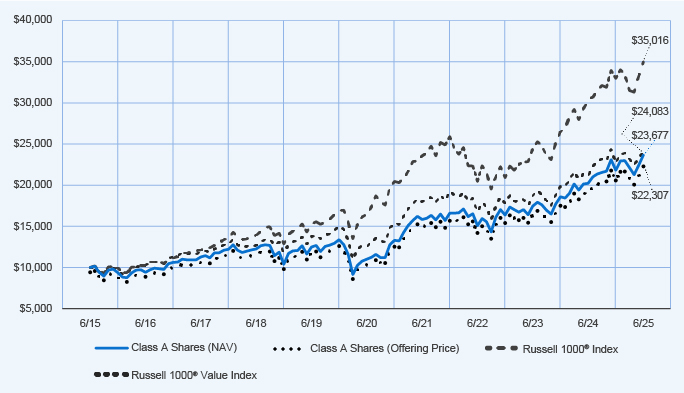
| Performance Highlights • The Nuveen Large Cap Value Opportunities Fund returned 16.97% for Class A Shares at net asset value (NAV) for the 12 months ended June 30, 2025. The Fund outperformed the Russell 1000 Value Index, which returned 13.70%. • Top contributors to relative performance • Security selection in the consumer staples sector, led by an overweight to Walmart Inc. • Security selection in the financials sector, led by overweights to JPMorgan Chase & Co. and Discover Financial Services. • Overweight to AT&T Inc. • Top detractors from relative performance • Overweight to Elevance Health, Inc. • Security selection and an underweight to the industrials sector. • Security selection in the real estate sector, including an overweight to Alexandria Real Estate Equities, Inc. |
Average Annual Total Returns
| 1-Year | 5-Year | 10-Year | ||||
| Class A Shares at NAV (excluding maximum sales charge) |
16.97% | 16.58% | 9.00% | |||
| Class A Shares at maximum sales charge (Offering Price) |
10.29% | 15.21% | 8.35% | |||
| Russell 1000® Index |
15.66% | 16.30% | 13.35% | |||
| Russell 1000® Value Index |
13.70% | 13.93% | 9.19% | |||
| Lipper Multi‑Cap Value Funds Classification Average |
11.95% | 14.53% | 8.96% | |||
Fund Statistics (as of June 30, 2025)
| Fund net assets |
$ | 22,535,559 | ||
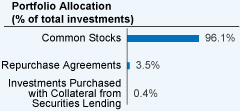
| Total number of portfolio holdings |
58 | |||
| Portfolio turnover (%) |
25% | |||
| Total management fees paid for the year |
$ | 145,699 | ||
How has the Fund changed?
For more complete information, you may review the Fund’s next prospectus, which is expected to be available by October 31, 2025 at https://www.nuveen.com/en‑us/mutual‑funds/prospectuses or upon request at (800) 257‑8787.
For more complete information, you may review the Fund’s next prospectus, which is expected to be available by October 31, 2025 at https://www.nuveen.com/en‑us/mutual‑funds/prospectuses or upon request at (800) 257‑8787.
This report describes changes to the Fund that occurred during the reporting period.
What were the Fund costs for the last year? (based on a hypothetical $10,000 investment)
| Cost of a $10,000 investment |
Costs paid as a percentage of $10,000 investment* | |||
| Class C Shares |
$189 | 1.75% | ||
* Annualized for period less than one year.
How did the Fund perform last year? What affected the Fund’s performance?
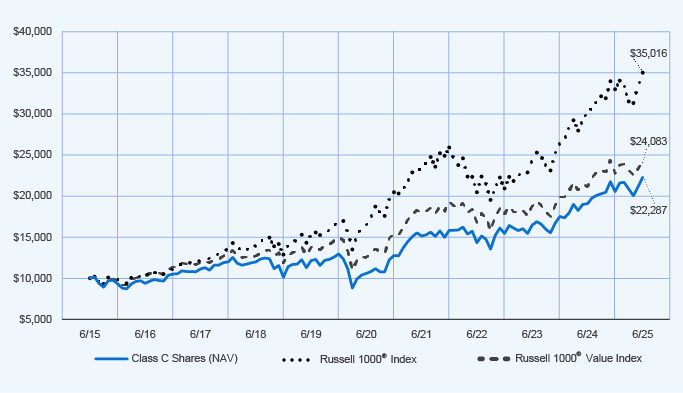
| Performance Highlights • The Nuveen Large Cap Value Opportunities Fund returned 15.87% for Class C Shares at net asset value (NAV) for the 12 months ended June 30, 2025. The Fund outperformed the Russell 1000 Value Index, which returned 13.70%. • Top contributors to relative performance • Security selection in the consumer staples sector, led by an overweight to Walmart Inc. • Security selection in the financials sector, led by overweights to JPMorgan Chase & Co. and Discover Financial Services. • Overweight to AT&T Inc. • Top detractors from relative performance • Overweight to Elevance Health, Inc. • Security selection and an underweight to the industrials sector. • Security selection in the real estate sector, including an overweight to Alexandria Real Estate Equities, Inc. |
Average Annual Total Returns
| 1‑Year | 5‑Year | 10‑Year | ||||
| Class C Shares at NAV (excluding maximum sales charge) |
15.87% | 15.64% | 8.34% | |||
| Russell 1000® Index |
15.66% | 16.30% | 13.35% | |||
| Russell 1000® Value Index |
13.70% | 13.93% | 9.19% | |||
| Lipper Multi‑Cap Value Funds Classification Average |
11.95% | 14.53% | 8.96% | |||
Fund Statistics (as of June 30, 2025)
| Fund net assets |
$ | 22,535,559 | ||
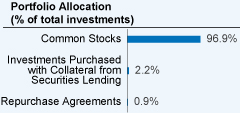
| Total number of portfolio holdings |
58 | |||
| Portfolio turnover (%) |
25% | |||
| Total management fees paid for the year |
$ | 145,699 | ||

How has the Fund changed?
For more complete information, you may review the Fund’s next prospectus, which is expected to be available by October 31, 2025 at https://www.nuveen.com/en‑us/mutual‑funds/prospectuses or upon request at (800) 257‑8787.
For more complete information, you may review the Fund’s next prospectus, which is expected to be available by October 31, 2025 at https://www.nuveen.com/en‑us/mutual‑funds/prospectuses or upon request at (800) 257‑8787.
This report describes changes to the Fund that occurred during the reporting period.
What were the Fund costs for the last year? (based on a hypothetical $10,000 investment)
| Cost of a $10,000 investment |
Costs paid as a percentage of $10,000 investment* | |||
| Class I Shares |
$81 | 0.75% | ||
* Annualized for period less than one year.
How did the Fund perform last year? What affected the Fund’s performance?
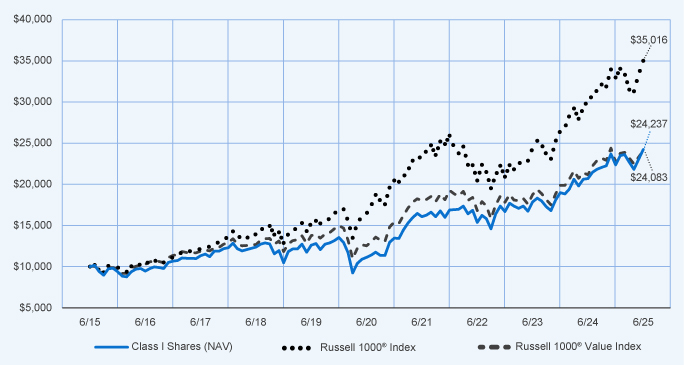
| Performance Highlights • The Nuveen Large Cap Value Opportunities Fund returned 17.09% for Class I Shares at net asset value (NAV) for the 12 months ended June 30, 2025. The Fund outperformed the Russell 1000 Value Index, which returned 13.70%. • Top contributors to relative performance • Security selection in the consumer staples sector, led by an overweight to Walmart Inc. • Security selection in the financials sector, led by overweights to JPMorgan Chase & Co. and Discover Financial Services. • Overweight to AT&T Inc. • Top detractors from relative performance • Overweight to Elevance Health, Inc. • Security selection and an underweight to the industrials sector. • Security selection in the real estate sector, including an overweight to Alexandria Real Estate Equities, Inc. |
Average Annual Total Returns
| 1-Year | 5-Year | 10-Year | ||||
| Class I Shares at NAV |
17.09% | 16.84% | 9.26% | |||
| Russell 1000® Index |
15.66% | 16.30% | 13.35% | |||
| Russell 1000® Value Index |
13.70% | 13.93% | 9.19% | |||
| Lipper Multi‑Cap Value Funds Classification Average |
11.95% | 14.53% | 8.96% | |||
Fund Statistics (as of June 30, 2025)
| Fund net assets |
$ | 22,535,559 | ||
| Total number of portfolio holdings |
58 | |||
| Portfolio turnover (%) |
25% | |||
| Total management fees paid for the year |
$ | 145,699 | ||
How has the Fund changed?
For more complete information, you may review the Fund’s next prospectus, which is expected to be available by October 31, 2025 at https://www.nuveen.com/en‑us/mutual‑funds/prospectuses or upon request at (800) 257‑8787.
For more complete information, you may review the Fund’s next prospectus, which is expected to be available by October 31, 2025 at https://www.nuveen.com/en‑us/mutual‑funds/prospectuses or upon request at (800) 257‑8787.
This report describes changes to the Fund that occurred during the reporting period.
What were the Fund costs for the last year? (based on a hypothetical $10,000 investment)
| Cost of a $10,000 investment |
Costs paid as a percentage of $10,000 investment* | |||
| Class A Shares |
$137 | 1.31% | ||
* Annualized for period less than one year.
How did the Fund perform last year? What affected the Fund’s performance?
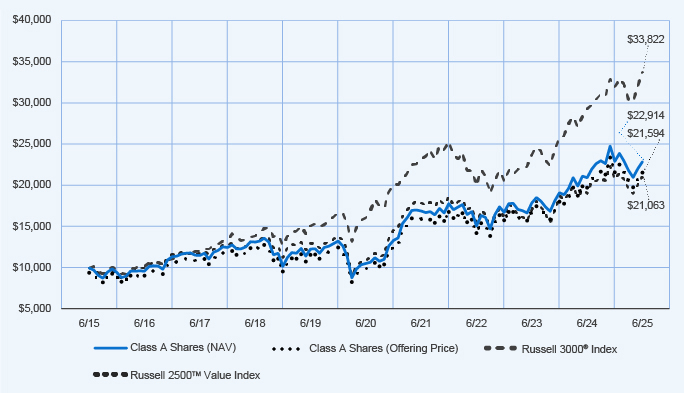
| Performance Highlights • The Nuveen Small/Mid Cap Value Fund returned 9.17% for Class A Shares at net asset value (NAV) for the 12 months ended June 30, 2025. The Fund underperformed the Russell 2500 Value Index, which returned 10.47%. • Top contributors to relative performance • Security selection in the health care sector, led by an out‑of‑benchmark position in ADMA Biologics, Inc. • Overweight to Curtiss-Wright Corporation. • Security selection in the information technology sector, led by an out‑of‑benchmark position in Seagate Technology Holdings PLC. • Top detractors from relative performance • Security selection in the consumer discretionary sector, including overweights to Wayfair, Inc., Advance Auto Parts, Inc. and Under Armour, Inc. • Security selection in the materials sector, including an overweight to FMC Corporation. • Security selection in the financials sector, including Robinhood Markets, Inc, a security not held by the fund. |
Average Annual Total Returns
| 1‑Year | 5‑Year | 10‑Year | ||||||||||
| Class A Shares at NAV (excluding maximum sales charge) |
9.17 | % | 16.79 | % | 8.65 | % | ||||||
| Class A Shares at maximum sales charge (Offering Price) |
2.89 | % | 15.42 | % | 8.00 | % | ||||||
| Russell 3000® Index |
15.30 | % | 15.96 | % | 12.96 | % | ||||||
| Russell 2500™ Value Index |
10.47 | % | 13.96 | % | 7.73 | % | ||||||
| Lipper Small‑Cap Core Funds Classification Average |
6.04 | % | 12.04 | % | 7.23 | % | ||||||
Fund Statistics (as of June 30, 2025)
| Fund net assets |
$ | 91,129,365 | ||
| Total number of portfolio holdings |
65 | |||
| Portfolio turnover (%) |
64% | |||
| Total management fees paid for the year |
$ | 756,111 | ||
How has the Fund changed?
For more complete information, you may review the Fund’s next prospectus, which is expected to be available by October 31, 2025 at https://www.nuveen.com/en‑us/mutual‑funds/prospectuses or upon request at (800) 257‑8787.
For more complete information, you may review the Fund’s next prospectus, which is expected to be available by October 31, 2025 at https://www.nuveen.com/en‑us/mutual‑funds/prospectuses or upon request at (800) 257‑8787.
This report describes changes to the Fund that occurred during the reporting period.
What were the Fund costs for the last year? (based on a hypothetical $10,000 investment)
| Cost of a $10,000 investment |
Costs paid as a percentage of $10,000 investment* | |||
| Class C Shares |
$215 | 2.06% | ||
* Annualized for period less than one year.
How did the Fund perform last year? What affected the Fund’s performance?
| Performance Highlights • The Nuveen Small/Mid Cap Value Fund returned 8.38% for Class C Shares at net asset value (NAV) for the 12 months ended June 30, 2025. The Fund underperformed the Russell 2500 Value Index, which returned 10.47%. • Top contributors to relative performance • Security selection in the health care sector, led by an out‑of‑benchmark position in ADMA Biologics, Inc. • Overweight to Curtiss-Wright Corporation. • Security selection in the information technology sector, led by an out‑of‑benchmark position in Seagate Technology Holdings PLC. • Top detractors from relative performance • Security selection in the consumer discretionary sector, including overweights to Wayfair, Inc., Advance Auto Parts, Inc. and Under Armour, Inc. • Security selection in the materials sector, including an overweight to FMC Corporation. • Security selection in the financials sector, including Robinhood Markets, Inc, a security not held by the fund. |
Average Annual Total Returns
| 1‑Year | 5‑Year | 10‑Year | ||||
| Class C Shares at NAV (excluding maximum sales charge) |
8.38% | 15.92% | 8.00% | |||
| Russell 3000® Index |
15.30% | 15.96% | 12.96% | |||
| Russell 2500™ Value Index |
10.47% | 13.96% | 7.73% | |||
| Lipper Small‑Cap Core Funds Classification Average |
6.04% | 12.04% | 7.23% | |||
Fund Statistics (as of June 30, 2025)
| Fund net assets |
$ | 91,129,365 | ||
| Total number of portfolio holdings |
65 | |||
| Portfolio turnover (%) |
64% | |||
| Total management fees paid for the year |
$ | 756,111 | ||

How has the Fund changed?
For more complete information, you may review the Fund’s next prospectus, which is expected to be available by October 31, 2025 at https://www.nuveen.com/en‑us/mutual‑funds/prospectuses or upon request at (800) 257‑8787.
For more complete information, you may review the Fund’s next prospectus, which is expected to be available by October 31, 2025 at https://www.nuveen.com/en‑us/mutual‑funds/prospectuses or upon request at (800) 257‑8787.
This report describes changes to the Fund that occurred during the reporting period.
What were the Fund costs for the last year? (based on a hypothetical $10,000 investment)
| Cost of a $10,000 investment |
Costs paid as a percentage of $10,000 investment* | |||
| Class I Shares |
$111 | 1.06% | ||
* Annualized for period less than one year.
How did the Fund perform last year? What affected the Fund’s performance?
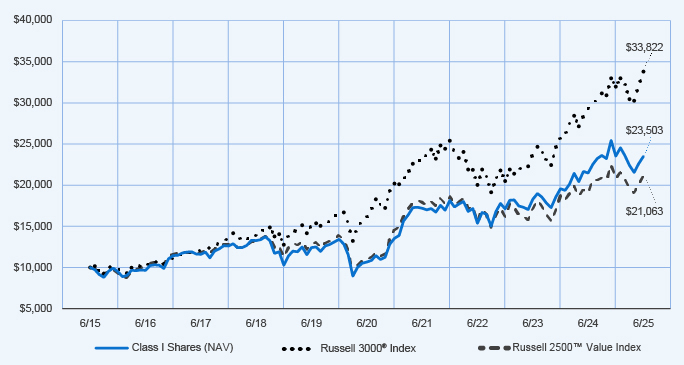
| Performance Highlights • The Nuveen Small/Mid Cap Value Fund returned 9.45% for Class I Shares at net asset value (NAV) for the 12 months ended June 30, 2025. The Fund underperformed the Russell 2500 Value Index, which returned 10.47%. • Top contributors to relative performance • Security selection in the health care sector, led by an out‑of‑benchmark position in ADMA Biologics, Inc. • Overweight to Curtiss-Wright Corporation. • Security selection in the information technology sector, led by an out‑of‑benchmark position in Seagate Technology Holdings PLC. • Top detractors from relative performance • Security selection in the consumer discretionary sector, including overweights to Wayfair, Inc., Advance Auto Parts, Inc. and Under Armour, Inc. • Security selection in the materials sector, including an overweight to FMC Corporation. • Security selection in the financials sector, including Robinhood Markets, Inc, a security not held by the fund. |
Average Annual Total Returns
| 1‑Year | 5‑Year | 10‑Year | ||||
| Class I Shares at NAV |
9.45% | 17.08% | 8.92% | |||
| Russell 3000® Index |
15.30% | 15.96% | 12.96% | |||
| Russell 2500™ Value Index |
10.47% | 13.96% | 7.73% | |||
| Lipper Small‑Cap Core Funds Classification Average |
6.04% | 12.04% | 7.23% | |||
Fund Statistics (as of June 30, 2025)
| Fund net assets |
$91,129,365 | |||
| Total number of portfolio holdings |
65 | |||
| Portfolio turnover (%) |
64% | |||
| Total management fees paid for the year |
$ 756,111 | |||

How has the Fund changed?
For more complete information, you may review the Fund’s next prospectus, which is expected to be available by October 31, 2025 at https://www.nuveen.com/en‑us/mutual‑funds/prospectuses or upon request at (800) 257‑8787.
For more complete information, you may review the Fund’s next prospectus, which is expected to be available by October 31, 2025 at https://www.nuveen.com/en‑us/mutual‑funds/prospectuses or upon request at (800) 257‑8787.
This report describes changes to the Fund that occurred during the reporting period.
What were the Fund costs for the last year? (based on a hypothetical $10,000 investment)
| Cost of a $10,000 investment |
Costs paid as a percentage of $10,000 investment* | |||
| Class R6 Shares |
$94 | 0.90% | ||
* Annualized for period less than one year.
How did the Fund perform last year? What affected the Fund’s performance?
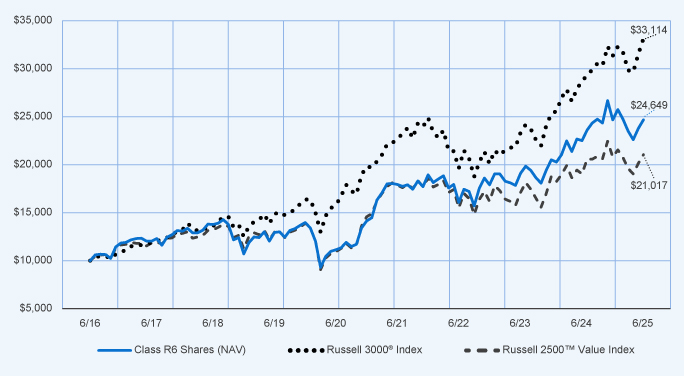
| Performance Highlights • The Nuveen Small/Mid Cap Value Fund returned 9.64% for Class R6 Shares at net asset value (NAV) for the 12 months ended June 30, 2025. The Fund underperformed the Russell 2500 Value Index, which returned 10.47%. • Top contributors to relative performance • Security selection in the health care sector, led by an out‑of‑benchmark position in ADMA Biologics, Inc. • Overweight to Curtiss-Wright Corporation. • Security selection in the information technology sector, led by an out‑of‑benchmark position in Seagate Technology Holdings PLC. • Top detractors from relative performance • Security selection in the consumer discretionary sector, including overweights to Wayfair, Inc., Advance Auto Parts, Inc. and Under Armour, Inc. • Security selection in the materials sector, including an overweight to FMC Corporation. • Security selection in the financials sector, including Robinhood Markets, Inc, a security not held by the fund. |
Average Annual Total Returns
| 1‑Year | 5‑Year | Since Inception (6/30/16) | ||||
| Class R6 Shares at NAV |
9.64% | 17.26% | 10.54% | |||
| Russell 3000® Index |
15.30% | 15.96% | 14.23% | |||
| Russell 2500™ Value Index |
10.47% | 13.96% | 8.60% | |||
| Lipper Small‑Cap Core Funds Classification Average |
6.04% | 12.04% | 8.59% | |||
Fund Statistics (as of June 30, 2025)
| Fund net assets |
$ | 91,129,365 | ||
| Total number of portfolio holdings |
65 | |||
| Portfolio turnover (%) |
64% | |||
| Total management fees paid for the year |
$ | 756,111 | ||
How has the Fund changed?
For more complete information, you may review the Fund’s next prospectus, which is expected to be available by October 31, 2025 at https://www.nuveen.com/en‑us/mutual‑funds/prospectuses or upon request at (800) 257‑8787.
For more complete information, you may review the Fund’s next prospectus, which is expected to be available by October 31, 2025 at https://www.nuveen.com/en‑us/mutual‑funds/prospectuses or upon request at (800) 257‑8787.
This report describes changes to the Fund that occurred during the reporting period.
What were the Fund costs for the last year? (based on a hypothetical $10,000 investment)
| Cost of a $10,000 investment |
Costs paid as a percentage of $10,000 investment* | |||
| Class A Shares |
$122 | 1.11% | ||
* Annualized for period less than one year.
How did the Fund perform last year? What affected the Fund’s performance?
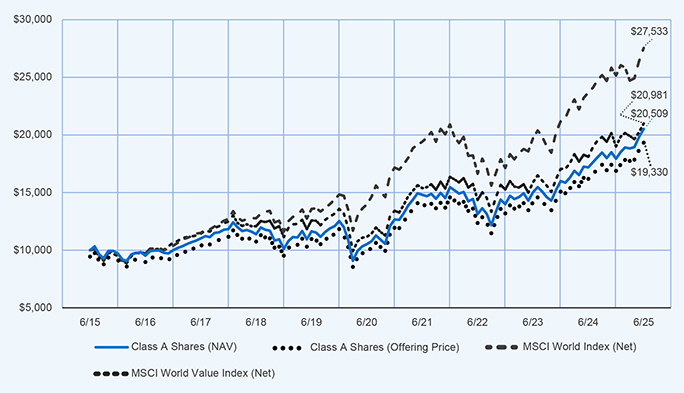
| Performance Highlights • The Nuveen Global Equity Income Fund returned 19.41% for Class A Shares at net asset value (NAV) for the 12 months ended June 30, 2025. The Fund outperformed the MSCI World Value (Net), which returned 15.94%. • Top contributors to relative performance • Security selection in the information technology sector, led by an overweight to Broadcom Inc. • Overweight to AT&T Inc. • Security selection and an overweight allocation to the financials sector, led by an overweight to Prudential plc. • Top detractors from relative performance • Overweight to Humana Inc. • Overweight to Elevance Health, Inc. • Out‑of‑benchmark position in Samsung Electronics Co. Ltd. Preferred Stock. |
Average Annual Total Returns
| 1‑Year | 5‑Year | 10‑Year | ||||
| Class A Shares at NAV (excluding maximum sales charge) |
19.41% | 14.26% | 7.45% | |||
| Class A Shares at maximum sales charge (Offering Price) |
12.54% | 12.91% | 6.81% | |||
| MSCI World Index (Net) |
16.26% | 14.55% | 10.66% | |||
| MSCI World Value Index (Net) |
15.94% | 13.47% | 7.69% | |||
| Lipper Global Equity Income Funds Classification Average |
16.60% | 11.58% | 7.24% | |||
Fund Statistics (as of June 30, 2025)
| Fund net assets |
$ | 142,586,846 | ||
| Total number of portfolio holdings |
59 | |||
| Portfolio turnover (%) |
30% | |||
| Total management fees paid for the year |
$ | 952,036 | ||


How has the Fund changed?
For more complete information, you may review the Fund’s next prospectus, which is expected to be available by October 31, 2025 at https://www.nuveen.com/en‑us/mutual‑funds/prospectuses or upon request at (800) 257‑8787.
For more complete information, you may review the Fund’s next prospectus, which is expected to be available by October 31, 2025 at https://www.nuveen.com/en‑us/mutual‑funds/prospectuses or upon request at (800) 257‑8787.
This report describes changes to the Fund that occurred during the reporting period.
What were the Fund costs for the last year? (based on a hypothetical $10,000 investment)
| Cost of a $10,000 investment |
Costs paid as a percentage of $10,000 investment* | |||
| Class C Shares |
$203 | 1.86% | ||
* Annualized for period less than one year.
How did the Fund perform last year? What affected the Fund’s performance?
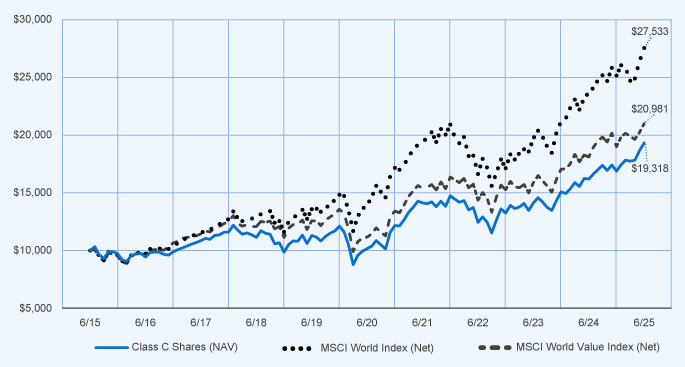
| Performance Highlights • The Nuveen Global Equity Income Fund returned 18.52% for Class C Shares at net asset value (NAV) for the 12 months ended June 30, 2025. The Fund outperformed the MSCI World Value (Net), which returned 15.94%. • Top contributors to relative performance • Security selection in the information technology sector, led by an overweight to Broadcom Inc. • Overweight to AT&T Inc. • Security selection and an overweight allocation to the financials sector, led by an overweight to Prudential plc. • Top detractors from relative performance • Overweight to Humana Inc. • Overweight to Elevance Health, Inc. • Out‑of‑benchmark position in Samsung Electronics Co. Ltd. Preferred Stock. |
Average Annual Total Returns
| 1-Year | 5-Year | 10-Year | ||||
| Class C Shares at NAV (excluding maximum sales charge) |
18.52% | 13.40% | 6.81% | |||
| MSCI World Index (Net) |
16.26% | 14.55% | 10.66% | |||
| MSCI World Value Index (Net) |
15.94% | 13.47% | 7.69% | |||
| Lipper Global Equity Income Funds Classification Average |
16.60% | 11.58% | 7.24% | |||
Fund Statistics (as of June 30, 2025)
| Fund net assets |
$ | 142,586,846 | ||
| Total number of portfolio holdings |
59 | |||
| Portfolio turnover (%) |
30% | |||
| Total management fees paid for the year |
$ | 952,036 | ||
How has the Fund changed?
For more complete information, you may review the Fund’s next prospectus, which is expected to be available by October 31, 2025 at https://www.nuveen.com/en‑us/mutual‑funds/prospectuses or upon request at (800) 257‑8787.
For more complete information, you may review the Fund’s next prospectus, which is expected to be available by October 31, 2025 at https://www.nuveen.com/en‑us/mutual‑funds/prospectuses or upon request at (800) 257‑8787.
This report describes changes to the Fund that occurred during the reporting period.
What were the Fund costs for the last year? (based on a hypothetical $10,000 investment)
| Cost of a $10,000 investment |
Costs paid as a percentage of $10,000 investment* | |||
| Class I Shares |
$94 | 0.86% | ||
* Annualized for period less than one year.
How did the Fund perform last year? What affected the Fund’s performance?
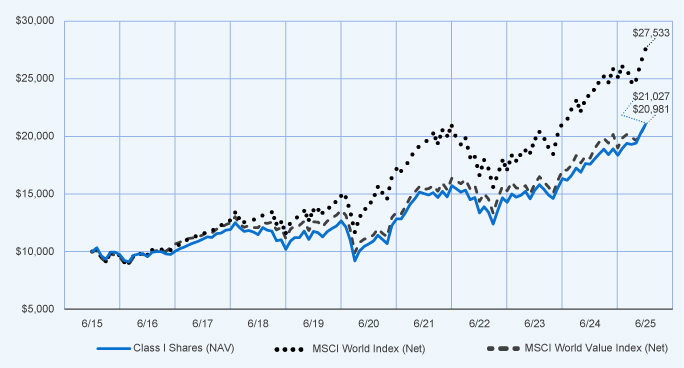
| Performance Highlights • The Nuveen Global Equity Income Fund returned 19.73% for Class I Shares at net asset value (NAV) for the 12 months ended June 30, 2025. The Fund outperformed the MSCI World Value (Net), which returned 15.94%. • Top contributors to relative performance • Security selection in the information technology sector, led by an overweight to Broadcom Inc. • Overweight to AT&T Inc. • Security selection and an overweight allocation to the financials sector, led by an overweight to Prudential plc. • Top detractors from relative performance • Overweight to Humana Inc. • Overweight to Elevance Health, Inc. • Out‑of‑benchmark position in Samsung Electronics Co. Ltd. Preferred Stock. |
Average Annual Total Returns
| 1-Year | 5-Year | 10-Year | ||||
| Class I Shares at NAV |
19.73% | 14.54% | 7.72% | |||
| MSCI World Index (Net) |
16.26% | 14.55% | 10.66% | |||
| MSCI World Value Index (Net) |
15.94% | 13.47% | 7.69% | |||
| Lipper Global Equity Income Funds Classification Average |
16.60% | 11.58% | 7.24% | |||
Fund Statistics (as of June 30, 2025)
| Fund net assets |
$ | 142,586,846 | ||
| Total number of portfolio holdings |
59 | |||
| Portfolio turnover (%) |
30% | |||
| Total management fees paid for the year |
$ | 952,036 | ||

How has the Fund changed?
For more complete information, you may review the Fund’s next prospectus, which is expected to be available by October 31, 2025 at https://www.nuveen.com/en‑us/mutual‑funds/prospectuses or upon request at (800) 257‑8787.
For more complete information, you may review the Fund’s next prospectus, which is expected to be available by October 31, 2025 at https://www.nuveen.com/en‑us/mutual‑funds/prospectuses or upon request at (800) 257‑8787.
| [1] | Annualized for period less than one year. |
| [2] | Annualized for period less than one year. |
| [3] | Annualized for period less than one year. |
| [4] | Annualized for period less than one year. |
| [5] | Annualized for period less than one year. |
| [6] | Annualized for period less than one year. |
| [7] | Annualized for period less than one year. |
| [8] | Annualized for period less than one year. |
| [9] | Annualized for period less than one year. |
| [10] | Annualized for period less than one year. |
| [11] | Annualized for period less than one year. |
| [12] | Annualized for period less than one year. |
| [13] | Annualized for period less than one year. |
| [14] | Annualized for period less than one year. |
| [15] | Annualized for period less than one year. |
| [16] | Annualized for period less than one year. |
| [17] | Annualized for period less than one year. |