Shareholder Report
Jun. 30, 2025
USD ($)
Holding
Shareholder Report |
6 Months Ended | ||||||||||||||||||||||||||||||||||||||||||||||||||||||||||||
|---|---|---|---|---|---|---|---|---|---|---|---|---|---|---|---|---|---|---|---|---|---|---|---|---|---|---|---|---|---|---|---|---|---|---|---|---|---|---|---|---|---|---|---|---|---|---|---|---|---|---|---|---|---|---|---|---|---|---|---|---|---|
|
Jun. 30, 2025
USD ($)
Holding
| |||||||||||||||||||||||||||||||||||||||||||||||||||||||||||||
| Shareholder Report [Line Items] | |||||||||||||||||||||||||||||||||||||||||||||||||||||||||||||
| Document Type | N-CSRS | ||||||||||||||||||||||||||||||||||||||||||||||||||||||||||||
| Amendment Flag | false | ||||||||||||||||||||||||||||||||||||||||||||||||||||||||||||
| Registrant Name | Advisors Preferred Trust | ||||||||||||||||||||||||||||||||||||||||||||||||||||||||||||
| Entity Central Index Key | 0001556505 | ||||||||||||||||||||||||||||||||||||||||||||||||||||||||||||
| Entity Investment Company Type | N-1A | ||||||||||||||||||||||||||||||||||||||||||||||||||||||||||||
| Document Period End Date | Jun. 30, 2025 | ||||||||||||||||||||||||||||||||||||||||||||||||||||||||||||
| C000127985 | |||||||||||||||||||||||||||||||||||||||||||||||||||||||||||||
| Shareholder Report [Line Items] | |||||||||||||||||||||||||||||||||||||||||||||||||||||||||||||
| Fund Name | OnTrack Core Fund | ||||||||||||||||||||||||||||||||||||||||||||||||||||||||||||
| Trading Symbol | OTRGX | ||||||||||||||||||||||||||||||||||||||||||||||||||||||||||||
| Annual or Semi-Annual Statement [Text Block] | This semi-annual shareholder report contains important information about OnTrack Core Fund for the period of January 1, 2025 to June 30, 2025. | ||||||||||||||||||||||||||||||||||||||||||||||||||||||||||||
| Shareholder Report Annual or Semi-Annual | Semi-Annual Shareholder Report | ||||||||||||||||||||||||||||||||||||||||||||||||||||||||||||
| Additional Information [Text Block] | You can find additional information about the Fund at www.ontrackcore.com/funddocuments. You can also request this information by contacting us at (855) 747-9555. | ||||||||||||||||||||||||||||||||||||||||||||||||||||||||||||
| Additional Information Phone Number | (855) 747-9555 | ||||||||||||||||||||||||||||||||||||||||||||||||||||||||||||
| Additional Information Website | www.ontrackcore.com/funddocuments | ||||||||||||||||||||||||||||||||||||||||||||||||||||||||||||
| Expenses [Text Block] | What were the Fund’s costs for the last six months?(based on a hypothetical $10,000 investment)
|
||||||||||||||||||||||||||||||||||||||||||||||||||||||||||||
| Expenses Paid, Amount | $ 138 | ||||||||||||||||||||||||||||||||||||||||||||||||||||||||||||
| Expense Ratio, Percent | 2.77% | ||||||||||||||||||||||||||||||||||||||||||||||||||||||||||||
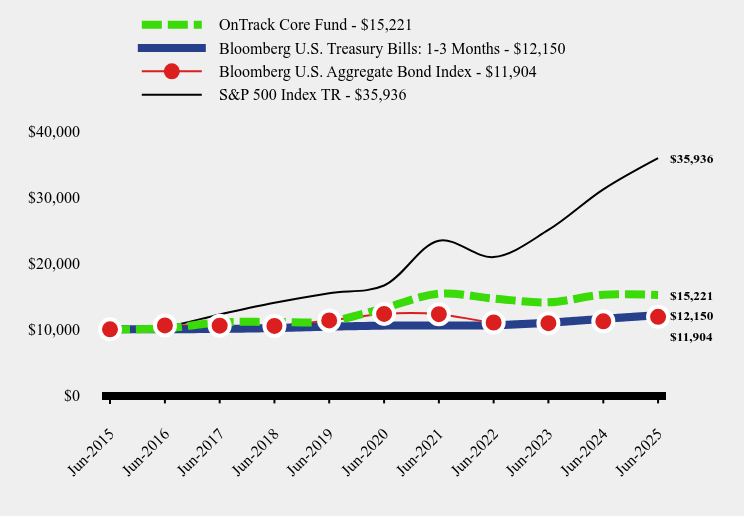
| Factors Affecting Performance [Text Block] | How did the Fund perform during the reporting period?The Fund rose by 0.97% for the six months ending June 30, 2025. The Bloomberg 1-3 Months U.S. Treasury Bill index, the Fund’s primary benchmark gained 2.13% for the same period.
Strategy
The OnTrack Core Fund seeks total return while keeping the Fund’s volatility and downside risk below that of major equity market indices. The portfolio managers use a flexible approach that emphasizes capital preservation but allows them to adopt a less conservative posture and to increase emphasis on capital appreciation when they believe additional risk is warranted by favorable market conditions.
Techniques
Treasury yields declined early in the year as investors anticipated Federal Reserve rate cuts beginning in March. However, inflation eased more slowly than expected, prompting the Fed to temper expectations for an early cut. Bond yields moved higher, small-cap equities weakened, high-yield bond momentum slowed, and the S&P 500 Index briefly paused.
Elevated interest rates slowed the economy more than expected in the first quarter of 2024. Entering April, the Fund was fully invested and leveraged in bond and income funds, preferred stock funds, and a limited equity exposure. Trade policy uncertainty and tariff concerns pressured both stocks and bonds in April, prompting position reductions in line with our risk-managed approach.
The S&P 500 rebounded in May to reach new highs, while the Russell 2000 recovered most April losses but fell short of new highs. As markets improved, the Fund returned to fully invested, leveraged positions in low-volatility bond and income funds. However, concerns over the inflationary impact of tariffs kept the Fed in a “higher-for-longer” stance, sustaining volatility.
In June, market breadth narrowed, reflected in the divergence between the capitalization-weighted and equal-weight S&P 500 Indexes. Unemployment edged higher, weekly jobless claims reached their highest since August, and inflation ticked lower. Geopolitical tensions—including wars in Ukraine and Gaza, and U.S./Israeli air strikes in Iran—added to uncertainty.
Despite volatility, anticipation of the Fed’s first rate cut should support bonds, particularly Treasuries, municipal bonds, and investment-grade corporates. The Fund remains fully invested and leveraged in bond and income mutual funds and preferred stock funds, with readiness to reduce exposure if conditions warrant.
The second half of 2025 will be driven by Fed policy, inflation trends, and economic resilience. Rate cuts could favor select bond groups. Geopolitical risks and trade tensions remain headwinds. We will emphasize flexibility, maintaining core income holdings while adjusting allocations as market conditions evolve.
|
||||||||||||||||||||||||||||||||||||||||||||||||||||||||||||
| Performance Past Does Not Indicate Future [Text] | The Fund's past performance is not a good predictor of how the Fund will perform in the future. | ||||||||||||||||||||||||||||||||||||||||||||||||||||||||||||
| Line Graph [Table Text Block] |
|
||||||||||||||||||||||||||||||||||||||||||||||||||||||||||||
| Average Annual Return [Table Text Block] |
|
||||||||||||||||||||||||||||||||||||||||||||||||||||||||||||
| No Deduction of Taxes [Text Block] | The graph and table do not reflect the deduction of taxes that a shareholder would pay on fund distributions or redemption of fund shares. | ||||||||||||||||||||||||||||||||||||||||||||||||||||||||||||
| AssetsNet | $ 24,346,866 | ||||||||||||||||||||||||||||||||||||||||||||||||||||||||||||
| Holdings Count | Holding | 18 | ||||||||||||||||||||||||||||||||||||||||||||||||||||||||||||
| Advisory Fees Paid, Amount | $ 310,089 | ||||||||||||||||||||||||||||||||||||||||||||||||||||||||||||
| InvestmentCompanyPortfolioTurnover | 277.00% | ||||||||||||||||||||||||||||||||||||||||||||||||||||||||||||
| Additional Fund Statistics [Text Block] | Fund Statistics
|
||||||||||||||||||||||||||||||||||||||||||||||||||||||||||||
| Holdings [Text Block] | Asset Weighting (% of total investments)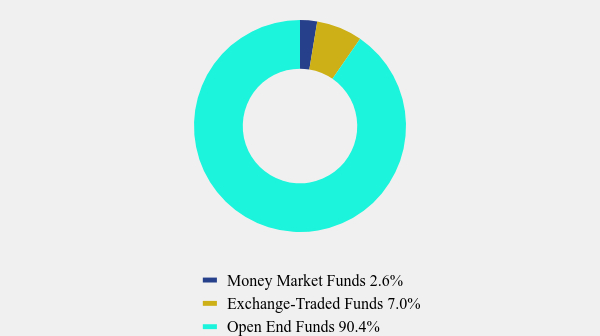
Security Type Weighting (% of total (including notional) exposure)
|
||||||||||||||||||||||||||||||||||||||||||||||||||||||||||||
| Largest Holdings [Text Block] | Top 10 Holdings (% of net assets)
|
||||||||||||||||||||||||||||||||||||||||||||||||||||||||||||
| Material Fund Change [Text Block] | Material Fund ChangesNo material changes occurred during the period ended June 30, 2025. |
||||||||||||||||||||||||||||||||||||||||||||||||||||||||||||
| Updated Prospectus Web Address | www.ontrackcore.com/funddocuments | ||||||||||||||||||||||||||||||||||||||||||||||||||||||||||||
| C000121122 | |||||||||||||||||||||||||||||||||||||||||||||||||||||||||||||
| Shareholder Report [Line Items] | |||||||||||||||||||||||||||||||||||||||||||||||||||||||||||||
| Fund Name | OnTrack Core Fund | ||||||||||||||||||||||||||||||||||||||||||||||||||||||||||||
| Trading Symbol | OTRFX | ||||||||||||||||||||||||||||||||||||||||||||||||||||||||||||
| Annual or Semi-Annual Statement [Text Block] | This semi-annual shareholder report contains important information about OnTrack Core Fund for the period of January 1, 2025 to June 30, 2025. | ||||||||||||||||||||||||||||||||||||||||||||||||||||||||||||
| Shareholder Report Annual or Semi-Annual | Semi-Annual Shareholder Report | ||||||||||||||||||||||||||||||||||||||||||||||||||||||||||||
| Additional Information [Text Block] | You can find additional information about the Fund at www.ontrackcore.com/funddocuments. You can also request this information by contacting us at (855) 747-9555. | ||||||||||||||||||||||||||||||||||||||||||||||||||||||||||||
| Additional Information Phone Number | (855) 747-9555 | ||||||||||||||||||||||||||||||||||||||||||||||||||||||||||||
| Additional Information Website | www.ontrackcore.com/funddocuments | ||||||||||||||||||||||||||||||||||||||||||||||||||||||||||||
| Expenses [Text Block] | What were the Fund’s costs for the last six months?(based on a hypothetical $10,000 investment)
|
||||||||||||||||||||||||||||||||||||||||||||||||||||||||||||
| Expenses Paid, Amount | $ 130 | ||||||||||||||||||||||||||||||||||||||||||||||||||||||||||||
| Expense Ratio, Percent | 2.60% | ||||||||||||||||||||||||||||||||||||||||||||||||||||||||||||
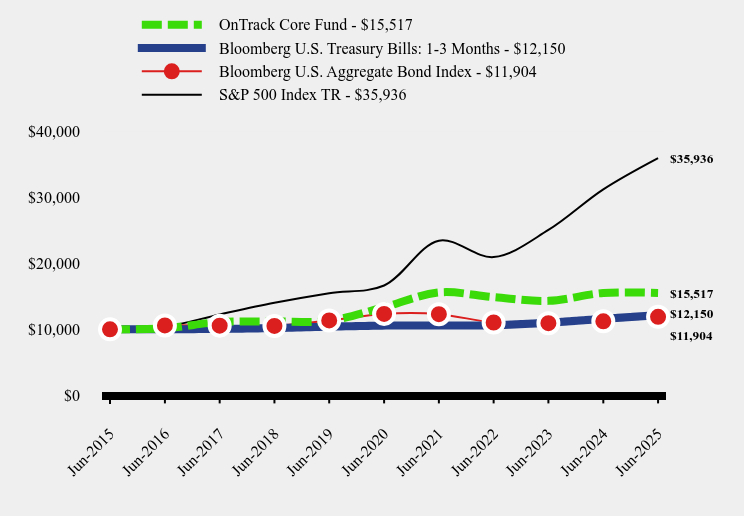
| Factors Affecting Performance [Text Block] | How did the Fund perform during the reporting period?The Fund rose by 1.06% for the six months ending June 30, 2025. The Bloomberg 1-3 Months U.S. Treasury Bill index, the Fund’s primary benchmark gained 2.13% for the same period.
Strategy
The OnTrack Core Fund seeks total return while keeping the Fund’s volatility and downside risk below that of major equity market indices. The portfolio managers use a flexible approach that emphasizes capital preservation but allows them to adopt a less conservative posture and to increase emphasis on capital appreciation when they believe additional risk is warranted by favorable market conditions.
Techniques
Treasury yields declined early in the year as investors anticipated Federal Reserve rate cuts beginning in March. However, inflation eased more slowly than expected, prompting the Fed to temper expectations for an early cut. Bond yields moved higher, small-cap equities weakened, high-yield bond momentum slowed, and the S&P 500 Index briefly paused.
Elevated interest rates slowed the economy more than expected in the first quarter of 2024. Entering April, the Fund was fully invested and leveraged in bond and income funds, preferred stock funds, and a limited equity exposure. Trade policy uncertainty and tariff concerns pressured both stocks and bonds in April, prompting position reductions in line with our risk-managed approach.
The S&P 500 rebounded in May to reach new highs, while the Russell 2000 recovered most April losses but fell short of new highs. As markets improved, the Fund returned to fully invested, leveraged positions in low-volatility bond and income funds. However, concerns over the inflationary impact of tariffs kept the Fed in a “higher-for-longer” stance, sustaining volatility.
In June, market breadth narrowed, reflected in the divergence between the capitalization-weighted and equal-weight S&P 500 Indexes. Unemployment edged higher, weekly jobless claims reached their highest since August, and inflation ticked lower. Geopolitical tensions—including wars in Ukraine and Gaza, and U.S./Israeli air strikes in Iran—added to uncertainty.
Despite volatility, anticipation of the Fed’s first rate cut should support bonds, particularly Treasuries, municipal bonds, and investment-grade corporates. The Fund remains fully invested and leveraged in bond and income mutual funds and preferred stock funds, with readiness to reduce exposure if conditions warrant.
The second half of 2025 will be driven by Fed policy, inflation trends, and economic resilience. Rate cuts could favor select bond groups. Geopolitical risks and trade tensions remain headwinds. We will emphasize flexibility, maintaining core income holdings while adjusting allocations as market conditions evolve.
|
||||||||||||||||||||||||||||||||||||||||||||||||||||||||||||
| Performance Past Does Not Indicate Future [Text] | The Fund's past performance is not a good predictor of how the Fund will perform in the future. | ||||||||||||||||||||||||||||||||||||||||||||||||||||||||||||
| Line Graph [Table Text Block] |
|
||||||||||||||||||||||||||||||||||||||||||||||||||||||||||||
| Average Annual Return [Table Text Block] |
|
||||||||||||||||||||||||||||||||||||||||||||||||||||||||||||
| No Deduction of Taxes [Text Block] | The graph and table do not reflect the deduction of taxes that a shareholder would pay on fund distributions or redemption of fund shares. | ||||||||||||||||||||||||||||||||||||||||||||||||||||||||||||
| AssetsNet | $ 24,346,866 | ||||||||||||||||||||||||||||||||||||||||||||||||||||||||||||
| Holdings Count | Holding | 18 | ||||||||||||||||||||||||||||||||||||||||||||||||||||||||||||
| Advisory Fees Paid, Amount | $ 310,089 | ||||||||||||||||||||||||||||||||||||||||||||||||||||||||||||
| InvestmentCompanyPortfolioTurnover | 277.00% | ||||||||||||||||||||||||||||||||||||||||||||||||||||||||||||
| Additional Fund Statistics [Text Block] | Fund Statistics
|
||||||||||||||||||||||||||||||||||||||||||||||||||||||||||||
| Holdings [Text Block] | Asset Weighting (% of total investments)
Security Type Weighting (% of total (including notional) exposure)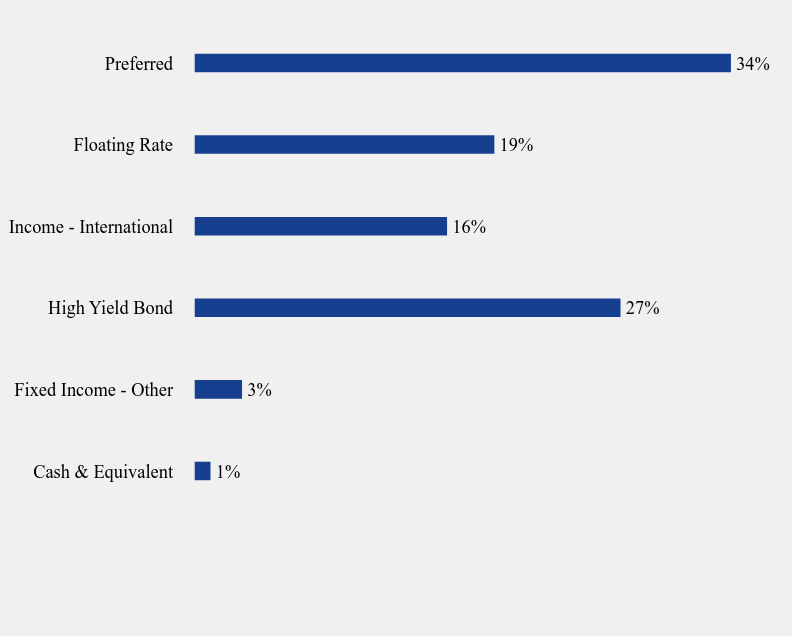
|
||||||||||||||||||||||||||||||||||||||||||||||||||||||||||||
| Largest Holdings [Text Block] | Top 10 Holdings (% of net assets)
|
||||||||||||||||||||||||||||||||||||||||||||||||||||||||||||
| Material Fund Change [Text Block] | Material Fund ChangesNo material changes occurred during the period ended June 30, 2025. |
||||||||||||||||||||||||||||||||||||||||||||||||||||||||||||
| Updated Prospectus Web Address | www.ontrackcore.com/funddocuments |
| X | ||||||||||
- Definition Boolean flag that is true when the XBRL content amends previously-filed or accepted submission. No definition available.
|
| X | ||||||||||
- Definition For the EDGAR submission types of Form 8-K: the date of the report, the date of the earliest event reported; for the EDGAR submission types of Form N-1A: the filing date; for all other submission types: the end of the reporting or transition period. The format of the date is YYYY-MM-DD. No definition available.
|
| X | ||||||||||
- Definition The type of document being provided (such as 10-K, 10-Q, 485BPOS, etc). The document type is limited to the same value as the supporting SEC submission type, or the word 'Other'. No definition available.
|
| X | ||||||||||
- Definition A unique 10-digit SEC-issued value to identify entities that have filed disclosures with the SEC. It is commonly abbreviated as CIK. Reference 1: http://www.xbrl.org/2003/role/presentationRef
|
| X | ||||||||||
- Definition One of: N-1A (Mutual Fund), N-1 (Open-End Separate Account with No Variable Annuities), N-2 (Closed-End Investment Company), N-3 (Separate Account Registered as Open-End Management Investment Company), N-4 (Variable Annuity UIT Separate Account), N-5 (Small Business Investment Company), N-6 (Variable Life UIT Separate Account), S-1 or S-3 (Face Amount Certificate Company), S-6 (UIT, Non-Insurance Product). Reference 1: http://www.xbrl.org/2003/role/presentationRef
|
| X | ||||||||||
- Definition The exact name of the entity filing the report as specified in its charter, which is required by forms filed with the SEC. Reference 1: http://www.xbrl.org/2003/role/presentationRef
|
| X | ||||||||||
- Definition Trading symbol of an instrument as listed on an exchange. No definition available.
|
| X | ||||||||||
- References Reference 1: http://www.xbrl.org/2003/role/presentationRef
|
| X | ||||||||||
- References Reference 1: http://www.xbrl.org/2003/role/presentationRef
|
| X | ||||||||||
- References Reference 1: http://www.xbrl.org/2003/role/presentationRef
|
| X | ||||||||||
- References Reference 1: http://www.xbrl.org/2003/role/presentationRef
|
| X | ||||||||||
- References Reference 1: http://www.xbrl.org/2003/role/presentationRef
|
| X | ||||||||||
- References Reference 1: http://www.xbrl.org/2003/role/presentationRef
|
| X | ||||||||||
- References Reference 1: http://www.xbrl.org/2003/role/presentationRef
|
| X | ||||||||||
- References Reference 1: http://www.xbrl.org/2003/role/presentationRef
|
| X | ||||||||||
- References Reference 1: http://www.xbrl.org/2003/role/presentationRef
|
| X | ||||||||||
- References Reference 1: http://www.xbrl.org/2003/role/presentationRef
|
| X | ||||||||||
- References Reference 1: http://www.xbrl.org/2003/role/presentationRef
|
| X | ||||||||||
- References Reference 1: http://www.xbrl.org/2003/role/presentationRef
|
| X | ||||||||||
- References Reference 1: http://www.xbrl.org/2003/role/presentationRef
|
| X | ||||||||||
- References Reference 1: http://www.xbrl.org/2003/role/presentationRef
|
| X | ||||||||||
- References Reference 1: http://www.xbrl.org/2003/role/presentationRef
|
| X | ||||||||||
- References Reference 1: http://www.xbrl.org/2003/role/presentationRef
|
| X | ||||||||||
- References Reference 1: http://www.xbrl.org/2003/role/presentationRef
|
| X | ||||||||||
- References Reference 1: http://www.xbrl.org/2003/role/presentationRef
|
| X | ||||||||||
- References Reference 1: http://www.xbrl.org/2003/role/presentationRef
|
| X | ||||||||||
- References Reference 1: http://www.xbrl.org/2003/role/presentationRef
|
| X | ||||||||||
- References Reference 1: http://www.xbrl.org/2003/role/presentationRef
|
| X | ||||||||||
- References Reference 1: http://www.xbrl.org/2003/role/presentationRef
|
| X | ||||||||||
- Definition Amount of net assets (liabilities). Reference 1: http://fasb.org/us-gaap/role/ref/legacyRef
|
| X | ||||||||||
- Definition Percentage of lesser of purchase or sale of portfolio securities to average value of portfolio securities owned. Reference 1: http://www.xbrl.org/2009/role/commonPracticeRef
|
| X | ||||||||||
- Details
|
| X | ||||||||||
- Details
|