Shareholder Report
|
12 Months Ended |
|
Jun. 30, 2025
USD ($)
Holding
|
|---|
| Shareholder Report [Line Items] |
|
| Document Type |
N-CSR
|
| Amendment Flag |
false
|
| Registrant Name |
Northern Lights Fund Trust
|
| Entity Central Index Key |
0001314414
|
| Entity Investment Company Type |
N-1A
|
| Document Period End Date |
Jun. 30, 2025
|
| C000250990 |
|
| Shareholder Report [Line Items] |
|
| Fund Name |
Ocean Park Diversified Income ETF
|
| Trading Symbol |
DUKZ
|
| Security Exchange Name |
NYSEArca
|
| Shareholder Report Annual or Semi-Annual |
Annual Shareholder Report
|
| Additional Information Phone Number |
844-727-1813
|
| Additional Information Website |
https://oceanparketfs.com/diversified-income-etf
|
| Expenses [Text Block] |
What were the Fund’s costs for the last year?(based on a hypothetical $10,000 investment) Fund Name | Costs of a $10,000 investment | Costs paid as a percentage of a $10,000 investment |
|---|
Ocean Park Diversified Income ETF | $77 | 0.78%Footnote Reference* |
|---|
* Annualized Had the Fund been open the full reporting period, expenses would be higher. |
| Expenses Paid, Amount |
$ 77
|
| Expense Ratio, Percent |
0.78%
|
| Performance Past Does Not Indicate Future [Text] |
The Fund's past performance is not a good predictor of how the Fund will perform in the future.
|
| Performance Inception Date |
Jul. 10, 2024
|
| No Deduction of Taxes [Text Block] |
The graph and table do not reflect the deduction of taxes that a shareholder would pay on fund distributions or redemption of fund shares.
|
| AssetsNet |
$ 12,229,787
|
| Holdings Count | Holding |
11
|
| Advisory Fees Paid, Amount |
$ 0
|
| InvestmentCompanyPortfolioTurnover |
269.00%
|
| Additional Fund Statistics [Text Block] |
- Net Assets$12,229,787
- Number of Portfolio Holdings11
- Advisory Fee (net of waivers)$0
- Portfolio Turnover269%
|
| Holdings [Text Block] |
Asset Weighting (% of total investments)Value | Value |
|---|
Exchange-Traded Funds | 100.0% |
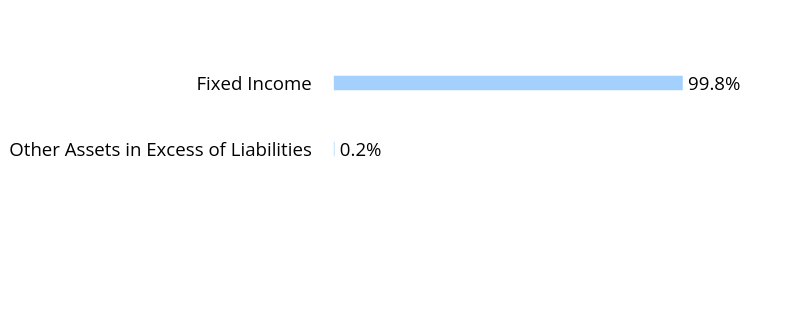
Sector Weighting (% of net assets)Value | Value |
|---|
Other Assets in Excess of Liabilities | 0.2% | Fixed Income | 99.8% |
|
| Largest Holdings [Text Block] |
Top 10 Holdings (% of net assets)Holding Name | % of Net Assets |
|---|
SPDR Bloomberg Convertible Securities ETF | 15.7% |
|---|
Vanguard Total International Bond ETF | 10.5% |
|---|
iShares MBS ETF | 10.0% |
|---|
iShares Preferred and Income Securities ETF | 10.0% |
|---|
iShares iBoxx $ Investment Grade Corporate Bond ETF | 10.0% |
|---|
Invesco Senior Loan ETF | 9.9% |
|---|
iShares Broad USD High Yield Corporate Bond ETF | 8.3% |
|---|
VanEck J. P. Morgan EM Local Currency Bond ETF | 8.0% |
|---|
Vanguard Emerging Markets Government Bond ETF | 7.6% |
|---|
VanEck High Yield Muni ETF | 4.9% |
|---|
|
| Material Fund Change [Text Block] |
No material changes occurred during the period ended June 30, 2025. |
| C000250991 |
|
| Shareholder Report [Line Items] |
|
| Fund Name |
Ocean Park Domestic ETF
|
| Trading Symbol |
DUKQ
|
| Security Exchange Name |
NYSEArca
|
| Shareholder Report Annual or Semi-Annual |
Annual Shareholder Report
|
| Additional Information Phone Number |
844-727-1813
|
| Additional Information Website |
https://oceanparketfs.com/domestic-etf
|
| Expenses [Text Block] |
What were the Fund’s costs for the last year?(based on a hypothetical $10,000 investment) Fund Name | Costs of a $10,000 investment | Costs paid as a percentage of a $10,000 investment |
|---|
Ocean Park Domestic ETF | $87 | 0.88%Footnote Reference* |
|---|
* Annualized Had the Fund been open the full reporting period, expenses would be higher. |
| Expenses Paid, Amount |
$ 87
|
| Expense Ratio, Percent |
0.88%
|
| Performance Inception Date |
Jul. 10, 2024
|
| AssetsNet |
$ 14,159,301
|
| Holdings Count | Holding |
12
|
| Advisory Fees Paid, Amount |
$ 0
|
| InvestmentCompanyPortfolioTurnover |
321.00%
|
| Additional Fund Statistics [Text Block] |
- Net Assets$14,159,301
- Number of Portfolio Holdings12
- Advisory Fee (net of waivers)$0
- Portfolio Turnover321%
|
| Holdings [Text Block] |
Asset Weighting (% of total investments)Value | Value |
|---|
Exchange-Traded Funds | 100.0% |
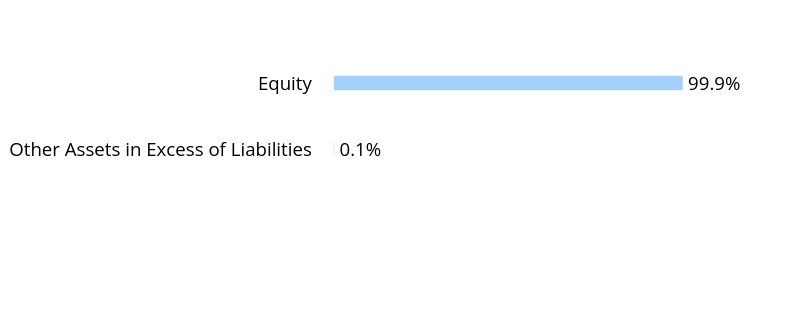
Sector Weighting (% of net assets)Value | Value |
|---|
Other Assets in Excess of Liabilities | 0.1% | Equity | 99.9% |
|
| Largest Holdings [Text Block] |
Top 10 Holdings (% of net assets)Holding Name | % of Net Assets |
|---|
iShares Core S&P 500 ETF | 25.2% |
|---|
Invesco Nasdaq 100 ETF | 20.7% |
|---|
Invesco S&P 500 Equal Weight ETF | 9.8% |
|---|
iShares Core S&P Mid-Cap ETF | 9.5% |
|---|
Invesco S&P 500 Momentum ETF | 5.3% |
|---|
Vanguard Mid-Cap Growth ETF | 5.1% |
|---|
iShares Core S&P Small-Cap ETF | 4.9% |
|---|
iShares Select Dividend ETF | 4.9% |
|---|
Vanguard Mid-Cap Value ETF | 4.8% |
|---|
Pacer US Cash Cows 100 ETF | 4.8% |
|---|
|
| Material Fund Change [Text Block] |
No material changes occurred during the period ended June 30, 2025. |
| C000250992 |
|
| Shareholder Report [Line Items] |
|
| Fund Name |
Ocean Park High Income ETF
|
| Trading Symbol |
DUKH
|
| Security Exchange Name |
NASDAQ
|
| Shareholder Report Annual or Semi-Annual |
Annual Shareholder Report
|
| Additional Information Phone Number |
844-727-1813
|
| Additional Information Website |
https://oceanparketfs.com/high-income-etf
|
| Expenses [Text Block] |
What were the Fund’s costs for the last year?(based on a hypothetical $10,000 investment) Fund Name | Costs of a $10,000 investment | Costs paid as a percentage of a $10,000 investment |
|---|
Ocean Park High Income ETF | $77 | 0.78%Footnote Reference* |
|---|
* Annualized Had the Fund been open the full reporting period, expenses would be higher. |
| Expenses Paid, Amount |
$ 77
|
| Expense Ratio, Percent |
0.78%
|
| Performance Past Does Not Indicate Future [Text] |
The Fund's past performance is not a good predictor of how the Fund will perform in the future.
|
| Performance Inception Date |
Jul. 10, 2024
|
| No Deduction of Taxes [Text Block] |
The graph and table do not reflect the deduction of taxes that a shareholder would pay on fund distributions or redemption of fund shares.
|
| AssetsNet |
$ 6,821,771
|
| Holdings Count | Holding |
6
|
| Advisory Fees Paid, Amount |
$ 0
|
| InvestmentCompanyPortfolioTurnover |
402.00%
|
| Additional Fund Statistics [Text Block] |
- Net Assets$6,821,771
- Number of Portfolio Holdings6
- Advisory Fee (net of waivers)$0
- Portfolio Turnover402%
|
| Holdings [Text Block] |
Asset Weighting (% of total investments)Value | Value |
|---|
Exchange-Traded Funds | 100.0% |
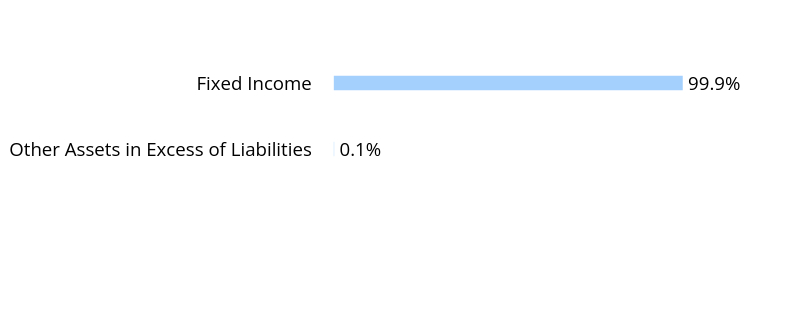
Sector Weighting (% of net assets)Value | Value |
|---|
Other Assets in Excess of Liabilities | 0.1% | Fixed Income | 99.9% |
|
| Largest Holdings [Text Block] |
Top 10 Holdings (% of net assets)Holding Name | % of Net Assets |
|---|
iShares Broad USD High Yield Corporate Bond ETF | 39.5% |
|---|
iShares Preferred and Income Securities ETF | 19.9% |
|---|
SPDR Blackstone Senior Loan ETF | 19.9% |
|---|
VanEck J. P. Morgan EM Local Currency Bond ETF | 8.1% |
|---|
Vanguard Emerging Markets Government Bond ETF | 7.5% |
|---|
VanEck High Yield Muni ETF | 5.0% |
|---|
|
| Material Fund Change [Text Block] |
No material changes occurred during the period ended June 30, 2025. |
| C000250993 |
|
| Shareholder Report [Line Items] |
|
| Fund Name |
Ocean Park International ETF
|
| Trading Symbol |
DUKX
|
| Security Exchange Name |
NASDAQ
|
| Shareholder Report Annual or Semi-Annual |
Annual Shareholder Report
|
| Additional Information Phone Number |
844-727-1813
|
| Additional Information Website |
https://oceanparketfs.com/international-etf
|
| Expenses [Text Block] |
What were the Fund’s costs for the last year?(based on a hypothetical $10,000 investment) Fund Name | Costs of a $10,000 investment | Costs paid as a percentage of a $10,000 investment |
|---|
Ocean Park International ETF | $85 | 0.88%Footnote Reference* |
|---|
* Annualized Had the Fund been open the full reporting period, expenses would be higher. |
| Expenses Paid, Amount |
$ 85
|
| Expense Ratio, Percent |
0.88%
|
| Performance Inception Date |
Jul. 10, 2024
|
| AssetsNet |
$ 2,630,360
|
| Holdings Count | Holding |
12
|
| Advisory Fees Paid, Amount |
$ 0
|
| InvestmentCompanyPortfolioTurnover |
356.00%
|
| Additional Fund Statistics [Text Block] |
- Net Assets$2,630,360
- Number of Portfolio Holdings12
- Advisory Fee (net of waivers)$0
- Portfolio Turnover356%
|
| Holdings [Text Block] |
Asset Weighting (% of total investments)Value | Value |
|---|
Exchange-Traded Funds | 100.0% |
Sector Weighting (% of net assets)Value | Value |
|---|
Other Assets in Excess of Liabilities | 0.2% | Equity | 99.8% |
|
| Largest Holdings [Text Block] |
Top 10 Holdings (% of net assets)Holding Name | % of Net Assets |
|---|
Vanguard Total International Stock ETF | 39.8% |
|---|
SPDR Portfolio Emerging Markets ETF | 24.8% |
|---|
iShares MSCI EAFE Small-Cap ETF | 5.0% |
|---|
JPMorgan BetaBuilders Developed Asia Pacific-ex ETF | 5.0% |
|---|
iShares International Dividend Growth ETF | 4.9% |
|---|
iShares MSCI Emerging Markets Min Vol Factor ETF | 4.8% |
|---|
iShares MSCI South Korea ETF | 2.9% |
|---|
iShares MSCI Taiwan ETF | 2.8% |
|---|
iShares MSCI Australia ETF | 2.5% |
|---|
iShares MSCI Brazil ETF | 2.5% |
|---|
|
| Material Fund Change [Text Block] |
No material changes occurred during the period ended June 30, 2025. |