WHAT WERE THE HIT’S COSTS FOR THE PAST SIX MONTHS?
BASED ON A HYPOTHETICAL $10,000 INVESTMENT
The below table explains the costs that Participants would have paid within the reporting period.
| COSTS OF A $10,000 INVESTMENT | COSTS PAID AS A PERCENTAGE OF A $10,000 INVESTMENT1 | |
| AFL-CIO Housing Investment Trust | $15 | 0.30% |
| 1 | Expenses are equal to the HIT’s annualized six-month expense ratio of 0.30%, as of June 30, 2025 |
HOW DID THE HIT PERFORM DURING THE REPORTING PERIOD AND WHAT AFFECTED ITS PERFORMANCE?
The HIT ended the first half of 2025 with a gross return of 3.66% and a net return of 3.51%, compared to 4.02% for the Bloomberg US Aggregate Bond Index* (Bloomberg Aggregate or Benchmark). Lower interest rates and tighter asset spreads drove positive total returns for investment grade fixed income sectors over the past six months. As of June 30, 2025, the HIT offered a yield to worst2 of 5.04%, a 51-basis point yield advantage over the Bloomberg Aggregate, while also offering superior credit quality; 91% of the HIT’s portfolio was government/agency credit compared to only 72% for the Bloomberg Aggregate.
| CONTRIBUTORS | DETRACTORS |
 | HIT’s coupon advantage relative to the Benchmark |
| HIT’s underweight to Treasuries, the worst performing asset class in the Bloomberg Aggregate during the period |
 | HIT’s structural underweight to corporate bonds, the second-best performing asset class in the Benchmark on an excess return basis |
| HIT’s overweight to agency-insured multifamily mortgage-backed securities (MBS), as spreads widened to Treasuries |
FUND PERFORMANCE
The following graph compares the initial and subsequent account values at the end of each of the most recently completed 10 fiscal years of the HIT. It assumes a $50,000 initial investment at the beginning of the first fiscal year in the Benchmark. |
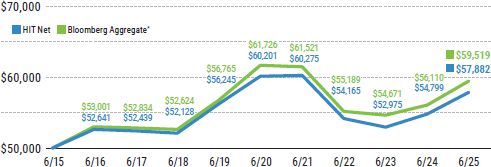 |
AVERAGE ANNUAL TOTAL RETURNS
| 1 YEAR | 5 YEAR | 10 YEAR | |
| HIT Gross | 5.95% | -0.46% | 1.84% |
| HIT Net | 5.62% | -0.78% | 1.47% |
| Bloomberg Aggregate* | 6.08% | -0.73% | 1.76% |
KEY FUND STATISTICS
| HIT’s Net Assets | $7,226,593,688 |
| Total Number of Portfolio Holdings | 896 |
| Portfolio Turnover Rate | 15.7% |
| Ratio of Net Investment Income to Average Net Assets | 3.65% |
| Effective Duration | 6.00 |
| Current Yield | 4.10% |
| Yield to Worst2 | 5.04% |
| Advisory Fee Paid | N/A |
| 2 | Yield-to-Worst is a measure of the lowest possible yield that can be received on a bond that fully operates within the terms of its contract without defaulting. It does not represent the performance yield. It is calculated by using the lower of either the yield to maturity or the yield to call on every possible call date. |
FUND HOLDINGS (AS OF JUNE 30, 2025)
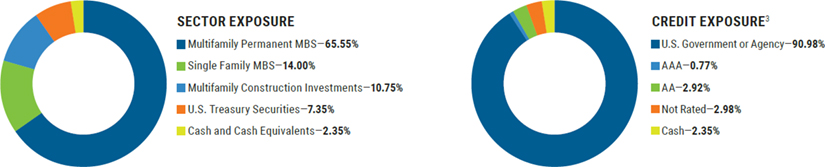
| 3 | U.S. Government or Agency includes holdings of government securities issued by the U.S. Department of Treasury and mortgage securities issued by a U.S. government-backed agency (e.g., Ginnie Mae) or U.S. government-sponsored enterprise (e.g., Freddie Mac or Fannie Mae). Holdings designated at “AAA” or “AA” have been rated by Moody’s Investors Service, Inc. (“Moody’s”), S&P Global Ratings (“S&P”) or Fitch Ratings (“Fitch”). If securities are rated differently by these ratings agencies, the highest rating is applied. Moody’s ratings are converted to the S&P and Fitch scale with ratings ranging from AAA, being the highest, to D, being the lowest. Holdings designated as “Not Rated” have not been rated by S&P, Moody’s or Fitch. |
| [1] | Expenses are equal to the HIT’s annualized six-month expense ratio of 0.30%, as of June 30, 2025 |