Shareholder Report
Jun. 30, 2025
USD ($)
Holding
Fund Expenses for the Last Six Months
(Based on a hypothetical $10,000 investment)
| Class | Costs of a $10,000 investment | Costs paid as a percentage of a $10,000 investment |
| Institutional Class | $62 | 1.18%* |
| * | Annualized. |
Key Fund Statistics
| Fund net assets | $707,096,808 |
| Total number of portfolio holdings | 72 |
| Portfolio turnover rate for the reporting period | 64.6% |
Graphical Representation of Holdings
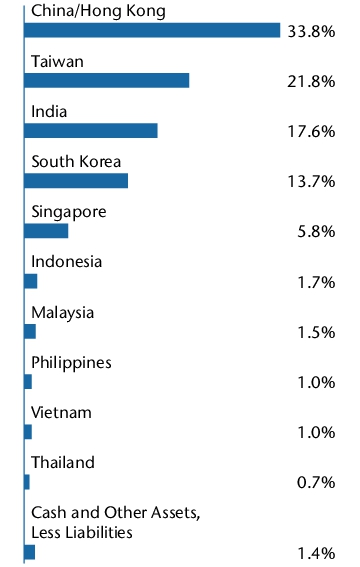
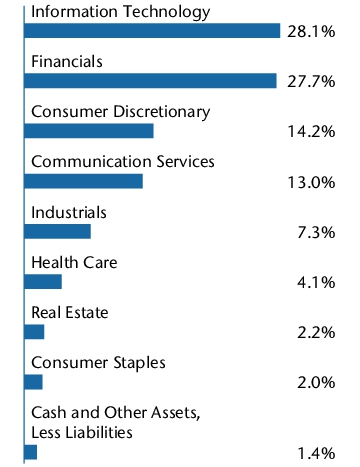
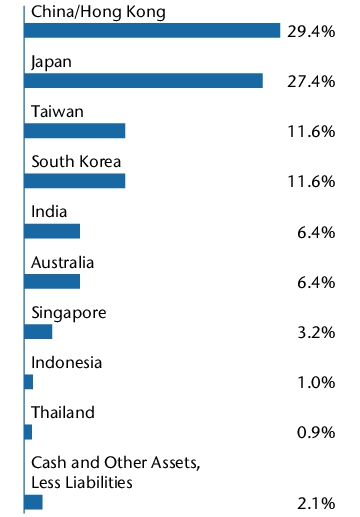
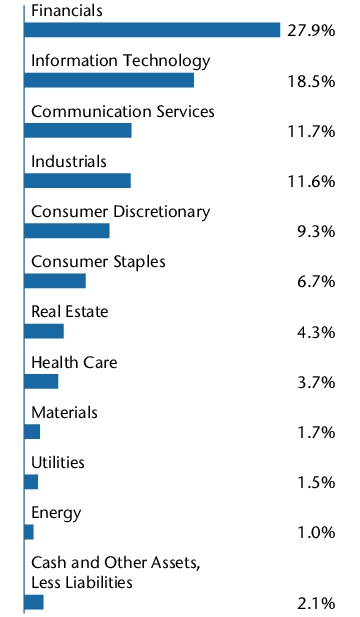
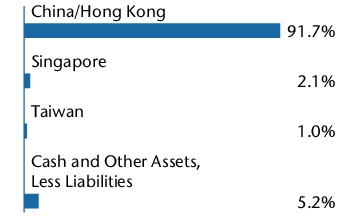
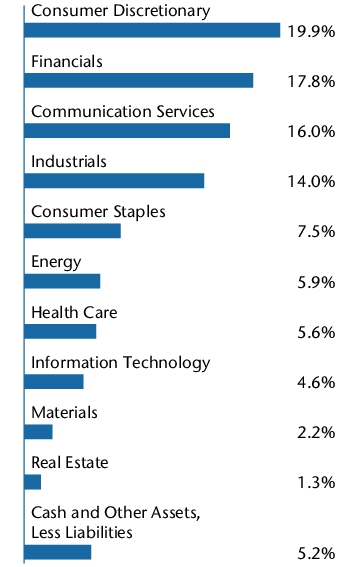
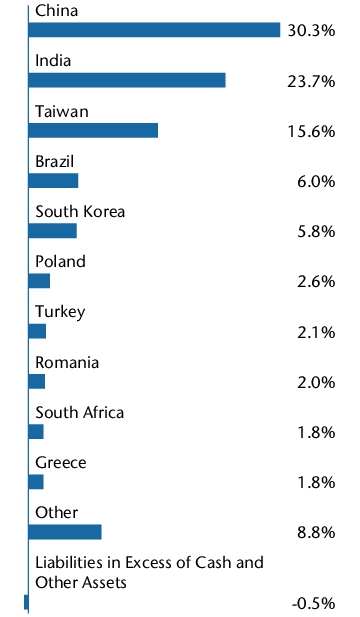
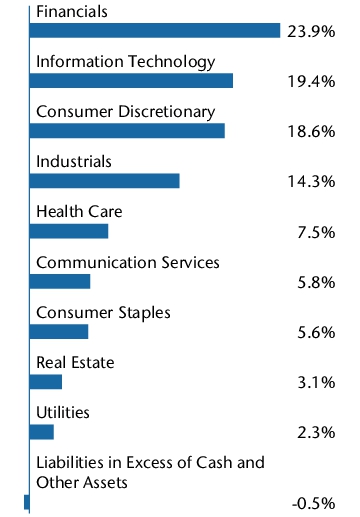
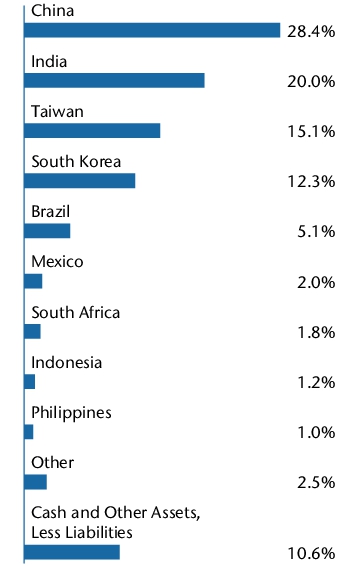
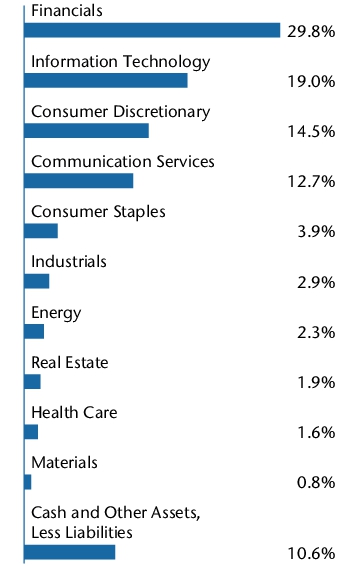
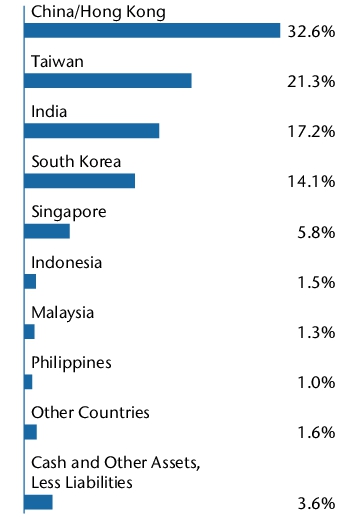
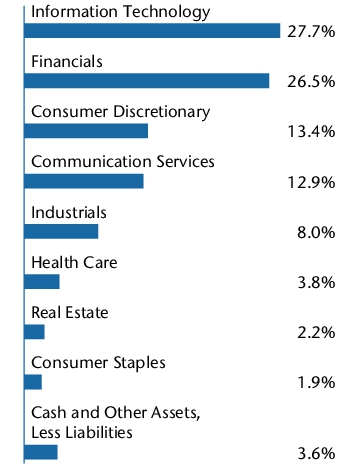
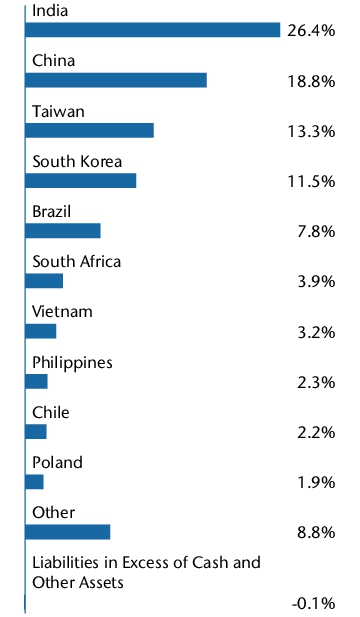
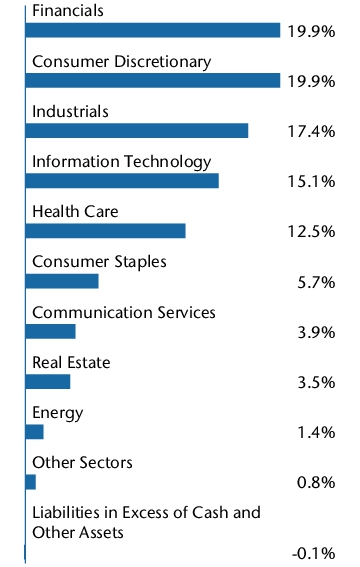
The tables below show the investment makeup of the Fund, represented as a percentage of the total net assets of the Fund.
Top Ten Holdings
| Taiwan Semiconductor Manufacturing Co., Ltd. | 12.3% |
| Tencent Holdings, Ltd. | 6.0% |
| Alibaba Group Holding, Ltd. | 3.9% |
| China Merchants Bank Co., Ltd. | 3.8% |
| KB Financial Group, Inc. | 3.1% |
| Samsung Electronics Co., Ltd. | 2.9% |
| SK Hynix, Inc. | 2.7% |
| Bharti Airtel, Ltd. | 2.6% |
| Eternal, Ltd. | 2.5% |
| Sea, Ltd. | 2.5% |
| TOTAL | 42.3% |
Country Allocation
Sector Allocation

Top ten holdings may combine more than one security from the same issuer and related depository receipts.
Top Ten Holdings
| Taiwan Semiconductor Manufacturing Co., Ltd. | 12.3% |
| Tencent Holdings, Ltd. | 6.0% |
| Alibaba Group Holding, Ltd. | 3.9% |
| China Merchants Bank Co., Ltd. | 3.8% |
| KB Financial Group, Inc. | 3.1% |
| Samsung Electronics Co., Ltd. | 2.9% |
| SK Hynix, Inc. | 2.7% |
| Bharti Airtel, Ltd. | 2.6% |
| Eternal, Ltd. | 2.5% |
| Sea, Ltd. | 2.5% |
| TOTAL | 42.3% |
Top ten holdings may combine more than one security from the same issuer and related depository receipts.
Fund Expenses for the Last Six Months
(Based on a hypothetical $10,000 investment)
| Class | Costs of a $10,000 investment | Costs paid as a percentage of a $10,000 investment |
| Investor Class | $68 | 1.31%* |
| * | Annualized. |
Key Fund Statistics
| Fund net assets | $707,096,808 |
| Total number of portfolio holdings | 72 |
| Portfolio turnover rate for the reporting period | 64.6% |
Graphical Representation of Holdings
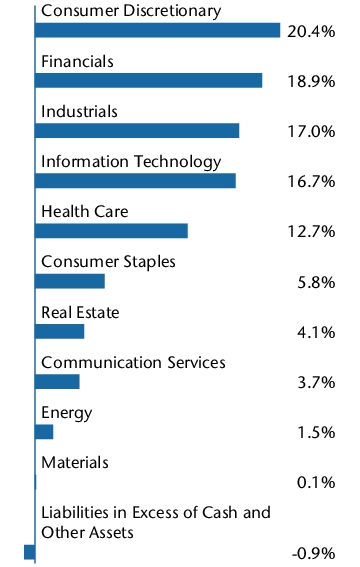
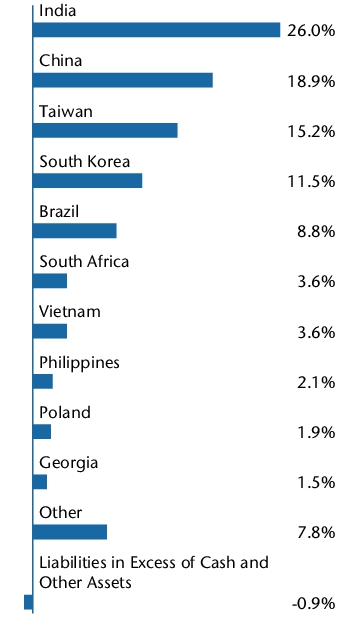
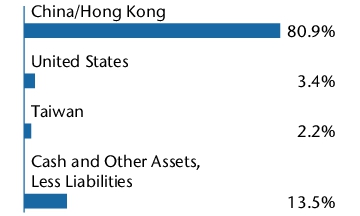
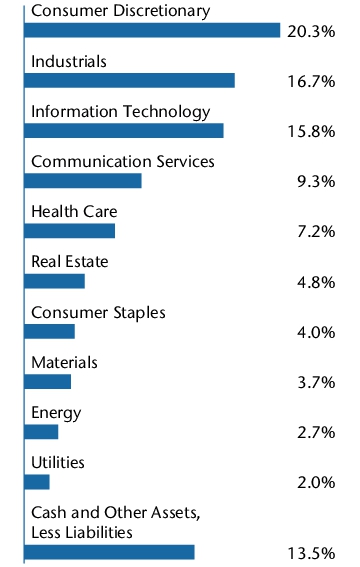
The tables below show the investment makeup of the Fund, represented as a percentage of the total net assets of the Fund.
Top Ten Holdings
| Taiwan Semiconductor Manufacturing Co., Ltd. | 12.3% |
| Tencent Holdings, Ltd. | 6.0% |
| Alibaba Group Holding, Ltd. | 3.9% |
| China Merchants Bank Co., Ltd. | 3.8% |
| KB Financial Group, Inc. | 3.1% |
| Samsung Electronics Co., Ltd. | 2.9% |
| SK Hynix, Inc. | 2.7% |
| Bharti Airtel, Ltd. | 2.6% |
| Eternal, Ltd. | 2.5% |
| Sea, Ltd. | 2.5% |
| TOTAL | 42.3% |
Country Allocation

Sector Allocation
Top ten holdings may combine more than one security from the same issuer and related depository receipts.
Top Ten Holdings
| Taiwan Semiconductor Manufacturing Co., Ltd. | 12.3% |
| Tencent Holdings, Ltd. | 6.0% |
| Alibaba Group Holding, Ltd. | 3.9% |
| China Merchants Bank Co., Ltd. | 3.8% |
| KB Financial Group, Inc. | 3.1% |
| Samsung Electronics Co., Ltd. | 2.9% |
| SK Hynix, Inc. | 2.7% |
| Bharti Airtel, Ltd. | 2.6% |
| Eternal, Ltd. | 2.5% |
| Sea, Ltd. | 2.5% |
| TOTAL | 42.3% |
Top ten holdings may combine more than one security from the same issuer and related depository receipts.
Fund Expenses for the Last Six Months
(Based on a hypothetical $10,000 investment)
| Class | Costs of a $10,000 investment | Costs paid as a percentage of a $10,000 investment |
| Institutional Class | $61 | 1.16%* |
| * | Annualized. |
Key Fund Statistics
| Fund net assets | $378,194,465 |
| Total number of portfolio holdings | 63 |
| Portfolio turnover rate for the reporting period | 15.5% |
Graphical Representation of Holdings
The tables below show the investment makeup of the Fund, represented as a percentage of the total net assets of the Fund.
Top Ten Holdings
| Tencent Holdings, Ltd. | 10.3% |
| Alibaba Group Holding, Ltd. | 7.6% |
| China Merchants Bank Co., Ltd. | 4.7% |
| China Construction Bank Corp. | 4.5% |
| JD.com, Inc. | 4.2% |
| PDD Holdings, Inc. | 3.8% |
| Ping An Insurance Group Co. of China, Ltd. | 3.6% |
| Meituan | 3.3% |
| New China Life Insurance Co., Ltd. | 3.1% |
| DiDi Global, Inc. ADR | 2.8% |
| TOTAL | 47.9% |
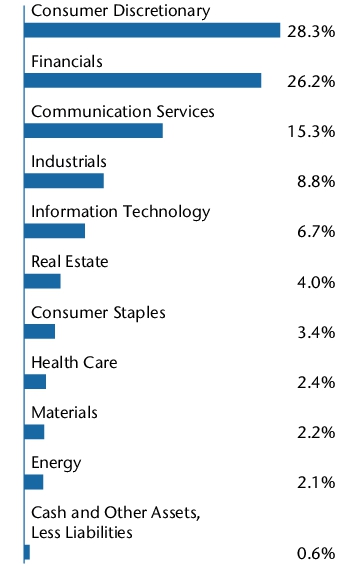
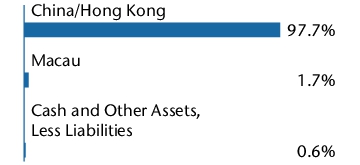
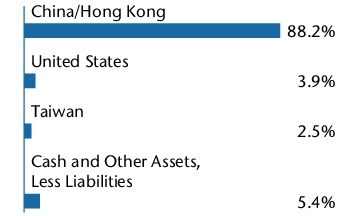
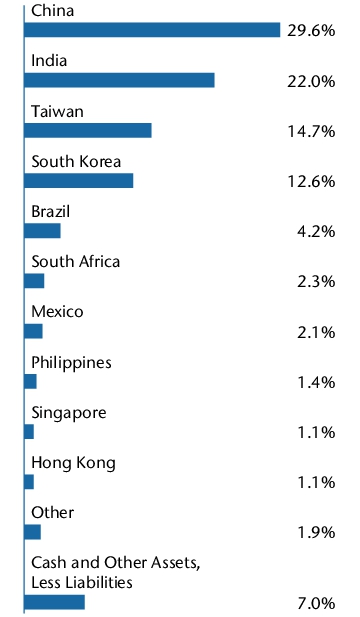
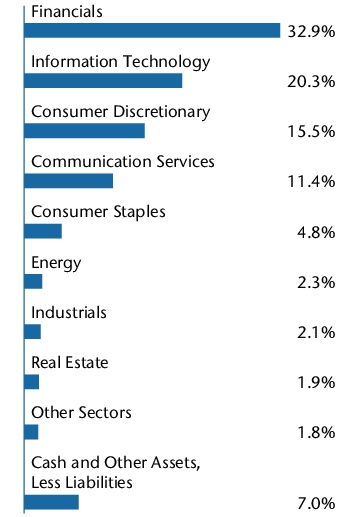
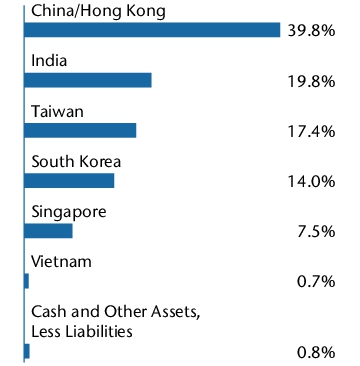
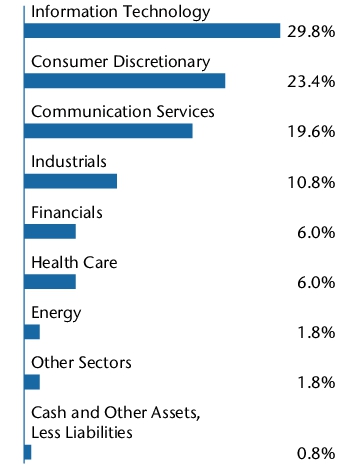
Country Allocation

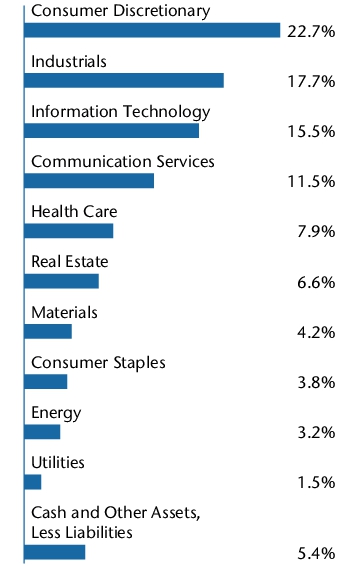
Sector Allocation
Top ten holdings may combine more than one security from the same issuer and related depository receipts.
Top Ten Holdings
| Tencent Holdings, Ltd. | 10.3% |
| Alibaba Group Holding, Ltd. | 7.6% |
| China Merchants Bank Co., Ltd. | 4.7% |
| China Construction Bank Corp. | 4.5% |
| JD.com, Inc. | 4.2% |
| PDD Holdings, Inc. | 3.8% |
| Ping An Insurance Group Co. of China, Ltd. | 3.6% |
| Meituan | 3.3% |
| New China Life Insurance Co., Ltd. | 3.1% |
| DiDi Global, Inc. ADR | 2.8% |
| TOTAL | 47.9% |
Top ten holdings may combine more than one security from the same issuer and related depository receipts.
Fund Expenses for the Last Six Months
(Based on a hypothetical $10,000 investment)
| Class | Costs of a $10,000 investment | Costs paid as a percentage of a $10,000 investment |
| Investor Class | $68 | 1.29%* |
| * | Annualized. |
Key Fund Statistics
| Fund net assets | $378,194,465 |
| Total number of portfolio holdings | 63 |
| Portfolio turnover rate for the reporting period | 15.5% |
Graphical Representation of Holdings
The tables below show the investment makeup of the Fund, represented as a percentage of the total net assets of the Fund.
Top Ten Holdings
| Tencent Holdings, Ltd. | 10.3% |
| Alibaba Group Holding, Ltd. | 7.6% |
| China Merchants Bank Co., Ltd. | 4.7% |
| China Construction Bank Corp. | 4.5% |
| JD.com, Inc. | 4.2% |
| PDD Holdings, Inc. | 3.8% |
| Ping An Insurance Group Co. of China, Ltd. | 3.6% |
| Meituan | 3.3% |
| New China Life Insurance Co., Ltd. | 3.1% |
| DiDi Global, Inc. ADR | 2.8% |
| TOTAL | 47.9% |
Country Allocation
Sector Allocation

Top ten holdings may combine more than one security from the same issuer and related depository receipts.
Top Ten Holdings
| Tencent Holdings, Ltd. | 10.3% |
| Alibaba Group Holding, Ltd. | 7.6% |
| China Merchants Bank Co., Ltd. | 4.7% |
| China Construction Bank Corp. | 4.5% |
| JD.com, Inc. | 4.2% |
| PDD Holdings, Inc. | 3.8% |
| Ping An Insurance Group Co. of China, Ltd. | 3.6% |
| Meituan | 3.3% |
| New China Life Insurance Co., Ltd. | 3.1% |
| DiDi Global, Inc. ADR | 2.8% |
| TOTAL | 47.9% |
Top ten holdings may combine more than one security from the same issuer and related depository receipts.
Fund Expenses for the Last Six Months
(Based on a hypothetical $10,000 investment)
| Class | Costs of a $10,000 investment | Costs paid as a percentage of a $10,000 investment |
| Institutional Class | $58 | 1.10%* |
| * | Annualized. |
Key Fund Statistics
| Fund net assets | $682,321,541 |
| Total number of portfolio holdings | 49 |
| Portfolio turnover rate for the reporting period | 51.7% |
Graphical Representation of Holdings
The tables below show the investment makeup of the Fund, represented as a percentage of the total net assets of the Fund.
Top Ten Holdings
| Sony Group Corp. | 5.8% |
| Tokio Marine Holdings, Inc. | 4.6% |
| Mitsubishi UFJ Financial Group, Inc. | 4.5% |
| Hitachi, Ltd. | 4.4% |
| Tokyo Electron, Ltd. | 4.1% |
| NEC Corp. | 3.3% |
| Ajinomoto Co., Inc. | 3.1% |
| Shin-Etsu Chemical Co., Ltd. | 3.1% |
| Mitsui Fudosan Co., Ltd. | 2.9% |
| ITOCHU Corp. | 2.9% |
| TOTAL | 38.7% |
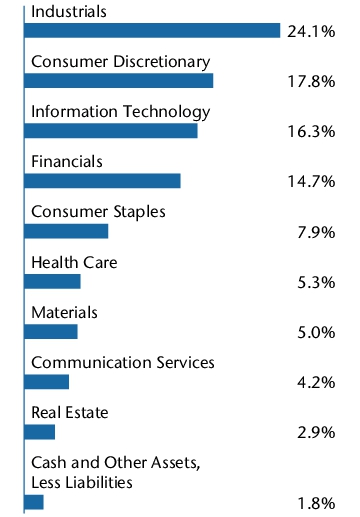
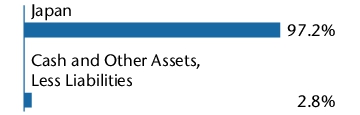
Country Allocation
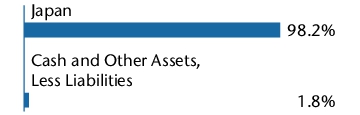
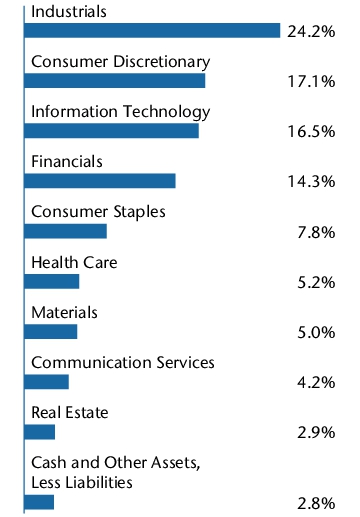
Sector Allocation

Top ten holdings may combine more than one security from the same issuer and related depository receipts.
Top Ten Holdings
| Sony Group Corp. | 5.8% |
| Tokio Marine Holdings, Inc. | 4.6% |
| Mitsubishi UFJ Financial Group, Inc. | 4.5% |
| Hitachi, Ltd. | 4.4% |
| Tokyo Electron, Ltd. | 4.1% |
| NEC Corp. | 3.3% |
| Ajinomoto Co., Inc. | 3.1% |
| Shin-Etsu Chemical Co., Ltd. | 3.1% |
| Mitsui Fudosan Co., Ltd. | 2.9% |
| ITOCHU Corp. | 2.9% |
| TOTAL | 38.7% |
Top ten holdings may combine more than one security from the same issuer and related depository receipts.
Fund Expenses for the Last Six Months
(Based on a hypothetical $10,000 investment)
| Class | Costs of a $10,000 investment | Costs paid as a percentage of a $10,000 investment |
| Investor Class | $62 | 1.17%* |
| * | Annualized. |
Key Fund Statistics
| Fund net assets | $682,321,541 |
| Total number of portfolio holdings | 49 |
| Portfolio turnover rate for the reporting period | 51.7% |
Graphical Representation of Holdings
The tables below show the investment makeup of the Fund, represented as a percentage of the total net assets of the Fund.
Top Ten Holdings
| Sony Group Corp. | 5.8% |
| Tokio Marine Holdings, Inc. | 4.6% |
| Mitsubishi UFJ Financial Group, Inc. | 4.5% |
| Hitachi, Ltd. | 4.4% |
| Tokyo Electron, Ltd. | 4.1% |
| NEC Corp. | 3.3% |
| Ajinomoto Co., Inc. | 3.1% |
| Shin-Etsu Chemical Co., Ltd. | 3.1% |
| Mitsui Fudosan Co., Ltd. | 2.9% |
| ITOCHU Corp. | 2.9% |
| TOTAL | 38.7% |
Country Allocation

Sector Allocation
Top ten holdings may combine more than one security from the same issuer and related depository receipts.
Top Ten Holdings
| Sony Group Corp. | 5.8% |
| Tokio Marine Holdings, Inc. | 4.6% |
| Mitsubishi UFJ Financial Group, Inc. | 4.5% |
| Hitachi, Ltd. | 4.4% |
| Tokyo Electron, Ltd. | 4.1% |
| NEC Corp. | 3.3% |
| Ajinomoto Co., Inc. | 3.1% |
| Shin-Etsu Chemical Co., Ltd. | 3.1% |
| Mitsui Fudosan Co., Ltd. | 2.9% |
| ITOCHU Corp. | 2.9% |
| TOTAL | 38.7% |
Top ten holdings may combine more than one security from the same issuer and related depository receipts.
Fund Expenses for the Last Six Months
(Based on a hypothetical $10,000 investment)
| Class | Costs of a $10,000 investment | Costs paid as a percentage of a $10,000 investment |
| Institutional Class | $63 | 1.19%* |
| * | Annualized. |
Key Fund Statistics
| Fund net assets | $286,211,376 |
| Total number of portfolio holdings | 58 |
| Portfolio turnover rate for the reporting period | 50.4% |
Graphical Representation of Holdings
The tables below show the investment makeup of the Fund, represented as a percentage of the total net assets of the Fund.
Top Ten Holdings
| Taiwan Semiconductor Manufacturing Co., Ltd. | 10.8% |
| Tencent Holdings, Ltd. | 6.0% |
| Sea, Ltd. | 5.6% |
| Eternal, Ltd. | 4.6% |
| Samsung Electronics Co., Ltd. | 3.5% |
| MakeMyTrip, Ltd. | 3.3% |
| Alibaba Group Holding, Ltd. | 3.0% |
| PDD Holdings, Inc. | 2.9% |
| SK Hynix, Inc. | 2.3% |
| Xiaomi Corp. | 2.0% |
| TOTAL | 44.0% |
Country Allocation
Sector Allocation

Top ten holdings may combine more than one security from the same issuer and related depository receipts.
Top Ten Holdings
| Taiwan Semiconductor Manufacturing Co., Ltd. | 10.8% |
| Tencent Holdings, Ltd. | 6.0% |
| Sea, Ltd. | 5.6% |
| Eternal, Ltd. | 4.6% |
| Samsung Electronics Co., Ltd. | 3.5% |
| MakeMyTrip, Ltd. | 3.3% |
| Alibaba Group Holding, Ltd. | 3.0% |
| PDD Holdings, Inc. | 2.9% |
| SK Hynix, Inc. | 2.3% |
| Xiaomi Corp. | 2.0% |
| TOTAL | 44.0% |
Top ten holdings may combine more than one security from the same issuer and related depository receipts.
Fund Expenses for the Last Six Months
(Based on a hypothetical $10,000 investment)
| Class | Costs of a $10,000 investment | Costs paid as a percentage of a $10,000 investment |
| Investor Class | $69 | 1.31%* |
| * | Annualized. |
Key Fund Statistics
| Fund net assets | $286,211,376 |
| Total number of portfolio holdings | 58 |
| Portfolio turnover rate for the reporting period | 50.4% |
Graphical Representation of Holdings
The tables below show the investment makeup of the Fund, represented as a percentage of the total net assets of the Fund.
Top Ten Holdings
| Taiwan Semiconductor Manufacturing Co., Ltd. | 10.8% |
| Tencent Holdings, Ltd. | 6.0% |
| Sea, Ltd. | 5.6% |
| Eternal, Ltd. | 4.6% |
| Samsung Electronics Co., Ltd. | 3.5% |
| MakeMyTrip, Ltd. | 3.3% |
| Alibaba Group Holding, Ltd. | 3.0% |
| PDD Holdings, Inc. | 2.9% |
| SK Hynix, Inc. | 2.3% |
| Xiaomi Corp. | 2.0% |
| TOTAL | 44.0% |
Country Allocation

Sector Allocation
Top ten holdings may combine more than one security from the same issuer and related depository receipts.
Top Ten Holdings
| Taiwan Semiconductor Manufacturing Co., Ltd. | 10.8% |
| Tencent Holdings, Ltd. | 6.0% |
| Sea, Ltd. | 5.6% |
| Eternal, Ltd. | 4.6% |
| Samsung Electronics Co., Ltd. | 3.5% |
| MakeMyTrip, Ltd. | 3.3% |
| Alibaba Group Holding, Ltd. | 3.0% |
| PDD Holdings, Inc. | 2.9% |
| SK Hynix, Inc. | 2.3% |
| Xiaomi Corp. | 2.0% |
| TOTAL | 44.0% |
Top ten holdings may combine more than one security from the same issuer and related depository receipts.
Fund Expenses for the Last Six Months
(Based on a hypothetical $10,000 investment)
| Class | Costs of a $10,000 investment | Costs paid as a percentage of a $10,000 investment |
| Institutional Class | $62 | 1.20%* |
| * | Annualized. |
Key Fund Statistics
| Fund net assets | $209,146,328 |
| Total number of portfolio holdings | 79 |
| Portfolio turnover rate for the reporting period | 43.7% |
Graphical Representation of Holdings
The tables below show the investment makeup of the Fund, represented as a percentage of the total net assets of the Fund.
Top Ten Holdings
| Taiwan Semiconductor Manufacturing Co., Ltd. | 7.1% |
| Tencent Holdings, Ltd. | 4.2% |
| Sea, Ltd. | 3.8% |
| Eternal, Ltd. | 2.9% |
| Sony Group Corp. | 2.9% |
| Hitachi, Ltd. | 2.8% |
| Mitsubishi UFJ Financial Group, Inc. | 2.2% |
| Samsung Electronics Co., Ltd. | 2.2% |
| MakeMyTrip, Ltd. | 1.9% |
| Tokyo Electron, Ltd. | 1.9% |
| TOTAL | 31.9% |
Country Allocation

Sector Allocation
Top ten holdings may combine more than one security from the same issuer and related depository receipts.
Top Ten Holdings
| Taiwan Semiconductor Manufacturing Co., Ltd. | 7.1% |
| Tencent Holdings, Ltd. | 4.2% |
| Sea, Ltd. | 3.8% |
| Eternal, Ltd. | 2.9% |
| Sony Group Corp. | 2.9% |
| Hitachi, Ltd. | 2.8% |
| Mitsubishi UFJ Financial Group, Inc. | 2.2% |
| Samsung Electronics Co., Ltd. | 2.2% |
| MakeMyTrip, Ltd. | 1.9% |
| Tokyo Electron, Ltd. | 1.9% |
| TOTAL | 31.9% |
Top ten holdings may combine more than one security from the same issuer and related depository receipts.
Fund Expenses for the Last Six Months
(Based on a hypothetical $10,000 investment)
| Class | Costs of a $10,000 investment | Costs paid as a percentage of a $10,000 investment |
| Investor Class | $71 | 1.38%* |
| * | Annualized. |
Key Fund Statistics
| Fund net assets | $209,146,328 |
| Total number of portfolio holdings | 79 |
| Portfolio turnover rate for the reporting period | 43.7% |
Graphical Representation of Holdings
The tables below show the investment makeup of the Fund, represented as a percentage of the total net assets of the Fund.
Top Ten Holdings
| Taiwan Semiconductor Manufacturing Co., Ltd. | 7.1% |
| Tencent Holdings, Ltd. | 4.2% |
| Sea, Ltd. | 3.8% |
| Eternal, Ltd. | 2.9% |
| Sony Group Corp. | 2.9% |
| Hitachi, Ltd. | 2.8% |
| Mitsubishi UFJ Financial Group, Inc. | 2.2% |
| Samsung Electronics Co., Ltd. | 2.2% |
| MakeMyTrip, Ltd. | 1.9% |
| Tokyo Electron, Ltd. | 1.9% |
| TOTAL | 31.9% |
Country Allocation
Sector Allocation

Top ten holdings may combine more than one security from the same issuer and related depository receipts.
Top Ten Holdings
| Taiwan Semiconductor Manufacturing Co., Ltd. | 7.1% |
| Tencent Holdings, Ltd. | 4.2% |
| Sea, Ltd. | 3.8% |
| Eternal, Ltd. | 2.9% |
| Sony Group Corp. | 2.9% |
| Hitachi, Ltd. | 2.8% |
| Mitsubishi UFJ Financial Group, Inc. | 2.2% |
| Samsung Electronics Co., Ltd. | 2.2% |
| MakeMyTrip, Ltd. | 1.9% |
| Tokyo Electron, Ltd. | 1.9% |
| TOTAL | 31.9% |
Top ten holdings may combine more than one security from the same issuer and related depository receipts.
Fund Expenses for the Last Six Months
(Based on a hypothetical $10,000 investment)
| Class | Costs of a $10,000 investment | Costs paid as a percentage of a $10,000 investment |
| Institutional Class | $58 | 1.16%* |
| * | Annualized. |
Key Fund Statistics
| Fund net assets | $788,147,516 |
| Total number of portfolio holdings | 71 |
| Portfolio turnover rate for the reporting period | 31.5% |
Graphical Representation of Holdings
The tables below show the investment makeup of the Fund, represented as a percentage of the total net assets of the Fund.
Top Ten Holdings
| HDFC Bank, Ltd. | 8.5% |
| ICICI Bank, Ltd. | 6.3% |
| Eternal, Ltd. | 5.3% |
| Shriram Finance, Ltd. | 4.8% |
| Reliance Industries, Ltd. | 4.7% |
| Swiggy, Ltd. | 4.2% |
| Bharti Airtel, Ltd. | 4.2% |
| Bajaj Finance, Ltd. | 4.1% |
| Infosys, Ltd. | 3.6% |
| Mahindra & Mahindra, Ltd. | 3.2% |
| TOTAL | 48.9% |
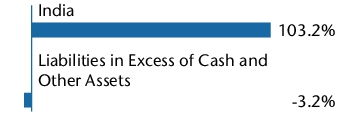
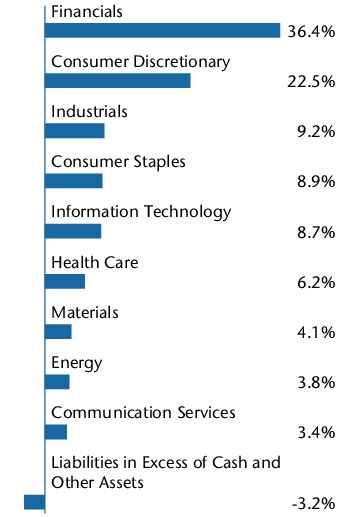
Country Allocation
Sector Allocation

Top ten holdings may combine more than one security from the same issuer and related depository receipts.
Top Ten Holdings
| HDFC Bank, Ltd. | 8.5% |
| ICICI Bank, Ltd. | 6.3% |
| Eternal, Ltd. | 5.3% |
| Shriram Finance, Ltd. | 4.8% |
| Reliance Industries, Ltd. | 4.7% |
| Swiggy, Ltd. | 4.2% |
| Bharti Airtel, Ltd. | 4.2% |
| Bajaj Finance, Ltd. | 4.1% |
| Infosys, Ltd. | 3.6% |
| Mahindra & Mahindra, Ltd. | 3.2% |
| TOTAL | 48.9% |
Top ten holdings may combine more than one security from the same issuer and related depository receipts.
Fund Expenses for the Last Six Months
(Based on a hypothetical $10,000 investment)
| Class | Costs of a $10,000 investment | Costs paid as a percentage of a $10,000 investment |
| Investor Class | $65 | 1.30%* |
| * | Annualized. |
Key Fund Statistics
| Fund net assets | $788,147,516 |
| Total number of portfolio holdings | 71 |
| Portfolio turnover rate for the reporting period | 31.5% |
Graphical Representation of Holdings
The tables below show the investment makeup of the Fund, represented as a percentage of the total net assets of the Fund.
Top Ten Holdings
| HDFC Bank, Ltd. | 8.5% |
| ICICI Bank, Ltd. | 6.3% |
| Eternal, Ltd. | 5.3% |
| Shriram Finance, Ltd. | 4.8% |
| Reliance Industries, Ltd. | 4.7% |
| Swiggy, Ltd. | 4.2% |
| Bharti Airtel, Ltd. | 4.2% |
| Bajaj Finance, Ltd. | 4.1% |
| Infosys, Ltd. | 3.6% |
| Mahindra & Mahindra, Ltd. | 3.2% |
| TOTAL | 48.9% |
Country Allocation

Sector Allocation
Top ten holdings may combine more than one security from the same issuer and related depository receipts.
Top Ten Holdings
| HDFC Bank, Ltd. | 8.5% |
| ICICI Bank, Ltd. | 6.3% |
| Eternal, Ltd. | 5.3% |
| Shriram Finance, Ltd. | 4.8% |
| Reliance Industries, Ltd. | 4.7% |
| Swiggy, Ltd. | 4.2% |
| Bharti Airtel, Ltd. | 4.2% |
| Bajaj Finance, Ltd. | 4.1% |
| Infosys, Ltd. | 3.6% |
| Mahindra & Mahindra, Ltd. | 3.2% |
| TOTAL | 48.9% |
Top ten holdings may combine more than one security from the same issuer and related depository receipts.
Fund Expenses for the Last Six Months
(Based on a hypothetical $10,000 investment)
| Class | Costs of a $10,000 investment | Costs paid as a percentage of a $10,000 investment |
| Institutional Class | $60 | 1.13%* |
| * | Annualized. |
Key Fund Statistics
| Fund net assets | $560,144,914 |
| Total number of portfolio holdings | 64 |
| Portfolio turnover rate for the reporting period | 49.1% |
Graphical Representation of Holdings
The tables below show the investment makeup of the Fund, represented as a percentage of the total net assets of the Fund.
Top Ten Holdings
| Taiwan Semiconductor Manufacturing Co., Ltd. | 9.3% |
| Tencent Holdings, Ltd. | 5.2% |
| Hana Financial Group, Inc. | 3.2% |
| Samsung Electronics Co., Ltd. | 2.4% |
| NEC Corp. | 2.3% |
| AIA Group, Ltd. | 2.0% |
| ITOCHU Corp. | 2.0% |
| Commonwealth Bank of Australia | 2.0% |
| Hikari Tsushin, Inc. | 1.9% |
| Telstra Group, Ltd. | 1.8% |
| TOTAL | 32.1% |
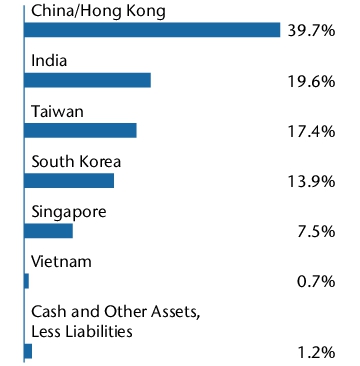
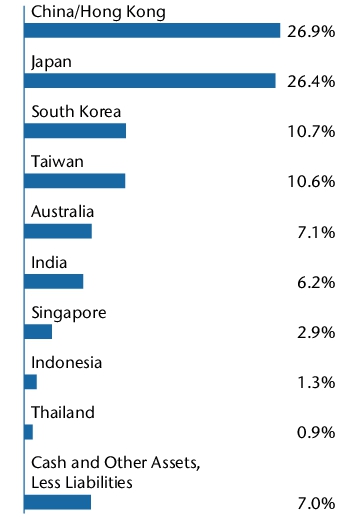
Country Allocation
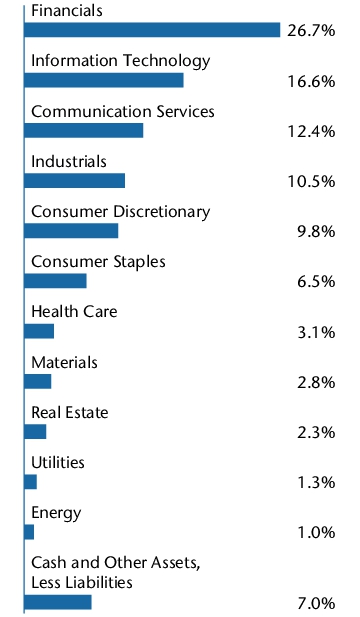
Sector Allocation
Top ten holdings may combine more than one security from the same issuer and related depository receipts.
Top Ten Holdings
| Taiwan Semiconductor Manufacturing Co., Ltd. | 9.3% |
| Tencent Holdings, Ltd. | 5.2% |
| Hana Financial Group, Inc. | 3.2% |
| Samsung Electronics Co., Ltd. | 2.4% |
| NEC Corp. | 2.3% |
| AIA Group, Ltd. | 2.0% |
| ITOCHU Corp. | 2.0% |
| Commonwealth Bank of Australia | 2.0% |
| Hikari Tsushin, Inc. | 1.9% |
| Telstra Group, Ltd. | 1.8% |
| TOTAL | 32.1% |
Top ten holdings may combine more than one security from the same issuer and related depository receipts.
Fund Expenses for the Last Six Months
(Based on a hypothetical $10,000 investment)
| Class | Costs of a $10,000 investment | Costs paid as a percentage of a $10,000 investment |
| Investor Class | $66 | 1.26%* |
| * | Annualized. |
Key Fund Statistics
| Fund net assets | $560,144,914 |
| Total number of portfolio holdings | 64 |
| Portfolio turnover rate for the reporting period | 49.1% |
Graphical Representation of Holdings
The tables below show the investment makeup of the Fund, represented as a percentage of the total net assets of the Fund.
Top Ten Holdings
| Taiwan Semiconductor Manufacturing Co., Ltd. | 9.3% |
| Tencent Holdings, Ltd. | 5.2% |
| Hana Financial Group, Inc. | 3.2% |
| Samsung Electronics Co., Ltd. | 2.4% |
| NEC Corp. | 2.3% |
| AIA Group, Ltd. | 2.0% |
| ITOCHU Corp. | 2.0% |
| Commonwealth Bank of Australia | 2.0% |
| Hikari Tsushin, Inc. | 1.9% |
| Telstra Group, Ltd. | 1.8% |
| TOTAL | 32.1% |
Country Allocation

Sector Allocation

Top ten holdings may combine more than one security from the same issuer and related depository receipts.
Top Ten Holdings
| Taiwan Semiconductor Manufacturing Co., Ltd. | 9.3% |
| Tencent Holdings, Ltd. | 5.2% |
| Hana Financial Group, Inc. | 3.2% |
| Samsung Electronics Co., Ltd. | 2.4% |
| NEC Corp. | 2.3% |
| AIA Group, Ltd. | 2.0% |
| ITOCHU Corp. | 2.0% |
| Commonwealth Bank of Australia | 2.0% |
| Hikari Tsushin, Inc. | 1.9% |
| Telstra Group, Ltd. | 1.8% |
| TOTAL | 32.1% |
Top ten holdings may combine more than one security from the same issuer and related depository receipts.
Fund Expenses for the Last Six Months
(Based on a hypothetical $10,000 investment)
| Class | Costs of a $10,000 investment | Costs paid as a percentage of a $10,000 investment |
| Institutional Class | $62 | 1.17%* |
| * | Annualized. |
Key Fund Statistics
| Fund net assets | $512,689,484 |
| Total number of portfolio holdings | 74 |
| Portfolio turnover rate for the reporting period | 15.6% |
Graphical Representation of Holdings
The tables below show the investment makeup of the Fund, represented as a percentage of the total net assets of the Fund.
Top Ten Holdings
| Bandhan Bank, Ltd. | 7.9% |
| Hugel, Inc. | 5.1% |
| Legend Biotech Corp. | 5.0% |
| YDUQS Participacoes SA | 2.7% |
| We Buy Cars Holdings, Ltd. | 2.5% |
| Grupo SBF SA | 2.5% |
| Cartrade Tech, Ltd. | 2.4% |
| Elite Material Co., Ltd. | 2.2% |
| Radico Khaitan, Ltd. | 2.2% |
| Full Truck Alliance Co., Ltd. | 2.2% |
| TOTAL | 34.7% |
Country Allocation

Sector Allocation
Top ten holdings may combine more than one security from the same issuer and related depository receipts.
Top Ten Holdings
| Bandhan Bank, Ltd. | 7.9% |
| Hugel, Inc. | 5.1% |
| Legend Biotech Corp. | 5.0% |
| YDUQS Participacoes SA | 2.7% |
| We Buy Cars Holdings, Ltd. | 2.5% |
| Grupo SBF SA | 2.5% |
| Cartrade Tech, Ltd. | 2.4% |
| Elite Material Co., Ltd. | 2.2% |
| Radico Khaitan, Ltd. | 2.2% |
| Full Truck Alliance Co., Ltd. | 2.2% |
| TOTAL | 34.7% |
Top ten holdings may combine more than one security from the same issuer and related depository receipts.
Fund Expenses for the Last Six Months
(Based on a hypothetical $10,000 investment)
| Class | Costs of a $10,000 investment | Costs paid as a percentage of a $10,000 investment |
| Investor Class | $74 | 1.41%* |
| * | Annualized. |
Key Fund Statistics
| Fund net assets | $512,689,484 |
| Total number of portfolio holdings | 74 |
| Portfolio turnover rate for the reporting period | 15.6% |
Graphical Representation of Holdings
The tables below show the investment makeup of the Fund, represented as a percentage of the total net assets of the Fund.
Top Ten Holdings
| Bandhan Bank, Ltd. | 7.9% |
| Hugel, Inc. | 5.1% |
| Legend Biotech Corp. | 5.0% |
| YDUQS Participacoes SA | 2.7% |
| We Buy Cars Holdings, Ltd. | 2.5% |
| Grupo SBF SA | 2.5% |
| Cartrade Tech, Ltd. | 2.4% |
| Elite Material Co., Ltd. | 2.2% |
| Radico Khaitan, Ltd. | 2.2% |
| Full Truck Alliance Co., Ltd. | 2.2% |
| TOTAL | 34.7% |
Country Allocation
Sector Allocation

Top ten holdings may combine more than one security from the same issuer and related depository receipts.
Top Ten Holdings
| Bandhan Bank, Ltd. | 7.9% |
| Hugel, Inc. | 5.1% |
| Legend Biotech Corp. | 5.0% |
| YDUQS Participacoes SA | 2.7% |
| We Buy Cars Holdings, Ltd. | 2.5% |
| Grupo SBF SA | 2.5% |
| Cartrade Tech, Ltd. | 2.4% |
| Elite Material Co., Ltd. | 2.2% |
| Radico Khaitan, Ltd. | 2.2% |
| Full Truck Alliance Co., Ltd. | 2.2% |
| TOTAL | 34.7% |
Top ten holdings may combine more than one security from the same issuer and related depository receipts.
Fund Expenses for the Last Six Months
(Based on a hypothetical $10,000 investment)
| Class | Costs of a $10,000 investment | Costs paid as a percentage of a $10,000 investment |
| Institutional Class | $64 | 1.20%* |
| * | Annualized. |
Key Fund Statistics
| Fund net assets | $90,371,597 |
| Total number of portfolio holdings | 40 |
| Portfolio turnover rate for the reporting period | 28.6% |
Graphical Representation of Holdings
The tables below show the investment makeup of the Fund, represented as a percentage of the total net assets of the Fund.
Top Ten Holdings
| Tencent Holdings, Ltd. | 11.4% |
| Alibaba Group Holding, Ltd. | 8.5% |
| Ping An Insurance Group Co. of China, Ltd. | 5.0% |
| China Merchants Bank Co., Ltd. | 4.3% |
| China Construction Bank Corp. | 4.2% |
| Anhui Expressway Co., Ltd. | 3.5% |
| China Suntien Green Energy Corp., Ltd. | 3.1% |
| Industrial & Commercial Bank of China, Ltd. | 3.1% |
| China Everbright Environment Group, Ltd. | 2.9% |
| PetroChina Co., Ltd. | 2.8% |
| TOTAL | 48.8% |
Country Allocation
Sector Allocation
Top ten holdings may combine more than one security from the same issuer and related depository receipts.
Top Ten Holdings
| Tencent Holdings, Ltd. | 11.4% |
| Alibaba Group Holding, Ltd. | 8.5% |
| Ping An Insurance Group Co. of China, Ltd. | 5.0% |
| China Merchants Bank Co., Ltd. | 4.3% |
| China Construction Bank Corp. | 4.2% |
| Anhui Expressway Co., Ltd. | 3.5% |
| China Suntien Green Energy Corp., Ltd. | 3.1% |
| Industrial & Commercial Bank of China, Ltd. | 3.1% |
| China Everbright Environment Group, Ltd. | 2.9% |
| PetroChina Co., Ltd. | 2.8% |
| TOTAL | 48.8% |
Top ten holdings may combine more than one security from the same issuer and related depository receipts.
Fund Expenses for the Last Six Months
(Based on a hypothetical $10,000 investment)
| Class | Costs of a $10,000 investment | Costs paid as a percentage of a $10,000 investment |
| Investor Class | $71 | 1.34%* |
| * | Annualized. |
Key Fund Statistics
| Fund net assets | $90,371,597 |
| Total number of portfolio holdings | 40 |
| Portfolio turnover rate for the reporting period | 28.6% |
Graphical Representation of Holdings
The tables below show the investment makeup of the Fund, represented as a percentage of the total net assets of the Fund.
Top Ten Holdings
| Tencent Holdings, Ltd. | 11.4% |
| Alibaba Group Holding, Ltd. | 8.5% |
| Ping An Insurance Group Co. of China, Ltd. | 5.0% |
| China Merchants Bank Co., Ltd. | 4.3% |
| China Construction Bank Corp. | 4.2% |
| Anhui Expressway Co., Ltd. | 3.5% |
| China Suntien Green Energy Corp., Ltd. | 3.1% |
| Industrial & Commercial Bank of China, Ltd. | 3.1% |
| China Everbright Environment Group, Ltd. | 2.9% |
| PetroChina Co., Ltd. | 2.8% |
| TOTAL | 48.8% |
Country Allocation

Sector Allocation

Top ten holdings may combine more than one security from the same issuer and related depository receipts.
Top Ten Holdings
| Tencent Holdings, Ltd. | 11.4% |
| Alibaba Group Holding, Ltd. | 8.5% |
| Ping An Insurance Group Co. of China, Ltd. | 5.0% |
| China Merchants Bank Co., Ltd. | 4.3% |
| China Construction Bank Corp. | 4.2% |
| Anhui Expressway Co., Ltd. | 3.5% |
| China Suntien Green Energy Corp., Ltd. | 3.1% |
| Industrial & Commercial Bank of China, Ltd. | 3.1% |
| China Everbright Environment Group, Ltd. | 2.9% |
| PetroChina Co., Ltd. | 2.8% |
| TOTAL | 48.8% |
Top ten holdings may combine more than one security from the same issuer and related depository receipts.
Fund Expenses for the Last Six Months
(Based on a hypothetical $10,000 investment)
| Class | Costs of a $10,000 investment | Costs paid as a percentage of a $10,000 investment |
| Institutional Class | $63 | 1.20%* |
| * | Annualized. |
Key Fund Statistics
| Fund net assets | $62,281,859 |
| Total number of portfolio holdings | 57 |
| Portfolio turnover rate for the reporting period | 11.8% |
Graphical Representation of Holdings
The tables below show the investment makeup of the Fund, represented as a percentage of the total net assets of the Fund.
Top Ten Holdings
| NetEase Cloud Music, Inc. | 5.2% |
| Hongfa Technology Co., Ltd. | 4.0% |
| Atour Lifestyle Holdings, Ltd. | 3.8% |
| DPC Dash, Ltd. | 3.5% |
| ACM Research, Inc. | 3.3% |
| Full Truck Alliance Co., Ltd. | 3.2% |
| Yantai Jereh Oilfield Services Group Co., Ltd. | 3.2% |
| Tongcheng Travel Holdings, Ltd. | 3.1% |
| Zhejiang Shuanghuan Driveline Co., Ltd. | 2.8% |
| Kanzhun, Ltd. | 2.4% |
| TOTAL | 34.5% |
Country Allocation
Sector Allocation
Top ten holdings may combine more than one security from the same issuer and related depository receipts.
Top Ten Holdings
| NetEase Cloud Music, Inc. | 5.2% |
| Hongfa Technology Co., Ltd. | 4.0% |
| Atour Lifestyle Holdings, Ltd. | 3.8% |
| DPC Dash, Ltd. | 3.5% |
| ACM Research, Inc. | 3.3% |
| Full Truck Alliance Co., Ltd. | 3.2% |
| Yantai Jereh Oilfield Services Group Co., Ltd. | 3.2% |
| Tongcheng Travel Holdings, Ltd. | 3.1% |
| Zhejiang Shuanghuan Driveline Co., Ltd. | 2.8% |
| Kanzhun, Ltd. | 2.4% |
| TOTAL | 34.5% |
Top ten holdings may combine more than one security from the same issuer and related depository receipts.
Fund Expenses for the Last Six Months
(Based on a hypothetical $10,000 investment)
| Class | Costs of a $10,000 investment | Costs paid as a percentage of a $10,000 investment |
| Investor Class | $75 | 1.43%* |
| * | Annualized. |
Key Fund Statistics
| Fund net assets | $62,281,859 |
| Total number of portfolio holdings | 57 |
| Portfolio turnover rate for the reporting period | 11.8% |
Graphical Representation of Holdings
The tables below show the investment makeup of the Fund, represented as a percentage of the total net assets of the Fund.
Top Ten Holdings
| NetEase Cloud Music, Inc. | 5.2% |
| Hongfa Technology Co., Ltd. | 4.0% |
| Atour Lifestyle Holdings, Ltd. | 3.8% |
| DPC Dash, Ltd. | 3.5% |
| ACM Research, Inc. | 3.3% |
| Full Truck Alliance Co., Ltd. | 3.2% |
| Yantai Jereh Oilfield Services Group Co., Ltd. | 3.2% |
| Tongcheng Travel Holdings, Ltd. | 3.1% |
| Zhejiang Shuanghuan Driveline Co., Ltd. | 2.8% |
| Kanzhun, Ltd. | 2.4% |
| TOTAL | 34.5% |
Country Allocation

Sector Allocation

Top ten holdings may combine more than one security from the same issuer and related depository receipts.
Top Ten Holdings
| NetEase Cloud Music, Inc. | 5.2% |
| Hongfa Technology Co., Ltd. | 4.0% |
| Atour Lifestyle Holdings, Ltd. | 3.8% |
| DPC Dash, Ltd. | 3.5% |
| ACM Research, Inc. | 3.3% |
| Full Truck Alliance Co., Ltd. | 3.2% |
| Yantai Jereh Oilfield Services Group Co., Ltd. | 3.2% |
| Tongcheng Travel Holdings, Ltd. | 3.1% |
| Zhejiang Shuanghuan Driveline Co., Ltd. | 2.8% |
| Kanzhun, Ltd. | 2.4% |
| TOTAL | 34.5% |
Top ten holdings may combine more than one security from the same issuer and related depository receipts.
Fund Expenses for the Last Six Months
(Based on a hypothetical $10,000 investment)
| Class | Costs of a $10,000 investment | Costs paid as a percentage of a $10,000 investment |
| Institutional Class | $61 | 1.16%* |
| * | Annualized. |
Key Fund Statistics
| Fund net assets | $209,956,166 |
| Total number of portfolio holdings | 60 |
| Portfolio turnover rate for the reporting period | 29.9% |
Graphical Representation of Holdings
The tables below show the investment makeup of the Fund, represented as a percentage of the total net assets of the Fund.
Top Ten Holdings
| Bandhan Bank, Ltd. | 7.8% |
| Taiwan Semiconductor Manufacturing Co., Ltd. | 6.2% |
| Meituan | 5.6% |
| Legend Biotech Corp. | 4.9% |
| JD Health International, Inc. | 4.8% |
| Indus Towers, Ltd. | 3.2% |
| Alibaba Group Holding, Ltd. | 2.9% |
| YDUQS Participacoes SA | 2.8% |
| Full Truck Alliance Co., Ltd. | 2.7% |
| Swiggy, Ltd. | 2.7% |
| TOTAL | 43.6% |
Country Allocation
Sector Allocation
Top ten holdings may combine more than one security from the same issuer and related depository receipts.
Top Ten Holdings
| Bandhan Bank, Ltd. | 7.8% |
| Taiwan Semiconductor Manufacturing Co., Ltd. | 6.2% |
| Meituan | 5.6% |
| Legend Biotech Corp. | 4.9% |
| JD Health International, Inc. | 4.8% |
| Indus Towers, Ltd. | 3.2% |
| Alibaba Group Holding, Ltd. | 2.9% |
| YDUQS Participacoes SA | 2.8% |
| Full Truck Alliance Co., Ltd. | 2.7% |
| Swiggy, Ltd. | 2.7% |
| TOTAL | 43.6% |
Top ten holdings may combine more than one security from the same issuer and related depository receipts.
Fund Expenses for the Last Six Months
(Based on a hypothetical $10,000 investment)
| Class | Costs of a $10,000 investment | Costs paid as a percentage of a $10,000 investment |
| Investor Class | $73 | 1.40%* |
| * | Annualized. |
Key Fund Statistics
| Fund net assets | $209,956,166 |
| Total number of portfolio holdings | 60 |
| Portfolio turnover rate for the reporting period | 29.9% |
Graphical Representation of Holdings
The tables below show the investment makeup of the Fund, represented as a percentage of the total net assets of the Fund.
Top Ten Holdings
| Bandhan Bank, Ltd. | 7.8% |
| Taiwan Semiconductor Manufacturing Co., Ltd. | 6.2% |
| Meituan | 5.6% |
| Legend Biotech Corp. | 4.9% |
| JD Health International, Inc. | 4.8% |
| Indus Towers, Ltd. | 3.2% |
| Alibaba Group Holding, Ltd. | 2.9% |
| YDUQS Participacoes SA | 2.8% |
| Full Truck Alliance Co., Ltd. | 2.7% |
| Swiggy, Ltd. | 2.7% |
| TOTAL | 43.6% |
Country Allocation

Sector Allocation

Top ten holdings may combine more than one security from the same issuer and related depository receipts.
Top Ten Holdings
| Bandhan Bank, Ltd. | 7.8% |
| Taiwan Semiconductor Manufacturing Co., Ltd. | 6.2% |
| Meituan | 5.6% |
| Legend Biotech Corp. | 4.9% |
| JD Health International, Inc. | 4.8% |
| Indus Towers, Ltd. | 3.2% |
| Alibaba Group Holding, Ltd. | 2.9% |
| YDUQS Participacoes SA | 2.8% |
| Full Truck Alliance Co., Ltd. | 2.7% |
| Swiggy, Ltd. | 2.7% |
| TOTAL | 43.6% |
Top ten holdings may combine more than one security from the same issuer and related depository receipts.
Fund Expenses for the Last Six Months
(Based on a hypothetical $10,000 investment)
| Class | Costs of a $10,000 investment | Costs paid as a percentage of a $10,000 investment |
| Institutional Class | $48 | 0.90%* |
| * | Annualized. |
Key Fund Statistics
| Fund net assets | $251,588,765 |
| Total number of portfolio holdings | 77 |
| Portfolio turnover rate for the reporting period | 63.2% |
Graphical Representation of Holdings
The tables below show the investment makeup of the Fund, represented as a percentage of the total net assets of the Fund.
Top Ten Holdings
| Taiwan Semiconductor Manufacturing Co., Ltd. | 10.4% |
| Tencent Holdings, Ltd. | 5.4% |
| Samsung Electronics Co., Ltd. | 3.0% |
| NetEase, Inc. | 2.3% |
| Hana Financial Group, Inc. | 2.2% |
| Alibaba Group Holding, Ltd. | 2.1% |
| HDFC Bank, Ltd. | 2.0% |
| Shriram Finance, Ltd. | 2.0% |
| Itau Unibanco Holding SA | 2.0% |
| China Construction Bank Corp. | 1.9% |
| TOTAL | 33.3% |
Country Allocation

Sector Allocation

Top ten holdings may combine more than one security from the same issuer and related depository receipts.
Top Ten Holdings
| Taiwan Semiconductor Manufacturing Co., Ltd. | 10.4% |
| Tencent Holdings, Ltd. | 5.4% |
| Samsung Electronics Co., Ltd. | 3.0% |
| NetEase, Inc. | 2.3% |
| Hana Financial Group, Inc. | 2.2% |
| Alibaba Group Holding, Ltd. | 2.1% |
| HDFC Bank, Ltd. | 2.0% |
| Shriram Finance, Ltd. | 2.0% |
| Itau Unibanco Holding SA | 2.0% |
| China Construction Bank Corp. | 1.9% |
| TOTAL | 33.3% |
Top ten holdings may combine more than one security from the same issuer and related depository receipts.
Fund Expenses for the Last Six Months
(Based on a hypothetical $10,000 investment)
| Class | Costs of a $10,000 investment | Costs paid as a percentage of a $10,000 investment |
| Investor Class | $58 | 1.10%* |
| * | Annualized. |
Key Fund Statistics
| Fund net assets | $251,588,765 |
| Total number of portfolio holdings | 77 |
| Portfolio turnover rate for the reporting period | 63.2% |
Graphical Representation of Holdings
The tables below show the investment makeup of the Fund, represented as a percentage of the total net assets of the Fund.
Top Ten Holdings
| Taiwan Semiconductor Manufacturing Co., Ltd. | 10.4% |
| Tencent Holdings, Ltd. | 5.4% |
| Samsung Electronics Co., Ltd. | 3.0% |
| NetEase, Inc. | 2.3% |
| Hana Financial Group, Inc. | 2.2% |
| Alibaba Group Holding, Ltd. | 2.1% |
| HDFC Bank, Ltd. | 2.0% |
| Shriram Finance, Ltd. | 2.0% |
| Itau Unibanco Holding SA | 2.0% |
| China Construction Bank Corp. | 1.9% |
| TOTAL | 33.3% |
Country Allocation
Sector Allocation
Top ten holdings may combine more than one security from the same issuer and related depository receipts.
Top Ten Holdings
| Taiwan Semiconductor Manufacturing Co., Ltd. | 10.4% |
| Tencent Holdings, Ltd. | 5.4% |
| Samsung Electronics Co., Ltd. | 3.0% |
| NetEase, Inc. | 2.3% |
| Hana Financial Group, Inc. | 2.2% |
| Alibaba Group Holding, Ltd. | 2.1% |
| HDFC Bank, Ltd. | 2.0% |
| Shriram Finance, Ltd. | 2.0% |
| Itau Unibanco Holding SA | 2.0% |
| China Construction Bank Corp. | 1.9% |
| TOTAL | 33.3% |
Top ten holdings may combine more than one security from the same issuer and related depository receipts.
Fund Expenses for the Last Six Months
(Based on a hypothetical $10,000 investment)
| Fund | Costs of a $10,000 investment | Costs paid as a percentage of a $10,000 investment |
| Matthews Emerging Markets Equity Active ETF | $41 | 0.79%* |
| * | Annualized. |
Key Fund Statistics
| Fund net assets | $39,528,730 |
| Total number of portfolio holdings | 70 |
| Portfolio turnover rate for the reporting period | 70.5% |
Graphical Representation of Holdings
The tables below show the investment makeup of the Fund, represented as a percentage of the total net assets of the Fund.
Top Ten Holdings *
| Taiwan Semiconductor Manufacturing Co., Ltd. | 10.2% |
| Tencent Holdings, Ltd. | 5.5% |
| HDFC Bank, Ltd. | 3.0% |
| NetEase, Inc. | 2.5% |
| JD.com, Inc. | 2.3% |
| Itau Unibanco Holding SA | 2.3% |
| Samsung Electronics Co., Ltd. | 2.3% |
| Alibaba Group Holding, Ltd. | 2.1% |
| Hana Financial Group, Inc. | 2.1% |
| China Merchants Bank Co., Ltd. | 2.1% |
| TOTAL | 34.4% |
Country Allocation
Sector Allocation
* Excludes short-term securities, if any.
Top ten holdings may combine more than one security from the same issuer and related depository receipts.
Top Ten Holdings *
| Taiwan Semiconductor Manufacturing Co., Ltd. | 10.2% |
| Tencent Holdings, Ltd. | 5.5% |
| HDFC Bank, Ltd. | 3.0% |
| NetEase, Inc. | 2.5% |
| JD.com, Inc. | 2.3% |
| Itau Unibanco Holding SA | 2.3% |
| Samsung Electronics Co., Ltd. | 2.3% |
| Alibaba Group Holding, Ltd. | 2.1% |
| Hana Financial Group, Inc. | 2.1% |
| China Merchants Bank Co., Ltd. | 2.1% |
| TOTAL | 34.4% |
* Excludes short-term securities, if any.
Top ten holdings may combine more than one security from the same issuer and related depository receipts.
Fund Expenses for the Last Six Months
(Based on a hypothetical $10,000 investment)
| Fund | Costs of a $10,000 investment | Costs paid as a percentage of a $10,000 investment |
| Matthews Asia Innovators Active ETF | $42 | 0.79%* |
| * | Annualized. |
Key Fund Statistics
| Fund net assets | $63,740,787 |
| Total number of portfolio holdings | 59 |
| Portfolio turnover rate for the reporting period | 54.8% |
Graphical Representation of Holdings
The tables below show the investment makeup of the Fund, represented as a percentage of the total net assets of the Fund.
Top Ten Holdings *
| Taiwan Semiconductor Manufacturing Co., Ltd. | 10.7% |
| Tencent Holdings, Ltd. | 6.0% |
| Sea, Ltd. | 5.6% |
| Eternal, Ltd. | 4.6% |
| Samsung Electronics Co., Ltd. | 3.5% |
| MakeMyTrip, Ltd. | 3.3% |
| Alibaba Group Holding, Ltd. | 3.0% |
| PDD Holdings, Inc. | 2.9% |
| SK Hynix, Inc. | 2.3% |
| Xiaomi Corp. | 2.0% |
| TOTAL | 43.9% |
Country Allocation
Sector Allocation
* Excludes short-term securities, if any.
Top ten holdings may combine more than one security from the same issuer and related depository receipts.
Top Ten Holdings *
| Taiwan Semiconductor Manufacturing Co., Ltd. | 10.7% |
| Tencent Holdings, Ltd. | 6.0% |
| Sea, Ltd. | 5.6% |
| Eternal, Ltd. | 4.6% |
| Samsung Electronics Co., Ltd. | 3.5% |
| MakeMyTrip, Ltd. | 3.3% |
| Alibaba Group Holding, Ltd. | 3.0% |
| PDD Holdings, Inc. | 2.9% |
| SK Hynix, Inc. | 2.3% |
| Xiaomi Corp. | 2.0% |
| TOTAL | 43.9% |
* Excludes short-term securities, if any.
Top ten holdings may combine more than one security from the same issuer and related depository receipts.
Fund Expenses for the Last Six Months
(Based on a hypothetical $10,000 investment)
| Fund | Costs of a $10,000 investment | Costs paid as a percentage of a $10,000 investment |
| Matthews China Active ETF | $41 | 0.79%* |
| * | Annualized. |
Key Fund Statistics
| Fund net assets | $20,579,534 |
| Total number of portfolio holdings | 64 |
| Portfolio turnover rate for the reporting period | 17.2% |
Graphical Representation of Holdings
The tables below show the investment makeup of the Fund, represented as a percentage of the total net assets of the Fund.
Top Ten Holdings *
| Tencent Holdings, Ltd. | 9.4% |
| Alibaba Group Holding, Ltd. | 8.0% |
| China Merchants Bank Co., Ltd. | 4.8% |
| China Construction Bank Corp. | 4.6% |
| JD.com, Inc. | 3.7% |
| PDD Holdings, Inc. | 3.5% |
| Meituan | 3.0% |
| Ping An Insurance Group Co. of China, Ltd. | 2.9% |
| DiDi Global, Inc. ADR | 2.9% |
| New China Life Insurance Co., Ltd. | 2.8% |
| TOTAL | 45.6% |
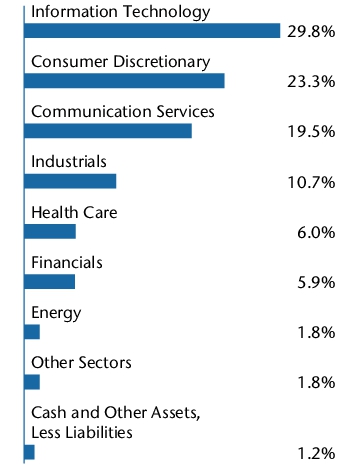
Country Allocation
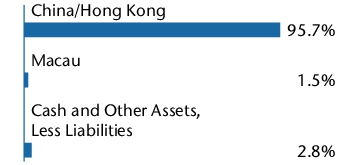
Sector Allocation
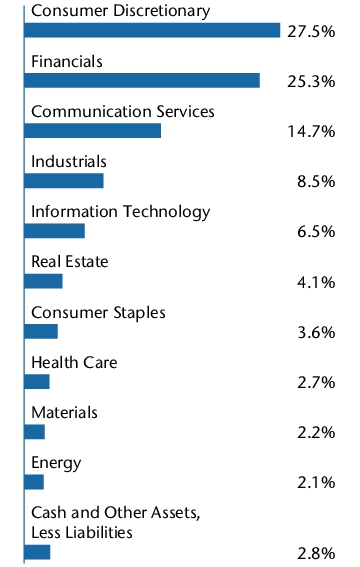
* Excludes short-term securities, if any.
Top ten holdings may combine more than one security from the same issuer and related depository receipts.
Top Ten Holdings *
| Tencent Holdings, Ltd. | 9.4% |
| Alibaba Group Holding, Ltd. | 8.0% |
| China Merchants Bank Co., Ltd. | 4.8% |
| China Construction Bank Corp. | 4.6% |
| JD.com, Inc. | 3.7% |
| PDD Holdings, Inc. | 3.5% |
| Meituan | 3.0% |
| Ping An Insurance Group Co. of China, Ltd. | 2.9% |
| DiDi Global, Inc. ADR | 2.9% |
| New China Life Insurance Co., Ltd. | 2.8% |
| TOTAL | 45.6% |
* Excludes short-term securities, if any.
Top ten holdings may combine more than one security from the same issuer and related depository receipts.
Fund Expenses for the Last Six Months
(Based on a hypothetical $10,000 investment)
| Fund | Costs of a $10,000 investment | Costs paid as a percentage of a $10,000 investment |
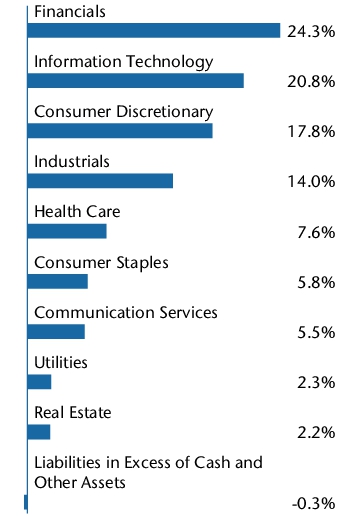
| Matthews Emerging Markets ex China Active ETF | $42 | 0.79%* |
| * | Annualized. |
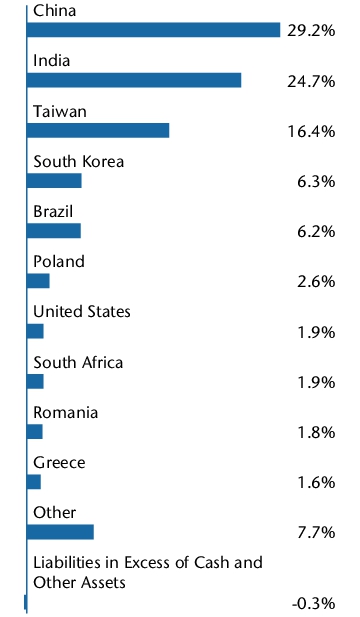
Key Fund Statistics
| Fund net assets | $35,371,803 |
| Total number of portfolio holdings | 77 |
| Portfolio turnover rate for the reporting period | 63.7% |
Graphical Representation of Holdings
The tables below show the investment makeup of the Fund, represented as a percentage of the total net assets of the Fund.
Top Ten Holdings *
| Taiwan Semiconductor Manufacturing Co., Ltd. | 12.7% |
| Samsung Electronics Co., Ltd. | 4.0% |
| HDFC Bank, Ltd. | 2.4% |
| ICICI Bank, Ltd. | 2.3% |
| Bandhan Bank, Ltd. | 2.0% |
| PT Indosat Tbk | 1.8% |
| NAVER Corp. | 1.7% |
| SK Hynix, Inc. | 1.7% |
| Grab Holdings, Ltd. | 1.6% |
| Bharti Airtel, Ltd. | 1.6% |
| TOTAL | 31.8% |
Country Allocation
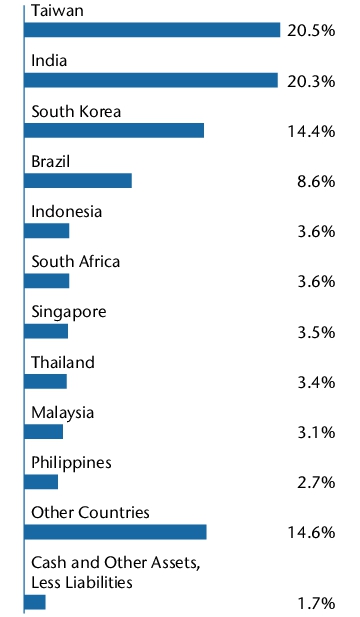
Sector Allocation
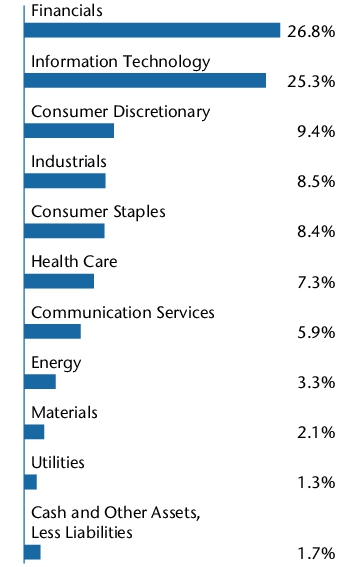
* Excludes short-term securities, if any.
Top ten holdings may combine more than one security from the same issuer and related depository receipts.
Top Ten Holdings *
| Taiwan Semiconductor Manufacturing Co., Ltd. | 12.7% |
| Samsung Electronics Co., Ltd. | 4.0% |
| HDFC Bank, Ltd. | 2.4% |
| ICICI Bank, Ltd. | 2.3% |
| Bandhan Bank, Ltd. | 2.0% |
| PT Indosat Tbk | 1.8% |
| NAVER Corp. | 1.7% |
| SK Hynix, Inc. | 1.7% |
| Grab Holdings, Ltd. | 1.6% |
| Bharti Airtel, Ltd. | 1.6% |
| TOTAL | 31.8% |
* Excludes short-term securities, if any.
Top ten holdings may combine more than one security from the same issuer and related depository receipts.
Fund Expenses for the Last Six Months
(Based on a hypothetical $10,000 investment)
| Fund | Costs of a $10,000 investment | Costs paid as a percentage of a $10,000 investment |
| Matthews Korea Active ETF | $46 | 0.79%* |
| * | Annualized. |
Key Fund Statistics
| Fund net assets | $57,503,881 |
| Total number of portfolio holdings | 44 |
| Portfolio turnover rate for the reporting period | 26.7% |
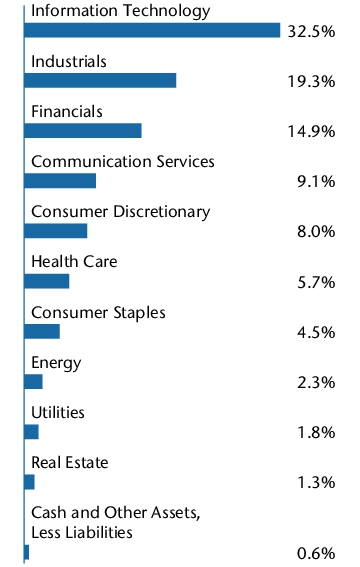
Graphical Representation of Holdings
The tables below show the investment makeup of the Fund, represented as a percentage of the total net assets of the Fund.
Top Ten Holdings *
| SK Hynix, Inc. | 9.7% |
| Samsung Electronics Co., Ltd. | 7.8% |
| Samsung Electronics Co., Ltd., Pfd. | 7.3% |
| NAVER Corp. | 4.5% |
| KB Financial Group, Inc. | 4.5% |
| Hana Financial Group, Inc. | 4.4% |
| HD HYUNDAI MIPO | 3.2% |
| SK Square Co., Ltd. | 3.1% |
| KT&G Corp. | 3.0% |
| Samsung Biologics Co., Ltd. | 2.9% |
| TOTAL | 50.4% |
Country Allocation
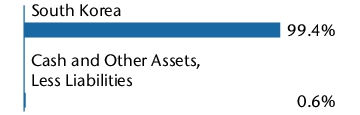
Sector Allocation
* Excludes short-term securities, if any.
Top ten holdings may combine more than one security from the same issuer and related depository receipts.
Top Ten Holdings *
| SK Hynix, Inc. | 9.7% |
| Samsung Electronics Co., Ltd. | 7.8% |
| Samsung Electronics Co., Ltd., Pfd. | 7.3% |
| NAVER Corp. | 4.5% |
| KB Financial Group, Inc. | 4.5% |
| Hana Financial Group, Inc. | 4.4% |
| HD HYUNDAI MIPO | 3.2% |
| SK Square Co., Ltd. | 3.1% |
| KT&G Corp. | 3.0% |
| Samsung Biologics Co., Ltd. | 2.9% |
| TOTAL | 50.4% |
* Excludes short-term securities, if any.
Top ten holdings may combine more than one security from the same issuer and related depository receipts.
Fund Expenses for the Last Six Months
(Based on a hypothetical $10,000 investment)
| Fund | Costs of a $10,000 investment | Costs paid as a percentage of a $10,000 investment |
| Matthews Emerging Markets Sustainable Future Active ETF | $42 | 0.79%* |
| * | Annualized. |
Key Fund Statistics
| Fund net assets | $28,827,281 |
| Total number of portfolio holdings | 58 |
| Portfolio turnover rate for the reporting period | 27.8% |
Graphical Representation of Holdings
The tables below show the investment makeup of the Fund, represented as a percentage of the total net assets of the Fund.
Top Ten Holdings *
| Bandhan Bank, Ltd. | 7.6% |
| Taiwan Semiconductor Manufacturing Co., Ltd. | 6.9% |
| Meituan | 5.3% |
| Legend Biotech Corp. | 4.9% |
| JD Health International, Inc. | 4.9% |
| Indus Towers, Ltd. | 3.4% |
| Full Truck Alliance Co., Ltd. | 3.2% |
| YDUQS Participacoes SA | 2.6% |
| Elite Material Co., Ltd. | 2.6% |
| Swiggy, Ltd. | 2.5% |
| TOTAL | 43.9% |
Country Allocation
Sector Allocation
* Excludes short-term securities, if any.
Top ten holdings may combine more than one security from the same issuer and related depository receipts.
Top Ten Holdings *
| Bandhan Bank, Ltd. | 7.6% |
| Taiwan Semiconductor Manufacturing Co., Ltd. | 6.9% |
| Meituan | 5.3% |
| Legend Biotech Corp. | 4.9% |
| JD Health International, Inc. | 4.9% |
| Indus Towers, Ltd. | 3.4% |
| Full Truck Alliance Co., Ltd. | 3.2% |
| YDUQS Participacoes SA | 2.6% |
| Elite Material Co., Ltd. | 2.6% |
| Swiggy, Ltd. | 2.5% |
| TOTAL | 43.9% |
* Excludes short-term securities, if any.
Top ten holdings may combine more than one security from the same issuer and related depository receipts.
Fund Expenses for the Last Six Months
(Based on a hypothetical $10,000 investment)
| Fund | Costs of a $10,000 investment | Costs paid as a percentage of a $10,000 investment |
| Matthews Pacific Tiger Active ETF | $41 | 0.79%* |
| * | Annualized. |
Key Fund Statistics
| Fund net assets | $36,432,690 |
| Total number of portfolio holdings | 76 |
| Portfolio turnover rate for the reporting period | 83.5% |
Graphical Representation of Holdings
The tables below show the investment makeup of the Fund, represented as a percentage of the total net assets of the Fund.
Top Ten Holdings *
| Taiwan Semiconductor Manufacturing Co., Ltd. | 12.1% |
| Tencent Holdings, Ltd. | 5.8% |
| China Merchants Bank Co., Ltd. | 3.8% |
| Alibaba Group Holding, Ltd. | 3.8% |
| KB Financial Group, Inc. | 3.2% |
| Samsung Electronics Co., Ltd. | 3.1% |
| Bharti Airtel, Ltd. | 2.8% |
| SK Hynix, Inc. | 2.7% |
| Sea, Ltd. | 2.5% |
| Eternal, Ltd. | 2.5% |
| TOTAL | 42.3% |
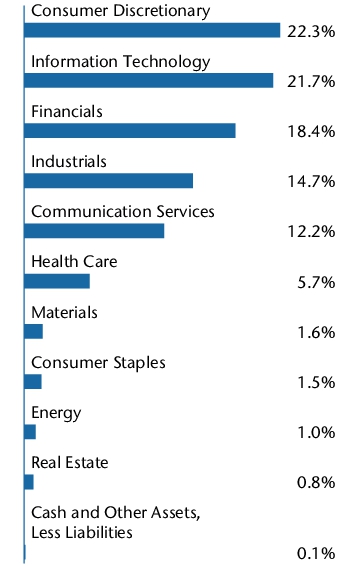
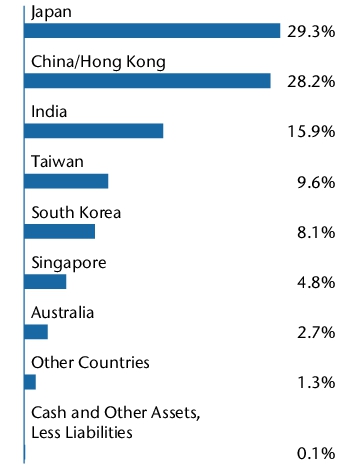
Country Allocation
Sector Allocation
* Excludes short-term securities, if any.
Top ten holdings may combine more than one security from the same issuer and related depository receipts.
Top Ten Holdings *
| Taiwan Semiconductor Manufacturing Co., Ltd. | 12.1% |
| Tencent Holdings, Ltd. | 5.8% |
| China Merchants Bank Co., Ltd. | 3.8% |
| Alibaba Group Holding, Ltd. | 3.8% |
| KB Financial Group, Inc. | 3.2% |
| Samsung Electronics Co., Ltd. | 3.1% |
| Bharti Airtel, Ltd. | 2.8% |
| SK Hynix, Inc. | 2.7% |
| Sea, Ltd. | 2.5% |
| Eternal, Ltd. | 2.5% |
| TOTAL | 42.3% |
* Excludes short-term securities, if any.
Top ten holdings may combine more than one security from the same issuer and related depository receipts.
Fund Expenses for the Last Six Months
(Based on a hypothetical $10,000 investment)
| Fund | Costs of a $10,000 investment | Costs paid as a percentage of a $10,000 investment |
| Matthews India Active ETF | $39 | 0.79%* |
| * | Annualized. |
Key Fund Statistics
| Fund net assets | $14,470,496 |
| Total number of portfolio holdings | 63 |
| Portfolio turnover rate for the reporting period | 38.1% |
Graphical Representation of Holdings
The tables below show the investment makeup of the Fund, represented as a percentage of the total net assets of the Fund.
Top Ten Holdings *
| HDFC Bank, Ltd. | 8.4% |
| ICICI Bank, Ltd. | 6.3% |
| Eternal, Ltd. | 5.6% |
| Shriram Finance, Ltd. | 4.7% |
| Bajaj Finance, Ltd. | 4.4% |
| Swiggy, Ltd. | 4.4% |
| Reliance Industries, Ltd. | 3.8% |
| Infosys, Ltd. | 3.7% |
| Bharti Airtel, Ltd. | 3.4% |
| Cholamandalam Investment and Finance Co., Ltd. | 2.8% |
| TOTAL | 47.5% |
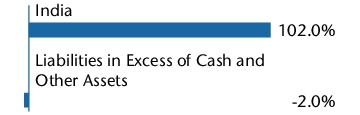
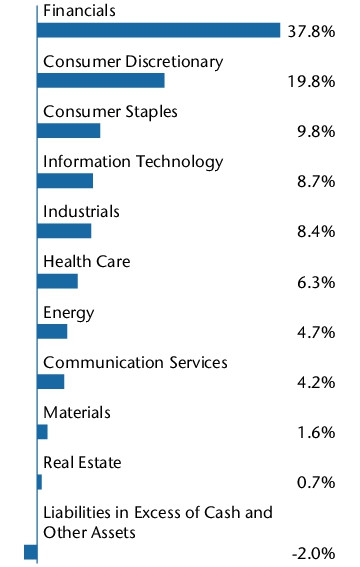
Country Allocation
Sector Allocation
* Excludes short-term securities, if any.
Top ten holdings may combine more than one security from the same issuer and related depository receipts.
Top Ten Holdings *
| HDFC Bank, Ltd. | 8.4% |
| ICICI Bank, Ltd. | 6.3% |
| Eternal, Ltd. | 5.6% |
| Shriram Finance, Ltd. | 4.7% |
| Bajaj Finance, Ltd. | 4.4% |
| Swiggy, Ltd. | 4.4% |
| Reliance Industries, Ltd. | 3.8% |
| Infosys, Ltd. | 3.7% |
| Bharti Airtel, Ltd. | 3.4% |
| Cholamandalam Investment and Finance Co., Ltd. | 2.8% |
| TOTAL | 47.5% |
* Excludes short-term securities, if any.
Top ten holdings may combine more than one security from the same issuer and related depository receipts.
Fund Expenses for the Last Six Months
(Based on a hypothetical $10,000 investment)
| Fund | Costs of a $10,000 investment | Costs paid as a percentage of a $10,000 investment |
| Matthews Japan Active ETF | $42 | 0.79%* |
| * | Annualized. |
Key Fund Statistics
| Fund net assets | $5,555,717 |
| Total number of portfolio holdings | 50 |
| Portfolio turnover rate for the reporting period | 60.4% |
Graphical Representation of Holdings
The tables below show the investment makeup of the Fund, represented as a percentage of the total net assets of the Fund.
Top Ten Holdings *
| Sony Group Corp. | 5.8% |
| Tokio Marine Holdings, Inc. | 4.5% |
| Mitsubishi UFJ Financial Group, Inc. | 4.4% |
| Hitachi, Ltd. | 4.3% |
| Tokyo Electron, Ltd. | 4.1% |
| NEC Corp. | 3.2% |
| Shin-Etsu Chemical Co., Ltd. | 3.1% |
| Ajinomoto Co., Inc. | 3.1% |
| ITOCHU Corp. | 2.9% |
| Mitsui Fudosan Co., Ltd. | 2.9% |
| TOTAL | 38.3% |
Country Allocation
Sector Allocation
* Excludes short-term securities, if any.
Top ten holdings may combine more than one security from the same issuer and related depository receipts.
Top Ten Holdings *
| Sony Group Corp. | 5.8% |
| Tokio Marine Holdings, Inc. | 4.5% |
| Mitsubishi UFJ Financial Group, Inc. | 4.4% |
| Hitachi, Ltd. | 4.3% |
| Tokyo Electron, Ltd. | 4.1% |
| NEC Corp. | 3.2% |
| Shin-Etsu Chemical Co., Ltd. | 3.1% |
| Ajinomoto Co., Inc. | 3.1% |
| ITOCHU Corp. | 2.9% |
| Mitsui Fudosan Co., Ltd. | 2.9% |
| TOTAL | 38.3% |
* Excludes short-term securities, if any.
Top ten holdings may combine more than one security from the same issuer and related depository receipts.
Fund Expenses for the Last Six Months
(Based on a hypothetical $10,000 investment)
| Fund | Costs of a $10,000 investment | Costs paid as a percentage of a $10,000 investment |
| Matthews Asia Dividend Active ETF | $42 | 0.79%* |
| * | Annualized. |
Key Fund Statistics
| Fund net assets | $3,566,986 |
| Total number of portfolio holdings | 67 |
| Portfolio turnover rate for the reporting period | 48.2% |
Graphical Representation of Holdings
The tables below show the investment makeup of the Fund, represented as a percentage of the total net assets of the Fund.
Top Ten Holdings *
| Taiwan Semiconductor Manufacturing Co., Ltd. | 8.3% |
| Tencent Holdings, Ltd. | 4.7% |
| Hana Financial Group, Inc. | 3.2% |
| ITOCHU Corp. | 2.2% |
| NEC Corp. | 2.0% |
| AIA Group, Ltd. | 2.0% |
| Ajinomoto Co., Inc. | 1.8% |
| Commonwealth Bank of Australia | 1.8% |
| HDFC Bank, Ltd. | 1.8% |
| NetEase, Inc. | 1.7% |
| TOTAL | 29.5% |
Country Allocation
Sector Allocation
* Excludes short-term securities, if any.
Top ten holdings may combine more than one security from the same issuer and related depository receipts.
Top Ten Holdings *
| Taiwan Semiconductor Manufacturing Co., Ltd. | 8.3% |
| Tencent Holdings, Ltd. | 4.7% |
| Hana Financial Group, Inc. | 3.2% |
| ITOCHU Corp. | 2.2% |
| NEC Corp. | 2.0% |
| AIA Group, Ltd. | 2.0% |
| Ajinomoto Co., Inc. | 1.8% |
| Commonwealth Bank of Australia | 1.8% |
| HDFC Bank, Ltd. | 1.8% |
| NetEase, Inc. | 1.7% |
| TOTAL | 29.5% |
* Excludes short-term securities, if any.
Top ten holdings may combine more than one security from the same issuer and related depository receipts.
Fund Expenses for the Last Six Months
(Based on a hypothetical $10,000 investment)
| Fund | Costs of a $10,000 investment | Costs paid as a percentage of a $10,000 investment |
| Matthews Emerging Markets Discovery Active ETF | $46 | 0.89%* |
| * | Annualized. |
Key Fund Statistics
| Fund net assets | $18,797,035 |
| Total number of portfolio holdings | 77 |
| Portfolio turnover rate for the reporting period | 19.3% |
Graphical Representation of Holdings
The tables below show the investment makeup of the Fund, represented as a percentage of the total net assets of the Fund.
Top Ten Holdings *
| Bandhan Bank, Ltd. | 7.9% |
| Hugel, Inc. | 5.1% |
| Legend Biotech Corp. | 4.8% |
| YDUQS Participacoes SA | 2.7% |
| We Buy Cars Holdings, Ltd. | 2.4% |
| Radico Khaitan, Ltd. | 2.3% |
| Full Truck Alliance Co., Ltd. | 2.3% |
| Grupo SBF SA | 2.3% |
| Cartrade Tech, Ltd. | 2.2% |
| Elite Material Co., Ltd. | 1.9% |
| TOTAL | 33.9% |
Country Allocation
Sector Allocation
* Excludes short-term securities, if any.
Top ten holdings may combine more than one security from the same issuer and related depository receipts.
Top Ten Holdings *
| Bandhan Bank, Ltd. | 7.9% |
| Hugel, Inc. | 5.1% |
| Legend Biotech Corp. | 4.8% |
| YDUQS Participacoes SA | 2.7% |
| We Buy Cars Holdings, Ltd. | 2.4% |
| Radico Khaitan, Ltd. | 2.3% |
| Full Truck Alliance Co., Ltd. | 2.3% |
| Grupo SBF SA | 2.3% |
| Cartrade Tech, Ltd. | 2.2% |
| Elite Material Co., Ltd. | 1.9% |
| TOTAL | 33.9% |
* Excludes short-term securities, if any.
Top ten holdings may combine more than one security from the same issuer and related depository receipts.
Fund Expenses for the Last Six Months
(Based on a hypothetical $10,000 investment)
| Fund | Costs of a $10,000 investment | Costs paid as a percentage of a $10,000 investment |
| Matthews China Discovery Active ETF | $47 | 0.89%* |
| * | Annualized. |
Key Fund Statistics
| Fund net assets | $2,313,414 |
| Total number of portfolio holdings | 57 |
| Portfolio turnover rate for the reporting period | 15.0% |
Graphical Representation of Holdings
The tables below show the investment makeup of the Fund, represented as a percentage of the total net assets of the Fund.
Top Ten Holdings *
| NetEase Cloud Music, Inc. | 4.5% |
| Hongfa Technology Co., Ltd. | 3.6% |
| Atour Lifestyle Holdings, Ltd. | 3.3% |
| DPC Dash, Ltd. | 3.2% |
| ACM Research, Inc. | 2.9% |
| Yantai Jereh Oilfield Services Group Co., Ltd. | 2.7% |
| Tongcheng Travel Holdings, Ltd. | 2.7% |
| Sichuan Kelun-Biotech Biopharmaceutical Co., Ltd. | 2.7% |
| Zhejiang Shuanghuan Driveline Co., Ltd. | 2.5% |
| Full Truck Alliance Co., Ltd. | 2.5% |
| TOTAL | 30.6% |
Country Allocation
Sector Allocation
* Excludes short-term securities, if any.
Top ten holdings may combine more than one security from the same issuer and related depository receipts.
Top Ten Holdings *
| NetEase Cloud Music, Inc. | 4.5% |
| Hongfa Technology Co., Ltd. | 3.6% |
| Atour Lifestyle Holdings, Ltd. | 3.3% |
| DPC Dash, Ltd. | 3.2% |
| ACM Research, Inc. | 2.9% |
| Yantai Jereh Oilfield Services Group Co., Ltd. | 2.7% |
| Tongcheng Travel Holdings, Ltd. | 2.7% |
| Sichuan Kelun-Biotech Biopharmaceutical Co., Ltd. | 2.7% |
| Zhejiang Shuanghuan Driveline Co., Ltd. | 2.5% |
| Full Truck Alliance Co., Ltd. | 2.5% |
| TOTAL | 30.6% |
* Excludes short-term securities, if any.
Top ten holdings may combine more than one security from the same issuer and related depository receipts.
| [1] | Annualized. |
| [2] | Annualized. |
| [3] | Annualized. |
| [4] | Annualized. |
| [5] | Annualized. |
| [6] | Annualized. |
| [7] | Annualized. |
| [8] | Annualized. |
| [9] | Annualized. |
| [10] | Annualized. |
| [11] | Annualized. |
| [12] | Annualized. |
| [13] | Annualized. |
| [14] | Annualized. |
| [15] | Annualized. |
| [16] | Annualized. |
| [17] | Annualized. |
| [18] | Annualized. |
| [19] | Annualized. |
| [20] | Annualized. |
| [21] | Annualized. |
| [22] | Annualized. |
| [23] | Annualized. |
| [24] | Annualized. |
| [25] | Annualized. |
| [26] | Annualized. |
| [27] | Annualized. |
| [28] | Annualized. |
| [29] | Annualized. |
| [30] | Annualized. |
| [31] | Annualized. |
| [32] | Annualized. |
| [33] | Annualized. |
| [34] | Annualized. |
| [35] | Annualized. |
| [36] | Annualized. |