v3.25.2
Shareholder Report
12 Months Ended
Jun. 30, 2025
USD ($)
Holdings
Shareholder Report [Line Items]  
Document Type N-CSR
Amendment Flag false
Registrant Name AGF Investments Trust
Entity Central Index Key 0001479599
Entity Investment Company Type N-1A
Document Period End Date Jun. 30, 2025
AGF U.S. Market Neutral Anti-Beta Fund  
Shareholder Report [Line Items]  
Fund Name AGF U.S. Market Neutral Anti-Beta Fund
Class Name AGF U.S. Market Neutral Anti-Beta Fund
Trading Symbol BTAL
Security Exchange Name NYSEArca
Annual or Semi-Annual Statement [Text Block] This annual shareholder report contains important information about AGF U.S. Market Neutral Anti-Beta Fund for the period July 1, 2024 to June 30, 2025.
Shareholder Report Annual or Semi-Annual annual shareholder report
Additional Information [Text Block] You can find additional information about the Fund at https://www.agf.com/us/products/btal/index.jsp . You can also request this information by contacting us toll-free at 1-888-893-2202.
Additional Information Phone Number 1-888-893-2202
Additional Information Website https://www.agf.com/us/products/btal/index.jsp
Expenses [Text Block]

What were the Fund's costs for the last year? 

(based on a hypothetical $10,000 investment) 

Fund Ticker Costs of a $10,000 investment* Costs paid as a percentage of a $10,000 investment*
BTAL $135 1.40%
     
*This includes short expenses
Expenses Paid, Amount $ 135 [1]
Expense Ratio, Percent 1.40% [1]
Factors Affecting Performance [Text Block]


How did the Fund perform last year? 


The AGF U.S. Market Neutral Anti-Beta Fund (“BTAL” or the“Fund”) finished the reporting period (July 01, 2024 to Jun 30. 2025) down -6.23%. The Fund had a negative return over the 12- month period but outperformed its benchmark index the Dow Jones U.S. Thematic Market Neutral Low Beta Index, which returned -8.97% during that period. The broad U.S. equity market, as represented by the Standard and Poor’s (S&P) 500 Index, finished the reporting period with a return of 15.16%. During the reporting period, the broad U.S. equity market generally trended upwards but at times exhibited some volatility, especially in April 2025 around the announcement of Liberation Day tariffs. During these periods of volatility, BTAL performed as expected and reduced drawdowns compared to pure broad equity market exposure. However, given the general upward trend in the U.S. equity market, BTAL underperformed the S&P 500 for the overall reporting period due to its objective of providing consistent negative beta exposure to the U.S. equity market and its inherent anti-beta bias.


Performance Past Does Not Indicate Future [Text] The fund's past performance is not a good predictor of how the fund will perform in the future.
Line Graph [Table Text Block]

How did the Fund perform over the past 10 years?


The chart below shows the Fund’s performance over the last 10 years and is based on the Fund’s net asset value (“NAV”).


Total Return Based on a $10,000 Investment
 
 
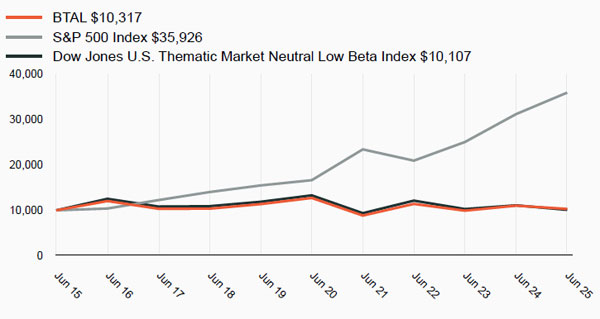
The above chart represents historical performance of a hypothetical $10,000 investment in the Fund over the past 10 years. The fund's past performance is not a good predictor of how the fund will perform in the future. The chart and Average Annual Total Return table below do not reflect the deduction of taxes that a shareholder would pay on Fund distributions or redemption of Fund shares.


   BTAL   S&P 500 Index   Dow Jones U.S. Thematic Market Neutral Low Beta Index 
6/30/2015 10,000 10,000 10,000
7/31/2015 10,315 10,210 10,378
8/31/2015 10,475 9,594 10,534
9/30/2015 10,950 9,356 11,067
10/31/2015 10,418 10,145 10,603
11/30/2015 10,346 10,176 10,618
12/31/2015 10,708 10,015 11,013
1/31/2016 11,670 9,518 12,039
2/29/2016 11,702 9,505 12,136
3/31/2016 11,438 10,150 11,850
4/30/2016 11,067 10,189 11,475
5/31/2016 11,098 10,372 11,543
6/30/2016 12,049 10,399 12,541
7/31/2016 11,329 10,783 11,790
8/31/2016 11,061 10,798 11,530
9/30/2016 10,890 10,800 11,331
10/31/2016 11,077 10,603 11,564
11/30/2016 10,042 10,996 10,487
12/31/2016 10,203 11,213 10,667
1/31/2017 9,980 11,426 10,440
2/28/2017 9,990 11,879 10,453
3/31/2017 10,223 11,893 10,692
4/30/2017 10,389 12,015 10,875
5/31/2017 10,668 12,184 11,182
6/30/2017 10,343 12,260 10,831
7/31/2017 10,333 12,512 10,826
8/31/2017 10,384 12,551 10,893
9/30/2017 9,981 12,810 10,474
10/31/2017 10,017 13,109 10,516
11/30/2017 9,924 13,511 10,418
12/31/2017 9,919 13,661 10,429
1/31/2018 9,699 14,443 10,199
2/28/2018 9,673 13,911 10,175
3/31/2018 9,965 13,557 10,492
4/30/2018 10,026 13,609 10,555
5/31/2018 9,968 13,937 10,492
6/30/2018 10,366 14,023 10,911
7/31/2018 10,286 14,544 10,824
8/31/2018 10,419 15,018 10,959
9/30/2018 10,472 15,104 11,016
10/31/2018 10,960 14,072 11,542
11/30/2018 10,987 14,358 11,565
12/31/2018 11,412 13,062 12,010
1/31/2019 11,011 14,109 11,580
2/28/2019 10,901 14,562 11,460
3/31/2019 11,168 14,845 11,739
4/30/2019 11,028 15,446 11,575
5/31/2019 11,781 14,464 12,361
6/30/2019 11,333 15,483 11,880
7/31/2019 11,551 15,706 12,094
8/31/2019 12,571 15,454 13,163
9/30/2019 12,280 15,743 12,851
10/31/2019 12,233 16,084 12,788
11/30/2019 11,885 16,668 12,443
12/31/2019 11,606 17,171 12,146
1/31/2020 12,252 17,164 12,818
2/29/2020 12,339 15,751 12,906
3/31/2020 13,415 13,806 14,035
4/30/2020 12,990 15,575 13,592
5/31/2020 13,141 16,317 13,771
6/30/2020 12,698 16,642 13,297
7/31/2020 13,026 17,580 13,713
8/31/2020 12,419 18,844 13,102
9/30/2020 12,361 18,128 13,053
10/31/2020 12,010 17,646 12,701
11/30/2020 10,266 19,576 10,814
12/31/2020 10,008 20,329 10,555
1/31/2021 10,152 20,124 10,711
2/28/2021 9,038 20,679 9,541
3/31/2021 8,984 21,584 9,495
4/30/2021 8,874 22,736 9,385
5/31/2021 8,703 22,895 9,207
6/30/2021 8,847 23,430 9,368
7/31/2021 8,983 23,986 9,516
8/31/2021 8,970 24,715 9,509
9/30/2021 8,949 23,566 9,496
10/31/2021 8,761 25,217 9,299
11/30/2021 8,934 25,042 9,479
12/31/2021 9,277 26,165 9,856
1/31/2022 9,760 24,811 10,366
2/28/2022 9,385 24,068 9,972
3/31/2022 9,607 24,961 10,220
4/30/2022 10,376 22,785 11,042
5/31/2022 10,615 22,826 11,306
6/30/2022 11,380 20,942 12,136
7/31/2022 10,474 22,873 11,138
8/31/2022 10,322 21,940 10,984
9/30/2022 10,657 19,920 11,365
10/31/2022 10,867 21,533 11,614
11/30/2022 10,788 22,736 11,570
12/31/2022 11,213 21,426 12,110
1/31/2023 10,467 22,772 10,867
2/28/2023 10,430 22,217 11,027
3/31/2023 10,769 23,032 11,364
4/30/2023 11,107 23,392 11,714
5/31/2023 10,472 23,493 10,898
6/30/2023 9,933 25,046 10,281
7/31/2023 9,425 25,850 9,508
8/31/2023 9,949 25,439 10,160
9/30/2023 10,472 24,226 10,692
10/31/2023 11,181 23,717 11,420
11/30/2023 10,636 25,882 10,890
12/31/2023 9,548 27,058 9,726
1/31/2024 10,346 27,513 10,579
2/29/2024 10,199 28,982 10,388
3/31/2024 10,183 29,915 10,383
4/30/2024 10,660 28,693 10,864
5/31/2024 10,846 30,115 10,946
6/30/2024 11,003 31,196 11,102
7/31/2024 10,902 31,576 10,940
8/31/2024 11,290 32,342 11,321
9/30/2024 11,059 33,032 11,064
10/31/2024 11,121 32,733 11,123
11/30/2024 10,565 34,654 10,522
12/31/2024 10,788 33,828 10,703
1/31/2025 10,596 34,770 10,502
2/28/2025 11,306 34,317 11,182
3/31/2025 12,091 32,383 11,924
4/30/2025 11,748 32,163 11,558
5/31/2025 11,189 34,188 10,996
6/30/2025 10,317 35,926 10,107
Average Annual Return [Table Text Block]

Average Annual Total Returns
  1 Year 5 years 10 Years
BTAL NAV Return -6.23% -4.07% 0.31%
S&P 500 Index 15.16% 16.64% 13.64%
       
Dow Jones U.S. Thematic Market Neutral Low Beta Index -8.97% -5.34% 0.11%


No Deduction of Taxes [Text Block] The chart and Average Annual Total Return table below do not reflect the deduction of taxes that a shareholder would pay on Fund distributions or redemption of Fund shares.
Net Assets $ 296,220,413
Holdings Count | Holdings 403
Advisory Fees Paid, Amount $ 705,068
Investment Company, Portfolio Turnover 93.00%
Additional Fund Statistics [Text Block]
Key Fund Statistics  
     
Net Assets $296,220,413  
Number of Portfolio Holdings 403  
Portfolio Turnover Rate 93%  
Net Investment Advisory Fees $705,068  
Holdings [Text Block]


Fund Sector Weights (Based on Net Assets)
  % of Long Weight % of Short Weight
     
Communication Services 3.9% -4.1%
Consumer Discretionary 10.7% -11.5%
Consumer Staples 5.1% -5.5%
Energy 3.9% -3.8%
Financials 14.7% -16.6%
Health Care 10.2% -11.2%
Industrials 16.4% -17.8%
Information Technology 13.2% -14.9%
Materials 5.1% -5.0%
Real Estate 5.6% -5.9%
Utilities 4.1% -4.5%


Largest Holdings [Text Block]

Top Ten Holdings (Based on Net Assets)
Long     Short  
HEICO Corp. 0.6%   Joby Aviation, Inc. -0.7%
Iridium Communications, Inc. 0.5%   Insmed, Inc. -0.7%
International Business Machines Corp. 0.5%   Reddit, Inc. -0.7%
Guidewire Software, Inc. 0.5%   Robinhood Markets, Inc. -0.7%
Dollar General Corp. 0.5%   SoFi Technologies, Inc. -0.6%
Sunrun, Inc. 0.5%   Coinbase Global, Inc. -0.6%
Bentley Systems, Inc. 0.5%   Affirm Holdings, Inc. -0.6%
Juniper Networks, Inc. 0.5%   elf Beauty, Inc. -0.6%
Royalty Pharma plc 0.5%   Guardant Health, Inc. -0.6%
RTX Corp. 0.5%   CRISPR Therapeutics AG -0.6%


[1] This includes short expenses