Shareholder Report
Jun. 30, 2025
USD ($)
Holding
Shareholder Report |
6 Months Ended |
|---|---|
|
Jun. 30, 2025
USD ($)
Holding
| |
| Shareholder Report [Line Items] | |
| Document Type | N-CSRS |
| Amendment Flag | false |
| Registrant Name | Timothy Plan |
| Entity Central Index Key | 0000916490 |
| Entity Investment Company Type | N-1A |
| Document Period End Date | Jun. 30, 2025 |
| C000206641 | |
| Shareholder Report [Line Items] | |
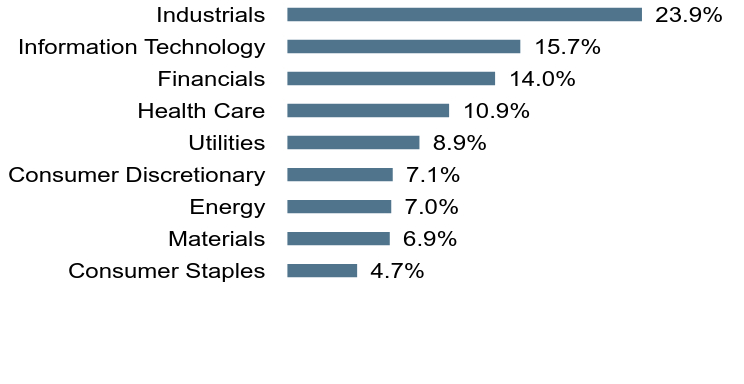
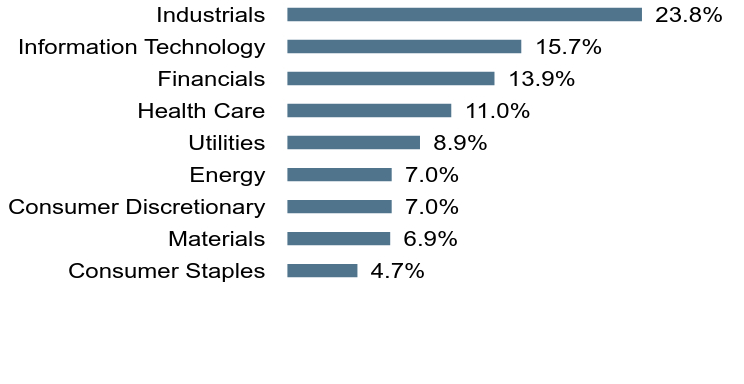
| Fund Name | Timothy Plan US Large/Mid Cap Core ETF |
| Trading Symbol | TPLC |
| Security Exchange Name | NYSE |
| Annual or Semi-Annual Statement [Text Block] | The semi-annual shareholder report contains important information about Timothy Plan US Large/Mid Cap Core ETF (the "Fund") for the period of January 1, 2025 to June 30, 2025. |
| Shareholder Report Annual or Semi-Annual | Semi-annual shareholder report |
| Additional Information [Text Block] | You can find additional information about the Fund at etf.timothyplan.com. You may also request more information by calling 800.846.7526 or visiting timothyplan.com/contact-us. |
| Additional Information Phone Number | 800.846.7526 |
| Additional Information Website | <span style="box-sizing: border-box; color: rgb(0, 0, 0); display: inline; flex-wrap: nowrap; font-size: 12px; font-weight: 400; grid-area: auto; line-height: 18px; margin: 0px; overflow: visible; text-align: left; text-align-last: auto; white-space-collapse: preserve-breaks;">etf.timothyplan.com</span> |
| Expenses [Text Block] | |
| Expenses Paid, Amount | $ 26 |
| Expense Ratio, Percent | 0.52% |
| AssetsNet | $ 305,431,202 |
| Holdings Count | Holding | 281 |
| InvestmentCompanyPortfolioTurnover | 18.00% |
| Additional Fund Statistics [Text Block] | |
| Holdings [Text Block] | |
| Updated Prospectus Web Address | Prospectus |
| C000206644 | |
| Shareholder Report [Line Items] | |
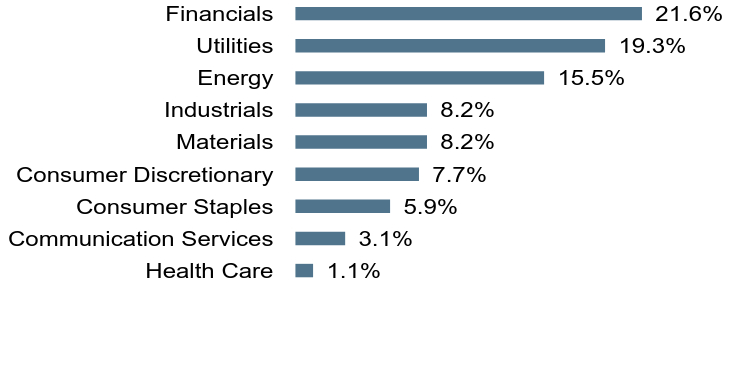
| Fund Name | Timothy Plan High Dividend Stock ETF |
| Trading Symbol | TPHD |
| Security Exchange Name | NYSE |
| Annual or Semi-Annual Statement [Text Block] | The semi-annual shareholder report contains important information about Timothy Plan High Dividend Stock ETF (the "Fund") for the period of January 1, 2025 to June 30, 2025. |
| Shareholder Report Annual or Semi-Annual | Semi-annual shareholder report |
| Additional Information [Text Block] | You can find additional information about the Fund at etf.timothyplan.com. You may also request more information by calling 800.846.7526 or visiting timothyplan.com/contact-us. |
| Additional Information Phone Number | 800.846.7526 |
| Additional Information Website | <span style="box-sizing: border-box; color: rgb(0, 0, 0); display: inline; flex-wrap: nowrap; font-size: 12px; font-weight: 400; grid-area: auto; line-height: 18px; margin: 0px; overflow: visible; text-align: left; text-align-last: auto; white-space-collapse: preserve-breaks;">etf.timothyplan.com</span> |
| Expenses [Text Block] | |
| Expenses Paid, Amount | $ 26 |
| Expense Ratio, Percent | 0.52% |
| AssetsNet | $ 300,827,093 |
| Holdings Count | Holding | 101 |
| InvestmentCompanyPortfolioTurnover | 24.00% |
| Additional Fund Statistics [Text Block] | |
| Holdings [Text Block] | |
| Updated Prospectus Web Address | Prospectus |
| C000206642 | |
| Shareholder Report [Line Items] | |
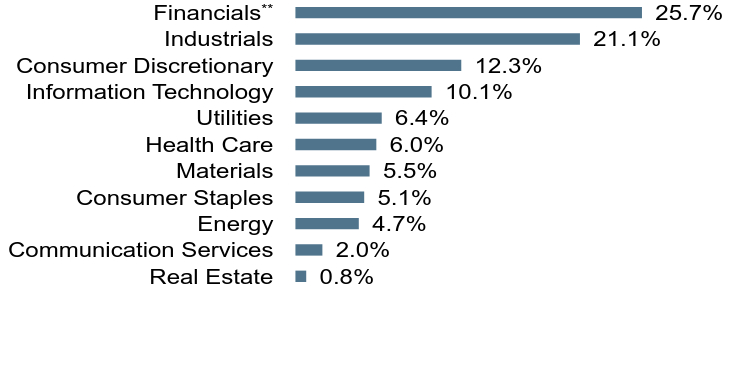
| Fund Name | Timothy Plan US Small Cap Core ETF |
| Trading Symbol | TPSC |
| Security Exchange Name | NYSE |
| Annual or Semi-Annual Statement [Text Block] | The semi-annual shareholder report contains important information about Timothy Plan US Small Cap Core ETF (the "Fund") for the period of January 1, 2025 to June 30, 2025. |
| Shareholder Report Annual or Semi-Annual | Semi-annual shareholder report |
| Additional Information [Text Block] | You can find additional information about the Fund at etf.timothyplan.com. You may also request more information by calling 800.846.7526 or visiting timothyplan.com/contact-us. |
| Additional Information Phone Number | 800.846.7526 |
| Additional Information Website | <span style="box-sizing: border-box; color: rgb(0, 0, 0); display: inline; flex-wrap: nowrap; font-size: 12px; font-weight: 400; grid-area: auto; line-height: 18px; margin: 0px; overflow: visible; text-align: left; text-align-last: auto; white-space-collapse: preserve-breaks;">etf.timothyplan.com</span> |
| Expenses [Text Block] | |
| Expenses Paid, Amount | $ 26 |
| Expense Ratio, Percent | 0.52% |
| AssetsNet | $ 207,270,319 |
| Holdings Count | Holding | 448 |
| InvestmentCompanyPortfolioTurnover | 23.00% |
| Additional Fund Statistics [Text Block] | |
| Holdings [Text Block] | |
| Updated Prospectus Web Address | Prospectus |
| C000206643 | |
| Shareholder Report [Line Items] | |
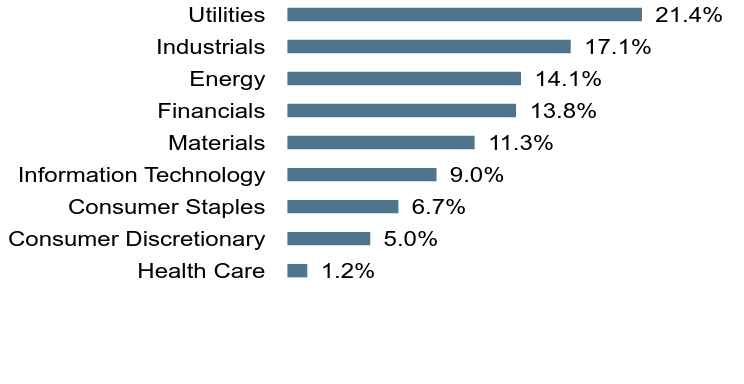
| Fund Name | Timothy Plan International ETF |
| Trading Symbol | TPIF |
| Security Exchange Name | NYSE |
| Annual or Semi-Annual Statement [Text Block] | The semi-annual shareholder report contains important information about Timothy Plan International ETF (the "Fund") for the period of January 1, 2025 to June 30, 2025. |
| Shareholder Report Annual or Semi-Annual | Semi-annual shareholder report |
| Additional Information [Text Block] | You can find additional information about the Fund at etf.timothyplan.com. You may also request more information by calling 800.846.7526 or visiting timothyplan.com/contact-us. |
| Additional Information Phone Number | 800.846.7526 |
| Additional Information Website | <span style="box-sizing: border-box; color: rgb(0, 0, 0); display: inline; flex-wrap: nowrap; font-size: 12px; font-weight: 400; grid-area: auto; line-height: 18px; margin: 0px; overflow: visible; text-align: left; text-align-last: auto; white-space-collapse: preserve-breaks;">etf.timothyplan.com</span> |
| Expenses [Text Block] | |
| Expenses Paid, Amount | $ 34 |
| Expense Ratio, Percent | 0.62% |
| AssetsNet | $ 148,174,594 |
| Holdings Count | Holding | 355 |
| InvestmentCompanyPortfolioTurnover | 16.00% |
| Additional Fund Statistics [Text Block] | |
| Holdings [Text Block] | |
| Updated Prospectus Web Address | Prospectus |
| C000228884 | |
| Shareholder Report [Line Items] | |
| Fund Name | Timothy Plan High Dividend Stock Enhanced ETF |
| Trading Symbol | TPHE |
| Security Exchange Name | NYSE |
| Annual or Semi-Annual Statement [Text Block] | The semi-annual shareholder report contains important information about Timothy Plan High Dividend Stock Enhanced ETF (the "Fund") for the period of January 1, 2025 to June 30, 2025. |
| Shareholder Report Annual or Semi-Annual | Semi-annual shareholder report |
| Additional Information [Text Block] | You can find additional information about the Fund at etf.timothyplan.com. You may also request more information by calling 800.846.7526 or visiting timothyplan.com/contact-us. |
| Additional Information Phone Number | 800.846.7526 |
| Additional Information Website | <span style="box-sizing: border-box; color: rgb(0, 0, 0); display: inline; flex-wrap: nowrap; font-size: 12px; font-weight: 400; grid-area: auto; line-height: 18px; margin: 0px; overflow: visible; text-align: left; text-align-last: auto; white-space-collapse: preserve-breaks;">etf.timothyplan.com</span> |
| Expenses [Text Block] | |
| Expenses Paid, Amount | $ 26 |
| Expense Ratio, Percent | 0.52% |
| AssetsNet | $ 25,161,010 |
| Holdings Count | Holding | 101 |
| InvestmentCompanyPortfolioTurnover | 64.00% |
| Additional Fund Statistics [Text Block] | |
| Holdings [Text Block] | |
| Updated Prospectus Web Address | Prospectus |
| C000228883 | |
| Shareholder Report [Line Items] | |
| Fund Name | Timothy Plan US Large/Mid Cap Core Enhanced ETF |
| Trading Symbol | TPLE |
| Security Exchange Name | NYSE |
| Annual or Semi-Annual Statement [Text Block] | The semi-annual shareholder report contains important information about Timothy Plan US Large/Mid Cap Core Enhanced ETF (the "Fund") for the period of January 1, 2025 to June 30, 2025. |
| Shareholder Report Annual or Semi-Annual | Semi-annual shareholder report |
| Additional Information [Text Block] | You can find additional information about the Fund at etf.timothyplan.com. You may also request more information by calling 800.846.7526 or visiting timothyplan.com/contact-us. |
| Additional Information Phone Number | 800.846.7526 |
| Additional Information Website | <span style="box-sizing: border-box; color: rgb(0, 0, 0); display: inline; flex-wrap: nowrap; font-size: 12px; font-weight: 400; grid-area: auto; line-height: 18px; margin: 0px; overflow: visible; text-align: left; text-align-last: auto; white-space-collapse: preserve-breaks;">etf.timothyplan.com</span> |
| Expenses [Text Block] | |
| Expenses Paid, Amount | $ 26 |
| Expense Ratio, Percent | 0.52% |
| AssetsNet | $ 17,400,368 |
| Holdings Count | Holding | 281 |
| InvestmentCompanyPortfolioTurnover | 9.00% |
| Additional Fund Statistics [Text Block] | |
| Holdings [Text Block] | |
| Updated Prospectus Web Address | Prospectus |
| C000240441 | |
| Shareholder Report [Line Items] | |
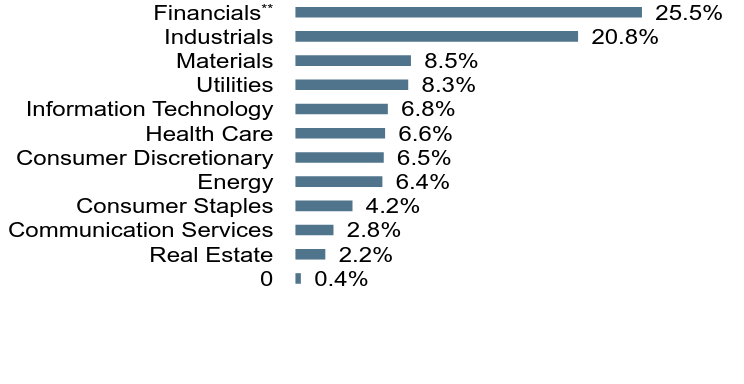
| Fund Name | Timothy Plan Market Neutral ETF |
| Trading Symbol | TPMN |
| Security Exchange Name | NYSE |
| Annual or Semi-Annual Statement [Text Block] | The semi-annual shareholder report contains important information about Timothy Plan Market Neutral ETF (the "Fund") for the period of January 1, 2025 to June 30, 2025. |
| Shareholder Report Annual or Semi-Annual | Semi-annual shareholder report |
| Additional Information [Text Block] | You can find additional information about the Fund at etf.timothyplan.com. You may also request more information by calling 800.846.7526 or visiting timothyplan.com/contact-us. |
| Additional Information Phone Number | 800.846.7526 |
| Additional Information Website | <span style="box-sizing: border-box; color: rgb(0, 0, 0); display: inline; flex-wrap: nowrap; font-size: 12px; font-weight: 400; grid-area: auto; line-height: 18px; margin: 0px; overflow: visible; text-align: left; text-align-last: auto; white-space-collapse: preserve-breaks;">etf.timothyplan.com</span> |
| Expenses [Text Block] | |
| Expenses Paid, Amount | $ 33 |
| Expense Ratio, Percent | 0.65% |
| AssetsNet | $ 30,695,509 |
| Holdings Count | Holding | 299 |
| InvestmentCompanyPortfolioTurnover | 19.00% |
| Additional Fund Statistics [Text Block] | |
| Holdings [Text Block] | |
| Updated Prospectus Web Address | Prospectus |