Shareholder Report
Jun. 30, 2025
USD ($)
Holding
®
– Principal Large Cap Growth Fund (the Fund) for the period of January 1, 2025 to June 30, 2025.
columbiathreadneedleus.com/resources/literature
. You can also request more information by contacting us at 1-800-345-6611.
What were the Fund costs for the reporting period?
(Based on a hypothetical $10,000 investment)
| Class | Cost of a $10,000 investment | Cost paid as a percentage of a $10,000 investment |
| Class 1 | $ 36 |
0.70 % (a) |
| (a) |
Annualized.
|
Key Fund Statistics
Fund net assets |
$ 2,025,865,000 |
Total number of portfolio holdings |
44 |
Portfolio turnover for the reporting period |
31% |
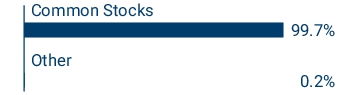
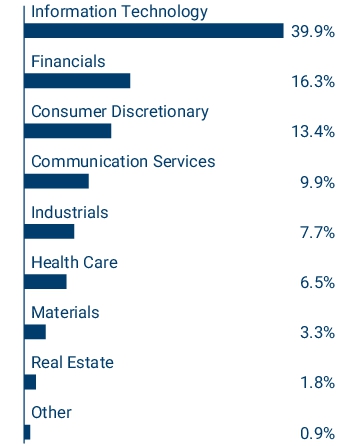
Graphical Representation of Fund Holdings
The tables below show the investment makeup of the Fund represented as a percentage of Fund net assets. Derivatives are excluded from the tables unless otherwise noted. The Fund's po
rtfolio
composition is subject to change.Top Holdings
| Microsoft Corp. | 10.1 % |
| NVIDIA Corp. | 9.6 % |
| Apple, Inc. | 6.1 % |
| Amazon.com, Inc. | 5.0 % |
| Broadcom, Inc. | 4.9 % |
| TransDigm Group, Inc. | 4.8 % |
| Cadence Design Systems, Inc. | 4.0 % |
| Netflix, Inc. | 4.0 % |
| Brookfield Corp. | 3.8 % |
| Meta Platforms, Inc., Class A | 3.2 % |
Asset Categories
Equity Sector Allocation
Top Holdings
| Microsoft Corp. | 10.1 % |
| NVIDIA Corp. | 9.6 % |
| Apple, Inc. | 6.1 % |
| Amazon.com, Inc. | 5.0 % |
| Broadcom, Inc. | 4.9 % |
| TransDigm Group, Inc. | 4.8 % |
| Cadence Design Systems, Inc. | 4.0 % |
| Netflix, Inc. | 4.0 % |
| Brookfield Corp. | 3.8 % |
| Meta Platforms, Inc., Class A | 3.2 % |
®
– Principal Large Cap Growth Fund (the Fund) for the period of January 1, 2025 to June 30, 2025.
columbiathreadneedleus.com/resources/literature
. You can also request more information by contacting us at 1-800-345-6611.
What were the Fund costs for the reporting period?
(Based on a hypothetical $10,000 investment)
| Class | Cost of a $10,000 investment | Cost paid as a percentage of a $10,000 investment |
| Class 2 | $ 49 |
0.95 % (a) |
| (a) |
Annualized.
|
Key Fund Statistics
Fund net assets |
$ 2,025,865,000 |
Total number of portfolio holdings |
44 |
Portfolio turnover for the reporting period |
31% |
Graphical Representation of Fund Holdings
The tables below show the investment makeup of the Fund represented as a percentag
e of F
und net assets. Derivatives are excluded from the tables unless otherwise noted. The Fund's portfolio composition is subject to change.Top Holdings
| Microsoft Corp. | 10.1 % |
| NVIDIA Corp. | 9.6 % |
| Apple, Inc. | 6.1 % |
| Amazon.com, Inc. | 5.0 % |
| Broadcom, Inc. | 4.9 % |
| TransDigm Group, Inc. | 4.8 % |
| Cadence Design Systems, Inc. | 4.0 % |
| Netflix, Inc. | 4.0 % |
| Brookfield Corp. | 3.8 % |
| Meta Platforms, Inc., Class A | 3.2 % |
Asset Categories

Equity Sector Allocation

Top Holdings
| Microsoft Corp. | 10.1 % |
| NVIDIA Corp. | 9.6 % |
| Apple, Inc. | 6.1 % |
| Amazon.com, Inc. | 5.0 % |
| Broadcom, Inc. | 4.9 % |
| TransDigm Group, Inc. | 4.8 % |
| Cadence Design Systems, Inc. | 4.0 % |
| Netflix, Inc. | 4.0 % |
| Brookfield Corp. | 3.8 % |
| Meta Platforms, Inc., Class A | 3.2 % |
| [1] | Annualized. |