Shareholder Report
|
12 Months Ended |
|
Jun. 30, 2025
USD ($)
Holding
|
|---|
| Shareholder Report [Line Items] |
|
|
| Document Type |
N-CSR
|
|
| Amendment Flag |
false
|
|
| Registrant Name |
Simplify Exchange Traded Funds
|
|
| Entity Central Index Key |
0001810747
|
|
| Entity Investment Company Type |
N-1A
|
|
| Document Period End Date |
Jun. 30, 2025
|
|
| C000233894 |
|
|
| Shareholder Report [Line Items] |
|
|
| Fund Name |
Simplify Aggregate Bond ETF
|
|
| Class Name |
Simplify Aggregate Bond ETF
|
|
| No Trading Symbol [Flag] |
true
|
|
| Security Exchange Name |
NYSEArca
|
|
| Annual or Semi-Annual Statement [Text Block] |
This annual shareholder report contains important information about Simplify Aggregate Bond ETF (the "Fund") for the period of July 1, 2024 to June 30, 2025.
|
|
| Shareholder Report Annual or Semi-Annual |
annual shareholder report
|
|
| Additional Information [Text Block] |
You can find additional information about the Fund at www.simplify.us/resources. You can also request this information by contacting us at (855) 772-8488.
|
|
| Additional Information Phone Number |
(855) 772-8488
|
|
| Additional Information Website |
www.simplify.us/resources
|
|
| Expenses [Text Block] |
What were the Fund’s costs for the last year? (based on a hypothetical $10,000 investment) Fund | Costs of a $10,000 investment | Costs paid as a
percentage of a $10,000 investment |
|---|
Simplify Aggregate Bond ETF | $26 | 0.25% |
|---|
|
|
| Expenses Paid, Amount |
$ 26
|
|
| Expense Ratio, Percent |
0.25%
|
|
| Factors Affecting Performance [Text Block] |
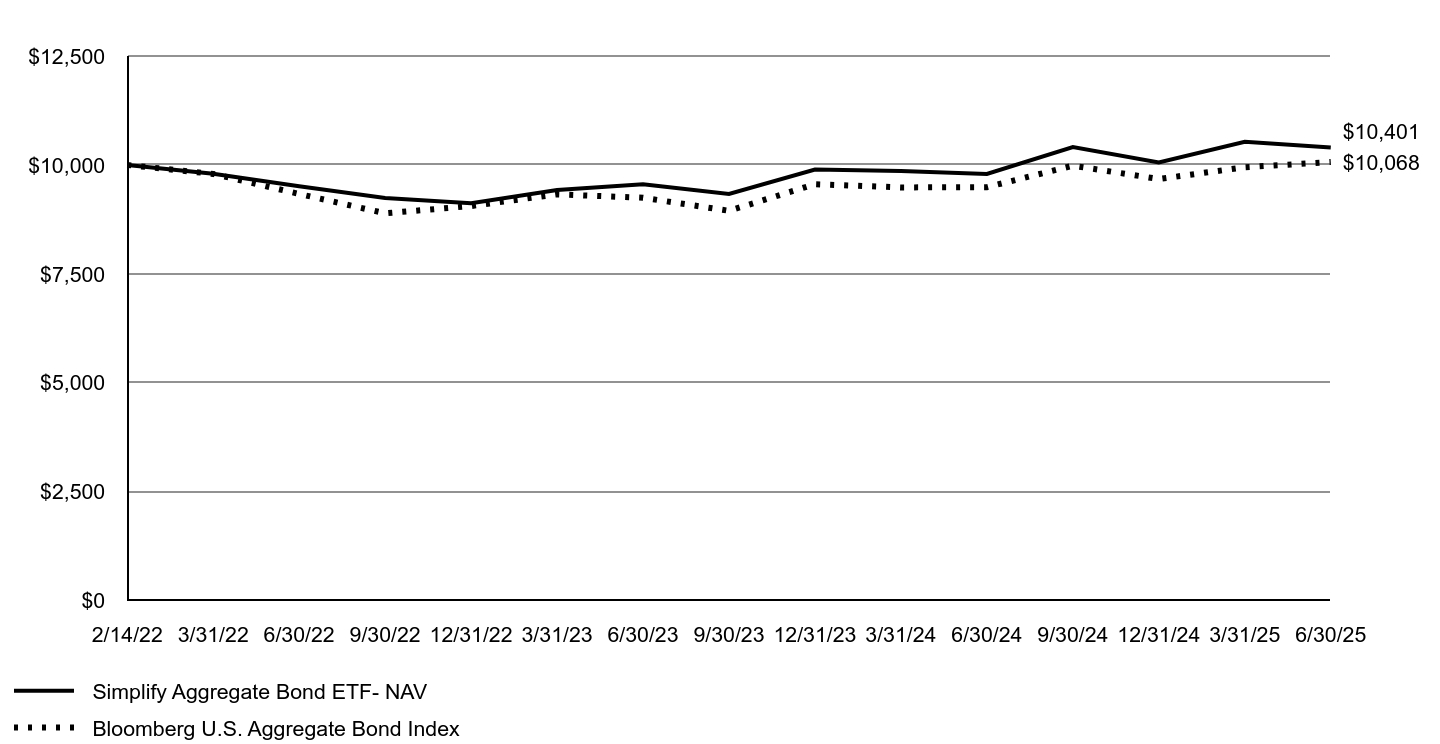
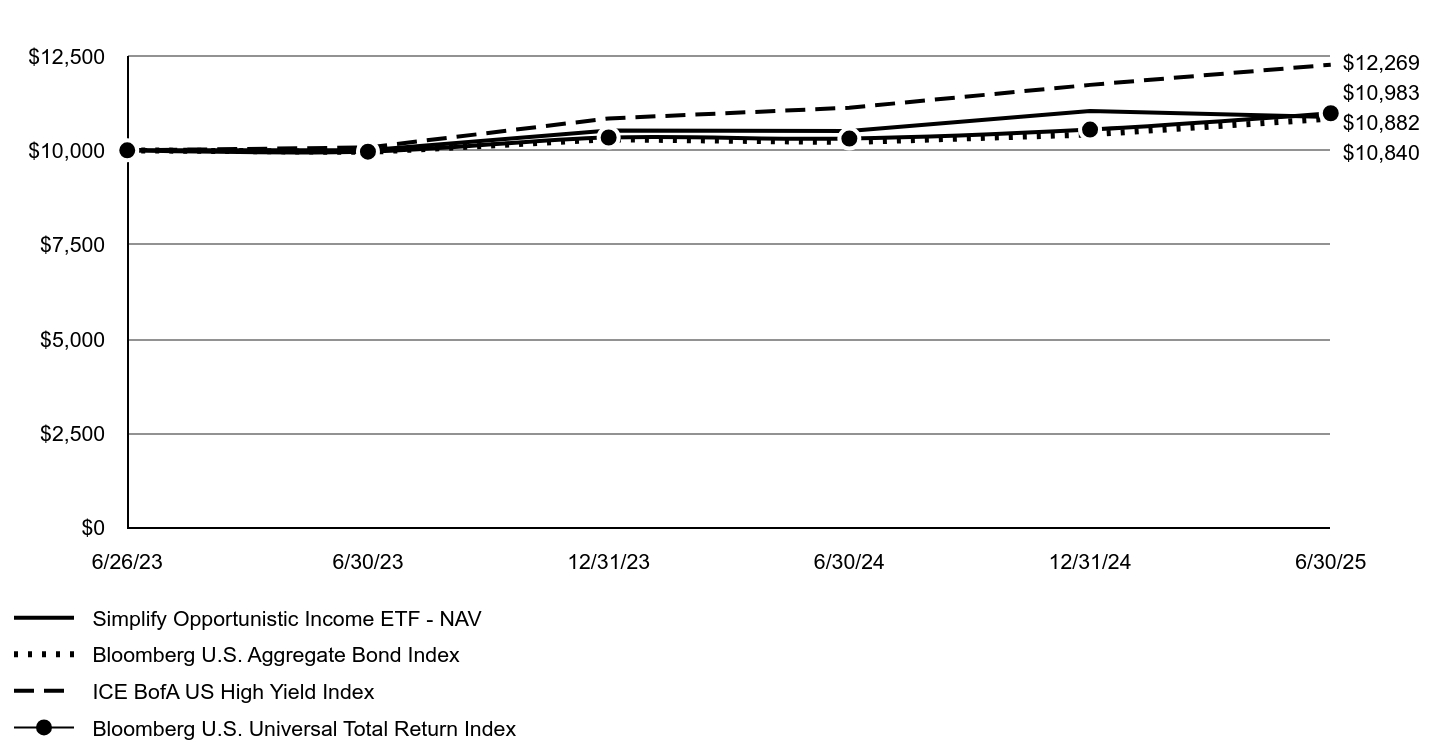
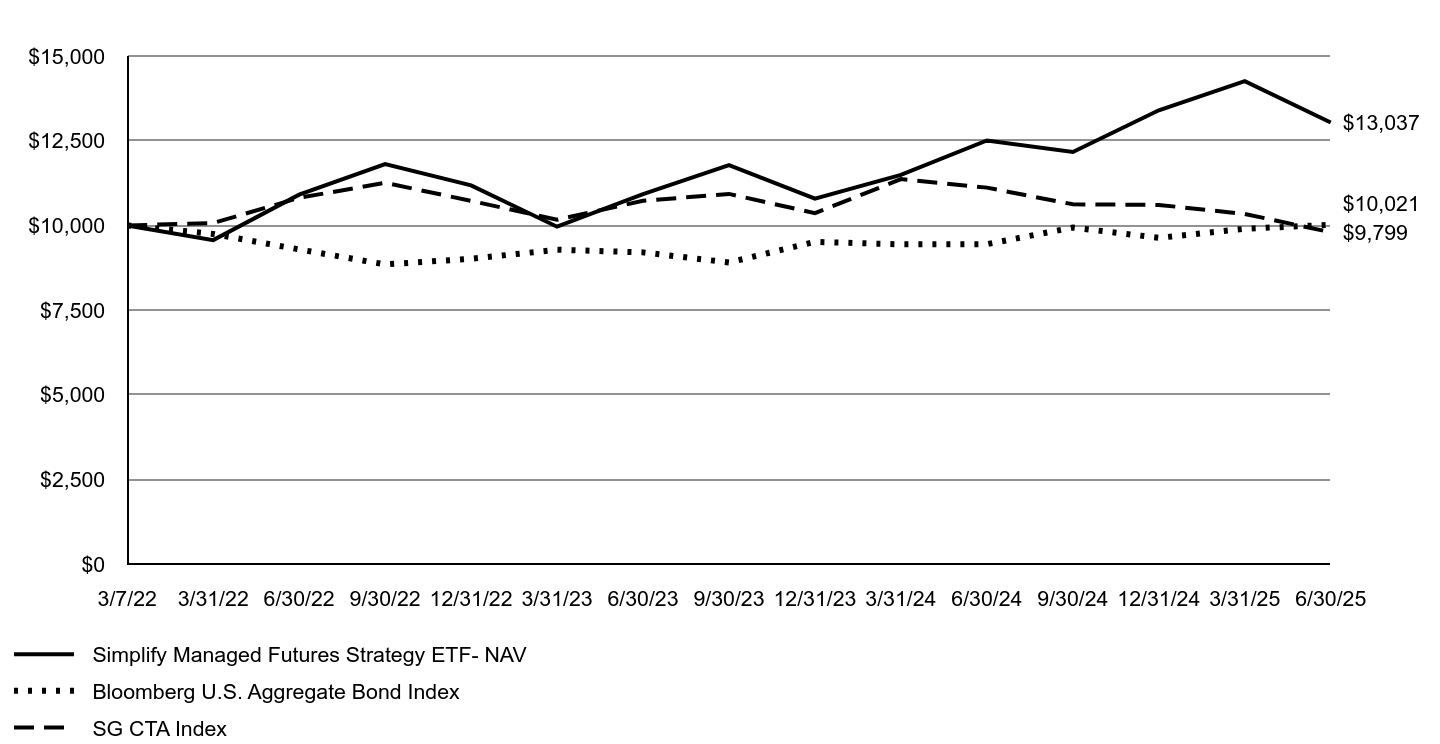
Management's Discussion of Fund PerformanceFor the year ended June 30, 2025, AGGH returned 6.19% vs. the Bloomberg U.S. Aggregate Bond Index’s return of 6.08% for the same period, outperforming the index by 0.11%. Rising interest rates were a headwind for AGGH and the bond market in general over the period, especially during the ''Tariff Tantrum'' in early April. AGGH outperformed despite the challenges in structural volatility option-selling strategies, as rate volatility and long-term Treasury rates spiked over just a few days with rates resetting to a higher level. AGGH used structural income opportunities such as more efficient option writing and curve positioning. In the next 12 months, we believe the Federal Reserve will likely restart their rate-cutting cycle, thus reducing front-end rates, however back-end rates may continue to have upward pressures due to the fiscal outlook. AGGH’s structural volatility selling strategies are well-positioned to capture returns as long-term treasury rates stabilize in a higher range. |
|
| Performance Past Does Not Indicate Future [Text] |
The Fund's past performance is not a good predictor of future performance.
|
|
| Line Graph [Table Text Block] |
| Simplify Aggregate Bond ETF- NAV | Bloomberg U.S. Aggregate Bond Index |
|---|
2/14/22 | $10,000 | $10,000 |
|---|
3/31/22 | $9,797 | $9,795 |
|---|
6/30/22 | $9,511 | $9,335 |
|---|
9/30/22 | $9,243 | $8,892 |
|---|
12/31/22 | $9,124 | $9,058 |
|---|
3/31/23 | $9,424 | $9,326 |
|---|
6/30/23 | $9,558 | $9,248 |
|---|
9/30/23 | $9,336 | $8,949 |
|---|
12/31/23 | $9,897 | $9,559 |
|---|
3/31/24 | $9,861 | $9,485 |
|---|
6/30/24 | $9,795 | $9,491 |
|---|
9/30/24 | $10,411 | $9,984 |
|---|
12/31/24 | $10,057 | $9,678 |
|---|
3/31/25 | $10,533 | $9,948 |
|---|
6/30/25 | $10,401 | $10,068 |
|---|
|
|
| Average Annual Return [Table Text Block] |
AVERAGE ANNUAL TOTAL RETURN
Fund/Index | 1 Year | Since Inception
2/14/2022 |
|---|
Simplify Aggregate Bond ETF - NAV | 6.19% | 1.18% |
|---|
Bloomberg U.S. Aggregate Bond Index | 6.08% | 0.20% |
|---|
|
|
| Performance Inception Date |
Feb. 14, 2022
|
|
| No Deduction of Taxes [Text Block] |
The graph and table do not reflect deduction of taxes that a shareholder would pay on Fund distributions or redemption of Fund shares.
|
|
| AssetsNet |
$ 324,930,843
|
|
| Holdings Count | Holding |
5
|
|
| Advisory Fees Paid, Amount |
$ 667,617
|
|
| InvestmentCompanyPortfolioTurnover |
299.00%
|
|
| Additional Fund Statistics [Text Block] |
The following table outlines key fund statistics that you should pay attention to. Fund net assets | $324,930,843 |
|---|
Total number of portfolio holdings | 5 |
|---|
Total advisory fee paid | $667,617 |
|---|
Portfolio turnover rate | 299% |
|---|
|
|
| Holdings [Text Block] |
Investment Categories | % of Net Assets |
|---|
U.S. Exchange-Traded Funds | 94.9% |
|---|
U.S. Treasury Bills | 4.5% |
|---|
Other Assets in Excess of Liabilities | 0.6% |
|---|
Total | 100.0% |
|---|
|
|
| Material Fund Change [Text Block] |
|
|
| C000259296 |
|
|
| Shareholder Report [Line Items] |
|
|
| Fund Name |
Simplify Barrier Income ETF
|
|
| Class Name |
Simplify Barrier Income ETF
|
|
| No Trading Symbol [Flag] |
true
|
|
| Security Exchange Name |
NYSEArca
|
|
| Annual or Semi-Annual Statement [Text Block] |
This annual shareholder report contains important information about Simplify Barrier Income ETF (the "Fund") for the period of April 14, 2025 (commencement of operations) to June 30, 2025.
|
|
| Shareholder Report Annual or Semi-Annual |
annual shareholder report
|
|
| Additional Information [Text Block] |
You can find additional information about the Fund at www.simplify.us/resources. You can also request this information by contacting us at (855) 772-8488.
|
|
| Additional Information Phone Number |
(855) 772-8488
|
|
| Additional Information Website |
www.simplify.us/resources
|
|
| Expenses [Text Block] |
What were the Fund’s costs for the period? (based on a hypothetical $10,000 investment) Fund | Costs of a $10,000 investment | Costs paid as a
percentage of a $10,000 investment |
|---|
Simplify Barrier Income ETF | $16Footnote Reference(1) | 0.75% |
|---|
| Footnote | Description | Footnote(1) | Based on the period April 14, 2025 (commencement of operations) through June 30, 2025. Expenses would have been higher if based on the full reporting period. |
|
|
| Expenses Paid, Amount |
$ 16
|
[1] |
| Expense Ratio, Percent |
0.75%
|
|
| Expenses Short Period Footnote [Text Block] |
Based on the period April 14, 2025 (commencement of operations) through June 30, 2025. Expenses would have been higher if based on the full reporting period.
|
|
| Factors Affecting Performance [Text Block] |
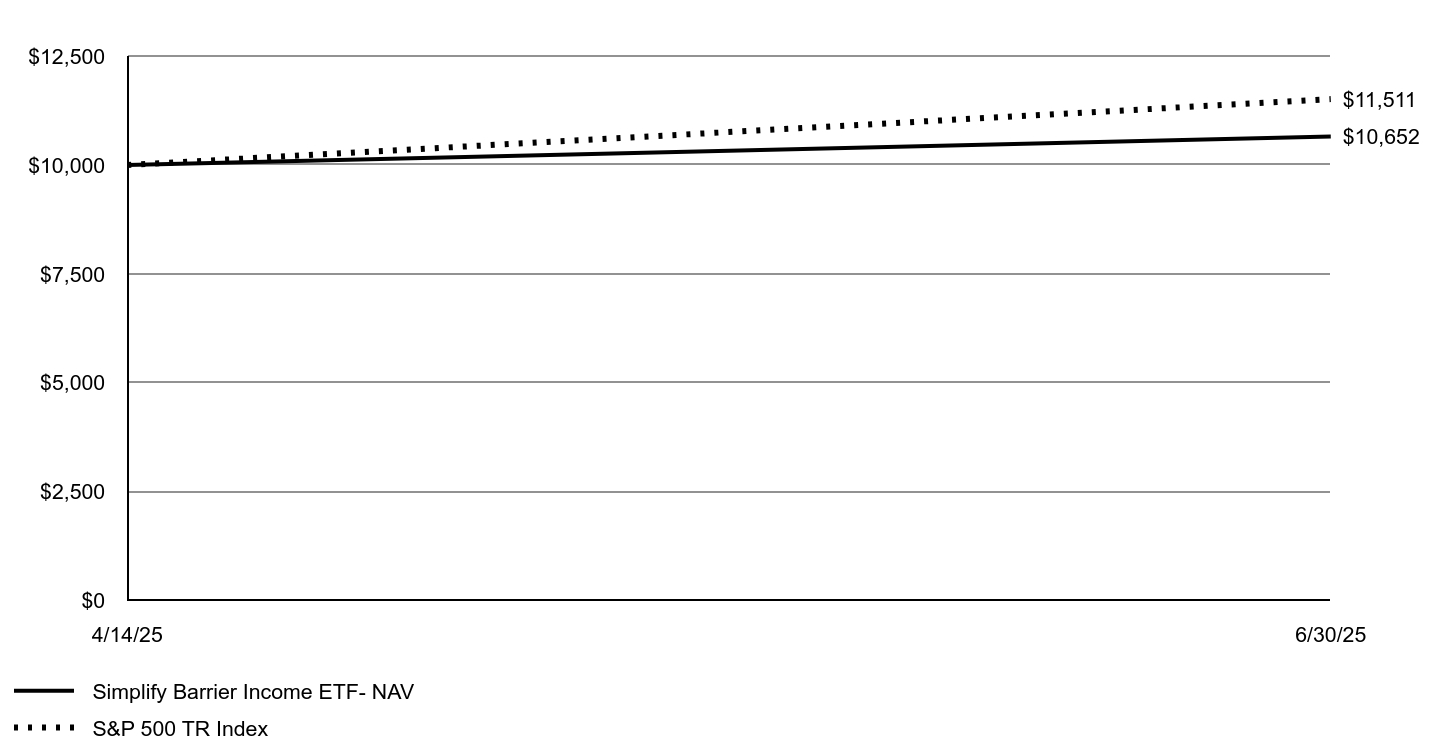
Management's Discussion of Fund PerformanceFor the period April 14, 2025, to June 30, 2025, SBAR returned 6.52% vs. the return of 15.11% of the S&P 500 Index, underperforming by 8.59%. SBAR’s strong absolute returns were supported by robust equity market performance and a decline in overall market volatility. SBAR's income generation is derived from a combination of Treasury yields and premium income from selling barrier options. On a relative basis, SBAR’s performance has been consistent with expectations, reflecting its income-oriented strategy. Looking ahead, we believe SBAR is well-positioned to appeal to investors seeking high monthly income through barrier option structures, while also offering operational efficiencies typically lacking in traditional structured note investments. |
|
| Performance Past Does Not Indicate Future [Text] |
The Fund's past performance is not a good predictor of future performance.
|
|
| Line Graph [Table Text Block] |
| Simplify Barrier Income ETF- NAV | S&P 500 TR Index |
|---|
4/14/25 | $10,000 | $10,000 |
|---|
6/30/25 | $10,652 | $11,511 |
|---|
|
|
| Average Annual Return [Table Text Block] |
AVERAGE ANNUAL TOTAL RETURN
Fund/Index | Since Inception
4/14/2025 |
|---|
Simplify Barrier Income ETF - NAV | 6.52% |
|---|
S&P 500 TR Index | 15.11% |
|---|
|
|
| Performance Inception Date |
Apr. 14, 2025
|
|
| No Deduction of Taxes [Text Block] |
The graph and table do not reflect deduction of taxes that a shareholder would pay on Fund distributions or redemption of Fund shares.
|
|
| AssetsNet |
$ 35,180,297
|
|
| Holdings Count | Holding |
3
|
|
| Advisory Fees Paid, Amount |
$ 46,972
|
|
| InvestmentCompanyPortfolioTurnover |
0.00%
|
|
| Additional Fund Statistics [Text Block] |
The following table outlines key fund statistics that you should pay attention to. Fund net assets | $35,180,297 |
|---|
Total number of portfolio holdings | 3 |
|---|
Total advisory fee paid | $46,972 |
|---|
Portfolio turnover rate | 0% |
|---|
|
|
| Holdings [Text Block] |
Investment Categories | % of Net Assets |
|---|
U.S. Treasury Bills | 100.0% |
|---|
Liabilities in Excess of Other Assets | (0.0)%Footnote Reference† |
|---|
Total | 100.0% |
|---|
| Footnote | Description | Footnote† | Less than 0.05% |
|
|
| Material Fund Change [Text Block] |
|
|
| C000254610 |
|
|
| Shareholder Report [Line Items] |
|
|
| Fund Name |
Simplify Bond Bull ETF
|
|
| Class Name |
Simplify Bond Bull ETF
|
|
| No Trading Symbol [Flag] |
true
|
|
| Security Exchange Name |
NYSEArca
|
|
| Annual or Semi-Annual Statement [Text Block] |
This annual shareholder report contains important information about Simplify Bond Bull ETF (the "Fund") for the period of December 9, 2024 to June 30, 2025.
|
|
| Shareholder Report Annual or Semi-Annual |
annual shareholder report
|
|
| Additional Information [Text Block] |
You can find additional information about the Fund at www.simplify.us/resources. You can also request this information by contacting us at (855) 772-8488.
|
|
| Material Fund Change Notice [Text Block] |
This report describes changes to the Fund that occurred during the reporting period.
|
|
| Additional Information Phone Number |
(855) 772-8488
|
|
| Additional Information Website |
www.simplify.us/resources
|
|
| Expenses [Text Block] |
What were the Fund’s costs for the period? (based on a hypothetical $10,000 investment) Fund | Costs of a $10,000 investment | Costs paid as a
percentage of a $10,000 investment |
|---|
Simplify Bond Bull ETF | $25Footnote Reference(1) | 0.50% |
|---|
| Footnote | Description | Footnote(1) | Based on the period December 9, 2024 (commencement of operations) through June 30, 2025. Expenses would have been higher if based on the full reporting period. |
|
|
| Expenses Paid, Amount |
$ 25
|
[2] |
| Expense Ratio, Percent |
0.50%
|
|
| Expenses Short Period Footnote [Text Block] |
Based on the period December 9, 2024 (commencement of operations) through June 30, 2025. Expenses would have been higher if based on the full reporting period.
|
|
| Factors Affecting Performance [Text Block] |
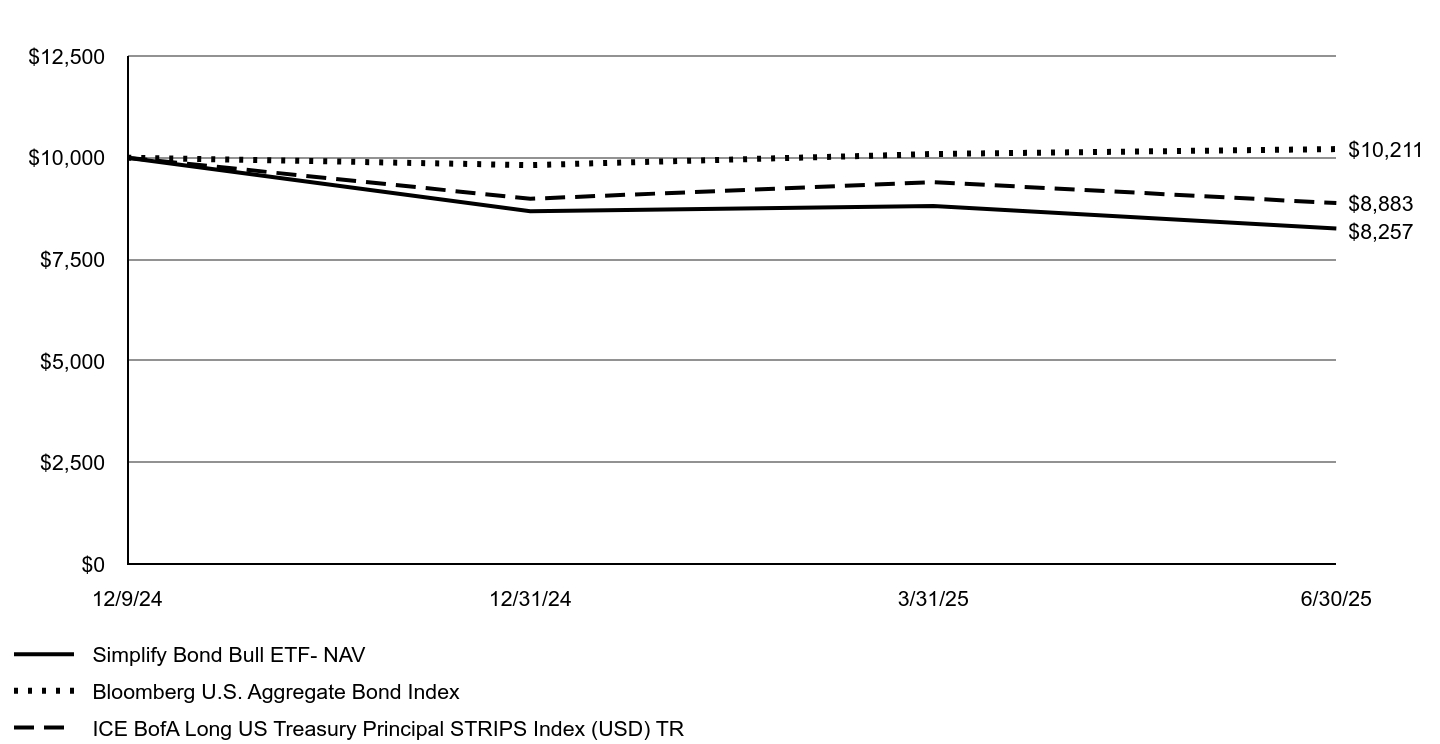
Management's Discussion of Fund PerformanceFor the period December 9, 2024, to June 30, 2025, RFIX returned -17.43% vs. the return of -11.7% of the ICE BofA Long US Treasury Principal STRIPS Index for the same period, underperforming the index by 6.26%. The main reason for the difference is that RFIX holds a position in long-term expiry (5 to 7 years) over the counter (OTC) receiver swaptions which function similarly to a long-term call option on the 10-year rate. These swaptions underperformed as the forward interest rates under them increased. Looking forward, we anticipate decreases in rates that drive decreases in the forward rates along with decreases in implied volatilities would be beneficial to RFIX’s performance while increases in forward rates and increases in implied volatilities would be harmful. The path of future interest rates and implied volatilities is notoriously difficult to predict. |
|
| Performance Past Does Not Indicate Future [Text] |
The Fund's past performance is not a good predictor of future performance.
|
|
| Line Graph [Table Text Block] |
| Simplify Bond Bull ETF- NAV | Bloomberg U.S. Aggregate Bond Index | ICE BofA Long US Treasury Principal STRIPS Index (USD) TR |
|---|
12/9/24 | $10,000 | $10,000 | $10,000 |
|---|
12/31/24 | $8,685 | $9,817 | $8,989 |
|---|
3/31/25 | $8,812 | $10,090 | $9,398 |
|---|
6/30/25 | $8,257 | $10,211 | $8,883 |
|---|
|
|
| Average Annual Return [Table Text Block] |
AVERAGE ANNUAL TOTAL RETURN
Fund/Index | Since Inception
12/9/2024 |
|---|
Simplify Bond Bull ETF - NAV | -17.43% |
|---|
Bloomberg U.S. Aggregate Bond Index | 2.11% |
|---|
ICE BofA Long US Treasury Principal STRIPS Index (USD) TR | -11.17% |
|---|
|
|
| Performance Inception Date |
Dec. 09, 2024
|
|
| No Deduction of Taxes [Text Block] |
The graph and table do not reflect deduction of taxes that a shareholder would pay on Fund distributions or redemption of Fund shares.
|
|
| AssetsNet |
$ 152,635,408
|
|
| Holdings Count | Holding |
11
|
|
| Advisory Fees Paid, Amount |
$ 312,976
|
|
| InvestmentCompanyPortfolioTurnover |
0.00%
|
|
| Additional Fund Statistics [Text Block] |
The following table outlines key fund statistics that you should pay attention to. Fund net assets | $152,635,408 |
|---|
Total number of portfolio holdings | 11 |
|---|
Total advisory fee paid | $312,976 |
|---|
Portfolio turnover rate | 0% |
|---|
|
|
| Holdings [Text Block] |
Investment Categories | % of Net Assets |
|---|
U.S. Treasury Bills | 106.0% |
|---|
Purchased Swaptions | (6.2)% |
|---|
Other Assets in Excess of Liabilities | 0.2% |
|---|
Total | 100.0% |
|---|
|
|
| Material Fund Change [Text Block] |
This is a summary of certain changes to the Fund since December 9, 2024. For more complete information, you may review the Fund's prospectus dated February 20, 2025, which is available at www.simplify.us/resources or upon request at 1 (855)772-8488. (1) The Fund was renamed from Simplify Downside Interest Rate Hedge Strategy ETF to Simplify Bond Bull ETF. (2) In connection with this, the Fund also adopted a non-fundamental policy to invest at least 80% of its assets in bonds and other debt securities and instruments that provide investment exposure to such debt securities including derivatives. |
|
| C000255354 |
|
|
| Shareholder Report [Line Items] |
|
|
| Fund Name |
Simplify China A Shares PLUS Income ETF
|
|
| Class Name |
Simplify China A Shares PLUS Income ETF
|
|
| No Trading Symbol [Flag] |
true
|
|
| Security Exchange Name |
NYSEArca
|
|
| Annual or Semi-Annual Statement [Text Block] |
This annual shareholder report contains important information about Simplify China A Shares PLUS Income ETF (the "Fund") for the period of January 13, 2025 (commencement of operations) to June 30, 2025.
|
|
| Shareholder Report Annual or Semi-Annual |
annual shareholder report
|
|
| Additional Information [Text Block] |
You can find additional information about the Fund at www.simplify.us/resources. You can also request this information by contacting us at (855) 772-8488.
|
|
| Additional Information Phone Number |
(855) 772-8488
|
|
| Additional Information Website |
www.simplify.us/resources
|
|
| Expenses [Text Block] |
What were the Fund’s costs for the period? (based on a hypothetical $10,000 investment) Fund | Costs of a $10,000 investment | Costs paid as a
percentage of a $10,000 investment |
|---|
Simplify China A Shares PLUS Income ETF | $45Footnote Reference(1) | 0.88% |
|---|
| Footnote | Description | Footnote(1) | Based on the period January 13, 2025 (commencement of operations) through June 30, 2025. Expenses would have been higher if based on the full reporting period. |
|
|
| Expenses Paid, Amount |
$ 45
|
[3] |
| Expense Ratio, Percent |
0.88%
|
|
| Expenses Short Period Footnote [Text Block] |
Based on the period January 13, 2025 (commencement of operations) through June 30, 2025. Expenses would have been higher if based on the full reporting period.
|
|
| Factors Affecting Performance [Text Block] |
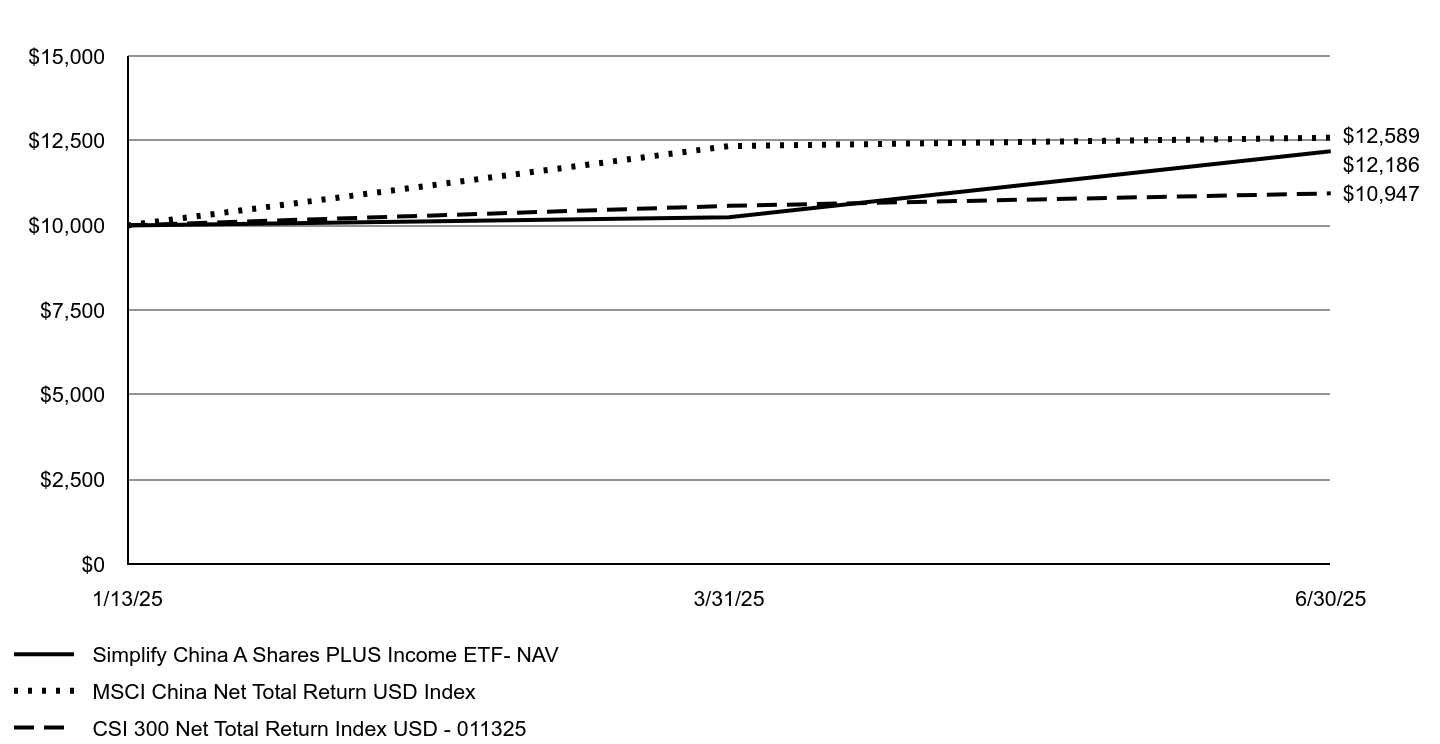
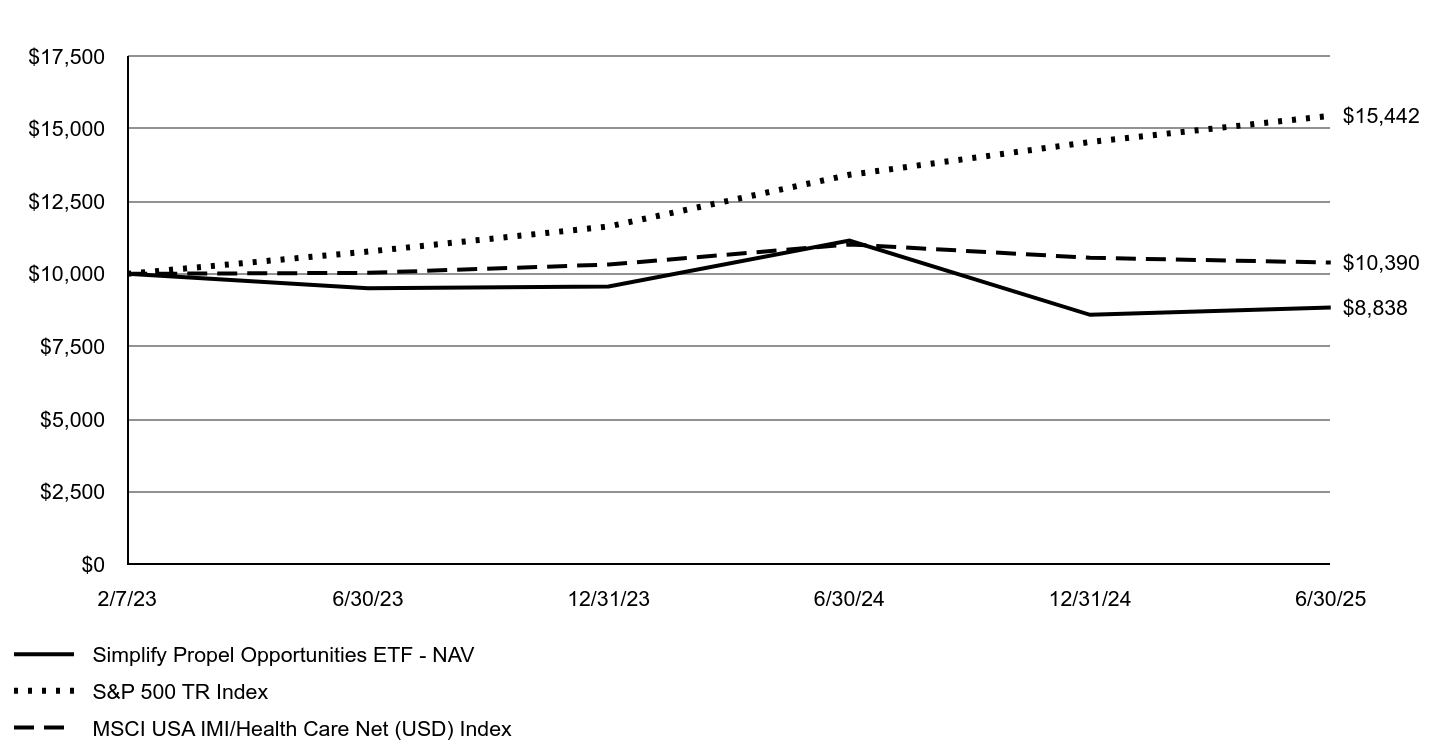
Management's Discussion of Fund PerformanceSince its inception on January 13, 2025, CAS returned 21.86% vs. the CSI 300 Net Total Return Index USD return of 9.73% for the same period. CAS' allocations to the smaller market capitalization indices, including the CSI 500, 1000, and 2000 contributed to performance as each outperformed the CSI 300 index meaningfully over the period. Looking forward, we intend to maintain a diversified exposure within CAS across the various market capitalization segments of the onshore China stock market. |
|
| Performance Past Does Not Indicate Future [Text] |
The Fund's past performance is not a good predictor of future performance.
|
|
| Line Graph [Table Text Block] |
| Simplify China A Shares PLUS Income ETF- NAV | MSCI China Net Total Return USD Index | CSI 300 Net Total Return Index USD - 011325 |
|---|
1/13/25 | $10,000 | $10,000 | $10,002 |
|---|
3/31/25 | $10,244 | $12,342 | $10,578 |
|---|
6/30/25 | $12,186 | $12,589 | $10,947 |
|---|
|
|
| Average Annual Return [Table Text Block] |
AVERAGE ANNUAL TOTAL RETURN
Fund/Index | Since Inception
1/13/2025 |
|---|
Simplify China A Shares PLUS Income ETF - NAV | 21.86% |
|---|
MSCI China Net Total Return USD Index | 25.89% |
|---|
CSI 300 Net Total Return Index USD - 011325 | 9.73% |
|---|
|
|
| Performance Inception Date |
Jan. 13, 2025
|
|
| No Deduction of Taxes [Text Block] |
The graph and table do not reflect deduction of taxes that a shareholder would pay on Fund distributions or redemption of Fund shares.
|
|
| AssetsNet |
$ 11,330,285
|
|
| Holdings Count | Holding |
22
|
|
| Advisory Fees Paid, Amount |
$ 40,387
|
|
| InvestmentCompanyPortfolioTurnover |
0.00%
|
|
| Additional Fund Statistics [Text Block] |
The following table outlines key fund statistics that you should pay attention to. Fund net assets | $11,330,285 |
|---|
Total number of portfolio holdings | 22 |
|---|
Total advisory fee paid | $40,387 |
|---|
Portfolio turnover rate | 0% |
|---|
|
|
| Holdings [Text Block] |
Investment Categories | % of Net Assets |
|---|
U.S. Treasury Bills | 93.0% |
|---|
Purchased Options | 3.7% |
|---|
Other Assets in Excess of Liabilities | 3.3% |
|---|
Total | 100.0% |
|---|
|
|
| Material Fund Change [Text Block] |
|
|
| C000254609 |
|
|
| Shareholder Report [Line Items] |
|
|
| Fund Name |
Simplify Currency Strategy ETF
|
|
| Class Name |
Simplify Currency Strategy ETF
|
|
| No Trading Symbol [Flag] |
true
|
|
| Security Exchange Name |
NYSEArca
|
|
| Annual or Semi-Annual Statement [Text Block] |
This annual shareholder report contains important information about Simplify Currency Strategy ETF (the "Fund") for the period of February 3, 2025 (commencement of operations) to June 30, 2025.
|
|
| Shareholder Report Annual or Semi-Annual |
annual shareholder report
|
|
| Additional Information [Text Block] |
You can find additional information about the Fund at www.simplify.us/resources. You can also request this information by contacting us at (855) 772-8488.
|
|
| Additional Information Phone Number |
(855) 772-8488
|
|
| Additional Information Website |
www.simplify.us/resources
|
|
| Expenses [Text Block] |
What were the Fund’s costs for the period? (based on a hypothetical $10,000 investment) Fund | Costs of a $10,000 investment | Costs paid as a
percentage of a $10,000 investment |
|---|
Simplify Currency Strategy ETF | $34Footnote Reference(1) | 0.81% |
|---|
| Footnote | Description | Footnote(1) | Based on the period February 3, 2025 (commencement of operations) through June 30, 2025. Expenses would have been higher if based on the full reporting period. |
|
|
| Expenses Paid, Amount |
$ 34
|
[4] |
| Expense Ratio, Percent |
0.81%
|
|
| Expenses Short Period Footnote [Text Block] |
Based on the period February 3, 2025 (commencement of operations) through June 30, 2025. Expenses would have been higher if based on the full reporting period.
|
|
| Factors Affecting Performance [Text Block] |
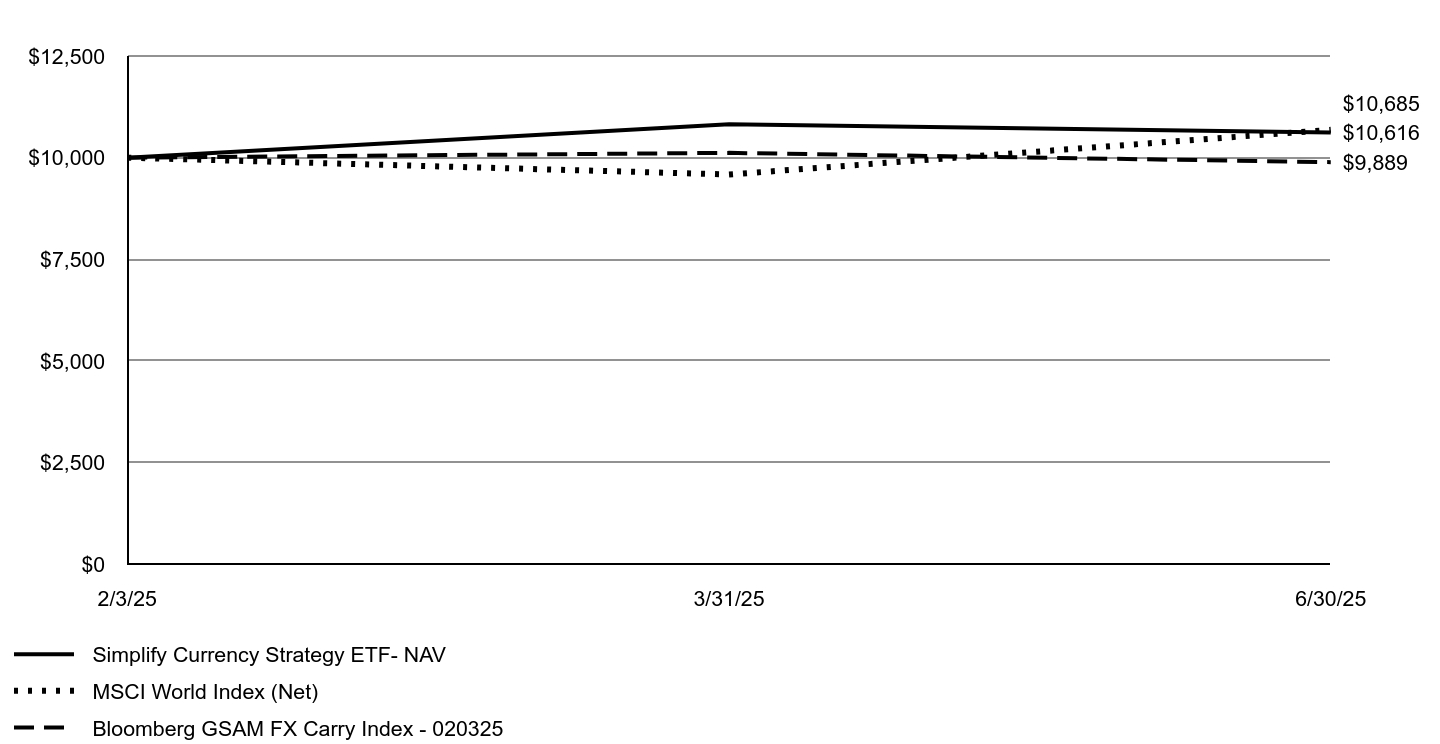
Management's Discussion of Fund PerformanceSince its inception on February 3, 2025, FOXY returned 6.16% vs. the benchmark Bloomberg GSAM FX Carry Index return of -1.12% for the same period. The Fund’s approach of dynamically adjusting its currency exposures benefited performance. Among the G10 currencies, the Japanese Yen, Australian Dollar, and British Pound contributed. Within EM currencies, the Mexican Peso and Brazilian Real rounded out the top contributors. Looking forward, it is intended that FOXY will continue to adhere to its systematic investment approach which aims to harvest yield in the currency market in a volatility managed fashion. Uncertainty over the direction of the U.S. Dollar has risen as a consequence of the current U.S. presidential administration’s pursuit of a new trade arrangements with other countries. And while FOXY is managed on a dollar-neutral basis, it remains to be seen whether changes to trade relationships will present a challenge to the structure of the currency market on which FOXY’s investment strategy is based. |
|
| Performance Past Does Not Indicate Future [Text] |
The Fund's past performance is not a good predictor of future performance.
|
|
| Line Graph [Table Text Block] |
| Simplify Currency Strategy ETF- NAV | MSCI World Index (Net) | Bloomberg GSAM FX Carry Index - 020325 |
|---|
2/3/25 | $10,000 | $10,000 | $10,000 |
|---|
3/31/25 | $10,819 | $9,586 | $10,118 |
|---|
6/30/25 | $10,616 | $10,685 | $9,889 |
|---|
|
|
| Average Annual Return [Table Text Block] |
AVERAGE ANNUAL TOTAL RETURN
Fund/Index | Since Inception
2/3/2025 |
|---|
Simplify Currency Strategy ETF - NAV | 6.16% |
|---|
MSCI World Index (Net) | 6.85% |
|---|
Bloomberg GSAM FX Carry Index - 020325 | -1.12% |
|---|
|
|
| Performance Inception Date |
Feb. 03, 2025
|
|
| No Deduction of Taxes [Text Block] |
The graph and table do not reflect deduction of taxes that a shareholder would pay on Fund distributions or redemption of Fund shares.
|
|
| AssetsNet |
$ 14,943,973
|
|
| Holdings Count | Holding |
4
|
|
| Advisory Fees Paid, Amount |
$ 34,712
|
|
| InvestmentCompanyPortfolioTurnover |
0.00%
|
|
| Additional Fund Statistics [Text Block] |
The following table outlines key fund statistics that you should pay attention to. Fund net assets | $14,943,973 |
|---|
Total number of portfolio holdings | 4 |
|---|
Total advisory fee paid | $34,712 |
|---|
Portfolio turnover rate | 0% |
|---|
|
|
| Holdings [Text Block] |
Investment Categories | % of Net Assets |
|---|
U.S. Treasury Bills | 97.7% |
|---|
Other Assets in Excess of Liabilities | 2.3% |
|---|
Total | 100.0% |
|---|
|
|
| Material Fund Change [Text Block] |
|
|
| C000238456 |
|
|
| Shareholder Report [Line Items] |
|
|
| Fund Name |
Simplify Enhanced Income ETF
|
|
| Class Name |
Simplify Enhanced Income ETF
|
|
| No Trading Symbol [Flag] |
true
|
|
| Security Exchange Name |
NYSEArca
|
|
| Annual or Semi-Annual Statement [Text Block] |
This annual shareholder report contains important information about Simplify Enhanced Income ETF (the "Fund") for the period of July 1, 2024 to June 30, 2025.
|
|
| Shareholder Report Annual or Semi-Annual |
annual shareholder report
|
|
| Additional Information [Text Block] |
You can find additional information about the Fund at www.simplify.us/resources. You can also request this information by contacting us at (855) 772-8488.
|
|
| Additional Information Phone Number |
(855) 772-8488
|
|
| Additional Information Website |
www.simplify.us/resources
|
|
| Expenses [Text Block] |
What were the Fund’s costs for the last year? (based on a hypothetical $10,000 investment) Fund | Costs of a $10,000 investment | Costs paid as a
percentage of a $10,000 investment |
|---|
Simplify Enhanced Income ETF | $52 | 0.50% |
|---|
|
|
| Expenses Paid, Amount |
$ 52
|
|
| Expense Ratio, Percent |
0.50%
|
|
| Factors Affecting Performance [Text Block] |
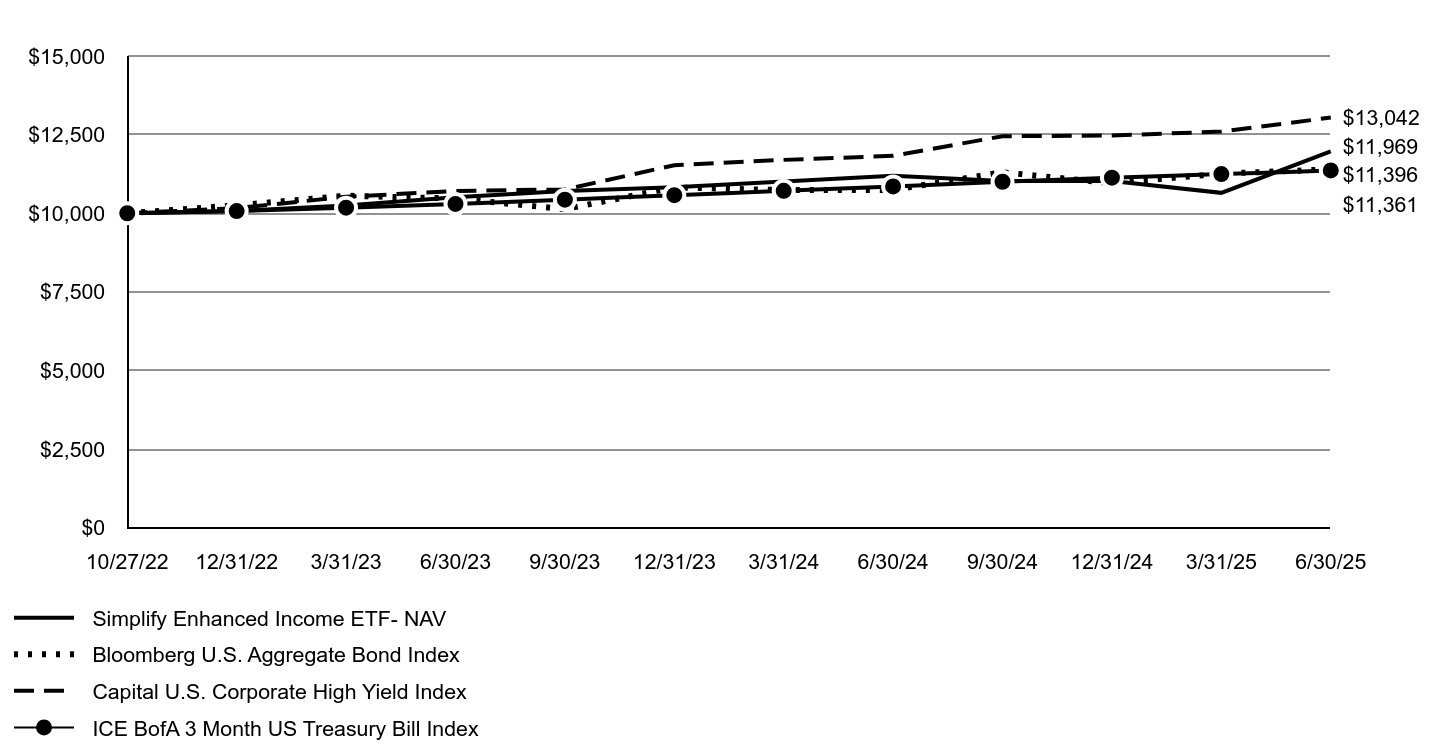
Management's Discussion of Fund PerformanceFor the year ended June 30, 2025, HIGH returned 6.95% vs the ICE BofA US 3-Month Treasury Bill Index, return of 4.68% for the same period, outperforming the benchmark by 2.27%. Around August 2024, the Portfolio Management team identified an opportunity to start spending low premium amounts for convex tail hedges on both upside and downside to improve the core income generating component of HIGH’s investment strategy. While this initially detracted from performance, the approach paid off during the ''tariff tantrum'' allowing HIGH to outperform in the first half of 2025. Looking ahead, HIGH aims to maintain a steady NAV and distribution by putting on cost effective hedges to navigate extreme market conditions. |
|
| Performance Past Does Not Indicate Future [Text] |
The Fund's past performance is not a good predictor of future performance.
|
|
| Line Graph [Table Text Block] |
| Simplify Enhanced Income ETF- NAV | Bloomberg U.S. Aggregate Bond Index | Capital U.S. Corporate High Yield Index | ICE BofA 3 Month US Treasury Bill Index |
|---|
10/27/22 | $10,000 | $10,000 | $10,000 | $10,000 |
|---|
12/31/22 | $10,073 | $10,253 | $10,161 | $10,070 |
|---|
3/31/23 | $10,244 | $10,557 | $10,524 | $10,178 |
|---|
6/30/23 | $10,507 | $10,468 | $10,708 | $10,297 |
|---|
9/30/23 | $10,706 | $10,130 | $10,757 | $10,432 |
|---|
12/31/23 | $10,830 | $10,820 | $11,528 | $10,575 |
|---|
3/31/24 | $11,010 | $10,736 | $11,697 | $10,712 |
|---|
6/30/24 | $11,191 | $10,743 | $11,825 | $10,853 |
|---|
9/30/24 | $11,029 | $11,302 | $12,450 | $11,002 |
|---|
12/31/24 | $11,022 | $10,956 | $12,472 | $11,130 |
|---|
3/31/25 | $10,649 | $11,260 | $12,597 | $11,244 |
|---|
6/30/25 | $11,969 | $11,396 | $13,042 | $11,361 |
|---|
|
|
| Average Annual Return [Table Text Block] |
AVERAGE ANNUAL TOTAL RETURN
Fund/Index | 1 Year | Since Inception
10/27/2022 |
|---|
Simplify Enhanced Income ETF - NAV | 6.95% | 6.95% |
|---|
Bloomberg U.S. Aggregate Bond Index | 6.08% | 5.01% |
|---|
Capital U.S. Corporate High Yield Index | 10.29% | 10.44% |
|---|
ICE BofA 3 Month US Treasury Bill Index | 4.68% | 4.89% |
|---|
|
|
| Performance Inception Date |
Oct. 27, 2022
|
|
| No Deduction of Taxes [Text Block] |
The graph and table do not reflect deduction of taxes that a shareholder would pay on Fund distributions or redemption of Fund shares.
|
|
| AssetsNet |
$ 192,166,444
|
|
| Holdings Count | Holding |
22
|
|
| Advisory Fees Paid, Amount |
$ 1,518,590
|
|
| InvestmentCompanyPortfolioTurnover |
0.00%
|
|
| Additional Fund Statistics [Text Block] |
The following table outlines key fund statistics that you should pay attention to. Fund net assets | $192,166,444 |
|---|
Total number of portfolio holdings | 22 |
|---|
Total advisory fee paid | $1,518,590 |
|---|
Portfolio turnover rate | 0% |
|---|
|
|
| Holdings [Text Block] |
Investment Categories | % of Net Assets |
|---|
U.S. Treasury Bills | 96.2% |
|---|
Purchased Options | 3.7% |
|---|
Other Assets in Excess of Liabilities | 0.1% |
|---|
Total | 100.0% |
|---|
|
|
| Material Fund Change [Text Block] |
|
|
| C000230898 |
|
|
| Shareholder Report [Line Items] |
|
|
| Fund Name |
Simplify Health Care ETF
|
|
| Class Name |
Simplify Health Care ETF
|
|
| No Trading Symbol [Flag] |
true
|
|
| Security Exchange Name |
NYSEArca
|
|
| Annual or Semi-Annual Statement [Text Block] |
This annual shareholder report contains important information about Simplify Health Care ETF (the "Fund") for the period of July 1, 2024 to June 30, 2025.
|
|
| Shareholder Report Annual or Semi-Annual |
annual shareholder report
|
|
| Additional Information [Text Block] |
You can find additional information about the Fund at www.simplify.us/resources. You can also request this information by contacting us at (855) 772-8488.
|
|
| Additional Information Phone Number |
(855) 772-8488
|
|
| Additional Information Website |
www.simplify.us/resources
|
|
| Expenses [Text Block] |
What were the Fund’s costs for the last year? (based on a hypothetical $10,000 investment) Fund | Costs of a $10,000 investment | Costs paid as a
percentage of a $10,000 investment |
|---|
Simplify Health Care ETF | $49 | 0.50% |
|---|
|
|
| Expenses Paid, Amount |
$ 49
|
|
| Expense Ratio, Percent |
0.50%
|
|
| Factors Affecting Performance [Text Block] |
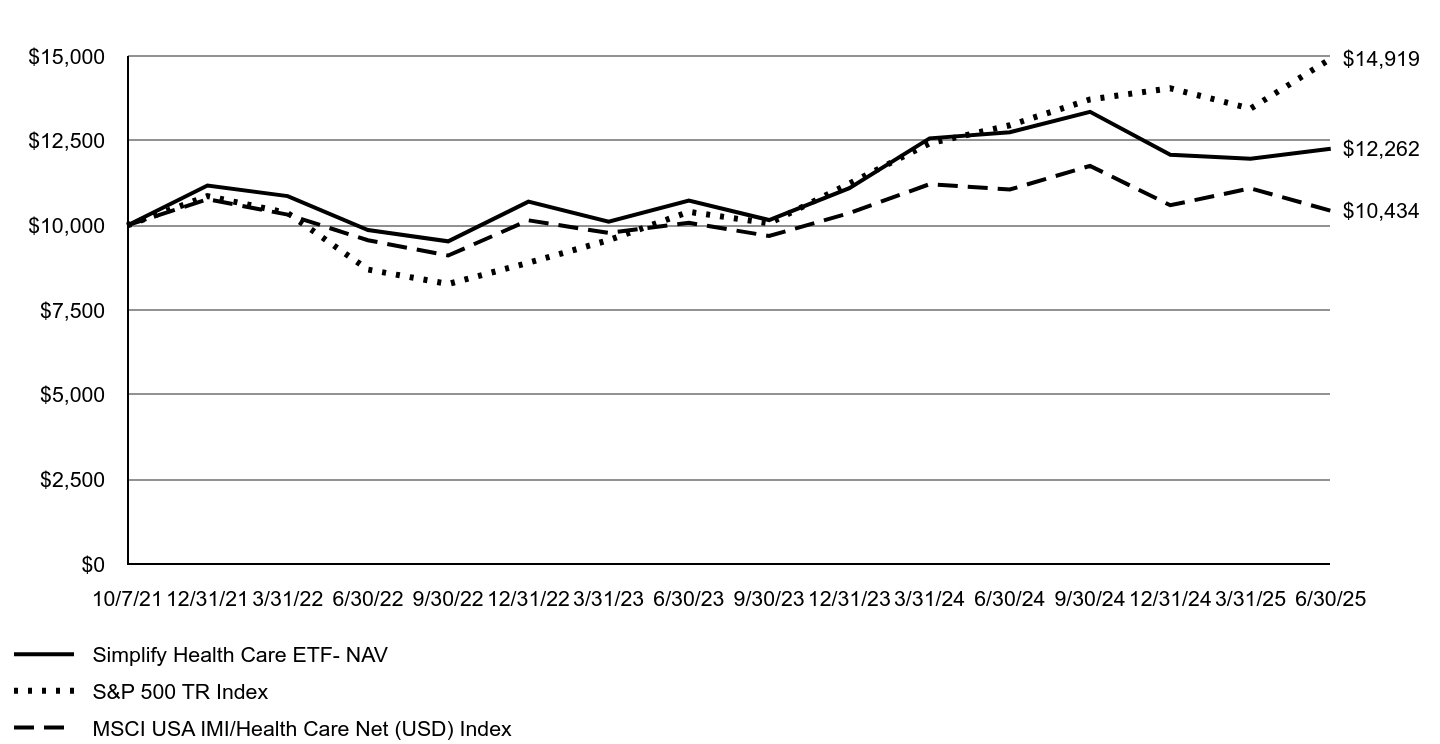
Management's Discussion of Fund PerformanceFor the year ended June 30, 2025, PINK returned -3.84% vs the return of -5.66% of MSCI USA IMI/Health Care Net Index for the same period, outperforming the index by 1.82%. PINK's outperformance is attributed to bottoms-up analysis, tactical trading, and strategic weightings in subsectors. In FY2025, stock selection played the most significant role, avoiding major drawdowns and identifying alpha-generating stocks across subsectors. Looking ahead, PINK’s will employ rigorous bottom-up fundamental analysis, leveraging mosaic theory, industry insights, and channel checks seeking to identify high-conviction alpha opportunities. |
|
| Performance Past Does Not Indicate Future [Text] |
The Fund's past performance is not a good predictor of future performance.
|
|
| Line Graph [Table Text Block] |
| Simplify Health Care ETF- NAV | S&P 500 TR Index | MSCI USA IMI/Health Care Net (USD) Index |
|---|
10/7/21 | $10,000 | $10,000 | $10,000 |
|---|
12/31/21 | $11,178 | $10,866 | $10,774 |
|---|
3/31/22 | $10,865 | $10,366 | $10,318 |
|---|
6/30/22 | $9,863 | $8,697 | $9,563 |
|---|
9/30/22 | $9,531 | $8,272 | $9,112 |
|---|
12/31/22 | $10,701 | $8,898 | $10,151 |
|---|
3/31/23 | $10,109 | $9,565 | $9,778 |
|---|
6/30/23 | $10,731 | $10,401 | $10,076 |
|---|
9/30/23 | $10,159 | $10,060 | $9,689 |
|---|
12/31/23 | $11,102 | $11,237 | $10,364 |
|---|
3/31/24 | $12,570 | $12,423 | $11,218 |
|---|
6/30/24 | $12,752 | $12,955 | $11,060 |
|---|
9/30/24 | $13,352 | $13,718 | $11,758 |
|---|
12/31/24 | $12,087 | $14,048 | $10,596 |
|---|
3/31/25 | $11,967 | $13,448 | $11,095 |
|---|
6/30/25 | $12,262 | $14,919 | $10,434 |
|---|
|
|
| Average Annual Return [Table Text Block] |
AVERAGE ANNUAL TOTAL RETURN
Fund/Index | 1 Year | Since Inception
10/7/2021 |
|---|
Simplify Health Care ETF - NAV | -3.84% | 5.62% |
|---|
S&P 500 TR Index | 15.16% | 11.33% |
|---|
MSCI USA IMI/Health Care Net (USD) Index | -5.66% | 1.15% |
|---|
|
|
| Performance Inception Date |
Oct. 07, 2021
|
|
| No Deduction of Taxes [Text Block] |
The graph and table do not reflect deduction of taxes that a shareholder would pay on Fund distributions or redemption of Fund shares.
|
|
| AssetsNet |
$ 130,567,740
|
|
| Holdings Count | Holding |
65
|
|
| Advisory Fees Paid, Amount |
$ 832,382
|
|
| InvestmentCompanyPortfolioTurnover |
201.00%
|
|
| Additional Fund Statistics [Text Block] |
The following table outlines key fund statistics that you should pay attention to. Fund net assets | $130,567,740 |
|---|
Total number of portfolio holdings | 65 |
|---|
Total advisory fee paid | $832,382 |
|---|
Portfolio turnover rate | 201% |
|---|
|
|
| Holdings [Text Block] |
Investment Categories | % of Net Assets |
|---|
Common Stocks | 96.0% |
|---|
Money Market Funds | 4.0% |
|---|
Other Assets in Excess of Liabilities | 0.0%Footnote Reference† |
|---|
Total | 100.0% |
|---|
| Footnote | Description | Footnote† | Less than 0.05% |
|
|
| Material Fund Change [Text Block] |
|
|
| C000231201 |
|
|
| Shareholder Report [Line Items] |
|
|
| Fund Name |
Simplify Hedged Equity ETF
|
|
| Class Name |
Simplify Hedged Equity ETF
|
|
| No Trading Symbol [Flag] |
true
|
|
| Security Exchange Name |
NYSEArca
|
|
| Annual or Semi-Annual Statement [Text Block] |
This annual shareholder report contains important information about Simplify Hedged Equity ETF (the "Fund") for the period of July 1, 2024 to June 30, 2025.
|
|
| Shareholder Report Annual or Semi-Annual |
annual shareholder report
|
|
| Additional Information [Text Block] |
You can find additional information about the Fund at www.simplify.us/resources. You can also request this information by contacting us at (855) 772-8488.
|
|
| Additional Information Phone Number |
(855) 772-8488
|
|
| Additional Information Website |
www.simplify.us/resources
|
|
| Expenses [Text Block] |
What were the Fund’s costs for the last year? (based on a hypothetical $10,000 investment) Fund | Costs of a $10,000 investment | Costs paid as a
percentage of a $10,000 investment |
|---|
Simplify Hedged Equity ETF | $45 | 0.42% |
|---|
|
|
| Expenses Paid, Amount |
$ 45
|
|
| Expense Ratio, Percent |
0.42%
|
|
| Factors Affecting Performance [Text Block] |
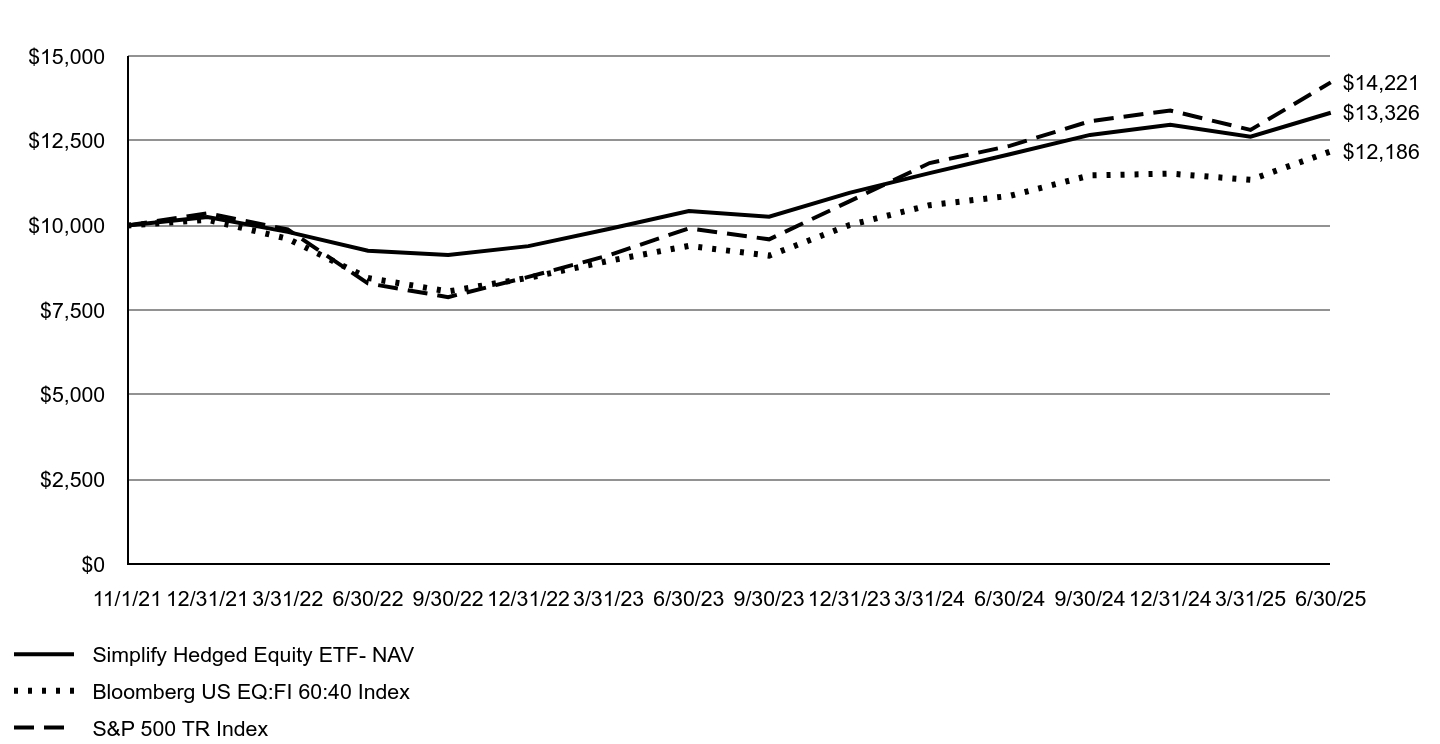
Management's Discussion of Fund PerformanceFor the year ended June 30, 2025, HEQT returned 10.13% vs Bloomberg US EQ:FI 60:40 Index, which had a return of 12.07% for the same period, under-performing the index by 1.94%. Over the past year, U.S. equities have demonstrated resilience and recovery following a turbulent early 2025 period. The large-cap market rebounded approximately 25% from spring lows, supported by easing tariff concerns, strong earnings, and labor market data. After declining nearly 19% in April due to the unexpected “Liberation Day” tariffs, markets recovered on policy adjustments and coordinated intervention, reaching record highs by late June. During the drawdown, HEQT provided downside protection through its systematic collar strategy. As equities rebounded, HEQT lagged due to capped upside exposure, a trade-off of its risk-managed design. Nonetheless, HEQT reduced portfolio volatility and drawdown risk. Looking ahead, HEQT will seek to continue to allow investors access to U.S. large cap U.S. equities while hedging downside volatility with a risk-managed options overlay. |
|
| Performance Past Does Not Indicate Future [Text] |
The Fund's past performance is not a good predictor of future performance.
|
|
| Line Graph [Table Text Block] |
| Simplify Hedged Equity ETF- NAV | Bloomberg US EQ:FI 60:40 Index | S&P 500 TR Index |
|---|
11/1/21 | $10,000 | $10,000 | $10,000 |
|---|
12/31/21 | $10,251 | $10,168 | $10,357 |
|---|
3/31/22 | $9,810 | $9,606 | $9,881 |
|---|
6/30/22 | $9,254 | $8,449 | $8,290 |
|---|
9/30/22 | $9,128 | $8,053 | $7,885 |
|---|
12/31/22 | $9,389 | $8,454 | $8,481 |
|---|
3/31/23 | $9,895 | $8,953 | $9,117 |
|---|
6/30/23 | $10,425 | $9,398 | $9,914 |
|---|
9/30/23 | $10,258 | $9,108 | $9,590 |
|---|
12/31/23 | $10,961 | $10,010 | $10,711 |
|---|
3/31/24 | $11,545 | $10,597 | $11,841 |
|---|
6/30/24 | $12,101 | $10,873 | $12,349 |
|---|
9/30/24 | $12,671 | $11,476 | $13,076 |
|---|
12/31/24 | $12,968 | $11,529 | $13,391 |
|---|
3/31/25 | $12,620 | $11,346 | $12,819 |
|---|
6/30/25 | $13,326 | $12,186 | $14,221 |
|---|
|
|
| Average Annual Return [Table Text Block] |
AVERAGE ANNUAL TOTAL RETURN
Fund/Index | 1 Year | Since Inception
11/1/2021 |
|---|
Simplify Hedged Equity ETF - NAV | 10.13% | 8.16% |
|---|
S&P 500 TR Index | 15.16% | 10.10% |
|---|
Bloomberg US EQ:FI 60:40 Index | 12.07% | 5.55% |
|---|
|
|
| Performance Inception Date |
Nov. 01, 2021
|
|
| No Deduction of Taxes [Text Block] |
The graph and table do not reflect deduction of taxes that a shareholder would pay on Fund distributions or redemption of Fund shares.
|
|
| AssetsNet |
$ 331,626,457
|
|
| Holdings Count | Holding |
5
|
|
| Advisory Fees Paid, Amount |
$ 1,258,330
|
|
| InvestmentCompanyPortfolioTurnover |
5.00%
|
|
| Additional Fund Statistics [Text Block] |
The following table outlines key fund statistics that you should pay attention to. Fund net assets | $331,626,457 |
|---|
Total number of portfolio holdings | 5 |
|---|
Total advisory fee paid | $1,258,330 |
|---|
Portfolio turnover rate | 5% |
|---|
|
|
| Holdings [Text Block] |
Investment Categories | % of Net Assets |
|---|
U.S. Exchange-Traded Funds | 104.8% |
|---|
Purchased Options | 0.4% |
|---|
Money Market Funds | 0.1% |
|---|
Liabilities in Excess of Other Assets | (5.3)% |
|---|
Total | 100.0% |
|---|
|
|
| Material Fund Change [Text Block] |
|
|
| C000233895 |
|
|
| Shareholder Report [Line Items] |
|
|
| Fund Name |
Simplify High Yield ETF
|
|
| Class Name |
Simplify High Yield ETF
|
|
| No Trading Symbol [Flag] |
true
|
|
| Security Exchange Name |
NYSEArca
|
|
| Annual or Semi-Annual Statement [Text Block] |
This annual shareholder report contains important information about Simplify High Yield ETF (the "Fund") for the period of July 1, 2024 to June 30, 2025.
|
|
| Shareholder Report Annual or Semi-Annual |
annual shareholder report
|
|
| Additional Information [Text Block] |
You can find additional information about the Fund at www.simplify.us/resources. You can also request this information by contacting us at (855) 772-8488.
|
|
| Material Fund Change Notice [Text Block] |
This report describes changes to the Fund that occurred during the reporting period.
|
|
| Additional Information Phone Number |
(855) 772-8488
|
|
| Additional Information Website |
www.simplify.us/resources
|
|
| Expenses [Text Block] |
What were the Fund’s costs for the last year? (based on a hypothetical $10,000 investment) Fund | Costs of a $10,000 investment | Costs paid as a
percentage of a $10,000 investment |
|---|
Simplify High Yield ETF | $27 | 0.25% |
|---|
|
|
| Expenses Paid, Amount |
$ 27
|
|
| Expense Ratio, Percent |
0.25%
|
|
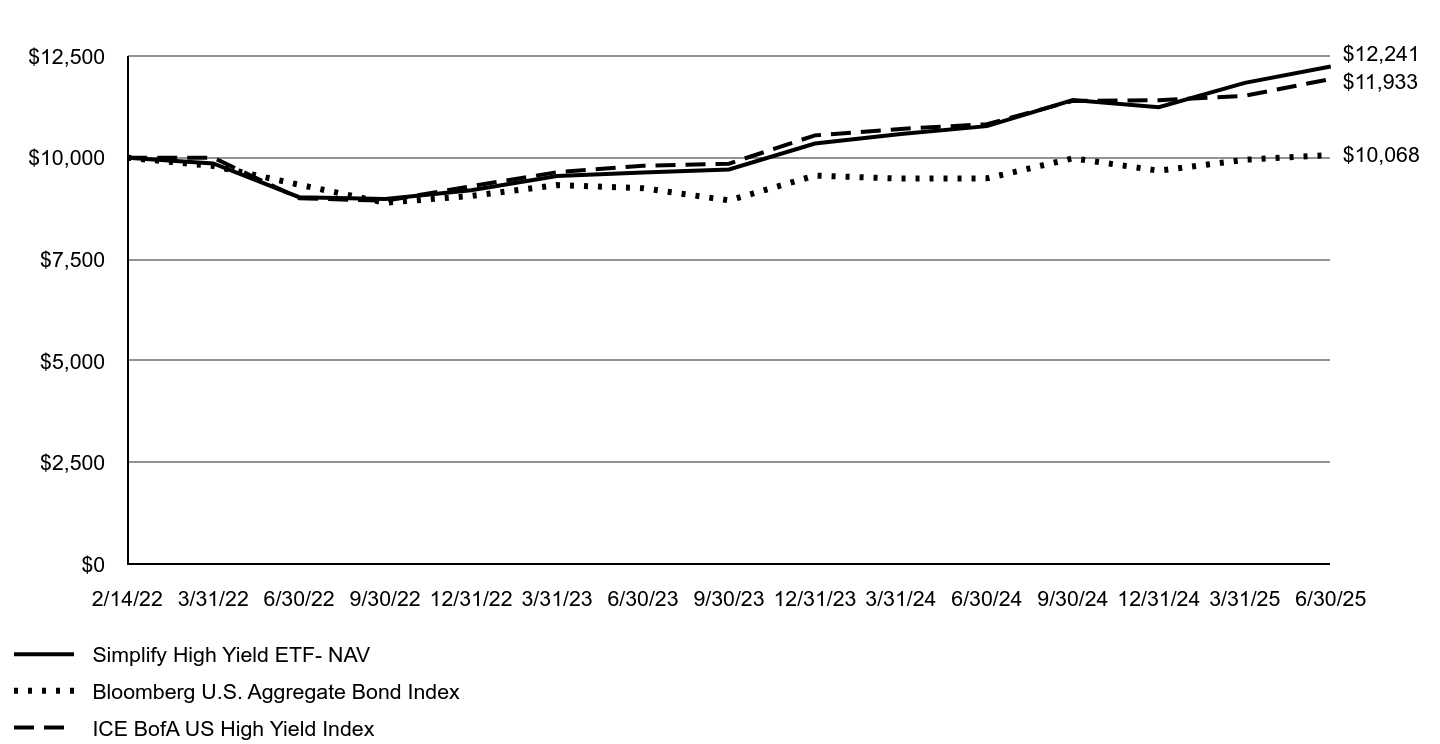
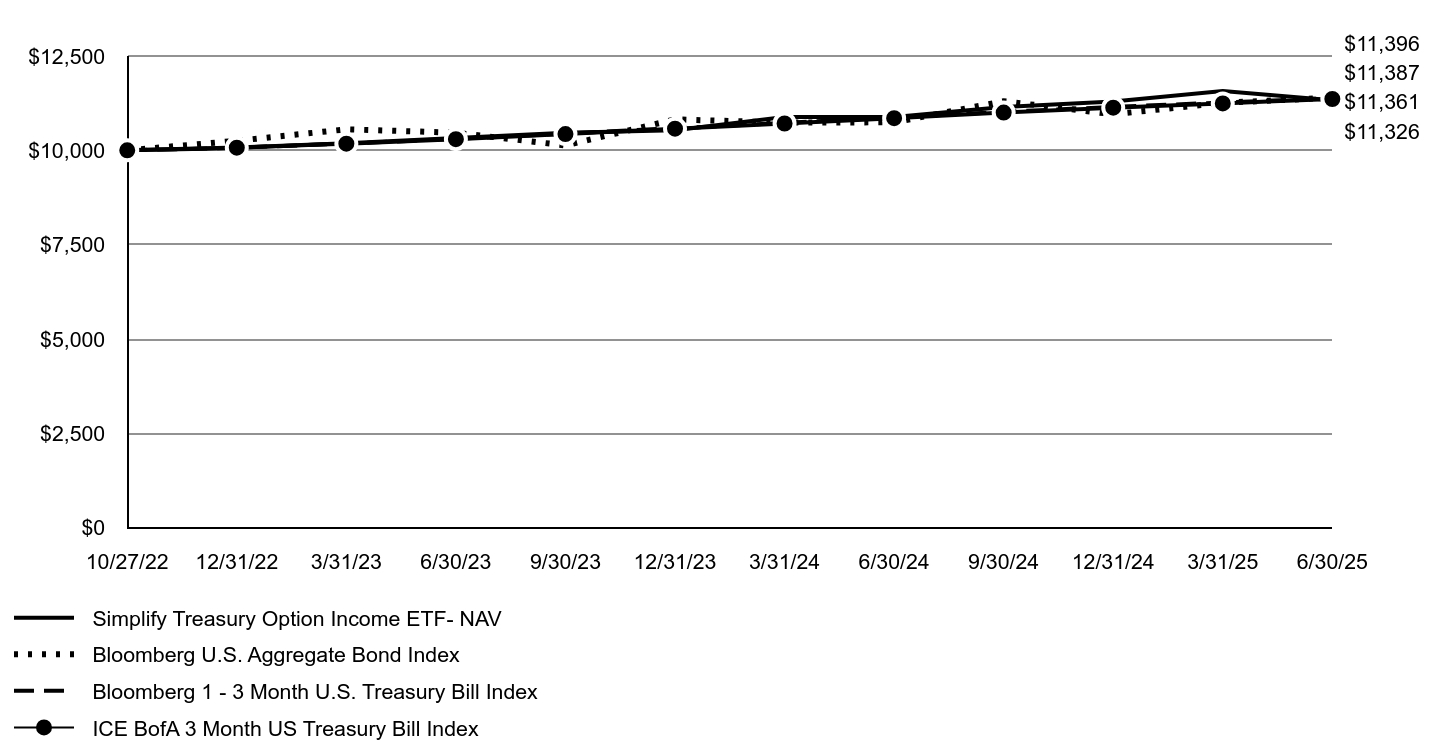
| Factors Affecting Performance [Text Block] |
Management's Discussion of Fund PerformanceFor the year ended June 30, 2025, CDX returned 13.60% vs the ICE BofA U.S. High Yield Index return of 10.24% for the same period, outperforming the benchmark by +3.36%. Over the period, High Yield spreads were relatively unchanged starting the fiscal year at 3.09% and ending the year at 2.90%. However, there were two impactful periods of spread widening occurring in August of 2024 and April 2025, which led to strong returns from CDX. The two key drivers of outperformance continue to be the embedded credit hedge overlay, referred to as ‘Quality minus Junk’ or ‘Q-J’ as well as the favorable funding received on the Total Return Swap for iShares iBoxx $ High Yield Corporate Bond ETF. Over the trailing 12-month period, the Quality basket of the hedge returned +11.97% while the short Junk basket of the hedge returned +0.03%, providing a performance tailwind as the strategy is long Quality and short Junk. Looking forward, CDX is modestly over-hedged due to tight credit spreads and deteriorating US growth. Tight conditions and high bankruptcy filings suggest outperformance if spreads widen. |
|
| Performance Past Does Not Indicate Future [Text] |
The Fund's past performance is not a good predictor of future performance.
|
|
| Line Graph [Table Text Block] |
| Simplify High Yield ETF- NAV | Bloomberg U.S. Aggregate Bond Index | ICE BofA US High Yield Index |
|---|
2/14/22 | $10,000 | $10,000 | $10,000 |
|---|
3/31/22 | $9,859 | $9,795 | $9,999 |
|---|
6/30/22 | $9,027 | $9,335 | $9,002 |
|---|
9/30/22 | $8,983 | $8,892 | $8,941 |
|---|
12/31/22 | $9,200 | $9,058 | $9,297 |
|---|
3/31/23 | $9,551 | $9,326 | $9,643 |
|---|
6/30/23 | $9,636 | $9,248 | $9,800 |
|---|
9/30/23 | $9,709 | $8,949 | $9,852 |
|---|
12/31/23 | $10,347 | $9,559 | $10,548 |
|---|
3/31/24 | $10,583 | $9,485 | $10,707 |
|---|
6/30/24 | $10,775 | $9,491 | $10,824 |
|---|
9/30/24 | $11,417 | $9,984 | $11,395 |
|---|
12/31/24 | $11,239 | $9,678 | $11,413 |
|---|
3/31/25 | $11,839 | $9,948 | $11,521 |
|---|
6/30/25 | $12,241 | $10,068 | $11,933 |
|---|
|
|
| Average Annual Return [Table Text Block] |
AVERAGE ANNUAL TOTAL RETURN
Fund/Index | 1 Year | Since Inception
2/14/2022 |
|---|
Simplify High Yield ETF - NAV | 13.60% | 6.18% |
|---|
Bloomberg U.S. Aggregate Bond Index | 6.08% | 0.20% |
|---|
ICE BofA US High Yield Index | 10.24% | 5.38% |
|---|
|
|
| Performance Inception Date |
Feb. 14, 2022
|
|
| No Deduction of Taxes [Text Block] |
The graph and table do not reflect deduction of taxes that a shareholder would pay on Fund distributions or redemption of Fund shares.
|
|
| AssetsNet |
$ 245,327,789
|
|
| Holdings Count | Holding |
9
|
|
| Advisory Fees Paid, Amount |
$ 358,952
|
|
| InvestmentCompanyPortfolioTurnover |
622.00%
|
|
| Additional Fund Statistics [Text Block] |
The following table outlines key fund statistics that you should pay attention to. Fund net assets | $245,327,789 |
|---|
Total number of portfolio holdings | 9 |
|---|
Total advisory fee paid | $358,952 |
|---|
Portfolio turnover rate | 622% |
|---|
|
|
| Holdings [Text Block] |
Investment Categories | % of Net Assets |
|---|
U.S. Treasury Bills | 97.5% |
|---|
U.S. Exchange-Traded Funds | 0.6% |
|---|
Money Market Funds | 0.5% |
|---|
Purchased Options | 0.2% |
|---|
Other Assets in Excess of Liabilities | 1.2% |
|---|
Total | 100.0% |
|---|
|
|
| Material Fund Change [Text Block] |
This is a summary of certain changes to the Fund since July 1, 2024. For more complete information, you may review the Fund's prospectus dated February 12, 2025, which is available at www.simplify.us/resources or upon request at 1 (855) 772-8488. 1) The Fund changed its name from Simplify High Yield PLUS Credit Hedge ETF to Simplify High Yield ETF, and 2) The Fund added an income generating option strategy to its principal investment strategies and also expanded option-related risk disclosures. |
|
| C000227299 |
|
|
| Shareholder Report [Line Items] |
|
|
| Fund Name |
Simplify Interest Rate Hedge ETF
|
|
| Class Name |
Simplify Interest Rate Hedge ETF
|
|
| No Trading Symbol [Flag] |
true
|
|
| Security Exchange Name |
NYSEArca
|
|
| Annual or Semi-Annual Statement [Text Block] |
This annual shareholder report contains important information about Simplify Interest Rate Hedge ETF (the "Fund") for the period of July 1, 2024 to June 30, 2025.
|
|
| Shareholder Report Annual or Semi-Annual |
annual shareholder report
|
|
| Additional Information [Text Block] |
You can find additional information about the Fund at www.simplify.us/resources. You can also request this information by contacting us at (855) 772-8488.
|
|
| Material Fund Change Notice [Text Block] |
This report describes changes to the Fund that occurred during the reporting period.
|
|
| Additional Information Phone Number |
(855) 772-8488
|
|
| Additional Information Website |
www.simplify.us/resources
|
|
| Expenses [Text Block] |
What were the Fund’s costs for the last year? (based on a hypothetical $10,000 investment) Fund | Costs of a $10,000 investment | Costs paid as a
percentage of a $10,000 investment |
|---|
Simplify Interest Rate Hedge ETF | $54 | 0.50% |
|---|
|
|
| Expenses Paid, Amount |
$ 54
|
|
| Expense Ratio, Percent |
0.50%
|
|
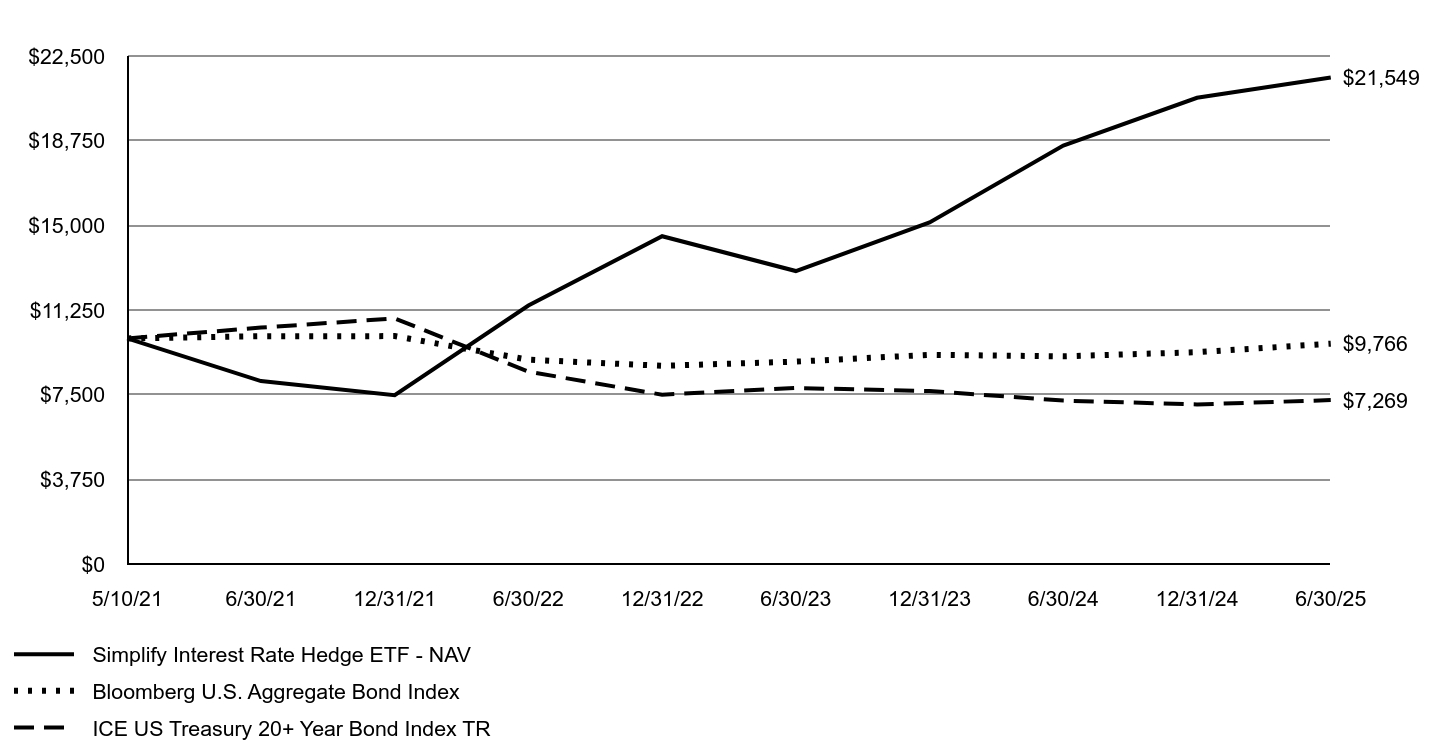
| Factors Affecting Performance [Text Block] |
Management's Discussion of Fund PerformanceFor the year ended June 30, 2025, PFIX returned 16.28% vs. the ICE U.S. Treasury 20+ Year Bond Index return of 0.30% for the same period, outperforming the index by 15.96%. The main reason for the difference is that PFIX holds a position in long-term expiry (5 to 7 years) over the counter (OTC) payer swaptions which function similarly to a long-term put option on the 20-year rate. These swaptions performed well as the forward interest rates that underly them increased. These increases were offset somewhat by time decay on the options and increases in the interest rates used to discount the option payoff. Looking forward, increases in interest rates that drive increases in the forward rates along with increases in implied volatilities would be beneficial to PFIX's performance while decreases in forward rates and declines in implied volatilities would be harmful. The path of future interest rates and implied volatilities is notoriously difficult to predict. |
|
| Performance Past Does Not Indicate Future [Text] |
The Fund's past performance is not a good predictor of future performance.
|
|
| Line Graph [Table Text Block] |
| Simplify Interest Rate Hedge ETF - NAV | Bloomberg U.S. Aggregate Bond Index | ICE US Treasury 20+ Year Bond Index TR |
|---|
5/10/21 | $10,000 | $10,000 | $10,000 |
|---|
6/30/21 | $8,111 | $10,095 | $10,478 |
|---|
12/31/21 | $7,489 | $10,101 | $10,885 |
|---|
6/30/22 | $11,452 | $9,056 | $8,527 |
|---|
12/31/22 | $14,523 | $8,787 | $7,506 |
|---|
6/30/23 | $12,981 | $8,971 | $7,805 |
|---|
12/31/23 | $15,133 | $9,273 | $7,669 |
|---|
6/30/24 | $18,534 | $9,207 | $7,247 |
|---|
12/31/24 | $20,650 | $9,389 | $7,076 |
|---|
6/30/25 | $21,549 | $9,766 | $7,269 |
|---|
|
|
| Average Annual Return [Table Text Block] |
AVERAGE ANNUAL TOTAL RETURN
Fund/Index | 1 Year | Since Inception
5/10/2021 |
|---|
Simplify Interest Rate Hedge ETF - NAV | 16.28% | 20.38% |
|---|
Bloomberg U.S. Aggregate Bond Index | 6.08% | -0.57% |
|---|
ICE US Treasury 20+ Year Bond Index TR | 0.30% | -7.42% |
|---|
|
|
| Performance Inception Date |
May 10, 2021
|
|
| No Deduction of Taxes [Text Block] |
The graph and table do not reflect deduction of taxes that a shareholder would pay on Fund distributions or redemption of Fund shares.
|
|
| AssetsNet |
$ 156,051,239
|
|
| Holdings Count | Holding |
12
|
|
| Advisory Fees Paid, Amount |
$ 754,832
|
|
| InvestmentCompanyPortfolioTurnover |
0.00%
|
|
| Additional Fund Statistics [Text Block] |
The following table outlines key fund statistics that you should pay attention to. Fund net assets | $156,051,239 |
|---|
Total number of portfolio holdings | 12 |
|---|
Total advisory fee paid | $754,832 |
|---|
Portfolio turnover rate | 0% |
|---|
|
|
| Holdings [Text Block] |
Investment Categories | % of Net Assets |
|---|
U.S. Treasury Bills | 61.1% |
|---|
U.S. Government Obligations | 28.1% |
|---|
Purchased Swaptions | 10.1% |
|---|
Money Market Funds | 0.2% |
|---|
Other Assets in Excess of Liabilities | 0.5% |
|---|
Total | 100.0% |
|---|
|
|
| Material Fund Change [Text Block] |
This is a summary of certain changes to the Fund since July 1, 2024. For more complete information, you may review the Fund's prospectus dated February 12, 2025, which is available at www.simplify.us/resources or upon request at 1 (855) 772-8488. Changes were made to the Fund’s investment strategy to enhance the description of asset allocation, swaptions and the potential impact of interest rate risk on the Fund’s investments. |
|
| C000230231 |
|
|
| Shareholder Report [Line Items] |
|
|
| Fund Name |
Simplify Intermediate Term Treasury Futures Strategy ETF
|
|
| Class Name |
Simplify Intermediate Term Treasury Futures Strategy ETF
|
|
| No Trading Symbol [Flag] |
true
|
|
| Security Exchange Name |
CboeBZX
|
|
| Annual or Semi-Annual Statement [Text Block] |
This annual shareholder report contains important information about Simplify Intermediate Term Treasury Futures Strategy ETF (the "Fund") for the period of July 1, 2024 to June 30, 2025.
|
|
| Shareholder Report Annual or Semi-Annual |
annual shareholder report
|
|
| Additional Information [Text Block] |
You can find additional information about the Fund at www.simplify.us/resources. You can also request this information by contacting us at (855) 772-8488.
|
|
| Additional Information Phone Number |
(855) 772-8488
|
|
| Additional Information Website |
www.simplify.us/resources
|
|
| Expenses [Text Block] |
What were the Fund’s costs for the last year? (based on a hypothetical $10,000 investment) Fund | Costs of a $10,000 investment | Costs paid as a
percentage of a $10,000 investment |
|---|
Simplify Intermediate Term Treasury Futures Strategy ETF | $16 | 0.15% |
|---|
|
|
| Expenses Paid, Amount |
$ 16
|
|
| Expense Ratio, Percent |
0.15%
|
|
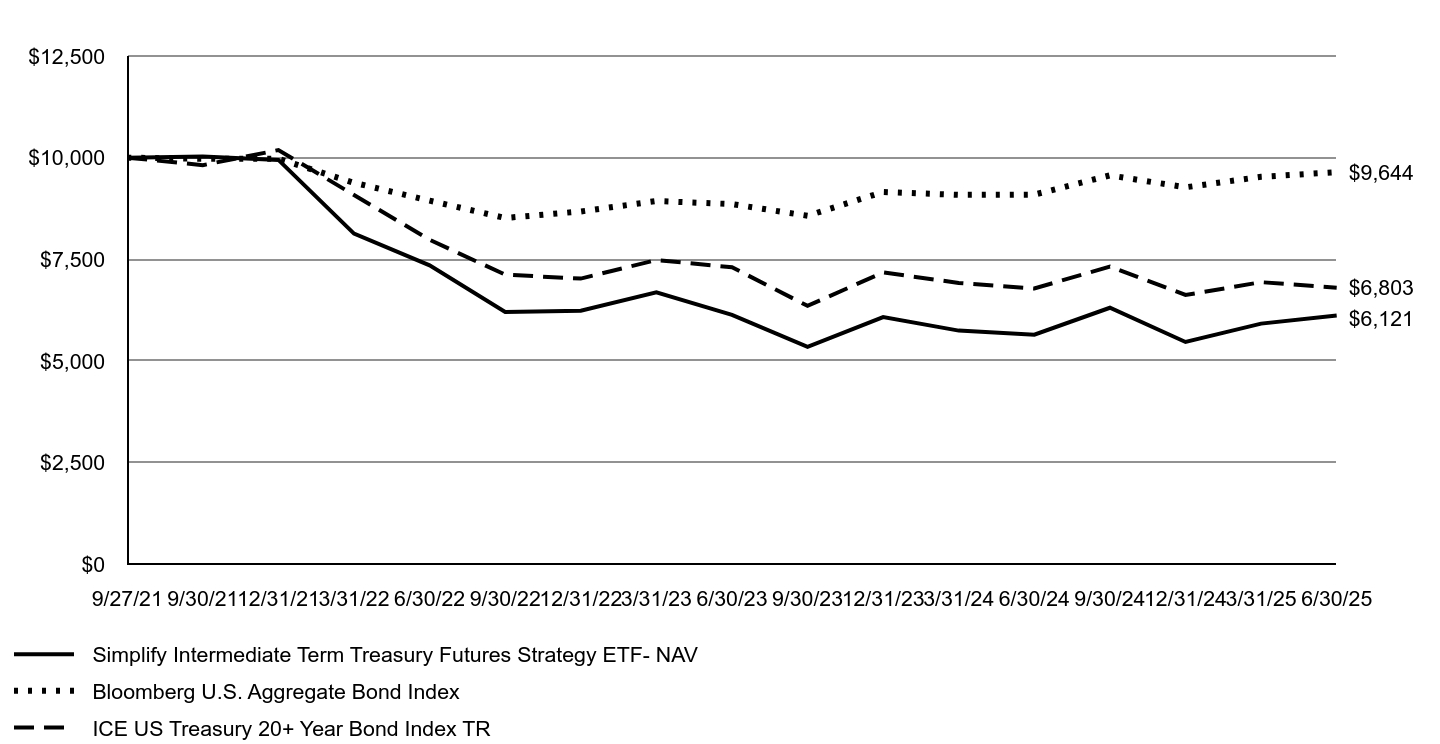
| Factors Affecting Performance [Text Block] |
Management's Discussion of Fund PerformanceFor the year ended June 30, 2025, TYA returned 8.42% vs. the ICE U.S. Treasury 20+ Year Bond Index's return of 0.30% for the same period, outperforming the index by 8.12%. The primary drivers of return were TYA’s long position in near-to-expiry 10-year U.S. Treasury futures and its holdings of short-term Treasuries and cash. A long futures position earns the return of the cheapest-to-deliver bond in exchange for paying a short-term financing rate. The intermediate part of the yield curve was most attractive this year, as long-term rates remained elevated amid concerns over tariff-driven inflation and the U.S. fiscal outlook. TYA benefited from its positioning, leveraged up to three times, as the intermediate sector presented a more favorable risk-reward tradeoff than owning long-duration bonds outright. Looking forward, TYA’s future performance will depend on interest rate movements—declines and curve steepening would benefit returns, while rising intermediate rates would detract. |
|
| Performance Past Does Not Indicate Future [Text] |
The Fund's past performance is not a good predictor of future performance.
|
|
| Line Graph [Table Text Block] |
| Simplify Intermediate Term Treasury Futures Strategy ETF- NAV | Bloomberg U.S. Aggregate Bond Index | ICE US Treasury 20+ Year Bond Index TR |
|---|
9/27/21 | $10,000 | $10,000 | $10,000 |
|---|
9/30/21 | $10,031 | $9,973 | $9,816 |
|---|
12/31/21 | $9,944 | $9,974 | $10,187 |
|---|
3/31/22 | $8,132 | $9,382 | $9,083 |
|---|
6/30/22 | $7,353 | $8,942 | $7,981 |
|---|
9/30/22 | $6,204 | $8,517 | $7,123 |
|---|
12/31/22 | $6,238 | $8,677 | $7,026 |
|---|
3/31/23 | $6,688 | $8,934 | $7,483 |
|---|
6/30/23 | $6,132 | $8,858 | $7,305 |
|---|
9/30/23 | $5,345 | $8,572 | $6,356 |
|---|
12/31/23 | $6,078 | $9,156 | $7,177 |
|---|
3/31/24 | $5,747 | $9,085 | $6,920 |
|---|
6/30/24 | $5,646 | $9,091 | $6,783 |
|---|
9/30/24 | $6,309 | $9,564 | $7,322 |
|---|
12/31/24 | $5,468 | $9,271 | $6,623 |
|---|
3/31/25 | $5,919 | $9,529 | $6,938 |
|---|
6/30/25 | $6,121 | $9,644 | $6,803 |
|---|
|
|
| Average Annual Return [Table Text Block] |
AVERAGE ANNUAL TOTAL RETURN
Fund/Index | 1 Year | Since Inception
9/27/2021 |
|---|
Simplify Intermediate Term Treasury Futures Strategy ETF - NAV | 8.42% | -12.25% |
|---|
Bloomberg U.S. Aggregate Bond Index | 6.08% | -0.96% |
|---|
ICE US Treasury 20+ Year Bond Index TR | 0.30% | -9.75% |
|---|
|
|
| Performance Inception Date |
Sep. 27, 2021
|
|
| No Deduction of Taxes [Text Block] |
The graph and table do not reflect deduction of taxes that a shareholder would pay on Fund distributions or redemption of Fund shares.
|
|
| AssetsNet |
$ 152,686,772
|
|
| Holdings Count | Holding |
6
|
|
| Advisory Fees Paid, Amount |
$ 179,227
|
|
| InvestmentCompanyPortfolioTurnover |
0.00%
|
|
| Additional Fund Statistics [Text Block] |
The following table outlines key fund statistics that you should pay attention to. Fund net assets | $152,686,772 |
|---|
Total number of portfolio holdings | 6 |
|---|
Total advisory fee paid | $179,227 |
|---|
Portfolio turnover rate | 0% |
|---|
|
|
| Holdings [Text Block] |
Investment Categories | % of Net Assets |
|---|
U.S. Treasury Bills | 98.6% |
|---|
Money Market Funds | 0.1% |
|---|
Other Assets in Excess of Liabilities | 1.3% |
|---|
Total | 100.0% |
|---|
|
|
| Material Fund Change [Text Block] |
|
|
| C000246389 |
|
|
| Shareholder Report [Line Items] |
|
|
| Fund Name |
Simplify MBS ETF
|
|
| Class Name |
Simplify MBS ETF
|
|
| No Trading Symbol [Flag] |
true
|
|
| Security Exchange Name |
NYSEArca
|
|
| Annual or Semi-Annual Statement [Text Block] |
This annual shareholder report contains important information about Simplify MBS ETF (the "Fund") for the period of July 1, 2024 to June 30, 2025.
|
|
| Shareholder Report Annual or Semi-Annual |
annual shareholder report
|
|
| Additional Information [Text Block] |
You can find additional information about the Fund at www.simplify.us/resources. You can also request this information by contacting us at (855) 772-8488.
|
|
| Additional Information Phone Number |
(855) 772-8488
|
|
| Additional Information Website |
www.simplify.us/resources
|
|
| Expenses [Text Block] |
What were the Fund’s costs for the last year? (based on a hypothetical $10,000 investment) Fund | Costs of a $10,000 investment | Costs paid as a
percentage of a $10,000 investment |
|---|
Simplify MBS ETF | $15 | 0.15% |
|---|
|
|
| Expenses Paid, Amount |
$ 15
|
|
| Expense Ratio, Percent |
0.15%
|
|
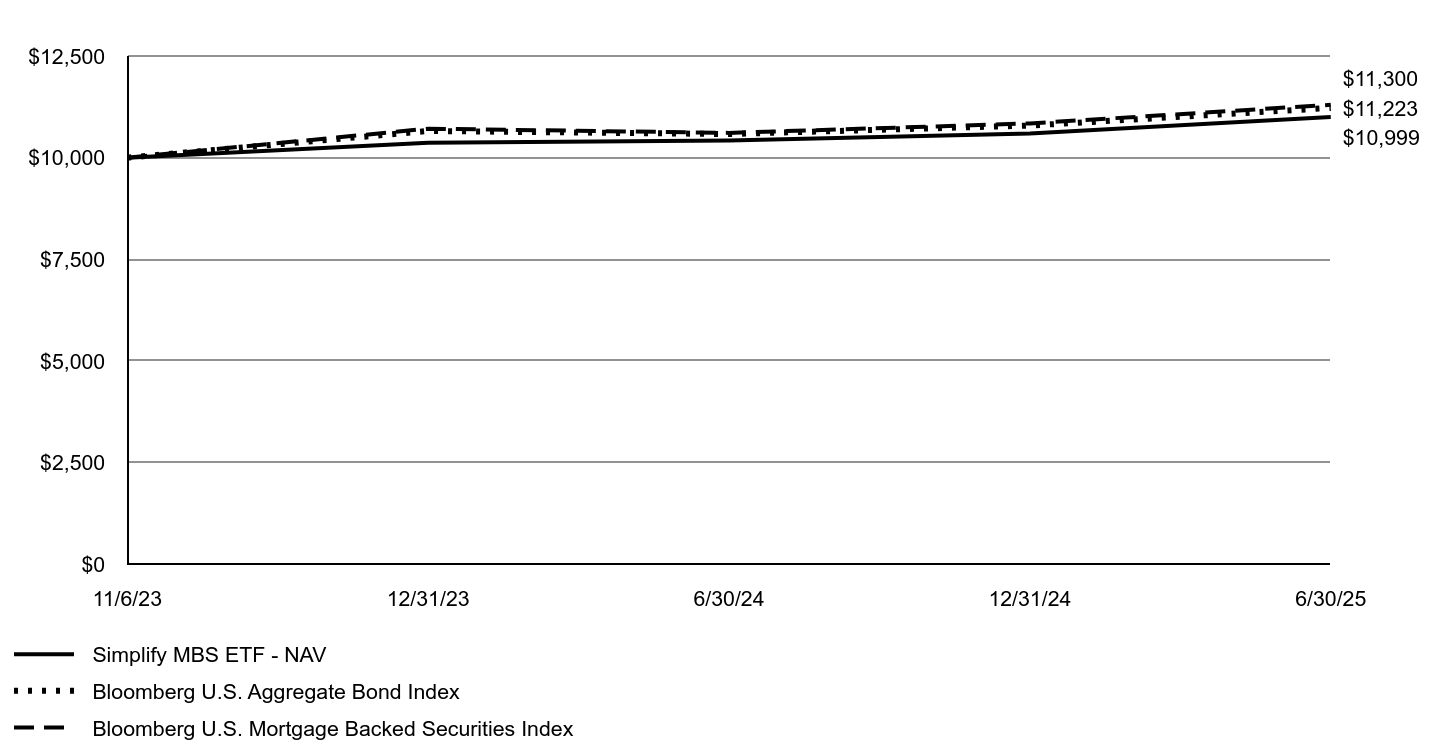
| Factors Affecting Performance [Text Block] |
Management's Discussion of Fund PerformanceFor the year ended June 30, 2025, MTBA returned 5.52% vs. the 6.52% return of the Bloomberg U.S. Mortgage Backed Securities Index for the same period, underperforming the index by 1.00%. MTBA invests in current coupon agency mortgage-backed securities (MBS) via TBA – “To-Be-Announced” contracts in the over-the-counter market. These positions accrue mortgage interest, incur financing charges, and experience mark-to-market gains and losses from interest rate changes.Mortgage rates were volatile over the period but the rates hovered above 6% generating attractive yield. TBA positions are notional, leaving cash to be invested in short-term treasuries. Looking forward, we believe MTBA's performance is sensitive to changes in fixed-rate mortgage rates and short-term financing rates. Mortgage rates depend on multiple points on the term structure, volatilities, and supply-demand dynamics, all of which are challenging to predict. |
|
| Performance Past Does Not Indicate Future [Text] |
The Fund's past performance is not a good predictor of future performance.
|
|
| Line Graph [Table Text Block] |
| Simplify MBS ETF - NAV | Bloomberg U.S. Aggregate Bond Index | Bloomberg U.S. Mortgage Backed Securities Index |
|---|
11/6/23 | $10,000 | $10,000 | $10,000 |
|---|
12/31/23 | $10,367 | $10,656 | $10,713 |
|---|
6/30/24 | $10,424 | $10,581 | $10,609 |
|---|
12/31/24 | $10,595 | $10,790 | $10,842 |
|---|
6/30/25 | $10,999 | $11,223 | $11,300 |
|---|
|
|
| Average Annual Return [Table Text Block] |
AVERAGE ANNUAL TOTAL RETURN
Fund/Index | 1 Year | Since Inception
11/6/2023 |
|---|
Simplify MBS ETF - NAV | 5.52% | 5.95% |
|---|
Bloomberg U.S. Aggregate Bond Index | 6.08% | 7.25% |
|---|
Bloomberg U.S. Mortgage Backed Securities Index | 6.52% | 7.69% |
|---|
|
|
| Performance Inception Date |
Nov. 06, 2023
|
|
| No Deduction of Taxes [Text Block] |
The graph and table do not reflect deduction of taxes that a shareholder would pay on Fund distributions or redemption of Fund shares.
|
|
| AssetsNet |
$ 1,372,905,745
|
|
| Holdings Count | Holding |
10
|
|
| Advisory Fees Paid, Amount |
$ 2,152,579
|
|
| InvestmentCompanyPortfolioTurnover |
1376.00%
|
|
| Additional Fund Statistics [Text Block] |
The following table outlines key fund statistics that you should pay attention to. Fund net assets | $1,372,905,745 |
|---|
Total number of portfolio holdings | 10 |
|---|
Total advisory fee paid | $2,152,579 |
|---|
Portfolio turnover rate | 1376% |
|---|
|
|
| Holdings [Text Block] |
Investment Categories | % of Net Assets |
|---|
U.S. Government Agency Mortgage Backed Securities | 99.7% |
|---|
U.S. Treasury Bills | 98.3% |
|---|
Money Market Funds | 0.1% |
|---|
Liabilities in Excess of Other Assets | (98.1)% |
|---|
Total | 100.0% |
|---|
|
|
| Material Fund Change [Text Block] |
|
|
| C000249114 |
|
|
| Shareholder Report [Line Items] |
|
|
| Fund Name |
Simplify NEXT Intangible Core Index ETF
|
|
| Class Name |
Simplify NEXT Intangible Core Index ETF
|
|
| No Trading Symbol [Flag] |
true
|
|
| Security Exchange Name |
CboeBZX
|
|
| Annual or Semi-Annual Statement [Text Block] |
This annual shareholder report contains important information about Simplify NEXT Intangible Core Index ETF (the "Fund") for the period of July 1, 2024 to June 30, 2025.
|
|
| Shareholder Report Annual or Semi-Annual |
annual shareholder report
|
|
| Additional Information [Text Block] |
You can find additional information about the Fund at www.simplify.us/resources. You can also request this information by contacting us at (855) 772-8488.
|
|
| Additional Information Phone Number |
(855) 772-8488
|
|
| Additional Information Website |
www.simplify.us/resources
|
|
| Expenses [Text Block] |
What were the Fund’s costs for the last year? (based on a hypothetical $10,000 investment) Fund | Costs of a $10,000 investment | Costs paid as a
percentage of a $10,000 investment |
|---|
Simplify NEXT Intangible Core Index ETF | $28 | 0.25% |
|---|
|
|
| Expenses Paid, Amount |
$ 28
|
|
| Expense Ratio, Percent |
0.25%
|
|
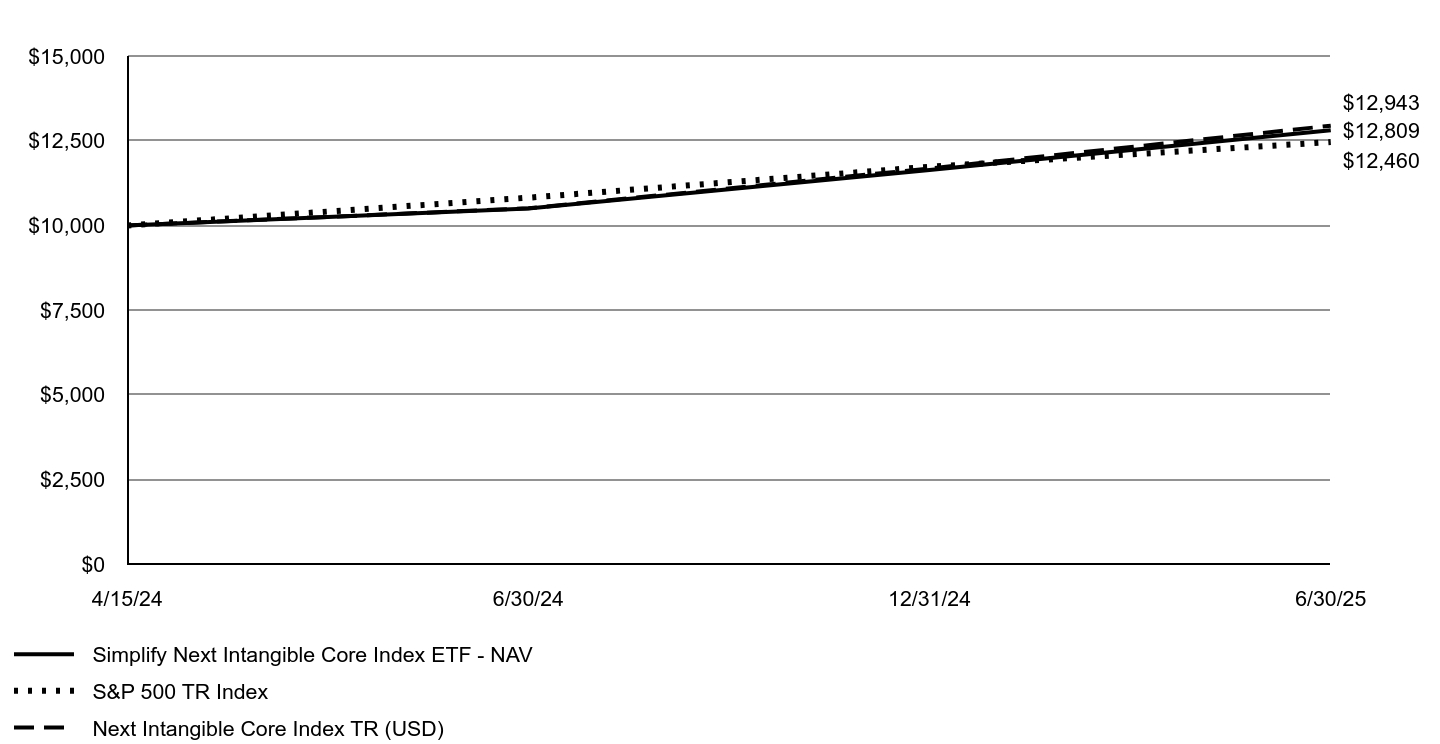
| Factors Affecting Performance [Text Block] |
Management's Discussion of Fund PerformanceFor the year ended June 30, 2025, NXTI returned 21.95% vs. the S&P 500 index return of 15.16%, out-performing by 6.79%. NXTI delivered positive returns across all sectors, with particularly strong stock selection in Information Technology, Healthcare, Consumer Staples, Communication Services, Energy, and Industrials. Key contributors to performance included Palantir Technologies, Walmart, and IBM, which collectively supported the fund’s outperformance. Offsetting some of these gains were negative contributions from Adobe, UnitedHealth Group, and Sarepta Therapeutics. Looking ahead, NXTI will continue to seek companies with high intangible capital-to-book asset ratios within their respective sectors. |
|
| Performance Past Does Not Indicate Future [Text] |
The Fund's past performance is not a good predictor of future performance.
|
|
| Line Graph [Table Text Block] |
| Simplify NEXT Intangible Core Index ETF - NAV | S&P 500 TR Index | Next Intangible Core Index TR (USD) |
|---|
4/15/24 | $10,000 | $10,000 | $10,000 |
|---|
6/30/24 | $10,503 | $10,819 | $10,505 |
|---|
12/31/24 | $11,635 | $11,732 | $11,682 |
|---|
6/30/25 | $12,809 | $12,460 | $12,943 |
|---|
|
|
| Average Annual Return [Table Text Block] |
AVERAGE ANNUAL TOTAL RETURN
Fund/Index | 1 Year | Since Inception
4/15/2024 |
|---|
Simplify NEXT Intangible Core Index ETF - NAV | 21.95% | 22.75% |
|---|
S&P 500 TR Index | 15.16% | 19.96% |
|---|
NEXT Intangible Core Index TR (USD) | 23.20% | 23.80% |
|---|
|
|
| Performance Inception Date |
Apr. 15, 2024
|
|
| No Deduction of Taxes [Text Block] |
The graph and table do not reflect deduction of taxes that a shareholder would pay on Fund distributions or redemption of Fund shares.
|
|
| AssetsNet |
$ 1,538,687
|
|
| Holdings Count | Holding |
201
|
|
| Advisory Fees Paid, Amount |
$ 3,880
|
|
| InvestmentCompanyPortfolioTurnover |
34.00%
|
|
| Additional Fund Statistics [Text Block] |
The following table outlines key fund statistics that you should pay attention to. Fund net assets | $1,538,687 |
|---|
Total number of portfolio holdings | 201 |
|---|
Total advisory fee paid | $3,880 |
|---|
Portfolio turnover rate | 34% |
|---|
|
|
| Holdings [Text Block] |
Investment Categories | % of Net Assets |
|---|
Common Stocks | 99.6% |
|---|
Money Market Funds | 0.4% |
|---|
Other Assets in Excess of Liabilities | 0.0%Footnote Reference† |
|---|
Total | 100.0% |
|---|
| Footnote | Description | Footnote† | Less than 0.05% |
|
|
| Material Fund Change [Text Block] |
|
|
| C000238444 |
|
|
| Shareholder Report [Line Items] |
|
|
| Fund Name |
Simplify Short Term Treasury Futures Strategy ETF
|
|
| Class Name |
Simplify Short Term Treasury Futures Strategy ETF
|
|
| No Trading Symbol [Flag] |
true
|
|
| Security Exchange Name |
NYSEArca
|
|
| Annual or Semi-Annual Statement [Text Block] |
This annual shareholder report contains important information about Simplify Short Term Treasury Futures Strategy ETF (the "Fund") for the period of July 1, 2024 to June 30, 2025.
|
|
| Shareholder Report Annual or Semi-Annual |
annual shareholder report
|
|
| Additional Information [Text Block] |
You can find additional information about the Fund at www.simplify.us/resources. You can also request this information by contacting us at (855) 772-8488.
|
|
| Additional Information Phone Number |
(855) 772-8488
|
|
| Additional Information Website |
www.simplify.us/resources
|
|
| Expenses [Text Block] |
What were the Fund’s costs for the last year? (based on a hypothetical $10,000 investment) Fund | Costs of a $10,000 investment | Costs paid as a
percentage of a $10,000 investment |
|---|
Simplify Short Term Treasury Futures Strategy ETF | $16 | 0.15% |
|---|
|
|
| Expenses Paid, Amount |
$ 16
|
|
| Expense Ratio, Percent |
0.15%
|
|
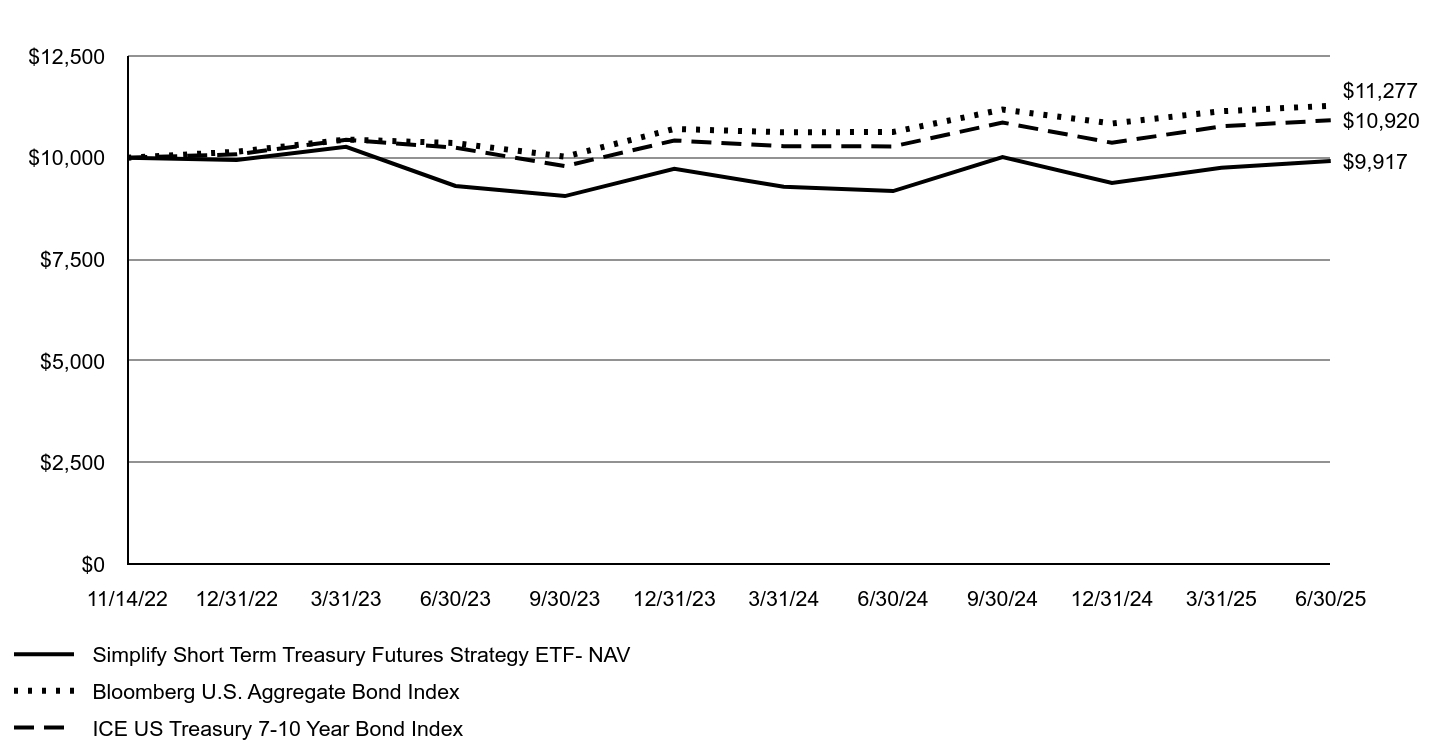
| Factors Affecting Performance [Text Block] |
Management's Discussion of Fund PerformanceFor the year ended June 30, 2025, TUA returned 8.04% vs. the 6.28% return of ICE U.S. Treasury 7-10 Year Bond Index for the same period, outperforming the index by 1.76%. The primary drivers of return were TUA’s long position in the most liquid, near-to-expiry 2-year U.S. Treasury futures contract and its holdings of short-term treasuries and cash. A long position in Treasury futures earns returns on the cheapest to deliver bond in exchange for paying a short-term financing rate. The strategy continues to face headwinds with an inverted yield curve (2-year rates below the Federal Funds rate), causing the coupon earned to be lower than the borrowing rate. However, 2-year rates decreased over the period benefiting TUA’s long exposure to this part of the yield curve, which is leveraged up 5 times. Looking forward, TUA’s performance will depend on interest rates movements. Increases in rates and/or further inversions will generally be harmful and decreases accompanied by steepening would be beneficial. Anticipating the future path interest rates may take and their term structure is challenging. |
|
| Performance Past Does Not Indicate Future [Text] |
The Fund's past performance is not a good predictor of future performance.
|
|
| Line Graph [Table Text Block] |
| Simplify Short Term Treasury Futures Strategy ETF- NAV | Bloomberg U.S. Aggregate Bond Index | ICE US Treasury 7-10 Year Bond Index |
|---|
11/14/22 | $10,000 | $10,000 | $10,000 |
|---|
12/31/22 | $9,940 | $10,146 | $10,081 |
|---|
3/31/23 | $10,267 | $10,446 | $10,438 |
|---|
6/30/23 | $9,303 | $10,358 | $10,244 |
|---|
9/30/23 | $9,055 | $10,024 | $9,792 |
|---|
12/31/23 | $9,725 | $10,707 | $10,422 |
|---|
3/31/24 | $9,286 | $10,624 | $10,283 |
|---|
6/30/24 | $9,179 | $10,631 | $10,277 |
|---|
9/30/24 | $10,014 | $11,183 | $10,864 |
|---|
12/31/24 | $9,380 | $10,841 | $10,366 |
|---|
3/31/25 | $9,753 | $11,142 | $10,770 |
|---|
6/30/25 | $9,917 | $11,277 | $10,920 |
|---|
|
|
| Average Annual Return [Table Text Block] |
AVERAGE ANNUAL TOTAL RETURN
Fund/Index | 1 Year | Since Inception
11/14/2022 |
|---|
Simplify Short Term Treasury Futures Strategy ETF - NAV | 8.04% | -0.32% |
|---|
Bloomberg U.S. Aggregate Bond Index | 6.08% | 4.68% |
|---|
ICE US Treasury 7-10 Year Bond Index | 6.26% | 3.41% |
|---|
|
|
| Performance Inception Date |
Nov. 14, 2022
|
|
| No Deduction of Taxes [Text Block] |
The graph and table do not reflect deduction of taxes that a shareholder would pay on Fund distributions or redemption of Fund shares.
|
|
| AssetsNet |
$ 666,170,733
|
|
| Holdings Count | Holding |
5
|
|
| Advisory Fees Paid, Amount |
$ 914,002
|
|
| InvestmentCompanyPortfolioTurnover |
0.00%
|
|
| Additional Fund Statistics [Text Block] |
The following table outlines key fund statistics that you should pay attention to. Fund net assets | $666,170,733 |
|---|
Total number of portfolio holdings | 5 |
|---|
Total advisory fee paid | $914,002 |
|---|
Portfolio turnover rate | 0% |
|---|
|
|
| Holdings [Text Block] |
Investment Categories | % of Net Assets |
|---|
U.S. Treasury Bills | 99.8% |
|---|
Other Assets in Excess of Liabilities | 0.2% |
|---|
Total | 100.0% |
|---|
|
|
| Material Fund Change [Text Block] |
|
|
| C000259297 |
|
|
| Shareholder Report [Line Items] |
|
|
| Fund Name |
Simplify Target 15 Distribution ETF
|
|
| Class Name |
Simplify Target 15 Distribution ETF
|
|
| No Trading Symbol [Flag] |
true
|
|
| Security Exchange Name |
NYSEArca
|
|
| Annual or Semi-Annual Statement [Text Block] |
This annual shareholder report contains important information about Simplify Target 15 Distribution ETF (the "Fund") for the period of April 14, 2025 (commencement of operations) to June 30, 2025.
|
|
| Shareholder Report Annual or Semi-Annual |
annual shareholder report
|
|
| Additional Information [Text Block] |
You can find additional information about the Fund at www.simplify.us/resources. You can also request this information by contacting us at (855) 772-8488.
|
|
| Additional Information Phone Number |
(855) 772-8488
|
|
| Additional Information Website |
www.simplify.us/resources
|
|
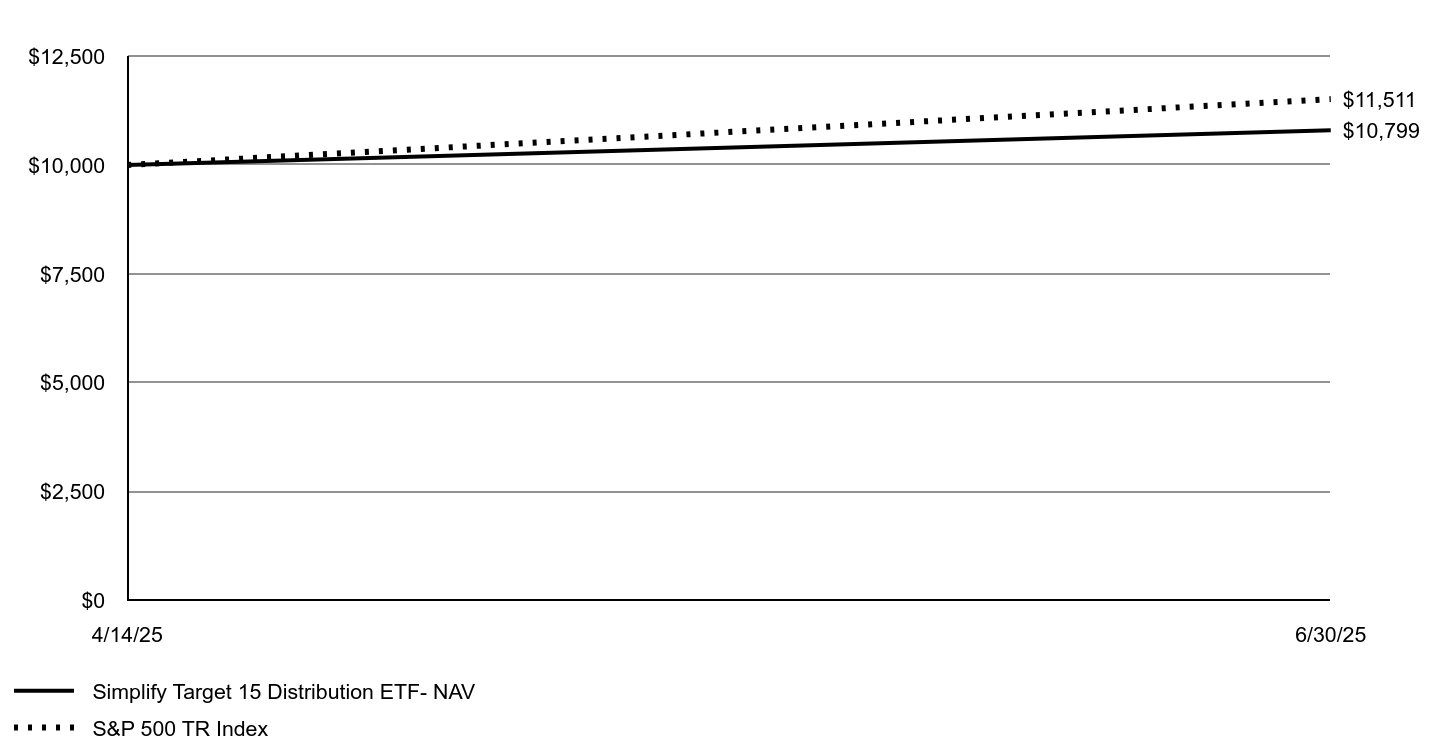
| Expenses [Text Block] |
What were the Fund’s costs for the period? (based on a hypothetical $10,000 investment) Fund | Costs of a $10,000 investment | Costs paid as a
percentage of a $10,000 investment |
|---|
Simplify Target 15 Distribution ETF | $16Footnote Reference(1) | 0.75% |
|---|
| Footnote | Description | Footnote(1) | Based on the period April 14, 2025 (commencement of operations) through June 30, 2025. Expenses would have been higher if based on the full reporting period. |
|
|
| Expenses Paid, Amount |
$ 16
|
[5] |
| Expense Ratio, Percent |
0.75%
|
|
| Expenses Short Period Footnote [Text Block] |
Based on the period April 14, 2025 (commencement of operations) through June 30, 2025. Expenses would have been higher if based on the full reporting period.
|
|
| Factors Affecting Performance [Text Block] |
Management's Discussion of Fund PerformanceFor the period April 14, 2025 to June 30, 2025, XV returned 7.99% vs. its referenced benchmark, S&P 500 Index, return of 15.11%, underperforming by 7.12%. XV’s strong absolute returns were supported by robust equity market performance and a decline in overall market volatility. XV’s income generation is derived from a combination of interest income strategy and income generating option spread strategy. The interest income is from investments in the US Government securities and the option income is from selling barrier put options, essentially an option spread writing strategy by accepting the risk of a potential loss defined by the barrier levels in exchange for option premium/income. On a relative basis, XV's performance has been consistent with expectations, reflecting its income-oriented strategy. Looking ahead, we believe XV is well-positioned to appeal to investors seeking high monthly income potential through barrier option structures, while also offering operational efficiencies typically lacking in traditional structured note investments. |
|
| Performance Past Does Not Indicate Future [Text] |
The Fund's past performance is not a good predictor of future performance.
|
|
| Line Graph [Table Text Block] |
| Simplify Target 15 Distribution ETF- NAV | S&P 500 TR Index |
|---|
4/14/25 | $10,000 | $10,000 |
|---|
6/30/25 | $10,799 | $11,511 |
|---|
|
|
| Average Annual Return [Table Text Block] |
AVERAGE ANNUAL TOTAL RETURN
Fund/Index | Since Inception
4/14/2025 |
|---|
Simplify Target 15 Distribution ETF - NAV | 7.99% |
|---|
S&P 500 TR Index | 15.11% |
|---|
|
|
| Performance Inception Date |
Apr. 14, 2025
|
|
| No Deduction of Taxes [Text Block] |
The graph and table do not reflect deduction of taxes that a shareholder would pay on Fund distributions or redemption of Fund shares.
|
|
| AssetsNet |
$ 47,402,442
|
|
| Holdings Count | Holding |
3
|
|
| Advisory Fees Paid, Amount |
$ 57,579
|
|
| InvestmentCompanyPortfolioTurnover |
0.00%
|
|
| Additional Fund Statistics [Text Block] |
The following table outlines key fund statistics that you should pay attention to. Fund net assets | $47,402,442 |
|---|
Total number of portfolio holdings | 3 |
|---|
Total advisory fee paid | $57,579 |
|---|
Portfolio turnover rate | 0% |
|---|
|
|
| Holdings [Text Block] |
Investment Categories | % of Net Assets |
|---|
U.S. Treasury Bills | 101.2% |
|---|
Liabilities in Excess of Other Assets | (1.2)% |
|---|
Total | 100.0% |
|---|
|
|
| Material Fund Change [Text Block] |
|
|
| C000238457 |
|
|
| Shareholder Report [Line Items] |
|
|
| Fund Name |
Simplify Treasury Option Income ETF
|
|
| Class Name |
Simplify Treasury Option Income ETF
|
|
| No Trading Symbol [Flag] |
true
|
|
| Security Exchange Name |
NYSEArca
|
|
| Annual or Semi-Annual Statement [Text Block] |
This annual shareholder report contains important information about Simplify Treasury Option Income ETF (formerly, Simplify Stable Income ETF) (the "Fund") for the period of July 1, 2024 to June 30, 2025.
|
|
| Shareholder Report Annual or Semi-Annual |
annual shareholder report
|
|
| Additional Information [Text Block] |
You can find additional information about the Fund at www.simplify.us/resources. You can also request this information by contacting us at (855) 772-8488.
|
|
| Material Fund Change Notice [Text Block] |
This report describes changes to the Fund that occurred during the reporting period.
|
|
| Additional Information Phone Number |
(855) 772-8488
|
|
| Additional Information Website |
www.simplify.us/resources
|
|
| Expenses [Text Block] |
What were the Fund’s costs for the last year? (based on a hypothetical $10,000 investment) Fund | Costs of a $10,000 investment | Costs paid as a
percentage of a $10,000 investment |
|---|
Simplify Treasury Option Income ETF | $36 | 0.35% |
|---|
|
|
| Expenses Paid, Amount |
$ 36
|
|
| Expense Ratio, Percent |
0.35%
|
|
| Factors Affecting Performance [Text Block] |
Management's Discussion of Fund PerformanceFor the year ended June 30, 2025, BUCK returned 4.06% vs. the ICE BofA US 3-Month Treasury Bill Index, return of 4.68% for the same period, underperforming the benchmark by 0.62%. It has been a challenging year for option-selling strategies especially during the ''Tariff Tantrum'' in early April, as rate volatility and long-term Treasury rates spiked over just a few days. The strategy in BUCK has focused on structural volatility selling in the treasury market and even though the options are short dated, with such a sharp selloff in interest rates over a very short timeframe (largest move in over 20 years) the fund performance was adversely impacted. Looking ahead, we expect long-term treasury rates to stabilize in a higher range as uncertainties regarding fiscal outlook resolve and the increased volatility in Treasuries also results in higher yields from the increased premiums on the Fund's options positions. We believe BUCK is well-positioned to capture the higher potential returns generated in such environments. |
|
| Performance Past Does Not Indicate Future [Text] |
The Fund's past performance is not a good predictor of future performance.
|
|
| Line Graph [Table Text Block] |
| Simplify Treasury Option Income ETF- NAV | Bloomberg U.S. Aggregate Bond Index | Bloomberg 1 - 3 Month U.S. Treasury Bill Index | ICE BofA 3 Month US Treasury Bill Index |
|---|
10/27/22 | $10,000 | $10,000 | $10,000 | $10,000 |
|---|
12/31/22 | $10,077 | $10,253 | $10,070 | $10,070 |
|---|
3/31/23 | $10,188 | $10,557 | $10,180 | $10,178 |
|---|
6/30/23 | $10,327 | $10,468 | $10,304 | $10,297 |
|---|
9/30/23 | $10,466 | $10,130 | $10,443 | $10,432 |
|---|
12/31/23 | $10,533 | $10,820 | $10,587 | $10,575 |
|---|
3/31/24 | $10,882 | $10,736 | $10,727 | $10,712 |
|---|
6/30/24 | $10,884 | $10,743 | $10,871 | $10,853 |
|---|
9/30/24 | $11,150 | $11,302 | $11,019 | $11,002 |
|---|
12/31/24 | $11,293 | $10,956 | $11,150 | $11,130 |
|---|
3/31/25 | $11,570 | $11,260 | $11,267 | $11,244 |
|---|
6/30/25 | $11,326 | $11,396 | $11,387 | $11,361 |
|---|
|
|
| Average Annual Return [Table Text Block] |
AVERAGE ANNUAL TOTAL RETURN
Fund/Index | 1 Year | Since Inception
10/27/2022 |
|---|
Simplify Treasury Option Income ETF - NAV | 4.06% | 4.77% |
|---|
Bloomberg U.S. Aggregate Bond Index | 6.08% | 5.01% |
|---|
Bloomberg 1 - 3 Month U.S. Treasury Bill Index | 4.75% | 4.98% |
|---|
ICE BofA 3 Month US Treasury Bill Index | 4.68% | 4.89% |
|---|
|
|
| Performance Inception Date |
Oct. 27, 2022
|
|
| No Deduction of Taxes [Text Block] |
The graph and table do not reflect deduction of taxes that a shareholder would pay on Fund distributions or redemption of Fund shares.
|
|
| AssetsNet |
$ 343,277,369
|
|
| Holdings Count | Holding |
5
|
|
| Advisory Fees Paid, Amount |
$ 889,296
|
|
| InvestmentCompanyPortfolioTurnover |
0.00%
|
|
| Additional Fund Statistics [Text Block] |
The following table outlines key fund statistics that you should pay attention to. Fund net assets | $343,277,369 |
|---|
Total number of portfolio holdings | 5 |
|---|
Total advisory fee paid | $889,296 |
|---|
Portfolio turnover rate | 0% |
|---|
|
|
| Holdings [Text Block] |
Investment Categories | % of Net Assets |
|---|
U.S. Treasury Bills | 100.1% |
|---|
Liabilities in Excess of Other Assets | (0.1)% |
|---|
Total | 100.0% |
|---|
|
|
| Material Fund Change [Text Block] |
This is a summary of certain changes to the Fund since July 1, 2024. For more complete information, you may review the Fund’s prospectus dated November 1, 2024, which is available at www.simplify.us/resources or upon request at 1 (855) 772-8488. (1) The Fund was renamed from the Simplify Stable Income ETF to the Simplify Treasury Option Income ETF. (2) The Fund revised its investment strategy to include direct investments in U.S. Treasury securities, in addition to gaining exposure to such securities through investments in ETFs. This included the addition of: 1) a non-fundamental policy to invest at least 80% of the Fund's assets in U.S. Treasuries and ETFs 2) the addition of U.S. Treasury Inflation-Protected Securities (TIPS) as potential investments 3) new or enhanced risk disclosures relating to these investments 4) clarification around the types of assets on which the Fund may write options when implementing its option strategy. |
|
| C000227543 |
|
|
| Shareholder Report [Line Items] |
|
|
| Fund Name |
Simplify US Equity PLUS Bitcoin Strategy ETF
|
|
| Class Name |
Simplify US Equity PLUS Bitcoin Strategy ETF
|
|
| No Trading Symbol [Flag] |
true
|
|
| Security Exchange Name |
NASDAQ
|
|
| Annual or Semi-Annual Statement [Text Block] |
This annual shareholder report contains important information about Simplify US Equity PLUS Bitcoin Strategy ETF (formerly, Simplify US Equity PLUS GBTC ETF) (the "Fund") for the period of July 1, 2024 to June 30, 2025.
|
|
| Shareholder Report Annual or Semi-Annual |
annual shareholder report
|
|
| Additional Information [Text Block] |
You can find additional information about the Fund at www.simplify.us/resources. You can also request this information by contacting us at (855) 772-8488.
|
|
| Material Fund Change Notice [Text Block] |
This report describes changes to the Fund that occurred during the reporting period.
|
|
| Additional Information Phone Number |
(855) 772-8488
|
|
| Additional Information Website |
www.simplify.us/resources
|
|
| Expenses [Text Block] |
What were the Fund’s costs for the last year? (based on a hypothetical $10,000 investment) Fund | Costs of a $10,000 investment | Costs paid as a
percentage of a $10,000 investment |
|---|
Simplify US Equity PLUS Bitcoin Strategy ETF | $56 | 0.51% |
|---|
|
|
| Expenses Paid, Amount |
$ 56
|
|
| Expense Ratio, Percent |
0.51%
|
|
| Factors Affecting Performance [Text Block] |
Management's Discussion of Fund PerformanceFor the year ended June 30, 2025, SPBC returned 21.35% vs its referenced benchmark, S&P 500 Index, return of 15.16%, outperforming the benchmark by 6.19%. During the reporting period SPBC targeted a 10% exposure to Grayscale Bitcoin (GBTC) and/or Vaneck Bitcoin (HODL), which returned 59.34% and 79.58% respectively over the same period, driving the outperformance of 6.19% vs. the benchmark. Periodic rebalancing to the target weight results in adding to Bitcoin ETP and/or Bitcoin ETF exposure when Bitcoin is underperforming and trimming outsized exposure when it’s outperforming, effectively capturing a rebalancing premium through disciplined, systematic allocation. Looking ahead, we believe SPBC remains uniquely positioned to provide investors with exposure to U.S. Large Cap Equity combined with Bitcoin exposure. With the advent of Bitcoin ETFs in early 2024, HODL should act as a good proxy for exposure to the price of spot Bitcoin moving forward, as the Fund seeks to achieve its stated investment objectives. |
|
| Performance Past Does Not Indicate Future [Text] |
The Fund's past performance is not a good predictor of future performance.
|
|
| Line Graph [Table Text Block] |
| Simplify US Equity PLUS Bitcoin Strategy ETF - NAV | S&P 500 TR Index |
|---|
5/24/21 | $10,000 | $10,000 |
|---|
6/30/21 | $10,146 | $10,253 |
|---|
12/31/21 | $11,444 | $11,450 |
|---|
6/30/22 | $8,355 | $9,165 |
|---|
12/31/22 | $8,247 | $9,376 |
|---|
6/30/23 | $10,668 | $10,960 |
|---|
12/31/23 | $12,260 | $11,841 |
|---|
6/30/24 | $14,860 | $13,652 |
|---|
12/31/24 | $16,804 | $14,804 |
|---|
6/30/25 | $18,032 | $15,722 |
|---|
|
|
| Average Annual Return [Table Text Block] |
AVERAGE ANNUAL TOTAL RETURN
Fund/Index | 1 Year | Since Inception
5/24/2021 |
|---|
Simplify US Equity PLUS Bitcoin Strategy ETF - NAV | 21.35% | 15.46% |
|---|
S&P 500 TR Index | 15.16% | 11.66% |
|---|
|
|
| Performance Inception Date |
May 24, 2021
|
|
| No Deduction of Taxes [Text Block] |
The graph and table do not reflect deduction of taxes that a shareholder would pay on Fund distributions or redemption of Fund shares.
|
|
| AssetsNet |
$ 75,566,342
|
|
| Holdings Count | Holding |
5
|
|
| Advisory Fees Paid, Amount |
$ 189,440
|
|
| InvestmentCompanyPortfolioTurnover |
30.00%
|
|
| Additional Fund Statistics [Text Block] |
The following table outlines key fund statistics that you should pay attention to. Fund net assets | $75,566,342 |
|---|
Total number of portfolio holdings | 5 |
|---|
Total advisory fee paid | $189,440 |
|---|
Portfolio turnover rate | 30% |
|---|
|
|
| Holdings [Text Block] |
Investment Categories | % of Net Assets |
|---|
U.S. Exchange-Traded Funds | 98.6% |
|---|
U.S. Treasury Bills | 0.8% |
|---|
Money Market Funds | 0.1% |
|---|
Other Assets in Excess of Liabilities | 0.5% |
|---|
Total | 100.0% |
|---|
|
|
| Material Fund Change [Text Block] |
This is a summary of certain changes to the Fund since July 1, 2024. For more complete information, you may review the Fund’s prospectus dated February 5, 2025, which is available at www.simplify.us/resources or upon request at 1 (855) 772-8488. (1) The Fund was renamed from the Simplify US Equity PLUS GBTC ETF to the Simplify US Equity PLUS Bitcoin Strategy ETF. (2) The Fund revised its investment strategy to expand the investable universe of Bitcoin-related investments. (3) The Fund expanded its non-fundamental 80% investment policy to invest at least 80% of its net assets (plus any borrowings for investment purposes) in equity securities of U.S. companies, exchange-traded products with direct exposure to Bitcoin (“Bitcoin ETPs), and exchange-traded funds with indirect exposure to Bitcoin primarily through Bitcoin futures, options, swaps, or other derivative instruments (“Bitcoin ETFs”). (4) Because of the strategy changes, the Fund became subject to additional Bitcoin-related risks such as Bitcoin ETFs Risk. |
|
| C000220986 |
|
|
| Shareholder Report [Line Items] |
|
|
| Fund Name |
Simplify US Equity PLUS Convexity ETF
|
|
| Class Name |
Simplify US Equity PLUS Convexity ETF
|
|
| No Trading Symbol [Flag] |
true
|
|
| Security Exchange Name |
NYSEArca
|
|
| Annual or Semi-Annual Statement [Text Block] |
This annual shareholder report contains important information about Simplify US Equity PLUS Convexity ETF (the "Fund") for the period of July 1, 2024 to June 30, 2025.
|
|
| Shareholder Report Annual or Semi-Annual |
annual shareholder report
|
|
| Additional Information [Text Block] |
You can find additional information about the Fund at www.simplify.us/resources. You can also request this information by contacting us at (855) 772-8488.
|
|
| Additional Information Phone Number |
(855) 772-8488
|
|
| Additional Information Website |
www.simplify.us/resources
|
|
| Expenses [Text Block] |
What were the Fund’s costs for the last year? (based on a hypothetical $10,000 investment) Fund | Costs of a $10,000 investment | Costs paid as a
percentage of a $10,000 investment |
|---|
Simplify US Equity PLUS Convexity ETF | $54 | 0.50% |
|---|
|
|
| Expenses Paid, Amount |
$ 54
|
|
| Expense Ratio, Percent |
0.50%
|
|
| Factors Affecting Performance [Text Block] |
Management's Discussion of Fund PerformanceFor the year ended June 30, 2025, SPYC returned 14.71% vs its referenced benchmark, S&P 500 Index, return of 15.16%, underperforming the benchmark by 0.45%. Over the past year, U.S. equities have demonstrated notable resilience and recovery following a turbulent early‐2025 period. The U.S. large-cap market rebounded sharply, rising approximately 25% from its spring lows, driven by easing tariff concerns, robust corporate earnings, and strong labor market data. After plunging nearly 19% in April due to the unexpected announcement of “Liberation Day” tariffs, markets quickly regained footing on the back of policy adjustments and coordinated intervention, eventually reaching record highs by late June. SPYC’s dual mandate of capturing upside & downside convexity performed in line with expectations over the past year. We will continue to monetize and exercise options, when possible, to outperform on the upside while maintaining a strong notional coverage on the downside. |
|
| Performance Past Does Not Indicate Future [Text] |
The Fund's past performance is not a good predictor of future performance.
|
|
| Line Graph [Table Text Block] |
| Simplify US Equity PLUS Convexity ETF - NAV | S&P 500 TR Index |
|---|
9/3/20 | $10,000 | $10,000 |
|---|
12/31/20 | $10,834 | $10,927 |
|---|
6/30/21 | $12,367 | $12,593 |
|---|
12/31/21 | $13,976 | $14,063 |
|---|
6/30/22 | $10,923 | $11,256 |
|---|
12/31/22 | $10,427 | $11,516 |
|---|
6/30/23 | $12,088 | $13,462 |
|---|
12/31/23 | $12,931 | $14,543 |
|---|
6/30/24 | $15,257 | $16,767 |
|---|
12/31/24 | $15,794 | $18,182 |
|---|
6/30/25 | $17,501 | $19,310 |
|---|
|
|
| Average Annual Return [Table Text Block] |
AVERAGE ANNUAL TOTAL RETURN
Fund/Index | 1 Year | Since Inception
9/3/2020 |
|---|
Simplify US Equity PLUS Convexity ETF - NAV | 14.71% | 12.31% |
|---|
S&P 500 TR Index | 15.16% | 14.62% |
|---|
|
|
| Performance Inception Date |
Sep. 03, 2020
|
|
| No Deduction of Taxes [Text Block] |
The graph and table do not reflect deduction of taxes that a shareholder would pay on Fund distributions or redemption of Fund shares.
|
|
| AssetsNet |
$ 83,345,978
|
|
| Holdings Count | Holding |
22
|
|
| Advisory Fees Paid, Amount |
$ 369,331
|
|
| InvestmentCompanyPortfolioTurnover |
8.00%
|
|
| Additional Fund Statistics [Text Block] |
The following table outlines key fund statistics that you should pay attention to. Fund net assets | $83,345,978 |
|---|
Total number of portfolio holdings | 22 |
|---|
Total advisory fee paid | $369,331 |
|---|
Portfolio turnover rate | 8% |
|---|
|
|
| Holdings [Text Block] |
Investment Categories | % of Net Assets |
|---|
U.S. Exchange-Traded Funds | 96.1% |
|---|
Purchased Options | 3.3% |
|---|
Money Market Funds | 0.4% |
|---|
Other Assets in Excess of Liabilities | 0.2% |
|---|
Total | 100.0% |
|---|
|
|
| Material Fund Change [Text Block] |
|
|
| C000220987 |
|
|
| Shareholder Report [Line Items] |
|
|
| Fund Name |
Simplify US Equity PLUS Downside Convexity ETF
|
|
| Class Name |
Simplify US Equity PLUS Downside Convexity ETF
|
|
| No Trading Symbol [Flag] |
true
|
|
| Security Exchange Name |
NYSEArca
|
|
| Annual or Semi-Annual Statement [Text Block] |
This annual shareholder report contains important information about Simplify US Equity PLUS Downside Convexity ETF (the "Fund") for the period of July 1, 2024 to June 30, 2025.
|
|
| Shareholder Report Annual or Semi-Annual |
annual shareholder report
|
|
| Additional Information [Text Block] |
You can find additional information about the Fund at www.simplify.us/resources. You can also request this information by contacting us at (855) 772-8488.
|
|
| Additional Information Phone Number |
(855) 772-8488
|
|
| Additional Information Website |
www.simplify.us/resources
|
|
| Expenses [Text Block] |
What were the Fund’s costs for the last year? (based on a hypothetical $10,000 investment) Fund | Costs of a $10,000 investment | Costs paid as a
percentage of a $10,000 investment |
|---|
Simplify US Equity PLUS Downside Convexity ETF | $55 | 0.50% |
|---|
|
|
| Expenses Paid, Amount |
$ 55
|
|
| Expense Ratio, Percent |
0.50%
|
|
| Factors Affecting Performance [Text Block] |
Management's Discussion of Fund PerformanceFor the year ended June 30, 2025, SPD returned 18.38% vs its referenced benchmark, S&P 500 Index, return of 15.16%, outperforming the benchmark by 3.22%. Over the past year, U.S. equities have demonstrated notable resilience and recovery following a turbulent early‐2025 period. The U.S. large-cap market rebounded sharply, rising approximately 25% from its spring lows, driven by easing tariff concerns, robust corporate earnings, and strong labor market data. After plunging nearly 19% in April due to the unexpected announcement of “Liberation Day” tariffs, markets quickly regained footing on the back of policy adjustments and coordinated intervention, eventually reaching record highs by late June. SPD performed well against the deep drawdown in early April and delivered strong outperformance during the subsequent rebound, supported by its income overlay strategy and downside convexity exposure. In the next 12 months, we will continue to actively manage the downside convexity profile while aiming to offset the cost with the Fund’s income overlay approach. |
|
| Performance Past Does Not Indicate Future [Text] |
The Fund's past performance is not a good predictor of future performance.
|
|
| Line Graph [Table Text Block] |
| Simplify US Equity PLUS Downside Convexity ETF - NAV | S&P 500 TR Index |
|---|
9/3/20 | $10,000 | $10,000 |
|---|
12/31/20 | $10,798 | $10,927 |
|---|
6/30/21 | $12,207 | $12,593 |
|---|
12/31/21 | $13,429 | $14,063 |
|---|
6/30/22 | $10,818 | $11,256 |
|---|
12/31/22 | $9,986 | $11,516 |
|---|
6/30/23 | $11,393 | $13,462 |
|---|
12/31/23 | $12,088 | $14,543 |
|---|
6/30/24 | $13,698 | $16,767 |
|---|
12/31/24 | $14,212 | $18,182 |
|---|
6/30/25 | $16,216 | $19,310 |
|---|
|
|
| Average Annual Return [Table Text Block] |
AVERAGE ANNUAL TOTAL RETURN
Fund/Index | 1 Year | Since Inception
9/3/2020 |
|---|
Simplify US Equity PLUS Downside Convexity ETF - NAV | 18.38% | 10.54% |
|---|
S&P 500 TR Index | 15.16% | 14.62% |
|---|
|
|
| Performance Inception Date |
Sep. 03, 2020
|
|
| No Deduction of Taxes [Text Block] |
The graph and table do not reflect deduction of taxes that a shareholder would pay on Fund distributions or redemption of Fund shares.
|
|
| AssetsNet |
$ 88,213,096
|
|
| Holdings Count | Holding |
21
|
|
| Advisory Fees Paid, Amount |
$ 531,814
|
|
| InvestmentCompanyPortfolioTurnover |
13.00%
|
|
| Additional Fund Statistics [Text Block] |
The following table outlines key fund statistics that you should pay attention to. Fund net assets | $88,213,096 |
|---|
Total number of portfolio holdings | 21 |
|---|
Total advisory fee paid | $531,814 |
|---|
Portfolio turnover rate | 13% |
|---|
|
|
| Holdings [Text Block] |
Investment Categories | % of Net Assets |
|---|
U.S. Exchange-Traded Funds | 97.3% |
|---|
Purchased Options | 2.8% |
|---|
Liabilities in Excess of Other Assets | (0.1)% |
|---|
Total | 100.0% |
|---|
|
|
| Material Fund Change [Text Block] |
|
|
| C000220988 |
|
|
| Shareholder Report [Line Items] |
|
|
| Fund Name |
Simplify US Equity PLUS Upside Convexity ETF
|
|
| Class Name |
Simplify US Equity PLUS Upside Convexity ETF
|
|
| No Trading Symbol [Flag] |
true
|
|
| Security Exchange Name |
NYSEArca
|
|
| Annual or Semi-Annual Statement [Text Block] |
This annual shareholder report contains important information about Simplify US Equity PLUS Upside Convexity ETF (the "Fund") for the period of July 1, 2024 to June 30, 2025.
|
|
| Shareholder Report Annual or Semi-Annual |
annual shareholder report
|
|
| Additional Information [Text Block] |
You can find additional information about the Fund at www.simplify.us/resources. You can also request this information by contacting us at (855) 772-8488.
|
|
| Additional Information Phone Number |
(855) 772-8488
|
|
| Additional Information Website |
www.simplify.us/resources
|
|
| Expenses [Text Block] |
What were the Fund’s costs for the last year? (based on a hypothetical $10,000 investment) Fund | Costs of a $10,000 investment | Costs paid as a
percentage of a $10,000 investment |
|---|
Simplify US Equity PLUS Upside Convexity ETF | $53 | 0.50% |
|---|
|
|
| Expenses Paid, Amount |
$ 53
|
|
| Expense Ratio, Percent |
0.50%
|
|
| Factors Affecting Performance [Text Block] |
Management's Discussion of Fund PerformanceFor the year ended June 30, 2025, SPUC returned 11.20% vs its referenced benchmark, S&P 500 Index, return of 15.16%, under-performing the benchmark by 3.96%. Over the past year, U.S. equities have demonstrated notable resilience and recovery following a turbulent early‐2025 period. The U.S. large-cap market rebounded sharply, rising approximately 25% from its spring lows, driven by easing tariff concerns, robust corporate earnings, and strong labor market data. After plunging nearly 19% in April due to the unexpected announcement of “Liberation Day” tariffs, markets quickly regained footing on the back of policy adjustments and coordinated intervention, eventually reaching record highs by late June. As anticipated, SPUC underperformed the S&P 500 during the initial drawdown in early 2025, reflecting its design as an upside convexity strategy rather than a defensive vehicle. While SPUC recovered much of its relative underperformance during the ensuing market rally, it ultimately trailed the index for the full year. Looking ahead,we believe SPUC is positioned to capture U.S. equities market strength via its investment in call options. This approach offers investors an upside convexity solution that transforms a persistent market inefficiency into a source of enhanced return potential. |
|
| Performance Past Does Not Indicate Future [Text] |
The Fund's past performance is not a good predictor of future performance.
|
|
| Line Graph [Table Text Block] |
| Simplify US Equity PLUS Upside Convexity ETF - NAV | S&P 500 TR Index |
|---|
9/3/20 | $10,000 | $10,000 |
|---|
12/31/20 | $10,877 | $10,927 |
|---|
6/30/21 | $12,552 | $12,593 |
|---|
12/31/21 | $14,561 | $14,063 |
|---|
6/30/22 | $11,047 | $11,256 |
|---|
12/31/22 | $10,973 | $11,516 |
|---|
6/30/23 | $12,886 | $13,462 |
|---|
12/31/23 | $13,986 | $14,543 |
|---|
6/30/24 | $17,174 | $16,767 |
|---|
12/31/24 | $17,529 | $18,182 |
|---|
6/30/25 | $19,097 | $19,310 |
|---|
|
|
| Average Annual Return [Table Text Block] |
AVERAGE ANNUAL TOTAL RETURN
Fund/Index | 1 Year | Since Inception
9/3/2020 |
|---|
Simplify US Equity PLUS Upside Convexity ETF - NAV | 11.20% | 14.36% |
|---|
S&P 500 TR Index | 15.16% | 14.62% |
|---|
|
|
| Performance Inception Date |
Sep. 03, 2020
|
|
| No Deduction of Taxes [Text Block] |
The graph and table do not reflect deduction of taxes that a shareholder would pay on Fund distributions or redemption of Fund shares.
|
|
| AssetsNet |
$ 116,667,833
|
|
| Holdings Count | Holding |
3
|
|
| Advisory Fees Paid, Amount |
$ 251,486
|
|
| InvestmentCompanyPortfolioTurnover |
94.00%
|
|
| Additional Fund Statistics [Text Block] |
The following table outlines key fund statistics that you should pay attention to. Fund net assets | $116,667,833 |
|---|
Total number of portfolio holdings | 3 |
|---|
Total advisory fee paid | $251,486 |
|---|
Portfolio turnover rate | 94% |
|---|
|
|
| Holdings [Text Block] |
Investment Categories | % of Net Assets |
|---|
U.S. Exchange-Traded Funds | 95.1% |
|---|
Purchased Options | 4.2% |
|---|
Money Market Funds | 1.0% |
|---|
Liabilities in Excess of Other Assets | (0.3)% |
|---|
Total | 100.0% |
|---|
|
|
| Material Fund Change [Text Block] |
|
|
| C000236819 |
|
|
| Shareholder Report [Line Items] |
|
|
| Fund Name |
Simplify Bitcoin Strategy PLUS Income ETF
|
|
| Class Name |
Simplify Bitcoin Strategy PLUS Income ETF
|
|
| No Trading Symbol [Flag] |
true
|
|
| Security Exchange Name |
NASDAQ
|
|
| Annual or Semi-Annual Statement [Text Block] |
This annual shareholder report contains important information about Simplify Bitcoin Strategy PLUS Income ETF (the "Fund") for the period of July 1, 2024 to June 30, 2025.
|
|
| Shareholder Report Annual or Semi-Annual |
annual shareholder report
|
|
| Additional Information [Text Block] |
You can find additional information about the Fund at www.simplify.us/resources. You can also request this information by contacting us at (855) 772-8488.
|
|
| Material Fund Change Notice [Text Block] |
This report describes changes to the Fund that occurred during the reporting period.
|
|
| Additional Information Phone Number |
(855) 772-8488
|
|
| Additional Information Website |
www.simplify.us/resources
|
|
| Expenses [Text Block] |
What were the Fund’s costs for the last year? (based on a hypothetical $10,000 investment) Fund | Costs of a $10,000 investment | Costs paid as a
percentage of a $10,000 investment |
|---|
Simplify Bitcoin Strategy PLUS Income ETF | $180 | 1.31% |
|---|
|
|
| Expenses Paid, Amount |
$ 180
|
|
| Expense Ratio, Percent |
1.31%
|
|
| Factors Affecting Performance [Text Block] |
Management's Discussion of Fund PerformanceFor the year ended June 30, 2025, MAXI returned 74.47% vs the return of 78.20% of the Nasdaq Bitcoin Reference Price Index for the same period, underperforming the index by 3.73%. The underperformance of -3.73% is primarily attributable to the cost of obtaining exposure through futures contracts, compounded at times by the use of leverage, which amplifies both funding and roll costs. Between July 2024 and June 2025, the average annualized roll cost between BTC2 and BTC1 futures was approximately 6.8%. The remaining performance drag is likely due to the impact of the options overlay. Looking ahead, we expect MAXI to perform better if the futures roll cost, as well as implied volatility and the equity market trends, are closer to their historical long-term average. |
|
| Performance Past Does Not Indicate Future [Text] |
The Fund's past performance is not a good predictor of future performance.
|
|
| Line Graph [Table Text Block] |
| Simplify Bitcoin Strategy PLUS Income ETF - NAV | S&P 500 TR Index | Nasdaq Bitcoin Reference Price Index (USD) 09-29-22 |
|---|
9/29/22 | $10,000 | $10,000 | $10,000 |
|---|
9/30/22 | $10,000 | $9,850 | $9,925 |
|---|
12/31/22 | $8,693 | $10,595 | $8,511 |
|---|
3/31/23 | $14,761 | $11,389 | $14,423 |
|---|
6/30/23 | $15,816 | $12,384 | $15,648 |
|---|
9/30/23 | $13,805 | $11,979 | $13,791 |
|---|
12/31/23 | $21,172 | $13,380 | $21,544 |
|---|
3/31/24 | $34,930 | $14,792 | $35,790 |
|---|
6/30/24 | $29,106 | $15,426 | $30,899 |
|---|
9/30/24 | $28,815 | $16,334 | $32,658 |
|---|
12/31/24 | $40,339 | $16,727 | $47,964 |
|---|
3/31/25 | $31,346 | $16,013 | $42,229 |
|---|
6/30/25 | $50,781 | $17,765 | $55,063 |
|---|
|
|
| Average Annual Return [Table Text Block] |
AVERAGE ANNUAL TOTAL RETURN
Fund/Index | 1 Year | Since Inception
9/29/2022 |
|---|
Simplify Bitcoin Strategy PLUS Income ETF - NAV | 74.47% | 80.53% |
|---|
S&P 500 TR Index | 15.16% | 23.23% |
|---|
Nasdaq Bitcoin Reference Price Index (USD) 09-29-22 | 78.20% | 85.92% |
|---|
|
|
| Performance Inception Date |
Sep. 29, 2022
|
|
| No Deduction of Taxes [Text Block] |
The graph and table do not reflect deduction of taxes that a shareholder would pay on Fund distributions or redemption of Fund shares.
|
|
| AssetsNet |
$ 52,290,824
|
|
| Holdings Count | Holding |
24
|
|
| Advisory Fees Paid, Amount |
$ 347,717
|
|
| InvestmentCompanyPortfolioTurnover |
0.00%
|
|
| Additional Fund Statistics [Text Block] |
The following table outlines key fund statistics that you should pay attention to. Fund net assets | $52,290,824 |
|---|
Total number of portfolio holdings | 24 |
|---|
Total advisory fee paid | $347,717 |
|---|
Portfolio turnover rate | 0% |
|---|
|
|
| Holdings [Text Block] |
Investment Categories | % of Net Assets |
|---|
U.S. Treasury Bills | 194.9% |
|---|
Purchased Options | 15.8% |
|---|
Liabilities in Excess of Other Assets | (110.7)% |
|---|
Total | 100.0% |
|---|
|
|
| Material Fund Change [Text Block] |
This summary of certain changes to the Fund since July 1, 2024. For more complete information, you may review the Fund's prospectus dated February 5, 2025, which is available at www.simplify.us/resources or upon request at 1 (855) 772-8488. (1) The Fund revised its investment strategy to expand the investable universe of Bitcoin-related investments. (2) The Fund changed its targeted Bitcoin exposure from 100% to a range of 50-200%. (3) Because of the strategy changes, the Fund became subject to additional Bitcoin-related risks such as Bitcoin ETFs Risk, Exchange Traded Product Risk, and Valuation Risk. |
|
| C000254611 |
|
|
| Shareholder Report [Line Items] |
|
|
| Fund Name |
Simplify Gold Strategy PLUS Income ETF
|
|
| Class Name |
Simplify Gold Strategy PLUS Income ETF
|
|
| No Trading Symbol [Flag] |
true
|
|
| Security Exchange Name |
NYSEArca
|
|
| Annual or Semi-Annual Statement [Text Block] |
This annual shareholder report contains important information about Simplify Gold Strategy PLUS Income ETF (the "Fund") for the period of December 2, 2024 to June 30, 2025.
|
|
| Shareholder Report Annual or Semi-Annual |
annual shareholder report
|
|
| Additional Information [Text Block] |
You can find additional information about the Fund at www.simplify.us/resources. You can also request this information by contacting us at (855) 772-8488.
|
|
| Additional Information Phone Number |
(855) 772-8488
|
|
| Additional Information Website |
www.simplify.us/resources
|
|
| Expenses [Text Block] |
What were the Fund’s costs for the period? (based on a hypothetical $10,000 investment) Fund | Costs of a $10,000 investment | Costs paid as a
percentage of a $10,000 investment |
|---|
Simplify Gold Strategy PLUS Income ETF | $37Footnote Reference(1) | 0.53% |
|---|
| Footnote | Description | Footnote(1) | Based on the period December 2, 2024 (commencement of operations) through June 30, 2025. Expenses would have been higher if based on the full reporting period. |
|
|
| Expenses Paid, Amount |
$ 37
|
[6] |
| Expense Ratio, Percent |
0.53%
|
|
| Expenses Short Period Footnote [Text Block] |
Based on the period December 2, 2024 (commencement of operations) through June 30, 2025. Expenses would have been higher if based on the full reporting period.
|
|
| Factors Affecting Performance [Text Block] |
Management's Discussion of Fund PerformanceSince its inception on December 2nd, 2024, YGLD returned 39.74% vs. the Solactive Gold Spot Index's return of 25.44% for the same period, outperforming the index by +14.29%. Much of the outperformance occurred in the period from 4/7/25-5/19/25 as gold prices rallied post the tariff-pause announcement and the option overlay was additive given the positive convexity. Gold prices have seen continued support from economic uncertainty, geopolitical risk and continued investment from foreign central banks. Looking forward, we believe gold will remain well bid given continued market uncertainty and flows from overseas, while the income overlay can continue to add value in a risk-on market. |
|
| Performance Past Does Not Indicate Future [Text] |
The Fund's past performance is not a good predictor of future performance.
|
|
| Line Graph [Table Text Block] |
| Simplify Gold Strategy PLUS Income ETF - NAV | Bloomberg U.S. Aggregate Bond Index | Solactive Gold Spot Index ER USD Index |
|---|
12/2/24 | $10,000 | $10,000 | $10,000 |
|---|
12/31/24 | $9,585 | $9,830 | $9,946 |
|---|
3/31/25 | $11,640 | $10,103 | $11,844 |
|---|
6/30/25 | $13,974 | $10,225 | $12,544 |
|---|
|
|
| Average Annual Return [Table Text Block] |
AVERAGE ANNUAL TOTAL RETURN
Fund/Index | Since Inception
12/2/2024 |
|---|
Simplify Gold Strategy PLUS Income ETF - NAV | 39.74% |
|---|
Bloomberg U.S. Aggregate Bond Index | 2.25% |
|---|
Solactive Gold Spot Index ER USD Index | 25.44% |
|---|
|
|
| Performance Inception Date |
Dec. 02, 2024
|
|
| No Deduction of Taxes [Text Block] |
The graph and table do not reflect deduction of taxes that a shareholder would pay on Fund distributions or redemption of Fund shares.
|
|
| AssetsNet |
$ 28,249,612
|
|
| Holdings Count | Holding |
22
|
|
| Advisory Fees Paid, Amount |
$ 54,284
|
|
| InvestmentCompanyPortfolioTurnover |
0.00%
|
|
| Additional Fund Statistics [Text Block] |
The following table outlines key fund statistics that you should pay attention to. Fund net assets | $28,249,612 |
|---|
Total number of portfolio holdings | 22 |
|---|
Total advisory fee paid | $54,284 |
|---|
Portfolio turnover rate | 0% |
|---|
|
|
| Holdings [Text Block] |
Investment Categories | % of Net Assets |
|---|
U.S. Treasury Bills | 92.9% |
|---|
Purchased Options | 3.0% |
|---|
Other Assets in Excess of Liabilities | 4.1% |
|---|
Total | 100.0% |
|---|
|
|
| Material Fund Change [Text Block] |
|
|
| C000243093 |
|
|
| Shareholder Report [Line Items] |
|
|
| Fund Name |
Simplify Multi-QIS Alternative ETF
|
|
| Class Name |
Simplify Multi-QIS Alternative ETF
|
|
| No Trading Symbol [Flag] |
true
|
|
| Security Exchange Name |
NYSEArca
|
|
| Annual or Semi-Annual Statement [Text Block] |
This annual shareholder report contains important information about Simplify Multi-QIS Alternative ETF (the "Fund") for the period of July 1, 2024 to June 30, 2025.
|
|
| Shareholder Report Annual or Semi-Annual |
annual shareholder report
|
|
| Additional Information [Text Block] |
You can find additional information about the Fund at www.simplify.us/resources. You can also request this information by contacting us at (855) 772-8488.
|
|
| Additional Information Phone Number |
(855) 772-8488
|
|
| Additional Information Website |
www.simplify.us/resources
|
|
| Expenses [Text Block] |
What were the Fund’s costs for the last year? (based on a hypothetical $10,000 investment) Fund | Costs of a $10,000 investment | Costs paid as a
percentage of a $10,000 investment |
|---|
Simplify Multi-QIS Alternative ETF | $95.2 | 1.00% |
|---|
|
|
| Expenses Paid, Amount |
$ 95.2
|
|
| Expense Ratio, Percent |
1.00%
|
|
| Factors Affecting Performance [Text Block] |
Management's Discussion of Fund PerformanceFor the year ended June 30, 2025, QIS returned -9.89% vs the 4.68%, return of the ICE BofA US 3-Months Treasury Bill Index for the same period, underperforming the index by -14.57%. Much of the underperformance occurred from March 2025 until June 2025, as the February market sell-off and subsequent "tariff tantrum" were headwinds for QIS. During the last 12 months, the strategy was streamlined to increase resiliency in stressed markets. The new approach aims to improve performance and diversify exposures in various market conditions. Quantitative strategies across the board have had one of their most challenging periods in the last decade, and we have seen above average correlations between strategies further reduce normal diversification benefits. Equity volatility strategies have also been a headwind, as implied volatilities have been low and realized volatilities have been high. We did also see some more idiosyncratic headwinds out of the commodity complex. Looking forward, we anticipate normalization of these aforementioned headwinds, which we believe could become tailwinds and improve performance. |
|
| Performance Past Does Not Indicate Future [Text] |
The Fund's past performance is not a good predictor of future performance.
|
|
| Line Graph [Table Text Block] |
| Simplify Multi-QIS Alternative ETF - NAV | Bloomberg U.S. Aggregate Bond Index | ICE BofA 3 Month US Treasury Bill Index |
|---|
7/10/23 | $10,000 | $10,000 | $10,000 |
|---|
12/31/23 | $10,237 | $10,437 | $10,259 |
|---|
6/30/24 | $10,478 | $10,362 | $10,529 |
|---|
12/31/24 | $10,218 | $10,567 | $10,797 |
|---|
6/30/25 | $9,441 | $10,992 | $11,021 |
|---|
|
|
| Average Annual Return [Table Text Block] |
AVERAGE ANNUAL TOTAL RETURN
Fund/Index | 1 Year | Since Inception
7/10/2023 |
|---|
Simplify Multi-QIS Alternative ETF - NAV | -9.89% | -2.87% |
|---|
Bloomberg U.S. Aggregate Bond Index | 6.08% | 4.90% |
|---|
ICE BofA 3 Month US Treasury Bill Index | 4.68% | 5.05% |
|---|
|
|
| Performance Inception Date |
Jul. 10, 2023
|
|
| No Deduction of Taxes [Text Block] |
The graph and table do not reflect deduction of taxes that a shareholder would pay on Fund distributions or redemption of Fund shares.
|
|
| AssetsNet |
$ 96,118,608
|
|
| Holdings Count | Holding |
21
|
|
| Advisory Fees Paid, Amount |
$ 1,084,120
|
|
| InvestmentCompanyPortfolioTurnover |
29.00%
|
|
| Additional Fund Statistics [Text Block] |
The following table outlines key fund statistics that you should pay attention to. Fund net assets | $96,118,608 |
|---|
Total number of portfolio holdings | 21 |
|---|
Total advisory fee paid | $1,084,120 |
|---|
Portfolio turnover rate | 29% |
|---|
|
|
| Holdings [Text Block] |
Investment Categories | % of Net Assets |
|---|
U.S. Treasury Bills | 85.5% |
|---|
U.S. Exchange-Traded Funds | 7.9% |
|---|
Purchased Options | 8.0% |
|---|
Liabilities in Excess of Other Assets | (1.4)% |
|---|
Total | 100.0% |
|---|
|
|
| Material Fund Change [Text Block] |
|
|
| C000227300 |
|
|
| Shareholder Report [Line Items] |
|
|
| Fund Name |
Simplify Volatility Premium ETF
|
|
| Class Name |
Simplify Volatility Premium ETF
|
|
| No Trading Symbol [Flag] |
true
|
|
| Security Exchange Name |
NYSEArca
|
|
| Annual or Semi-Annual Statement [Text Block] |
This annual shareholder report contains important information about Simplify Volatility Premium ETF (the "Fund") for the period of July 1, 2024 to June 30, 2025.
|
|
| Shareholder Report Annual or Semi-Annual |
annual shareholder report
|
|
| Additional Information [Text Block] |
You can find additional information about the Fund at www.simplify.us/resources. You can also request this information by contacting us at (855) 772-8488.
|
|
| Additional Information Phone Number |
(855) 772-8488
|
|
| Additional Information Website |
www.simplify.us/resources
|
|
| Expenses [Text Block] |
What were the Fund’s costs for the last year? (based on a hypothetical $10,000 investment) Fund | Costs of a $10,000 investment | Costs paid as a
percentage of a $10,000 investment |
|---|
Simplify Volatility Premium ETF | $62 | 0.63% |
|---|
|
|
| Expenses Paid, Amount |
$ 62
|
|
| Expense Ratio, Percent |
0.63%
|
|
| Factors Affecting Performance [Text Block] |
Management's Discussion of Fund PerformanceFor the year ended June 30, 2025, SVOL returned -3.00% vs its referenced benchmark, S&P 500 Index, return of 15.16%, underperforming the benchmark by 18.16%. The past year presented challenges for SVOL’s volatility premium harvesting strategy, marked by episodes of elevated market volatility in August 2024, December 2024, and throughout the first half of 2025. To navigate abrupt shifts in volatility regimes, the portfolio management team focused on NAV stability when confronted with abrupt shifts in volatility regimes. The timely response positioned SVOL well to recover from the market bottom on April 9, 2025. In the next 12 months, we believe SVOL is strategically positioned to capitalize on structural inefficiencies in volatility markets by selling options where implied volatility is elevated and buying where it's undervalued. We believe SVOL remains well-placed to extract risk premia in a risk-managed framework, reinforcing its role as a structural volatility strategy. |
|
| Performance Past Does Not Indicate Future [Text] |
The Fund's past performance is not a good predictor of future performance.
|
|
| Line Graph [Table Text Block] |
| Simplify Volatility Premium ETF - NAV | S&P 500 TR Index |
|---|
5/12/21 | $10,000 | $10,000 |
|---|
6/30/21 | $10,805 | $10,599 |
|---|
12/31/21 | $11,436 | $11,836 |
|---|
6/30/22 | $10,132 | $9,474 |
|---|
12/31/22 | $10,914 | $9,693 |
|---|
6/30/23 | $12,476 | $11,330 |
|---|
12/31/23 | $13,429 | $12,241 |
|---|
6/30/24 | $14,353 | $14,113 |
|---|
12/31/24 | $14,392 | $15,303 |
|---|
6/30/25 | $13,923 | $16,253 |
|---|
|
|
| Average Annual Return [Table Text Block] |
AVERAGE ANNUAL TOTAL RETURN
Fund/Index | 1 Year | Since Inception
5/12/2021 |
|---|
Simplify Volatility Premium ETF - NAV | -3.00% | 8.33% |
|---|
S&P 500 TR Index | 15.16% | 12.47% |
|---|
|
|
| Performance Inception Date |
May 12, 2021
|
|
| No Deduction of Taxes [Text Block] |
The graph and table do not reflect deduction of taxes that a shareholder would pay on Fund distributions or redemption of Fund shares.
|
|
| AssetsNet |
$ 916,740,325
|
|
| Holdings Count | Holding |
27
|
|
| Advisory Fees Paid, Amount |
$ 5,469,662
|
|
| InvestmentCompanyPortfolioTurnover |
298.00%
|
|
| Additional Fund Statistics [Text Block] |
The following table outlines key fund statistics that you should pay attention to. Fund net assets | $916,740,325 |
|---|
Total number of portfolio holdings | 27 |
|---|
Total advisory fee paid | $5,469,662 |
|---|
Portfolio turnover rate | 298% |
|---|
|
|
| Holdings [Text Block] |
Investment Categories | % of Net Assets |
|---|
U.S. Treasury Bills | 110.7% |
|---|
U.S. Exchange-Traded Funds | 48.6% |
|---|
Purchased Options | 7.5% |
|---|
Liabilities in Excess of Other Assets | (66.8)% |
|---|
Total | 100.0% |
|---|
|
|
| Material Fund Change [Text Block] |
|
|
| C000243094 |
|
|
| Shareholder Report [Line Items] |
|
|
| Fund Name |
Simplify Opportunistic Income ETF
|
|
| Class Name |
Simplify Opportunistic Income ETF
|
|
| No Trading Symbol [Flag] |
true
|
|
| Security Exchange Name |
NYSEArca
|
|
| Annual or Semi-Annual Statement [Text Block] |
This annual shareholder report contains important information about Simplify Opportunistic Income ETF (the "Fund") for the period of July 1, 2024 to June 30, 2025.
|
|
| Shareholder Report Annual or Semi-Annual |
annual shareholder report
|
|
| Additional Information [Text Block] |
You can find additional information about the Fund at www.simplify.us/resources. You can also request this information by contacting us at (855) 772-8488.
|
|
| Material Fund Change Notice [Text Block] |
This report describes changes to the Fund that occurred during the reporting period.
|
|
| Additional Information Phone Number |
(855) 772-8488
|
|
| Additional Information Website |
www.simplify.us/resources
|
|
| Expenses [Text Block] |
What were the Fund’s costs for the last year? (based on a hypothetical $10,000 investment) Fund | Costs of a $10,000 investment | Costs paid as a
percentage of a $10,000 investment |
|---|
Simplify Opportunistic Income ETF | $86 | 0.84% |
|---|
|
|
| Expenses Paid, Amount |
$ 86
|
|
| Expense Ratio, Percent |
0.84%
|
|
| Factors Affecting Performance [Text Block] |
Management's Discussion of Fund PerformanceFor the year ended June 30, 2025, CRDT returned 3.54% vs. the Bloomberg U.S. Universal Total Return Index return of 6.49% for the same period. CRDT's underweight duration positioning detracted modestly from performance over the period as yields on short and intermediate maturity US Treasuries moved lower. However, the primary detraction came from one of the positions in the distressed portion of the portfolio. Just prior to the close of the period, the position was marked down substantially despite the lack of any meaningful news around the restructuring. Looking forward, we anticipate CRDT will continue to adjust its holdings opportunistically across the credit markets. At present, CRDT remains relatively cautiously positioned. This includes an underweight duration positioning in response to anticipated growth in the level of government debt as well as an underweight to credit markets given seemingly stretched valuations. |
|
| Performance Past Does Not Indicate Future [Text] |
The Fund's past performance is not a good predictor of future performance.
|
|
| Line Graph [Table Text Block] |
| Simplify Opportunistic Income ETF - NAV | Bloomberg U.S. Aggregate Bond Index | ICE BofA US High Yield Index | Bloomberg U.S. Universal Total Return Index |
|---|
6/26/23 | $10,000 | $10,000 | $10,000 | $10,000 |
|---|
6/30/23 | $10,004 | $9,958 | $10,077 | $9,965 |
|---|
12/31/23 | $10,526 | $10,293 | $10,846 | $10,340 |
|---|
6/30/24 | $10,510 | $10,219 | $11,130 | $10,311 |
|---|
12/31/24 | $11,045 | $10,421 | $11,735 | $10,551 |
|---|
6/30/25 | $10,882 | $10,840 | $12,269 | $10,983 |
|---|
|
|
| Average Annual Return [Table Text Block] |
AVERAGE ANNUAL TOTAL RETURN
Fund/Index | 1 Year | Since Inception
6/26/2023 |
|---|
Simplify Opportunistic Income ETF - NAV | 3.54% | 4.29% |
|---|
Bloomberg U.S. Aggregate Bond Index | 6.08% | 4.09% |
|---|
ICE BofA US High Yield Index | 10.24% | 10.71% |
|---|
Bloomberg U.S. Universal Total Return Index | 6.49% | 4.78% |
|---|
|
|
| Performance Inception Date |
Jun. 26, 2023
|
|
| No Deduction of Taxes [Text Block] |
The graph and table do not reflect deduction of taxes that a shareholder would pay on Fund distributions or redemption of Fund shares.
|
|
| AssetsNet |
$ 78,043,591
|
|
| Holdings Count | Holding |
77
|
|
| Advisory Fees Paid, Amount |
$ 663,658
|
|
| InvestmentCompanyPortfolioTurnover |
418.00%
|
|
| Additional Fund Statistics [Text Block] |
The following table outlines key fund statistics that you should pay attention to. Fund net assets | $78,043,591 |
|---|
Total number of portfolio holdings | 77 |
|---|
Total advisory fee paid | $663,658 |
|---|
Portfolio turnover rate | 418% |
|---|
|
|
| Holdings [Text Block] |
Investment Categories | % of Net Assets |
|---|
Asset Backed Securities | 33.3% |
|---|
Corporate Bonds | 18.0% |
|---|
U.S. Treasury Bills | 14.4% |
|---|
Preferred Stocks | 13.2% |
|---|
Common Stocks | 6.5% |
|---|
Mortgage Backed Securities | 6.2% |
|---|
U.S. Government Agency Mortgage Backed Securities | 2.5% |
|---|
Foreign Bonds | 2.5% |
|---|
Purchased Options | 0.1% |
|---|
Term Loans | 0.1% |
|---|
Other Assets in Excess of Liabilities | 3.2% |
|---|
Total | 100.0% |
|---|
|
|
| Material Fund Change [Text Block] |
This is a summary of certain changes to the Fund since July 1, 2024. For more complete information, you may review the Fund's prospectus dated November 1, 2024, which is available at www.simplify.us/resources or upon request at 1 (855) 772-8488. A fee waiver agreement previously in place for the period beginning October 27, 2023 expired at the end of its term on October 31, 2024. |
|
| C000238807 |
|
|
| Shareholder Report [Line Items] |
|
|
| Fund Name |
Simplify Propel Opportunities ETF
|
|
| Class Name |
Simplify Propel Opportunities ETF
|
|
| No Trading Symbol [Flag] |
true
|
|
| Security Exchange Name |
NYSEArca
|
|
| Annual or Semi-Annual Statement [Text Block] |
This annual shareholder report contains important information about Simplify Propel Opportunities ETF (the "Fund") for the period of July 1, 2024 to June 30, 2025.
|
|
| Shareholder Report Annual or Semi-Annual |
annual shareholder report
|
|
| Additional Information [Text Block] |
You can find additional information about the Fund at www.simplify.us/resources. You can also request this information by contacting us at (855) 772-8488.
|
|
| Additional Information Phone Number |
(855) 772-8488
|
|
| Additional Information Website |
www.simplify.us/resources
|
|
| Expenses [Text Block] |
What were the Fund’s costs for the last year? (based on a hypothetical $10,000 investment) Fund | Costs of a $10,000 investment | Costs paid as a
percentage of a $10,000 investment |
|---|
Simplify Propel Opportunities ETF | $229 | 2.56% |
|---|
|
|
| Expenses Paid, Amount |
$ 229
|
|
| Expense Ratio, Percent |
2.56%
|
|
| Factors Affecting Performance [Text Block] |
Management's Discussion of Fund PerformanceFor the year ended June 30, 2025, SURI returned -20.69% vs. the MSCI USA IMI Health Care Net Total Return USD Index benchmark return of -5.66% for the same period, underperforming the index by 15.03%. SURI has a heavier weighting of early-stage and small/mid-cap (SMID) companies versus MSCI USA IMI Health Care Net Total Return USD Index. In general, SMID healthcare companies have underperformed versus large cap healthcare companies during this period. Positive contributors to SURI's performance include Akero Therapeutics, Achieve Life Science and Plan GP Holdings. Detractors from SURI's performance include Applied Therapeutics, Tscan Therapuetics and Athira Pharma. Looking ahead, while we anticipate continued volatility in SMID healthcare companies versus the overall market, we belive specific catalysts within the SURI portfolio along with increased M&A and strategic activities targeting SMID healthcare companies to potentially drive outperformance. |
|
| Performance Past Does Not Indicate Future [Text] |
The Fund's past performance is not a good predictor of future performance.
|
|
| Line Graph [Table Text Block] |
| Simplify Propel Opportunities ETF - NAV | S&P 500 TR Index | MSCI USA IMI/Health Care Net (USD) Index |
|---|
2/7/23 | $10,000 | $10,000 | $10,000 |
|---|
6/30/23 | $9,503 | $10,766 | $10,034 |
|---|
12/31/23 | $9,566 | $11,631 | $10,321 |
|---|
6/30/24 | $11,144 | $13,409 | $11,014 |
|---|
12/31/24 | $8,588 | $14,540 | $10,552 |
|---|
6/30/25 | $8,838 | $15,442 | $10,390 |
|---|
|
|
| Average Annual Return [Table Text Block] |
AVERAGE ANNUAL TOTAL RETURN
Fund/Index | 1 Year | Since Inception
2/7/2023 |
|---|
Simplify Propel Opportunities ETF - NAV | -20.69% | -5.03% |
|---|
S&P 500 TR Index | 15.16% | 19.92% |
|---|
MSCI USA IMI/Health Care Net (USD) Index | -5.66% | 1.61% |
|---|
|
|
| Performance Inception Date |
Feb. 07, 2023
|
|
| No Deduction of Taxes [Text Block] |
The graph and table do not reflect deduction of taxes that a shareholder would pay on Fund distributions or redemption of Fund shares.
|
|
| AssetsNet |
$ 65,973,784
|
|
| Holdings Count | Holding |
20
|
|
| Advisory Fees Paid, Amount |
$ 2,113,065
|
|
| InvestmentCompanyPortfolioTurnover |
22.00%
|
|
| Additional Fund Statistics [Text Block] |
The following table outlines key fund statistics that you should pay attention to. Fund net assets | $65,973,784 |
|---|
Total number of portfolio holdings | 20 |
|---|
Total advisory fee paid | $2,113,065 |
|---|
Portfolio turnover rate | 22% |
|---|
|
|
| Holdings [Text Block] |
Investment Categories | % of Net Assets |
|---|
U.S. Treasury Bills | 54.3% |
|---|
Common Stocks | 42.5% |
|---|
Limited Partnership | 37.5% |
|---|
Money Market Funds | 17.4% |
|---|
Corporate Bonds | 5.9% |
|---|
Liabilities in Excess of Other Assets | (57.6)% |
|---|
Total | 100.0% |
|---|
|
|
| Material Fund Change [Text Block] |
|
|
| C000223058 |
|
|
| Shareholder Report [Line Items] |
|
|
| Fund Name |
Simplify Volt TSLA Revolution ETF
|
|
| Class Name |
Simplify Volt TSLA Revolution ETF
|
|
| No Trading Symbol [Flag] |
true
|
|
| Security Exchange Name |
NYSEArca
|
|
| Annual or Semi-Annual Statement [Text Block] |
This annual shareholder report contains important information about Simplify Volt TSLA Revolution ETF (formerly, Simplify Volt RoboCar Disruption and Tech ETF trading under ticker VCAR) (the "Fund") for the period of July 1, 2024 to June 30, 2025.
|
|
| Shareholder Report Annual or Semi-Annual |
annual shareholder report
|
|
| Additional Information [Text Block] |
You can find additional information about the Fund at www.simplify.us/resources. You can also request this information by contacting us at (855) 772-8488.
|
|
| Material Fund Change Notice [Text Block] |
This report describes changes to the Fund that occurred during the reporting period.
|
|
| Additional Information Phone Number |
(855) 772-8488
|
|
| Additional Information Website |
www.simplify.us/resources
|
|
| Expenses [Text Block] |
What were the Fund’s costs for the last year? (based on a hypothetical $10,000 investment) Fund | Costs of a $10,000 investment | Costs paid as a
percentage of a $10,000 investment |
|---|
Simplify Volt TSLA Revolution ETF | $154 | 0.96% |
|---|
|
|
| Expenses Paid, Amount |
$ 154
|
|
| Expense Ratio, Percent |
0.96%
|
|
| Factors Affecting Performance [Text Block] |
Management's Discussion of Fund PerformanceFor the year ended June 30, 2025, TESL returned 122.93% vs its referenced benchmark, S&P 500 Index, return of 15.16%, out-performing the benchmark by 107.77%. TESL has delivered a strong return, showcasing the effectiveness of its proprietary algorithm and strategic use of derivative instruments—including options and swaps—for targeted protection, participation, and income generation.The dynamic exposure of 80 to 150% in Tesla-related instruments allows TESL to capture potential opportunities from Tesla’s volatile stock price movements. Looking ahead, we anticipate sustained momentum in the broader autonomous driving sector. Leveraging active management and risk-managed options overlay, we believe TESL is positioned to harness upside potential while enhancing income and managing downside risk—offering a distinct and sophisticated approach to equity investing. |
|
| Performance Past Does Not Indicate Future [Text] |
The Fund's past performance is not a good predictor of future performance.
|
|
| Line Graph [Table Text Block] |
| Simplify Volt TSLA Revolution ETF - NAV | S&P 500 TR Index |
|---|
12/28/20 | $10,000 | $10,000 |
|---|
12/31/20 | $10,456 | $10,057 |
|---|
6/30/21 | $9,466 | $11,591 |
|---|
12/31/21 | $12,382 | $12,944 |
|---|
6/30/22 | $7,297 | $10,361 |
|---|
12/31/22 | $4,810 | $10,600 |
|---|
6/30/23 | $7,258 | $12,391 |
|---|
12/31/23 | $7,699 | $13,387 |
|---|
6/30/24 | $8,852 | $15,434 |
|---|
12/31/24 | $19,185 | $16,736 |
|---|
6/30/25 | $19,732 | $17,774 |
|---|
|
|
| Average Annual Return [Table Text Block] |
AVERAGE ANNUAL TOTAL RETURN
Fund/Index | 1 Year | Since Inception
12/28/2020 |
|---|
Simplify Volt TSLA Revolution ETF - NAV | 122.93% | 16.29% |
|---|
S&P 500 TR Index | 15.16% | 13.62% |
|---|
|
|
| Performance Inception Date |
Dec. 28, 2020
|
|
| No Deduction of Taxes [Text Block] |
The graph and table do not reflect deduction of taxes that a shareholder would pay on Fund distributions or redemption of Fund shares.
|
|
| AssetsNet |
$ 32,489,812
|
|
| Holdings Count | Holding |
24
|
|
| Advisory Fees Paid, Amount |
$ 145,570
|
|
| InvestmentCompanyPortfolioTurnover |
872.00%
|
|
| Additional Fund Statistics [Text Block] |
The following table outlines key fund statistics that you should pay attention to. Fund net assets | $32,489,812 |
|---|
Total number of portfolio holdings | 24 |
|---|
Total advisory fee paid | $145,570 |
|---|
Portfolio turnover rate | 872% |
|---|
|
|
| Holdings [Text Block] |
Investment Categories | % of Net Assets |
|---|
U.S. Treasury Bills | 69.3% |
|---|
Common Stocks | 23.6% |
|---|
Purchased Options | 4.5% |
|---|
Money Market Funds | 2.3% |
|---|
Other Assets in Excess of Liabilities | 0.3% |
|---|
Total | 100.0% |
|---|
|
|
| Material Fund Change [Text Block] |
This is a summary of certain changes to the Fund since July 1, 2024. For more complete information, you may review the Fund’s prospectus dated November 1, 2024, which is available at www.simplify.us/resources or upon request at 1 (855) 772-8488. (1) The Fund changed its name from Simplify Volt RoboCar Disruption and Tech ETF to Simplify Volt TSLA Revolution ETF. (2) The Fund refocused its investment strategy to emphasize returns linked to Tesla, Inc. (NASDAQ: TSLA) (“Tesla”). (3) The Fund revised its 80% investment policy such that it invests at least 80% of its net assets (plus any borrowings for investment purposes) in Tesla-related instruments. (4) Because of the strategy changes, the Fund also became subject to compounding risk, leverage risk, and has a greater risk exposure to the price of Tesla stock. |
|
| C000241460 |
|
|
| Shareholder Report [Line Items] |
|
|
| Fund Name |
Simplify Commodities Strategy No K-1 ETF
|
|
| Class Name |
Simplify Commodities Strategy No K-1 ETF
|
|
| No Trading Symbol [Flag] |
true
|
|
| Security Exchange Name |
NYSEArca
|
|
| Annual or Semi-Annual Statement [Text Block] |
This annual shareholder report contains important information about Simplify Commodities Strategy No K-1 ETF (the "Fund") for the period of July 1, 2024 to June 30, 2025.
|
|
| Shareholder Report Annual or Semi-Annual |
annual shareholder report
|
|
| Additional Information [Text Block] |
You can find additional information about the Fund at www.simplify.us/resources. You can also request this information by contacting us at (855) 772-8488.
|
|
| Additional Information Phone Number |
(855) 772-8488
|
|
| Additional Information Website |
www.simplify.us/resources
|
|
| Expenses [Text Block] |
What were the Fund’s costs for the last year? (based on a hypothetical $10,000 investment) Fund | Costs of a $10,000 investment | Costs paid as a
percentage of a $10,000 investment |
|---|
Simplify Commodities Strategy No K-1 ETF | $86 | 0.78% |
|---|
|
|
| Expenses Paid, Amount |
$ 86
|
|
| Expense Ratio, Percent |
0.78%
|
|
| Factors Affecting Performance [Text Block] |
Management's Discussion of Fund PerformanceFor the year ended June 30, 2025, HARD returned 20.52% vs the Bloomberg Commodity Index Total Return, which returned 5.77% for the same period, outperforming the benchmark by +14.75%. HARD surpassed its 2-year track record in March 2025. A key enhancement was made to HARD's portfolio to add investment across diversified commodity markets: Cocoa, Cotton, Coffee, Winter Wheat, Canola, Sugar, Soybean Meal, Feeder Cattle, Live Cattle, Lean Hogs, Palladium and Platinum. Positive returns from positions in softs (Cocoa, Coffee), select metals (Gold, Platinum), and Live and Feeder Cattle were additive to performance. HARD's average commodity exposure was about +40%, reflecting its long commodity bias, while avoiding negative carry in commodities with excessively steep or inverted curves. Looking ahead, we believe HARD’s asset selection and positioning should enable it to outperform during a cyclical bull market in commodities, while also adding value from supply-demand imbalances. |
|
| Performance Past Does Not Indicate Future [Text] |
The Fund's past performance is not a good predictor of future performance.
|
|
| Line Graph [Table Text Block] |
| Simplify Commodities Strategy No K-1 ETF - NAV | Bloomberg U.S. Aggregate Bond Index | Bloomberg Commodity Index Total Return |
|---|
3/27/23 | $10,000 | $10,000 | $10,000 |
|---|
3/31/23 | $9,956 | $10,050 | $10,175 |
|---|
6/30/23 | $9,914 | $9,966 | $9,914 |
|---|
9/30/23 | $10,250 | $9,644 | $10,381 |
|---|
12/31/23 | $9,497 | $10,301 | $9,901 |
|---|
3/31/24 | $9,611 | $10,221 | $10,118 |
|---|
6/30/24 | $9,977 | $10,228 | $10,410 |
|---|
9/30/24 | $10,510 | $10,759 | $10,480 |
|---|
12/31/24 | $11,298 | $10,430 | $10,433 |
|---|
3/31/25 | $13,121 | $10,720 | $11,360 |
|---|
6/30/25 | $12,024 | $10,849 | $11,010 |
|---|
|
|
| Average Annual Return [Table Text Block] |
AVERAGE ANNUAL TOTAL RETURN
Fund/Index | 1 Year | Since Inception
3/27/2023 |
|---|
Simplify Commodities Strategy No K-1 ETF - NAV | 20.52% | 8.49% |
|---|
Bloomberg U.S. Aggregate Bond Index | 6.08% | 3.67% |
|---|
Bloomberg Commodity Index Total Return | 5.77% | 4.35% |
|---|
|
|
| Performance Inception Date |
Mar. 27, 2023
|
|
| No Deduction of Taxes [Text Block] |
The graph and table do not reflect deduction of taxes that a shareholder would pay on Fund distributions or redemption of Fund shares.
|
|
| AssetsNet |
$ 31,554,991
|
|
| Holdings Count | Holding |
6
|
|
| Advisory Fees Paid, Amount |
$ 144,331
|
|
| InvestmentCompanyPortfolioTurnover |
0.00%
|
|
| Additional Fund Statistics [Text Block] |
The following table outlines key fund statistics that you should pay attention to. Fund net assets | $31,554,991 |
|---|
Total number of portfolio holdings | 6 |
|---|
Total advisory fee paid | $144,331 |
|---|
Portfolio turnover rate | 0% |
|---|
|
|
| Holdings [Text Block] |
Investment Categories | % of Net Assets |
|---|
U.S. Treasury Bills | 121.1% |
|---|
Liabilities in Excess of Other Assets | (21.1)% |
|---|
Total | 100.0% |
|---|
|
|
| Material Fund Change [Text Block] |
|
|
| C000233897 |
|
|
| Shareholder Report [Line Items] |
|
|
| Fund Name |
Simplify Managed Futures Strategy ETF
|
|
| Class Name |
Simplify Managed Futures Strategy ETF
|
|
| No Trading Symbol [Flag] |
true
|
|
| Security Exchange Name |
NYSEArca
|
|
| Annual or Semi-Annual Statement [Text Block] |
This annual shareholder report contains important information about Simplify Managed Futures Strategy ETF (the "Fund") for the period of July 1, 2024 to June 30, 2025.
|
|
| Shareholder Report Annual or Semi-Annual |
annual shareholder report
|
|
| Additional Information [Text Block] |
You can find additional information about the Fund at www.simplify.us/resources. You can also request this information by contacting us at (855) 772-8488.
|
|
| Additional Information Phone Number |
(855) 772-8488
|
|
| Additional Information Website |
www.simplify.us/resources
|
|
| Expenses [Text Block] |
What were the Fund’s costs for the last year? (based on a hypothetical $10,000 investment) Fund | Costs of a $10,000 investment | Costs paid as a
percentage of a $10,000 investment |
|---|
Simplify Managed Futures Strategy ETF | $77 | 0.75% |
|---|
|
|
| Expenses Paid, Amount |
$ 77
|
|
| Expense Ratio, Percent |
0.75%
|
|
| Factors Affecting Performance [Text Block] |
Management's Discussion of Fund PerformanceFor the year ended June 30, 2025, CTA returned 4.23% vs the -11.87% of the SG CTA Index for the same period, outperforming the index by 16.10%. During the last 12 months, interest rates and additional commodity markets were added to the proprietary model to further enhance diversification. These included: Cocoa, Cotton, Coffee, Winter Wheat, Canola, Sugar, Soybean Meal, Feeder Cattle, Live Cattle, Lean Hogs, Palladium, Platinum, Canadian 2Y/5Y and U.S. 2Y/10Y/20Y/30Y rates. Long positions in Cocoa and Gold, and to a lesser extent, Cattle, contributed positively. Short positions in the front end of the U.S. curve also added value as rates rose in late 2024. The notional exposure of interest rates was primarily short in the second half of 2024 due to the shape of the curve which was identified by the model’s ‘carry’ signal. Interest rate exposure was positive in March/April 2025 due to the sell-off in equities, identified by the model’s ‘intermarket’ signal. Commodity exposure has been dynamic over the last 12 months. In the next 12 months, we expect geopolitical and macroeconomic risks to remain heightened. CTA will continue to seek to provide absolute returns and risk diversification from traditional stocks and bonds via its dynamic positioning in various markets. |
|
| Performance Past Does Not Indicate Future [Text] |
The Fund's past performance is not a good predictor of future performance.
|
|
| Line Graph [Table Text Block] |
| Simplify Managed Futures Strategy ETF- NAV | Bloomberg U.S. Aggregate Bond Index | SG CTA Index |
|---|
3/7/22 | $10,000 | $10,000 | $10,000 |
|---|
3/31/22 | $9,566 | $9,749 | $10,070 |
|---|
6/30/22 | $10,907 | $9,292 | $10,814 |
|---|
9/30/22 | $11,809 | $8,850 | $11,258 |
|---|
12/31/22 | $11,182 | $9,016 | $10,725 |
|---|
3/31/23 | $9,963 | $9,283 | $10,169 |
|---|
6/30/23 | $10,922 | $9,205 | $10,727 |
|---|
9/30/23 | $11,783 | $8,907 | $10,930 |
|---|
12/31/23 | $10,789 | $9,515 | $10,362 |
|---|
3/31/24 | $11,492 | $9,441 | $11,367 |
|---|
6/30/24 | $12,508 | $9,447 | $11,116 |
|---|
9/30/24 | $12,168 | $9,938 | $10,623 |
|---|
12/31/24 | $13,398 | $9,634 | $10,606 |
|---|
3/31/25 | $14,257 | $9,901 | $10,339 |
|---|
6/30/25 | $13,037 | $10,021 | $9,799 |
|---|
|
|
| Average Annual Return [Table Text Block] |
AVERAGE ANNUAL TOTAL RETURN
Fund/Index | 1 Year | Since Inception
3/7/2022 |
|---|
Simplify Managed Futures Strategy ETF - NAV | 4.23% | 8.33% |
|---|
Bloomberg U.S. Aggregate Bond Index | 6.08% | 0.06% |
|---|
SG CTA Index | -11.85% | -0.61% |
|---|
|
|
| Performance Inception Date |
Mar. 07, 2022
|
|
| No Deduction of Taxes [Text Block] |
The graph and table do not reflect deduction of taxes that a shareholder would pay on Fund distributions or redemption of Fund shares.
|
|
| AssetsNet |
$ 1,055,122,574
|
|
| Holdings Count | Holding |
5
|
|
| Advisory Fees Paid, Amount |
$ 4,364,164
|
|
| InvestmentCompanyPortfolioTurnover |
0.00%
|
|
| Additional Fund Statistics [Text Block] |
The following table outlines key fund statistics that you should pay attention to. Fund net assets | $1,055,122,574 |
|---|
Total number of portfolio holdings | 5 |
|---|
Total advisory fee paid | $4,364,164 |
|---|
Portfolio turnover rate | 0% |
|---|
|
|
| Holdings [Text Block] |
Investment Categories | % of Net Assets |
|---|
U.S. Treasury Bills | 99.6% |
|---|
Other Assets in Excess of Liabilities | 0.4% |
|---|
Total | 100.0% |
|---|
|
|
| Material Fund Change [Text Block] |
|
|
| C000259701 |
|
|
| Shareholder Report [Line Items] |
|
|
| Fund Name |
Simplify Piper Sandler US Small-Cap PLUS Income ETF
|
|
| Class Name |
Simplify Piper Sandler US Small-Cap PLUS Income ETF
|
|
| No Trading Symbol [Flag] |
true
|
|
| Security Exchange Name |
NYSEArca
|
|
| Annual or Semi-Annual Statement [Text Block] |
This annual shareholder report contains important information about Simplify Piper Sandler US Small-Cap PLUS Income ETF (the "Fund") for the period of April 28, 2025 (commencement of operations) to June 30, 2025.
|
|
| Shareholder Report Annual or Semi-Annual |
annual shareholder report
|
|
| Additional Information [Text Block] |
You can find additional information about the Fund at www.simplify.us/resources. You can also request this information by contacting us at (855) 772-8488.
|
|
| Additional Information Phone Number |
(855) 772-8488
|
|
| Additional Information Website |
www.simplify.us/resources
|
|
| Expenses [Text Block] |
What were the Fund’s costs for the period? (based on a hypothetical $10,000 investment) Fund | Costs of a $10,000 investment | Costs paid as a
percentage of a $10,000 investment |
|---|
Simplify Piper Sandler US Small-Cap PLUS Income ETF | $16Footnote Reference(1) | 0.90% |
|---|
| Footnote | Description | Footnote(1) | Based on the period April 28, 2025 (commencement of operations) through June 30, 2025. Expenses would have been higher if based on the full reporting period. |
|
|
| Expenses Paid, Amount |
$ 16
|
[7] |
| Expense Ratio, Percent |
0.90%
|
|
| Expenses Short Period Footnote [Text Block] |
Based on the period April 28, 2025 (commencement of operations) through June 30, 2025. Expenses would have been higher if based on the full reporting period.
|
|
| Factors Affecting Performance [Text Block] |
Management's Discussion of Fund PerformanceFor the period April 28, 2025, to June 30, 2025, LITL returned 10.25% vs. the Russell 2000 Total Return index return of 11.00%, underperforming by 0.75%. LITL delivered positive returns across all sectors with the exception of Consumer Staples. At the sector level, the strategy demonstrated strong stock selection in Financials, Utilities, Communication Services, Healthcare, and Industrials. Notable contributors to performance included Dave Inc., Hims & Hers Health, and Oscar Health, while ADMA Biologics, ACI Worldwide, and Lifestance Health Group were among the `primary detractors. The option based income overlay added 0.08% since the inception of LITL . Looking ahead, we anticipate the portfolio management team will maintain a disciplined focus on business cycle analysis to identify companies best positioned to outperform in the current economic environment. In addition, risk-managed options overlay enhances LITL's income potential and contributes meaningfully to total return, offering a differentiated approach to equity investing. |
|
| Performance Past Does Not Indicate Future [Text] |
The Fund's past performance is not a good predictor of future performance.
|
|
| Line Graph [Table Text Block] |
| Simplify Piper Sandler US Small-Cap PLUS Income ETF- NAV | Russell 2000 Total Return |
|---|
4/28/25 | $10,000 | $10,000 |
|---|
6/30/25 | $11,025 | $11,100 |
|---|
|
|
| Average Annual Return [Table Text Block] |
AVERAGE ANNUAL TOTAL RETURN
Fund/Index | Since Inception
4/28/2025 |
|---|
Simplify Piper Sandler US Small-Cap PLUS Income ETF - NAV | 10.25% |
|---|
Russell 2000 Total Return | 11.00% |
|---|
|
|
| Performance Inception Date |
Apr. 28, 2025
|
|
| No Deduction of Taxes [Text Block] |
The graph and table do not reflect deduction of taxes that a shareholder would pay on Fund distributions or redemption of Fund shares.
|
|
| AssetsNet |
$ 4,134,519
|
|
| Holdings Count | Holding |
205
|
|
| Advisory Fees Paid, Amount |
$ 4,820
|
|
| InvestmentCompanyPortfolioTurnover |
44.00%
|
|
| Additional Fund Statistics [Text Block] |
The following table outlines key fund statistics that you should pay attention to. Fund net assets | $4,134,519 |
|---|
Total number of portfolio holdings | 205 |
|---|
Total advisory fee paid | $4,820 |
|---|
Portfolio turnover rate | 44% |
|---|
|
|
| Holdings [Text Block] |
Investment Categories | % of Net Assets |
|---|
Common Stocks | 80.4% |
|---|
Purchased Options | 1.6% |
|---|
U.S. Exchange-Traded Funds | 1.4% |
|---|
Other Assets in Excess of Liabilities | 16.6% |
|---|
Total | 100.0% |
|---|
|
|
| Material Fund Change [Text Block] |
|
|
| C000248321 |
|
|
| Shareholder Report [Line Items] |
|
|
| Fund Name |
Simplify Tara India Opportunities ETF
|
|
| Class Name |
Simplify Tara India Opportunities ETF
|
|
| No Trading Symbol [Flag] |
true
|
|
| Security Exchange Name |
NYSEArca
|
|
| Annual or Semi-Annual Statement [Text Block] |
This annual shareholder report contains important information about Simplify Tara India Opportunities ETF (the "Fund") for the period of July 1, 2024 to June 30, 2025.
|
|
| Shareholder Report Annual or Semi-Annual |
annual shareholder report
|
|
| Additional Information [Text Block] |
You can find additional information about the Fund at www.simplify.us/resources. You can also request this information by contacting us at (855) 772-8488.
|
|
| Material Fund Change Notice [Text Block] |
This report describes changes to the Fund that occurred during the reporting period.
|
|
| Additional Information Phone Number |
(855) 772-8488
|
|
| Additional Information Website |
www.simplify.us/resources
|
|
| Expenses [Text Block] |
What were the Fund’s costs for the last year? (based on a hypothetical $10,000 investment) Fund | Costs of a $10,000 investment | Costs paid as a
percentage of a $10,000 investment |
|---|
Simplify Tara India Opportunities ETF | $75 | 0.73% |
|---|
|
|
| Expenses Paid, Amount |
$ 75
|
|
| Expense Ratio, Percent |
0.73%
|
|
| Factors Affecting Performance [Text Block] |
Management's Discussion of Fund PerformanceFor the year ended June 30, 2025, IOPP returned 4.93% vs. the benchmark MSCI India Net Total Return USD MSCI India Index return of 0.85% for the same period. The Fund’s holdings in a number of securities not included in the MSCI India Index, particularly in the Information Technology, Financials, and Consumer Discretionary sectors, contributed meaningfully to relative performance. Conversely, an off-benchmark holding in the Industrials sector detracted. Looking forward, we expect the Fund will continue to focus on the sectors which are levered to domestic income growth in India. And within that context, we anticipate the portfolio management team will utilize its local research presence across India to identify names which the team judges to exhibit more attractive growth potential than is currently priced into the market. |
|
| Performance Past Does Not Indicate Future [Text] |
The Fund's past performance is not a good predictor of future performance.
|
|
| Line Graph [Table Text Block] |
| Simplify Tara India Opportunities ETF - NAV | MSCI INDIA INDEX |
|---|
3/4/24 | $10,000 | $10,000 |
|---|
6/30/24 | $11,229 | $10,916 |
|---|
12/31/24 | $11,513 | $10,385 |
|---|
6/30/25 | $11,782 | $11,008 |
|---|
|
|
| Average Annual Return [Table Text Block] |
AVERAGE ANNUAL TOTAL RETURN
Fund/Index | 1 Year | Since Inception
3/4/2024 |
|---|
Simplify Tara India Opportunities ETF - NAV | 4.93% | 13.20% |
|---|
MSCI INDIA INDEX | 0.85% | 7.53% |
|---|
|
|
| Performance Inception Date |
Mar. 04, 2024
|
|
| No Deduction of Taxes [Text Block] |
The graph and table do not reflect deduction of taxes that a shareholder would pay on Fund distributions or redemption of Fund shares.
|
|
| AssetsNet |
$ 8,929,572
|
|
| Holdings Count | Holding |
28
|
|
| Advisory Fees Paid, Amount |
$ 75,476
|
|
| InvestmentCompanyPortfolioTurnover |
108.00%
|
|
| Additional Fund Statistics [Text Block] |
The following table outlines key fund statistics that you should pay attention to. Fund net assets | $8,929,572 |
|---|
Total number of portfolio holdings | 28 |
|---|
Total advisory fee paid | $75,476 |
|---|
Portfolio turnover rate | 108% |
|---|
|
|
| Holdings [Text Block] |
Investment Categories | % of Net Assets |
|---|
Common Stocks | 95.0% |
|---|
Money Market Funds | 2.8% |
|---|
Other Assets in Excess of Liabilities | 2.2% |
|---|
Total | 100.0% |
|---|
|
|
| Material Fund Change [Text Block] |
This is a summary of certain changes to the Fund since July 1, 2024. For more complete information, you may review the Fund's prospectus dated November 1, 2024, as supplemented May 23, 2025, which is available at www.simplify.us/resources or upon request at 1 (855) 772-8488. Effective May 23, 2025, the Fund's "other expenses" were re-estimated and restated from 0.51% to 0.04% of the Fund's average daily net assets due to a decrease in expenses that were expected to occur during the current fiscal year. |
|
| C000251042 |
|
|
| Shareholder Report [Line Items] |
|
|
| Fund Name |
Simplify National Muni Bond ETF
|
|
| Class Name |
Simplify National Muni Bond ETF
|
|
| No Trading Symbol [Flag] |
true
|
|
| Security Exchange Name |
NYSEArca
|
|
| Annual or Semi-Annual Statement [Text Block] |
This annual shareholder report contains important information about Simplify National Muni Bond ETF (the "Fund") for the period of September 9, 2024 to June 30, 2025.
|
|
| Shareholder Report Annual or Semi-Annual |
annual shareholder report
|
|
| Additional Information [Text Block] |
You can find additional information about the Fund at www.simplify.us/resources. You can also request this information by contacting us at (855) 772-8488.
|
|
| Additional Information Phone Number |
(855) 772-8488
|
|
| Additional Information Website |
www.simplify.us/resources
|
|
| Expenses [Text Block] |
What were the Fund’s costs for the period? (based on a hypothetical $10,000 investment) Fund | Costs of a $10,000 investment | Costs paid as a
percentage of a $10,000 investment |
|---|
Simplify National Muni Bond ETF | $41Footnote Reference(1) | 0.50% |
|---|
| Footnote | Description | Footnote(1) | Based on the period September 9, 2024 (commencement of operations) through June 30, 2025. Expenses would have been higher if based on the full reporting period. |
|
|
| Expenses Paid, Amount |
$ 41
|
[8] |
| Expense Ratio, Percent |
0.50%
|
|
| Expenses Short Period Footnote [Text Block] |
Based on the period September 9, 2024 (commencement of operations) through June 30, 2025. Expenses would have been higher if based on the full reporting period.
|
|
| Factors Affecting Performance [Text Block] |
Management's Discussion of Fund PerformanceFor the period September 9 2024, to June 30, 2025, NMB returned 2.80% vs. the Bloomberg Municipal Bond Index, return of -1.14% for the same period, outperforming the index by 3.94%. The primary drivers of return were NMB’s long position in an actively managed municipal bond strategy and a risk-managed, income generating options selling strategy spread across a variety of instruments, which included equity, fixed income, and commodity indices and ETFs. The municipal bond strategy detracted from performance during the period while the option selling strategy had strong performance adding to returns. Looking forward, we anticipate the performance of NMB's municipal bond strategy will depend on interest rate movements and municipal-to-treasury ratios and the options selling strategy will depend on implied volatility and market trends. |
|
| Performance Past Does Not Indicate Future [Text] |
The Fund's past performance is not a good predictor of future performance.
|
|
| Line Graph [Table Text Block] |
| Simplify National Muni Bond ETF- NAV | S&P 500 TR Index | Bloomberg Municipal Bond Index |
|---|
9/9/24 | $10,000 | $10,000 | $10,000 |
|---|
9/30/24 | $10,095 | $10,540 | $10,042 |
|---|
12/31/24 | $9,843 | $10,794 | $9,920 |
|---|
3/31/25 | $9,289 | $10,333 | $9,898 |
|---|
6/30/25 | $10,280 | $11,464 | $9,886 |
|---|
|
|
| Average Annual Return [Table Text Block] |
AVERAGE ANNUAL TOTAL RETURN
Fund/Index | Since Inception
9/9/2024 |
|---|
Simplify National Muni Bond ETF - NAV | 2.80% |
|---|
S&P 500 TR Index | 14.64% |
|---|
Bloomberg Municipal Bond Index | -1.14% |
|---|
|
|
| Performance Inception Date |
Sep. 09, 2024
|
|
| No Deduction of Taxes [Text Block] |
The graph and table do not reflect deduction of taxes that a shareholder would pay on Fund distributions or redemption of Fund shares.
|
|
| AssetsNet |
$ 73,958,352
|
|
| Holdings Count | Holding |
47
|
|
| Advisory Fees Paid, Amount |
$ 349,350
|
|
| InvestmentCompanyPortfolioTurnover |
678.00%
|
|
| Additional Fund Statistics [Text Block] |
The following table outlines key fund statistics that you should pay attention to. Fund net assets | $73,958,352 |
|---|
Total number of portfolio holdings | 47 |
|---|
Total advisory fee paid | $349,350 |
|---|
Portfolio turnover rate | 678% |
|---|
|
|
| Holdings [Text Block] |
Investment Categories | % of Net Assets |
|---|
Municipal Bonds | 85.1% |
|---|
Money Market Funds | 17.0% |
|---|
Purchased Options | 2.2% |
|---|
Liabilities in Excess of Other Assets | (4.3)% |
|---|
Total | 100.0% |
|---|
|
|
| Material Fund Change [Text Block] |
|
|
| C000251041 |
|
|
| Shareholder Report [Line Items] |
|
|
| Fund Name |
Simplify Gamma Emerging Market Bond ETF
|
|
| Class Name |
Simplify Gamma Emerging Market Bond ETF
|
|
| No Trading Symbol [Flag] |
true
|
|
| Security Exchange Name |
NYSEArca
|
|
| Annual or Semi-Annual Statement [Text Block] |
This annual shareholder report contains important information about Simplify Gamma Emerging Market Bond ETF (the "Fund") for the period of August 12, 2024 to June 30, 2025.
|
|
| Shareholder Report Annual or Semi-Annual |
annual shareholder report
|
|
| Additional Information [Text Block] |
You can find additional information about the Fund at www.simplify.us/resources. You can also request this information by contacting us at (855) 772-8488.
|
|
| Additional Information Phone Number |
(855) 772-8488
|
|
| Additional Information Website |
www.simplify.us/resources
|
|
| Expenses [Text Block] |
What were the Fund’s costs for the period? (based on a hypothetical $10,000 investment) Fund | Costs of a $10,000 investment | Costs paid as a
percentage of a $10,000 investment |
|---|
Simplify Gamma Emerging Market Bond ETF | $70Footnote Reference(1) | 0.76% |
|---|
| Footnote | Description | Footnote(1) | Based on the period August 12, 2024 (commencement of operations) through June 30, 2025. Expenses would have been higher if based on the full reporting period. |
|
|
| Expenses Paid, Amount |
$ 70
|
[9] |
| Expense Ratio, Percent |
0.76%
|
|
| Expenses Short Period Footnote [Text Block] |
Based on the period August 12, 2024 (commencement of operations) through June 30, 2025. Expenses would have been higher if based on the full reporting period.
|
|
| Factors Affecting Performance [Text Block] |
Management's Discussion of Fund PerformanceSince its inception on August 12, 2024, GAEM returned 9.42% vs. the benchmark J.P. Morgan EMBI Global Diversified Composite Index return of 7.29% for the same period. GAEM's local currency-denominated positions in the Dominican Republic contributed to relative performance over the period as did allocations to the bonds of Republic of El Salvador & Republic of Argentina. Looking forward, GAEM's sub-adviser intends to continue applying its on-the-ground presence and expertise in Latin American bonds to identify compelling investment opportunities with the potential to produce attractive yield in the portfolio without taking a meaningful step down in credit quality. |
|
| Performance Past Does Not Indicate Future [Text] |
The Fund's past performance is not a good predictor of future performance.
|
|
| Line Graph [Table Text Block] |
| Simplify Gamma Emerging Market Bond ETF - NAV | J.P. Morgan EMBI Global Core Index (USD) | J.P. Morgan EMBI Global Diversified Composite Index - 081224 |
|---|
8/12/24 | $10,000 | $10,000 | $10,000 |
|---|
9/30/24 | $10,289 | $10,377 | $10,355 |
|---|
12/31/24 | $10,395 | $10,138 | $10,154 |
|---|
3/31/25 | $10,585 | $10,347 | $10,382 |
|---|
6/30/25 | $10,942 | $10,705 | $10,727 |
|---|
|
|
| Average Annual Return [Table Text Block] |
AVERAGE ANNUAL TOTAL RETURN
Fund/Index | Since Inception
8/12/2024 |
|---|
Simplify Gamma Emerging Market Bond ETF - NAV | 9.42% |
|---|
J.P. Morgan EMBI Global Core Index (USD) | 7.05% |
|---|
J.P. Morgan EMBI Global Diversified Composite Index - 081224 | 7.29% |
|---|
|
|
| Performance Inception Date |
Aug. 12, 2024
|
|
| No Deduction of Taxes [Text Block] |
The graph and table do not reflect deduction of taxes that a shareholder would pay on Fund distributions or redemption of Fund shares.
|
|
| AssetsNet |
$ 11,494,950
|
|
| Holdings Count | Holding |
45
|
|
| Advisory Fees Paid, Amount |
$ 73,744
|
|
| InvestmentCompanyPortfolioTurnover |
131.00%
|
|
| Additional Fund Statistics [Text Block] |
The following table outlines key fund statistics that you should pay attention to. Fund net assets | $11,494,950 |
|---|
Total number of portfolio holdings | 45 |
|---|
Total advisory fee paid | $73,744 |
|---|
Portfolio turnover rate | 131% |
|---|
|
|
| Holdings [Text Block] |
Investment Categories | % of Net Assets |
|---|
Foreign Bonds | 92.5% |
|---|
U.S. Treasury Bills | 7.8% |
|---|
Money Market Funds | 0.1% |
|---|
Liabilities in Excess of Other Assets | (0.4)% |
|---|
Total | 100.0% |
|---|
|
|
| Material Fund Change [Text Block] |
|
|
| C000259668 |
|
|
| Shareholder Report [Line Items] |
|
|
| Fund Name |
Simplify Kayne Anderson Energy and Infrastructure Credit ETF
|
|
| Class Name |
Simplify Kayne Anderson Energy and Infrastructure Credit ETF
|
|
| No Trading Symbol [Flag] |
true
|
|
| Security Exchange Name |
NYSEArca
|
|
| Annual or Semi-Annual Statement [Text Block] |
This annual shareholder report contains important information about Simplify Kayne Anderson Energy and Infrastructure Credit ETF (the "Fund") for the period of May 27, 2025 (commencement of operations) to June 30, 2025.
|
|
| Shareholder Report Annual or Semi-Annual |
annual shareholder report
|
|
| Additional Information [Text Block] |
You can find additional information about the Fund at www.simplify.us/resources. You can also request this information by contacting us at (855) 772-8488.
|
|
| Additional Information Phone Number |
(855) 772-8488
|
|
| Additional Information Website |
www.simplify.us/resources
|
|
| Expenses [Text Block] |
What were the Fund’s costs for the period? (based on a hypothetical $10,000 investment) Fund | Costs of a $10,000 investment | Costs paid as a
percentage of a $10,000 investment |
|---|
Simplify Kayne Anderson Energy and Infrastructure Credit ETF | $7Footnote Reference(1) | 0.75% |
|---|
| Footnote | Description | Footnote(1) | Based on the period May 27, 2025 (commencement of operations) through June 30, 2025. Expenses would have been higher if based on the full reporting period. |
|
|
| Expenses Paid, Amount |
$ 7
|
[10] |
| Expense Ratio, Percent |
0.75%
|
|
| Expenses Short Period Footnote [Text Block] |
Based on the period May 27, 2025 (commencement of operations) through June 30, 2025. Expenses would have been higher if based on the full reporting period.
|
|
| Factors Affecting Performance [Text Block] |
Management's Discussion of Fund PerformanceSince its inception on May 27, 2025, KNRG returned 2.56% vs. ICE BofA US High Yield Index's return of 2.05% for the same period. Over the short period, KNRG benefited from having a slightly longer duration than the index as treasury yields declined modestly, allowing price appreciation to compensate for earning a yield slightly below that of the index. Looking forward, we anticipate KNRG will continue to exploit opportunities in the Energy Infrastructure space, using its wide remit to source attractive yield across the investment grade and high yield bond markets, hybrids, preferreds, and other security types. |
|
| Performance Past Does Not Indicate Future [Text] |
The Fund's past performance is not a good predictor of future performance.
|
|
| Line Graph [Table Text Block] |
| Simplify Kayne Anderson Energy and Infrastructure Credit ETF- NAV | Bloomberg U.S. Aggregate Bond Index | ICE BofA US High Yield Index |
|---|
5/27/25 | $10,000 | $10,000 | $10,000 |
|---|
6/30/25 | $10,256 | $10,191 | $10,205 |
|---|
|
|
| Average Annual Return [Table Text Block] |
AVERAGE ANNUAL TOTAL RETURN
Fund/Index | Since Inception
5/27/2025 |
|---|
Simplify Kayne Anderson Energy and Infrastructure Credit ETF - NAV | 2.56% |
|---|
Bloomberg U.S. Aggregate Bond Index | 1.91% |
|---|
ICE BofA US High Yield Index | 2.05% |
|---|
|
|
| Performance Inception Date |
May 27, 2025
|
|
| No Deduction of Taxes [Text Block] |
The graph and table do not reflect deduction of taxes that a shareholder would pay on Fund distributions or redemption of Fund shares.
|
|
| AssetsNet |
$ 9,558,791
|
|
| Holdings Count | Holding |
32
|
|
| Advisory Fees Paid, Amount |
$ 5,769
|
|
| InvestmentCompanyPortfolioTurnover |
8.00%
|
|
| Additional Fund Statistics [Text Block] |
The following table outlines key fund statistics that you should pay attention to. Fund net assets | $9,558,791 |
|---|
Total number of portfolio holdings | 32 |
|---|
Total advisory fee paid | $5,769 |
|---|
Portfolio turnover rate | 8% |
|---|
|
|
| Holdings [Text Block] |
Investment Categories | % of Net Assets |
|---|
Corporate Bonds | 96.7% |
|---|
Preferred Stocks | 1.0% |
|---|
Money Market Funds | 0.5% |
|---|
Other Assets in Excess of Liabilities | 1.8% |
|---|
Total | 100.0% |
|---|
|
|
| Material Fund Change [Text Block] |
|
|
|
|