Shareholder Report
Jun. 30, 2025
USD ($)
Holding


Shareholder Report |
6 Months Ended |
|---|---|
|
Jun. 30, 2025
USD ($)
Holding
| |
| Shareholder Report [Line Items] | |
| Document Type | N-CSRS |
| Amendment Flag | false |
| Registrant Name | Gabelli Asset Fund |
| Entity Central Index Key | 0000783898 |
| Entity Investment Company Type | N-1A |
| Document Period End Date | Jun. 30, 2025 |
| C000002943 | |
| Shareholder Report [Line Items] | |
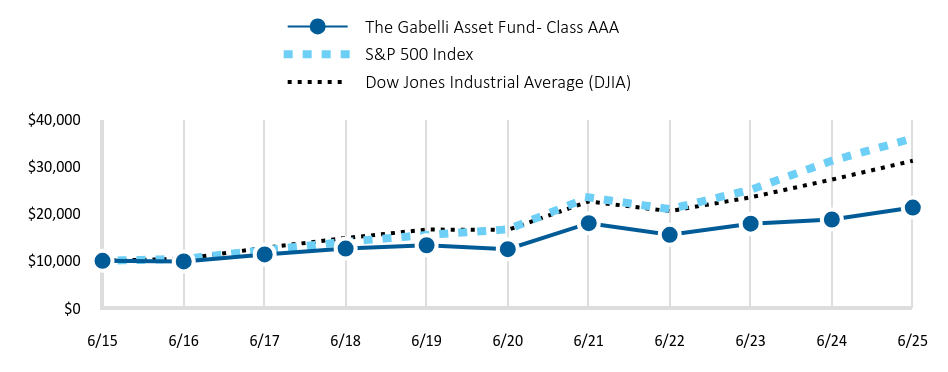
| Fund Name | The Gabelli Asset Fund |
| Class Name | Class AAA |
| Trading Symbol | GABAX |
| Annual or Semi-Annual Statement [Text Block] | This semi-annual shareholder report contains important information about The Gabelli Asset Fund (the Fund) for the period of January 1, 2025 to June 30, 2025. |
| Shareholder Report Annual or Semi-Annual | semi-annual shareholder report |
| Additional Information [Text Block] | You may find additional information about the Fund at www.gabelli.com/funds/open_ends. You may also request information by contacting us at 800-GABELLI (800-422-3554). |
| Additional Information Phone Number | 800-GABELLI (800-422-3554) |
| Additional Information Website | <span style="box-sizing: border-box; color: rgb(0, 0, 0); display: inline; flex-wrap: nowrap; font-size: 12px; font-weight: 400; grid-area: auto; line-height: 18px; margin: 0px; overflow: visible; text-align: justify; text-align-last: left; white-space-collapse: preserve-breaks;">www.gabelli.com/funds/open_ends</span> |
| Expenses [Text Block] | |
| Expenses Paid, Amount | $ 69 |
| Expense Ratio, Percent | 1.35% |
| Factors Affecting Performance [Text Block] | |
| Performance Past Does Not Indicate Future [Text] | Past performance does not guarantee future results. |
| Line Graph [Table Text Block] | |
| Average Annual Return [Table Text Block] | |
| No Deduction of Taxes [Text Block] | The table and graph presented above do not reflect the deduction of taxes a shareholder would pay on fund distributions or the redemption of fund shares. |
| AssetsNet | $ 1,558,468,818 |
| Holdings Count | Holding | 512 |
| Advisory Fees Paid, Amount | $ 7,635,576 |
| InvestmentCompanyPortfolioTurnover | 2.00% |
| Additional Fund Statistics [Text Block] | |
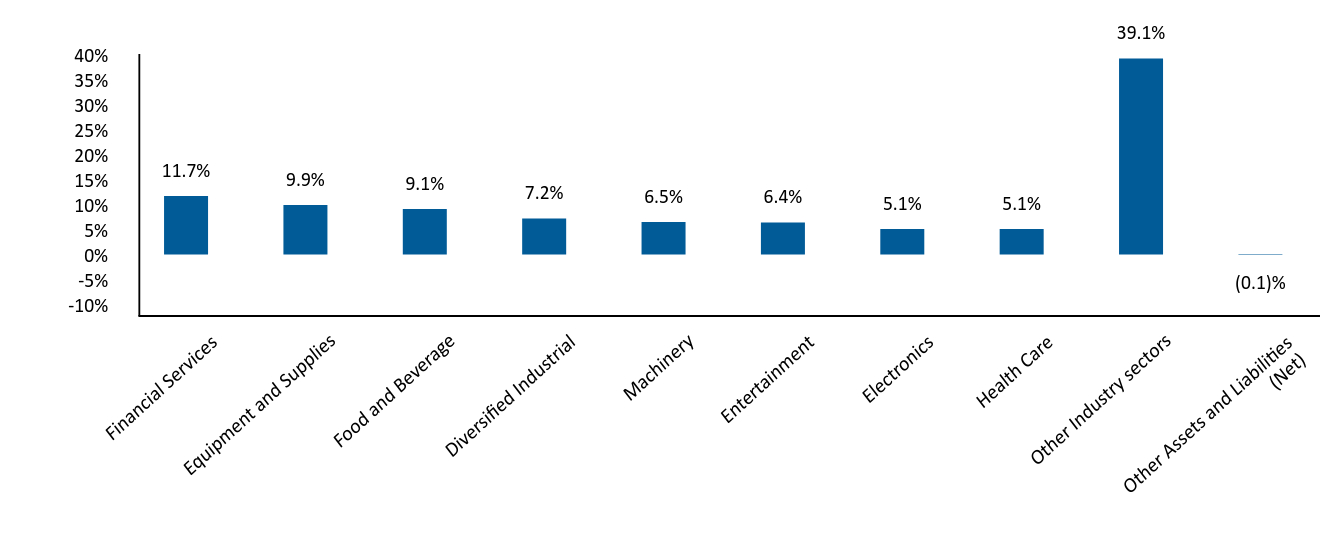
| Holdings [Text Block] | |
| Largest Holdings [Text Block] | |
| Material Fund Change [Text Block] | |
| Updated Prospectus Phone Number | 800-GABELLI (800-422-3554) |
| Updated Prospectus Email Address | <span style="box-sizing: border-box; color: rgb(0, 0, 0); display: inline; flex-wrap: nowrap; font-size: 12px; font-weight: 400; grid-area: auto; line-height: 18px; margin: 0px; overflow: visible; text-align: justify; text-align-last: left; white-space-collapse: preserve-breaks;">info@gabelli.com</span> |
| Updated Prospectus Web Address | <span style="box-sizing: border-box; color: rgb(0, 0, 0); display: inline; flex-wrap: nowrap; font-size: 12px; font-weight: 400; grid-area: auto; line-height: 18px; margin: 0px; overflow: visible; text-align: justify; text-align-last: left; white-space-collapse: preserve-breaks;">www.gabelli.com/funds/open_ends</span> |
| C000002942 | |
| Shareholder Report [Line Items] | |
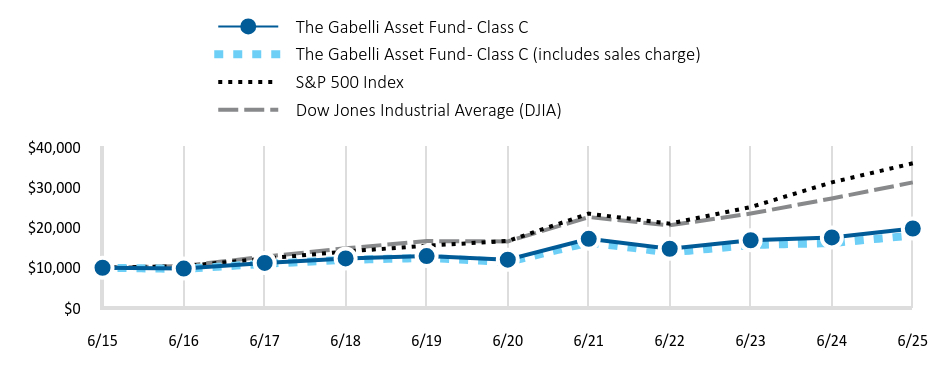
| Fund Name | The Gabelli Asset Fund |
| Class Name | Class C |
| Trading Symbol | GATCX |
| Annual or Semi-Annual Statement [Text Block] | This semi-annual shareholder report contains important information about The Gabelli Asset Fund (the Fund) for the period of January 1, 2025 to June 30, 2025. |
| Shareholder Report Annual or Semi-Annual | semi-annual shareholder report |
| Additional Information [Text Block] | You may find additional information about the Fund at www.gabelli.com/funds/open_ends. You may also request information by contacting us at 800-GABELLI (800-422-3554). |
| Additional Information Phone Number | 800-GABELLI (800-422-3554) |
| Additional Information Website | <span style="box-sizing: border-box; color: rgb(0, 0, 0); display: inline; flex-wrap: nowrap; font-size: 12px; font-weight: 400; grid-area: auto; line-height: 18px; margin: 0px; overflow: visible; text-align: justify; text-align-last: left; white-space-collapse: preserve-breaks;">www.gabelli.com/funds/open_ends</span> |
| Expenses [Text Block] | |
| Expenses Paid, Amount | $ 108 |
| Expense Ratio, Percent | 2.10% |
| Factors Affecting Performance [Text Block] | |
| Performance Past Does Not Indicate Future [Text] | Past performance does not guarantee future results. |
| Line Graph [Table Text Block] | |
| Average Annual Return [Table Text Block] | |
| No Deduction of Taxes [Text Block] | The table and graph presented above do not reflect the deduction of taxes a shareholder would pay on fund distributions or the redemption of fund shares. |
| AssetsNet | $ 1,558,468,818 |
| Holdings Count | Holding | 512 |
| Advisory Fees Paid, Amount | $ 7,635,576 |
| InvestmentCompanyPortfolioTurnover | 2.00% |
| Additional Fund Statistics [Text Block] | |
| Holdings [Text Block] | |
| Largest Holdings [Text Block] | |
| Material Fund Change [Text Block] | |
| Updated Prospectus Phone Number | 800-GABELLI (800-422-3554) |
| Updated Prospectus Email Address | <span style="box-sizing: border-box; color: rgb(0, 0, 0); display: inline; flex-wrap: nowrap; font-size: 12px; font-weight: 400; grid-area: auto; line-height: 18px; margin: 0px; overflow: visible; text-align: justify; text-align-last: left; white-space-collapse: preserve-breaks;">info@gabelli.com</span> |
| Updated Prospectus Web Address | <span style="box-sizing: border-box; color: rgb(0, 0, 0); display: inline; flex-wrap: nowrap; font-size: 12px; font-weight: 400; grid-area: auto; line-height: 18px; margin: 0px; overflow: visible; text-align: justify; text-align-last: left; white-space-collapse: preserve-breaks;">www.gabelli.com/funds/open_ends</span> |
| C000034307 | |
| Shareholder Report [Line Items] | |
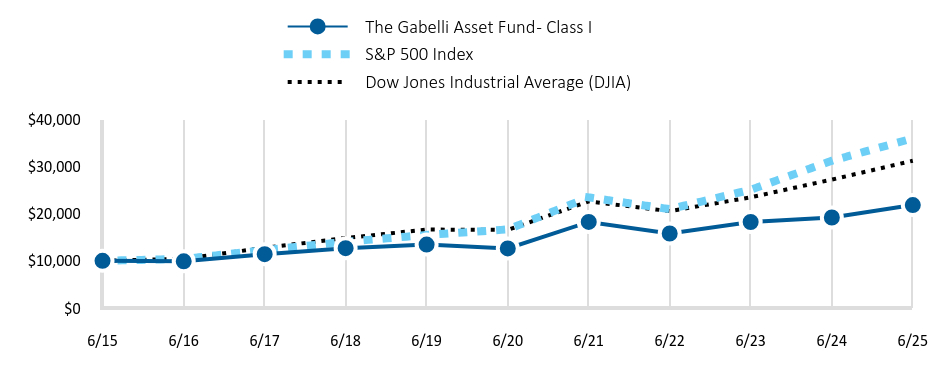
| Fund Name | The Gabelli Asset Fund |
| Class Name | Class I |
| Trading Symbol | GABIX |
| Annual or Semi-Annual Statement [Text Block] | This semi-annual shareholder report contains important information about The Gabelli Asset Fund (the Fund) for the period of January 1, 2025 to June 30, 2025. |
| Shareholder Report Annual or Semi-Annual | semi-annual shareholder report |
| Additional Information [Text Block] | You may find additional information about the Fund at www.gabelli.com/funds/open_ends. You may also request information by contacting us at 800-GABELLI (800-422-3554). |
| Additional Information Phone Number | 800-GABELLI (800-422-3554) |
| Additional Information Website | <span style="box-sizing: border-box; color: rgb(0, 0, 0); display: inline; flex-wrap: nowrap; font-size: 12px; font-weight: 400; grid-area: auto; line-height: 18px; margin: 0px; overflow: visible; text-align: justify; text-align-last: left; white-space-collapse: preserve-breaks;">www.gabelli.com/funds/open_ends</span> |
| Expenses [Text Block] | |
| Expenses Paid, Amount | $ 56 |
| Expense Ratio, Percent | 1.10% |
| Factors Affecting Performance [Text Block] | |
| Performance Past Does Not Indicate Future [Text] | Past performance does not guarantee future results. |
| Line Graph [Table Text Block] | |
| Average Annual Return [Table Text Block] | |
| No Deduction of Taxes [Text Block] | The table and graph presented above do not reflect the deduction of taxes a shareholder would pay on fund distributions or the redemption of fund shares. |
| AssetsNet | $ 1,558,468,818 |
| Holdings Count | Holding | 512 |
| Advisory Fees Paid, Amount | $ 7,635,576 |
| InvestmentCompanyPortfolioTurnover | 2.00% |
| Additional Fund Statistics [Text Block] | |
| Holdings [Text Block] | |
| Largest Holdings [Text Block] | |
| Material Fund Change [Text Block] | |
| Updated Prospectus Phone Number | 800-GABELLI (800-422-3554) |
| Updated Prospectus Email Address | <span style="box-sizing: border-box; color: rgb(0, 0, 0); display: inline; flex-wrap: nowrap; font-size: 12px; font-weight: 400; grid-area: auto; line-height: 18px; margin: 0px; overflow: visible; text-align: justify; text-align-last: left; white-space-collapse: preserve-breaks;">info@gabelli.com</span> |
| Updated Prospectus Web Address | <span style="box-sizing: border-box; color: rgb(0, 0, 0); display: inline; flex-wrap: nowrap; font-size: 12px; font-weight: 400; grid-area: auto; line-height: 18px; margin: 0px; overflow: visible; text-align: justify; text-align-last: left; white-space-collapse: preserve-breaks;">www.gabelli.com/funds/open_ends</span> |
| C000002940 | |
| Shareholder Report [Line Items] | |
| Fund Name | The Gabelli Asset Fund |
| Class Name | Class A |
| Trading Symbol | GATAX |
| Annual or Semi-Annual Statement [Text Block] | This semi-annual shareholder report contains important information about The Gabelli Asset Fund (the Fund) for the period of January 1, 2025 to June 30, 2025. |
| Shareholder Report Annual or Semi-Annual | semi-annual shareholder report |
| Additional Information [Text Block] | You may find additional information about the Fund at www.gabelli.com/funds/open_ends. You may also request information by contacting us at 800-GABELLI (800-422-3554). |
| Additional Information Phone Number | 800-GABELLI (800-422-3554) |
| Additional Information Website | <span style="box-sizing: border-box; color: rgb(0, 0, 0); display: inline; flex-wrap: nowrap; font-size: 12px; font-weight: 400; grid-area: auto; line-height: 18px; margin: 0px; overflow: visible; text-align: justify; text-align-last: left; white-space-collapse: preserve-breaks;">www.gabelli.com/funds/open_ends</span> |
| Expenses [Text Block] | |
| Expenses Paid, Amount | $ 69 |
| Expense Ratio, Percent | 1.35% |
| Factors Affecting Performance [Text Block] | |
| Performance Past Does Not Indicate Future [Text] | Past performance does not guarantee future results. |
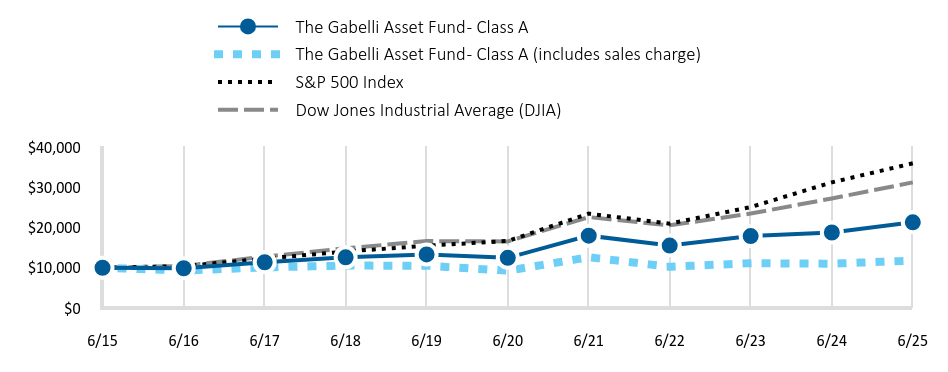
| Line Graph [Table Text Block] | |
| Average Annual Return [Table Text Block] | |
| No Deduction of Taxes [Text Block] | The table and graph presented above do not reflect the deduction of taxes a shareholder would pay on fund distributions or the redemption of fund shares. |
| AssetsNet | $ 1,558,468,818 |
| Holdings Count | Holding | 512 |
| Advisory Fees Paid, Amount | $ 7,635,576 |
| InvestmentCompanyPortfolioTurnover | 2.00% |
| Additional Fund Statistics [Text Block] | |
| Holdings [Text Block] | |
| Largest Holdings [Text Block] | |
| Material Fund Change [Text Block] | |
| Updated Prospectus Phone Number | 800-GABELLI (800-422-3554) |
| Updated Prospectus Email Address | <span style="box-sizing: border-box; color: rgb(0, 0, 0); display: inline; flex-wrap: nowrap; font-size: 12px; font-weight: 400; grid-area: auto; line-height: 18px; margin: 0px; overflow: visible; text-align: justify; text-align-last: left; white-space-collapse: preserve-breaks;">info@gabelli.com</span> |
| Updated Prospectus Web Address | <span style="box-sizing: border-box; color: rgb(0, 0, 0); display: inline; flex-wrap: nowrap; font-size: 12px; font-weight: 400; grid-area: auto; line-height: 18px; margin: 0px; overflow: visible; text-align: justify; text-align-last: left; white-space-collapse: preserve-breaks;">www.gabelli.com/funds/open_ends</span> |
