Shareholder Report
|
12 Months Ended |
|
Jun. 30, 2025
USD ($)
Holdings
|
|---|
| Shareholder Report [Line Items] |
|
| Document Type |
N-CSR
|
| Amendment Flag |
false
|
| Registrant Name |
Madison ETFs Trust
|
| Entity Central Index Key |
0001976877
|
| Entity Investment Company Type |
N-1A
|
| Document Period End Date |
Jun. 30, 2025
|
| Madison Aggregate Bond ETF |
|
| Shareholder Report [Line Items] |
|
| Fund Name |
Madison Aggregate Bond ETF
|
| Class Name |
Madison
Aggregate Bond ETF
|
| Trading Symbol |
MAGG
|
| Security Exchange Name |
NYSE
|
| Annual or Semi-Annual Statement [Text Block] |
This
annual shareholder report contains important information about the Madison Aggregate Bond ETF for the period of July 1, 2024 to
June 30, 2025.
|
| Shareholder Report Annual or Semi-Annual |
annual shareholder report
|
| Additional Information [Text Block] |
You can find additional information about the Fund at https://www.madisonfunds.com/etfs/#documents. You can
also request this information by contacting us at 800-767-0300.
|
| Additional Information Phone Number |
800-767-0300
|
| Additional Information Website |
https://www.madisonfunds.com/etfs/#documents
|
| Expenses [Text Block] |
| |
WHAT WERE THE FUND COSTS FOR THE PAST YEAR? (based on a hypothetical $10,000 investment) |
|
|
| |
|
|
|
|
|
|
| |
|
Fund Name |
Costs
of a $10,000
investment |
Costs
paid as a percentage of
a $10,000 investment |
|
|
| |
|
Madison Aggregate Bond ETF |
$41 |
0.40% |
|
|
| |
|
|
|
|
|
|
| |
|
|
|
|
|
|
|
| Expenses Paid, Amount |
$ 41
|
| Expense Ratio, Percent |
0.40%
|
| Factors Affecting Performance [Text Block] |
| |
HOW
DID THE FUND PERFORM LAST YEAR AND WHAT AFFECTED ITS PERFORMANCE?
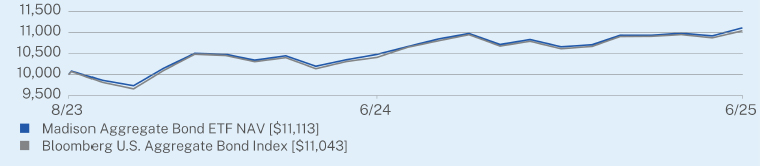
The
Madison Aggregate Bond ETF returned 6.03% on a NAV basis for the one-year period ended June 30th, 2025. The Fund underperformed
the Bloomberg U.S. Aggregate Bond Index which returned 6.08%.
Performance
was driven by overweight allocations to corporate bonds and mortgage-backed securities relative to the index. The primary
detractor was an overweight to longer maturity U.S. Treasuries, which lagged as the yield curve steepened over the past
year.
|
|
| |
Madison Aggregate Bond ETF |
Bloomberg U.S. Aggregate Bond Index |
| 8/28/2023 |
10000 |
0 |
| 8/31/2023 |
10085 |
0 |
| 9/30/2023 |
9866 |
0 |
| 10/31/2023 |
9736 |
0 |
| 11/30/2023 |
10152 |
0 |
| 12/31/2023 |
10507 |
0 |
| 1/31/2024 |
10485 |
0 |
| 2/29/2024 |
10346 |
0 |
| 3/31/2024 |
10449 |
0 |
| 4/30/2024 |
10199 |
0 |
| 5/31/2024 |
10357 |
0 |
| 6/30/2024 |
10481 |
0 |
| 7/31/2024 |
10670 |
0 |
| 8/31/2024 |
10852 |
0 |
| 9/30/2024 |
10981 |
0 |
| 10/31/2024 |
10718 |
0 |
| 11/30/2024 |
10836 |
0 |
| 12/31/2024 |
10663 |
0 |
| 1/31/2025 |
10713 |
0 |
| 2/28/2025 |
10939 |
0 |
| 3/31/2025 |
10938 |
0 |
| 4/30/2025 |
10988 |
0 |
| 5/31/2025 |
10923 |
0 |
| 6/30/2025 |
11113 |
0 |
|
| Performance Past Does Not Indicate Future [Text] |
The
Fund’s past performance is not a good predictor of the Fund’s future performance.
|
| Line Graph [Table Text Block] |
| |
HOW
DID THE FUND PERFORM SINCE INCEPTION?*
The
$10,000 chart reflects a hypothetical $10,000 investment in the Fund noted. The chart uses total return NAV performance
and assumes reinvestment of dividends and capital gains. Fund expenses, including management fees and other expenses were
deducted.
|
|
| |
CUMULATIVE
PERFORMANCE (Initial Investment
of $10,000) |
|
| |
|
|
| |
 |
|
| |
|
|
|
| Average Annual Return [Table Text Block] |
| |
ANNUAL
AVERAGE TOTAL RETURN (%) |
|
| |
|
|
| |
|
1
Year |
Since
Inception
(08/28/2023) |
|
| |
Madison
Aggregate Bond ETF NAV |
6.03 |
5.90 |
|
| |
Bloomberg
U.S. Aggregate Bond Index |
6.08 |
5.54 |
|
|
| Performance Inception Date |
Aug. 28, 2023
|
| No Deduction of Taxes [Text Block] |
The returns do not reflect the
deduction of taxes that a shareholder would pay on Fund distributions or redemption of Fund shares.
|
| Updated Performance Information Location [Text Block] |
Visit https://www.madisonfunds.com/etfs/#documents for more recent
performance information.
|
| Net Assets |
$ 67,216,000
|
| Holdings Count | Holdings |
216
|
| Advisory Fees Paid, Amount |
$ 257,420
|
| Investment Company, Portfolio Turnover |
27.00%
|
| Additional Fund Statistics [Text Block] |
| |
KEY
FUND STATISTICS (as of
June 30, 2025) |
|
|
| |
Net
Assets |
$67,216,000 |
|
| |
Number
of Holdings |
216 |
|
| |
Net
Advisory Fee |
$257,420 |
|
| |
Portfolio
Turnover |
27% |
|
| |
Average
Credit Quality |
AA3 |
|
| |
Effective
Duration |
5.70
years |
|
| |
30-Day
SEC Yield |
4.50% |
|
| |
Distribution
Yield |
4.50% |
|
| |
Visit https://www.madisonfunds.com/etfs/#documents for more recent
performance information. |
|
|
| Holdings [Text Block] |
WHAT
DID THE FUND INVEST IN? (as
of June 30, 2025)
| |
Security
Type |
(%) |
|
| |
Mortgage-Backed
Securities |
35.1% |
|
| |
Corporate
Bonds |
32.2% |
|
| |
U.S.
Treasury Securities |
23.7% |
|
| |
Collateralized
Mortgage Obligations |
4.2% |
|
| |
Asset-Backed
Securities |
2.8% |
|
| |
Cash
& Other |
2.0% |
|
|
| Largest Holdings [Text Block] |
| |
Top
10 Issuers |
(%) |
|
| |
United
States Treasury Note/Bond |
23.7% |
|
| |
Federal
National Mortgage Association |
20.3% |
|
| |
Federal
Home Loan Mortgage Corp. |
17.0% |
|
| |
Towd
Point Mortgage Trust |
1.2% |
|
| |
GE
HealthCare Technologies, Inc. |
1.1% |
|
| |
JPMorgan
Chase & Co. |
1.1% |
|
| |
Energy
Transfer LP |
1.0% |
|
| |
Morgan
Stanley |
0.9% |
|
| |
Citigroup,
Inc. |
0.9% |
|
| |
PNC
Financial Services Group, Inc. |
0.9% |
|
|
| Madison Covered Call ETF |
|
| Shareholder Report [Line Items] |
|
| Fund Name |
Madison Covered Call ETF
|
| Class Name |
Madison Covered Call ETF
|
| Trading Symbol |
CVRD
|
| Security Exchange Name |
NYSE
|
| Annual or Semi-Annual Statement [Text Block] |
This annual shareholder report contains important information about the Madison Covered Call ETF for the period of July 1,
2024 to June 30, 2025.
|
| Shareholder Report Annual or Semi-Annual |
annual shareholder report
|
| Additional Information [Text Block] |
You can find additional information about the Fund at https://www.madisonfunds.com/etfs/#documents. You can also request this information by contacting us at 800-767-0300.
|
| Additional Information Phone Number |
800-767-0300
|
| Additional Information Website |
https://www.madisonfunds.com/etfs/#documents
|
| Expenses [Text Block] |
| |
WHAT WERE THE FUND COSTS FOR THE PAST YEAR? (based on a hypothetical $10,000 investment) |
|
|
| |
|
|
|
|
|
|
| |
|
Fund Name |
Costs
of a $10,000
investment |
Costs
paid as a percentage of
a $10,000 investment |
|
|
| |
|
Madison Covered Call ETF |
$95 |
0.92% |
|
|
| |
|
|
|
|
|
|
| |
|
|
|
|
|
|
|
| Expenses Paid, Amount |
$ 95
|
| Expense Ratio, Percent |
0.92%
|
| Factors Affecting Performance [Text Block] |
| |
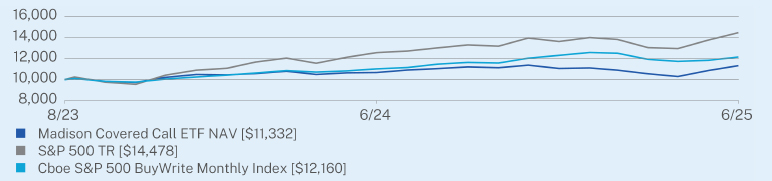
HOW
DID THE FUND PERFORM LAST YEAR AND WHAT AFFECTED ITS PERFORMANCE?
The Madison Covered Call ETF returned 6.09% on a NAV basis for the one-year period ended June 30, 2025. The
Fund underperformed the CBOE S&P 500 BuyWrite Monthly Index and the S&P 500 Index which returned 10.25% and
15.16%, respectfully.
The Fund’s underweight to mega-cap growth stocks and focus on defensive, income-oriented positions contributed to
underperformance. Elevated option coverage reflected a cautious stance amid high market valuations. Sector positioning
and stock selection also detracted from results, as the Fund remained underexposed to high-performing sectors such as
Technology, Consumer Discretionary, and Communication Services.
|
|
| |
Madison Covered Call ETF |
S&P 500 TR |
Cboe S&P 500 BuyWrite Monthly Index |
| 8/21/2023 |
10000 |
10000 |
0 |
| 8/31/2023 |
10162 |
10252 |
0 |
| 9/30/2023 |
9843 |
9763 |
0 |
| 10/31/2023 |
9744 |
9558 |
0 |
| 11/30/2023 |
10218 |
10430 |
0 |
| 12/31/2023 |
10492 |
10904 |
0 |
| 1/31/2024 |
10457 |
11087 |
0 |
| 2/29/2024 |
10582 |
11680 |
0 |
| 3/31/2024 |
10801 |
12055 |
0 |
| 4/30/2024 |
10494 |
11563 |
0 |
| 5/31/2024 |
10651 |
12136 |
0 |
| 6/30/2024 |
10682 |
12572 |
0 |
| 7/31/2024 |
10917 |
12725 |
0 |
| 8/31/2024 |
11059 |
13033 |
0 |
| 9/30/2024 |
11214 |
13312 |
0 |
| 10/31/2024 |
11137 |
13191 |
0 |
| 11/30/2024 |
11379 |
13965 |
0 |
| 12/31/2024 |
11067 |
13632 |
0 |
| 1/31/2025 |
11115 |
14012 |
0 |
| 2/28/2025 |
10906 |
13829 |
0 |
| 3/31/2025 |
10558 |
13050 |
0 |
| 4/30/2025 |
10298 |
12962 |
0 |
| 5/31/2025 |
10872 |
13777 |
0 |
| 6/30/2025 |
11332 |
14478 |
0 |
|
| Performance Past Does Not Indicate Future [Text] |
The
Fund’s past performance is not a good predictor of the Fund’s future performance.
|
| Line Graph [Table Text Block] |
| |
HOW
DID THE FUND PERFORM SINCE INCEPTION?*
The $10,000 chart reflects a hypothetical $10,000 investment in the Fund noted. The chart uses total return NAV
performance and assumes reinvestment of dividends and capital gains. Fund expenses, including management fees and
other expenses were deducted.
|
|
| |
CUMULATIVE
PERFORMANCE (Initial Investment
of $10,000) |
|
| |
|
|
| |
 |
|
| |
|
|
|
| Average Annual Return [Table Text Block] |
| |
ANNUAL
AVERAGE TOTAL RETURN (%) |
|
| |
|
|
| |
|
1
Year |
Since
Inception
(08/21/2023) |
|
| |
Madison Covered Call ETF NAV |
6.09 |
6.95 |
|
| |
S&P 500 TR |
15.16 |
22.01 |
|
| |
Cboe
S&P 500 BuyWrite Monthly Index |
10.25 |
11.09 |
|
|
| Performance Inception Date |
Aug. 21, 2023
|
| No Deduction of Taxes [Text Block] |
The returns do not reflect the
deduction of taxes that a shareholder would pay on Fund distributions or redemption of Fund shares.
|
| Updated Performance Information Location [Text Block] |
Visit https://www.madisonfunds.com/etfs/#documents for more recent performance information.
|
| Net Assets |
$ 43,659,604
|
| Holdings Count | Holdings |
73
|
| Advisory Fees Paid, Amount |
$ 531,752
|
| Investment Company, Portfolio Turnover |
82.00%
|
| Additional Fund Statistics [Text Block] |
| |
KEY FUND STATISTICS (as of June 30, 2025) |
|
|
| |
Net Assets |
$43,659,604 |
|
| |
Number of Holdings |
73 |
|
| |
Net Advisory Fee |
$531,752 |
|
| |
Portfolio Turnover |
82% |
|
| |
30-Day SEC Yield |
1.39% |
|
| |
Distribution Yield |
1.93% |
|
| |
Visit https://www.madisonfunds.com/etfs/#documents for more recent performance information. |
|
|
| Holdings [Text Block] |
WHAT
DID THE FUND INVEST IN? (as
of June 30, 2025)
| |
Top Sectors |
(%) |
|
| |
Technology |
27.0% |
|
| |
Financials |
12.3% |
|
| |
Consumer Discretionary |
9.5% |
|
| |
Health Care |
9.2% |
|
| |
Communications |
8.4% |
|
| |
Industrials |
7.8% |
|
| |
Consumer Staples |
5.7% |
|
| |
Energy |
4.5% |
|
| |
Real Estate |
2.9% |
|
| |
Cash & Other |
12.7% |
|
|
| Largest Holdings [Text Block] |
| |
Top 10 Issuers |
(%) |
|
| |
PayPal Holdings, Inc. |
4.0% |
|
| |
Adobe, Inc. |
3.8% |
|
| |
Texas Instruments, Inc. |
3.6% |
|
| |
Comcast Corp. |
3.6% |
|
| |
Accenture PLC |
3.6% |
|
| |
Advanced Micro Devices, Inc. |
3.5% |
|
| |
ASML Holding NV |
3.4% |
|
| |
Microchip Technology, Inc. |
3.4% |
|
| |
Danaher Corp. |
3.2% |
|
| |
MKS, Inc. |
3.0% |
|
|
| Madison Dividend Value ETF |
|
| Shareholder Report [Line Items] |
|
| Fund Name |
Madison Dividend Value ETF
|
| Class Name |
Madison Dividend Value ETF
|
| Trading Symbol |
DIVL
|
| Security Exchange Name |
NYSE
|
| Annual or Semi-Annual Statement [Text Block] |
This annual shareholder report contains important information about the Madison Dividend Value ETF for the period of July 1, 2024 to June 30, 2025.
|
| Shareholder Report Annual or Semi-Annual |
annual shareholder report
|
| Additional Information [Text Block] |
You can find additional information about the Fund at https://www.madisonfunds.com/etfs/#documents. You can also request this information by contacting us at 800-767-0300.
|
| Additional Information Phone Number |
800-767-0300
|
| Additional Information Website |
https://www.madisonfunds.com/etfs/#documents
|
| Expenses [Text Block] |
| |
WHAT WERE THE FUND COSTS FOR THE PAST YEAR? (based on a hypothetical $10,000 investment) |
|
|
| |
|
|
|
|
|
|
| |
|
Fund Name |
Costs
of a $10,000
investment |
Costs
paid as a percentage of
a $10,000 investment |
|
|
| |
|
Madison Dividend Value ETF |
$69 |
0.65% |
|
|
| |
|
|
|
|
|
|
| |
|
|
|
|
|
|
|
| Expenses Paid, Amount |
$ 69
|
| Expense Ratio, Percent |
0.65%
|
| Factors Affecting Performance [Text Block] |
| |
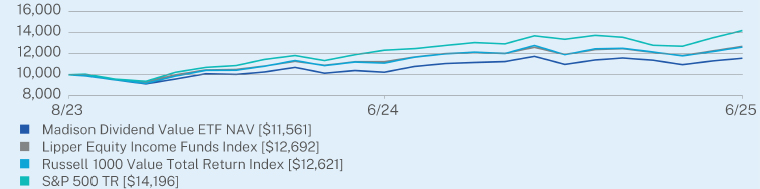
HOW
DID THE FUND PERFORM LAST YEAR AND WHAT AFFECTED ITS PERFORMANCE?
The Madison Dividend Value ETF returned 12.96% on a NAV basis for the one-year period ended June 30, 2025. The Fund underperformed the Russell 1000 Value Total Return Index, which returned 13.70%, and the Lipper Equity Funds Index, which returned 13.01%, and the S&P 500 Index which returned 15.16%.
Relative performance was supported by strong stock selection in Health Care, Industrials, Materials, and Financials. However, underperformance in Consumer Staples, Energy, Communication Services, Utilities, and Technology weighed on results.
|
|
| |
Madison Dividend Value ETF |
Lipper Equity Income Funds Index |
Russell 1000 Value Total Return Index |
S&P 500 TR |
| 8/14/2023 |
10000 |
0 |
0 |
10,000 |
| 8/31/2023 |
9887 |
0 |
0 |
10,052 |
| 9/30/2023 |
9498 |
0 |
0 |
9,573 |
| 10/31/2023 |
9127 |
0 |
0 |
9,372 |
| 11/30/2023 |
9581 |
0 |
0 |
10,228 |
| 12/31/2023 |
10092 |
0 |
0 |
10,692 |
| 1/31/2024 |
10028 |
0 |
0 |
10,872 |
| 2/29/2024 |
10260 |
0 |
0 |
11,452 |
| 3/31/2024 |
10693 |
0 |
0 |
11,821 |
| 4/30/2024 |
10146 |
0 |
0 |
11,338 |
| 5/31/2024 |
10394 |
0 |
0 |
11,900 |
| 6/30/2024 |
10235 |
0 |
0 |
12,327 |
| 7/31/2024 |
10785 |
0 |
0 |
12,477 |
| 8/31/2024 |
11061 |
0 |
0 |
12,780 |
| 9/30/2024 |
11161 |
0 |
0 |
13,053 |
| 10/31/2024 |
11245 |
0 |
0 |
12,934 |
| 11/30/2024 |
11742 |
0 |
0 |
13,694 |
| 12/31/2024 |
10980 |
0 |
0 |
13,367 |
| 1/31/2025 |
11396 |
0 |
0 |
13,740 |
| 2/28/2025 |
11585 |
0 |
0 |
13,560 |
| 3/31/2025 |
11373 |
0 |
0 |
12,796 |
| 4/30/2025 |
10956 |
0 |
0 |
12,709 |
| 5/31/2025 |
11309 |
0 |
0 |
13,509 |
| 6/30/2025 |
11561 |
0 |
0 |
14,196 |
|
| Performance Past Does Not Indicate Future [Text] |
The
Fund’s past performance is not a good predictor of the Fund’s future performance.
|
| Line Graph [Table Text Block] |
| |
HOW
DID THE FUND PERFORM SINCE INCEPTION?*
The $10,000 chart reflects a hypothetical $10,000 investment in the Fund noted. The chart uses total return NAV performance and assumes reinvestment of dividends and capital gains. Fund expenses, including management fees and other expenses were deducted.
|
|
| |
CUMULATIVE
PERFORMANCE (Initial Investment
of $10,000) |
|
| |
|
|
| |
 |
|
| |
|
|
|
| Average Annual Return [Table Text Block] |
| |
ANNUAL
AVERAGE TOTAL RETURN (%) |
|
| |
|
|
| |
|
1
Year |
Since
Inception
(08/14/2023) |
|
| |
Madison Dividend Value ETF NAV |
12.96 |
8.03 |
|
| |
Lipper Equity Income Funds Index |
13.01 |
13.53 |
|
| |
Russell 1000 Value Total Return Index |
13.70 |
13.18 |
|
| |
S&P
500 TR |
15.16 |
20.51 |
|
|
| Performance Inception Date |
Aug. 14, 2023
|
| No Deduction of Taxes [Text Block] |
The returns do not reflect the
deduction of taxes that a shareholder would pay on Fund distributions or redemption of Fund shares.
|
| Updated Performance Information Location [Text Block] |
Visit https://www.madisonfunds.com/etfs/#documents for more recent performance information.
|
| Net Assets |
$ 60,435,408
|
| Holdings Count | Holdings |
38
|
| Advisory Fees Paid, Amount |
$ 381,976
|
| Investment Company, Portfolio Turnover |
50.00%
|
| Additional Fund Statistics [Text Block] |
| |
KEY FUND STATISTICS (as of June 30, 2025) |
|
|
| |
Net Assets |
$60,435,408 |
|
| |
Number of Holdings |
38 |
|
| |
Net Advisory Fee |
$381,976 |
|
| |
Portfolio Turnover |
50% |
|
| |
30-Day SEC Yield |
1.93% |
|
| |
Distribution Yield |
2.49% |
|
| |
Visit https://www.madisonfunds.com/etfs/#documents for more recent performance information. |
|
|
| Holdings [Text Block] |
WHAT
DID THE FUND INVEST IN? (as
of June 30, 2025)
| |
Top Sectors |
(%) |
|
| |
Industrials |
22.6% |
|
| |
Financials |
20.6% |
|
| |
Health Care |
14.9% |
|
| |
Energy |
9.7% |
|
| |
Materials |
6.9% |
|
| |
Technology |
6.3% |
|
| |
Consumer Discretionary |
6.2% |
|
| |
Consumer Staples |
5.1% |
|
| |
Real Estate |
3.8% |
|
| |
Cash & Other |
3.9% |
|
|
| Largest Holdings [Text Block] |
| |
Top 10 Issuers |
(%) |
|
| |
Morgan Stanley |
4.2% |
|
| |
Fastenal Co. |
4.1% |
|
| |
Automatic Data Processing, Inc. |
4.1% |
|
| |
Blackrock, Inc. |
4.0% |
|
| |
CME Group, Inc. |
4.0% |
|
| |
Honeywell International, Inc. |
4.0% |
|
| |
Texas Instruments, Inc. |
3.9% |
|
| |
Home Depot, Inc. |
3.5% |
|
| |
NextEra Energy, Inc. |
3.5% |
|
| |
TE Connectivity PLC |
3.4% |
|
|
| Madison Short-Term Strategic Income ETF |
|
| Shareholder Report [Line Items] |
|
| Fund Name |
Madison Short-Term Strategic Income ETF
|
| Class Name |
Madison Short-Term Strategic Income ETF
|
| Trading Symbol |
MSTI
|
| Security Exchange Name |
NYSE
|
| Annual or Semi-Annual Statement [Text Block] |
This annual
shareholder report contains important information about the Madison Short-Term Strategic Income ETF for theperiod of July 1,
2024 to June 30, 2025.
|
| Shareholder Report Annual or Semi-Annual |
annual
shareholder report
|
| Additional Information [Text Block] |
You
can find additional information about the Fund at https://www.madisonfunds.com/etfs/#documents.
You can also request this information by contacting us at 800-767-0300.
|
| Additional Information Phone Number |
800-767-0300
|
| Additional Information Website |
https://www.madisonfunds.com/etfs/#documents
|
| Expenses [Text Block] |
| |
WHAT WERE THE FUND COSTS FOR THE PAST YEAR? (based on a hypothetical $10,000 investment) |
|
|
| |
|
|
|
|
|
|
| |
|
Fund Name |
Costs
of a $10,000
investment |
Costs
paid as a percentage of
a $10,000 investment |
|
|
| |
|
Madison Short-Term Strategic Income ETF |
$41 |
0.40% |
|
|
| |
|
|
|
|
|
|
| |
|
|
|
|
|
|
|
| Expenses Paid, Amount |
$ 41
|
| Expense Ratio, Percent |
0.40%
|
| Factors Affecting Performance [Text Block] |
| |
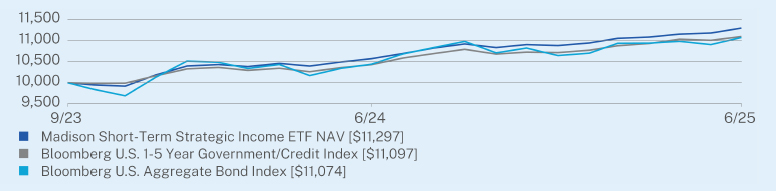
HOW
DID THE FUND PERFORM LAST YEAR AND WHAT AFFECTED ITS PERFORMANCE?
The Madison Short-Term Strategic Income ETF returned 6.87% on a NAV basis for the one-year period ended June 30th,2025. The Fund outperformed the Bloomberg U.S. 1–5 Year Government/Credit Index which returned 6.42%, andtheBloomberg U.S. Aggregate Bond Index which returned 6.08%.
Outperformance was primarily driven by overweight positions in below investment grade corporate bonds, as well asasset-backed and mortgage-backed securities. However, the Fund’s exposure to securities with maturities beyond fiveyears detracted from results. Overall, the Fund’s sector allocation contributed positively to relative performance despiteheadwinds from duration positioning.
|
|
| |
Madison Short-Term Strategic Income ETF |
Bloomberg U.S. 1-5 Year Government/Credit Index |
Bloomberg U.S. Aggregate Bond Index |
| 9/5/2023 |
10000 |
0 |
10,000 |
| 9/30/2023 |
9947 |
0 |
9,843 |
| 10/31/2023 |
9917 |
0 |
9,688 |
| 11/30/2023 |
10183 |
0 |
10,126 |
| 12/31/2023 |
10396 |
0 |
10,514 |
| 1/31/2024 |
10431 |
0 |
10,485 |
| 2/29/2024 |
10383 |
0 |
10,337 |
| 3/31/2024 |
10459 |
0 |
10,432 |
| 4/30/2024 |
10395 |
0 |
10,169 |
| 5/31/2024 |
10493 |
0 |
10,341 |
| 6/30/2024 |
10571 |
0 |
10,439 |
| 7/31/2024 |
10694 |
0 |
10,683 |
| 8/31/2024 |
10825 |
0 |
10,837 |
| 9/30/2024 |
10922 |
0 |
10,982 |
| 10/31/2024 |
10835 |
0 |
10,709 |
| 11/30/2024 |
10906 |
0 |
10,823 |
| 12/31/2024 |
10883 |
0 |
10,645 |
| 1/31/2025 |
10945 |
0 |
10,702 |
| 2/28/2025 |
11055 |
0 |
10,937 |
| 3/31/2025 |
11084 |
0 |
10,941 |
| 4/30/2025 |
11155 |
0 |
10,984 |
| 5/31/2025 |
11181 |
0 |
10,906 |
| 6/30/2025 |
11297 |
0 |
11,074 |
|
| Performance Past Does Not Indicate Future [Text] |
The
Fund’s past performance is not a good predictor of the Fund’s future performance.
|
| Line Graph [Table Text Block] |
| |
HOW
DID THE FUND PERFORM SINCE INCEPTION?*
The $10,000 chart reflects a hypothetical $10,000 investment in the Fund noted. The chart uses total return NAVperformance and assumes reinvestment of dividends and capital gains. Fund expenses, including management fees andother expenses were deducted.
|
|
| |
CUMULATIVE
PERFORMANCE (Initial Investment
of $10,000) |
|
| |
|
|
| |
 |
|
| |
|
|
|
| Average Annual Return [Table Text Block] |
| |
ANNUAL
AVERAGE TOTAL RETURN (%) |
|
| |
|
|
| |
|
1
Year |
Since
Inception
(09/05/2023) |
|
| |
Madison Short-Term Strategic Income ETF NAV |
6.87 |
6.93 |
|
| |
Bloomberg U.S. 1-5 Year Government/Credit Index |
6.42 |
5.89 |
|
| |
Bloomberg U.S. Aggregate Bond Index |
6.08 |
5.77 |
|
|
| Performance Inception Date |
Sep. 05, 2023
|
| No Deduction of Taxes [Text Block] |
The returns do not reflect the
deduction of taxes that a shareholder would pay on Fund distributions or redemption of Fund shares.
|
| Updated Performance Information Location [Text Block] |
Visit https://www.madisonfunds.com/etfs/#documents for more recent performance information.
|
| Net Assets |
$ 67,917,809
|
| Holdings Count | Holdings |
108
|
| Advisory Fees Paid, Amount |
$ 263,364
|
| Investment Company, Portfolio Turnover |
33.00%
|
| Additional Fund Statistics [Text Block] |
| |
KEY FUND STATISTICS (as of June 30, 2025) |
|
|
| |
Net Assets |
$67,917,809 |
|
| |
Number of Holdings |
108 |
|
| |
Net Advisory Fee |
$263,364 |
|
| |
Portfolio Turnover |
33% |
|
| |
Average Credit Quality |
BAA1 |
|
| |
Effective Duration |
2.42 years |
|
| |
30-Day SEC Yield |
4.56% |
|
| |
Distribution Yield |
4.56% |
|
| |
Visit https://www.madisonfunds.com/etfs/#documents for more recent performance information. |
|
|
| Holdings [Text Block] |
WHAT
DID THE FUND INVEST IN? (as
of June 30, 2025)
| |
Top Sectors |
(%) |
|
| |
Financials |
29.6% |
|
| |
Mortgage Securities |
21.4% |
|
| |
Energy |
9.1% |
|
| |
Industrials |
6.3% |
|
| |
Asset Backed Securities |
6.0% |
|
| |
Health Care |
5.1% |
|
| |
Government |
4.5% |
|
| |
Communications |
4.3% |
|
| |
Technology |
3.9% |
|
| |
Cash & Other |
9.8% |
|
|
| Largest Holdings [Text Block] |
| |
Top 10 Issuers |
(%) |
|
| |
Federal National Mortgage Association |
13.2% |
|
| |
Federal Home Loan Mortgage Corp. |
5.6% |
|
| |
United States Treasury Note/Bond |
3.8% |
|
| |
Capital One Financial Corp. |
3.5% |
|
| |
Bank of America Corp. |
2.4% |
|
| |
Morgan Stanley |
2.2% |
|
| |
GE HealthCare Technologies, Inc. |
2.2% |
|
| |
PNC Financial Services Group, Inc. |
2.0% |
|
| |
Fifth Third Bancorp |
1.9% |
|
| |
Marathon Petroleum Corp. |
1.9% |
|
|