Shareholder Report
Jun. 30, 2025
USD ($)
Holding
Fund Expenses for the Last Six Months
(Based on a hypothetical $10,000 investment)
| Fund (Class) | Cost of $10,000 Investment | Cost of $10,000 investment as a percentage |
| International Equity Index Fund (Institutional Class/GIIYX) |
$10 | 0.19% |
Key Fund Statistics
The following table outlines key fund statistics that you should pay attention to.
| Fund Net Assets | $1,492,597,014 |
| Total number of portfolio holdings | 577 |
| Portfolio turnover rate for the period | 4% |
Graphical Representation of Holdings
The tables below show the investment makeup of the Fund, representing percentage of the total net assets of the Fund.
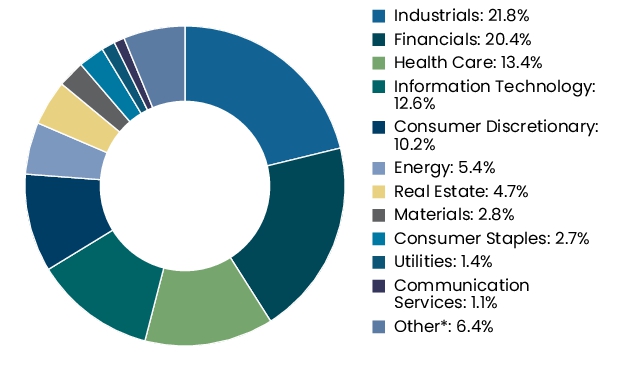
INDUSTRY SECTOR ALLOCATION
| Financials | 23.3% |
| Industrials | 18.3% |
| Health Care | 10.1% |
| Consumer Discretionary | 9.3% |
| Information Technology | 7.9% |
| Consumer Staples | 7.1% |
| Materials | 5.2% |
| Communication Services | 4.7% |
| Utilities | 3.5% |
| Energy | 3.3% |
| Real Estate | 1.4% |
| Other* | 11.6% |
| 105.7% |
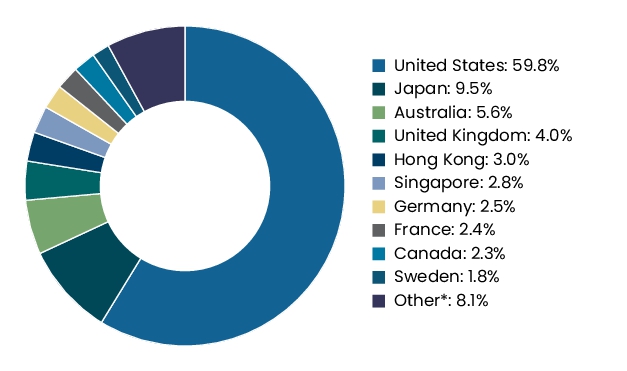
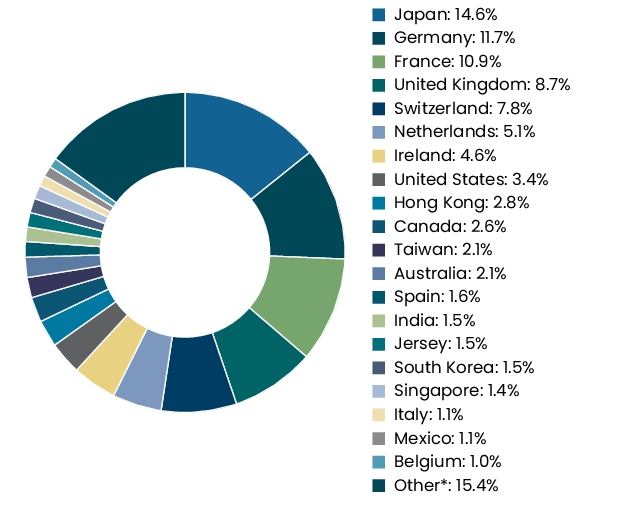
GEOGRAPHIC ALLOCATION
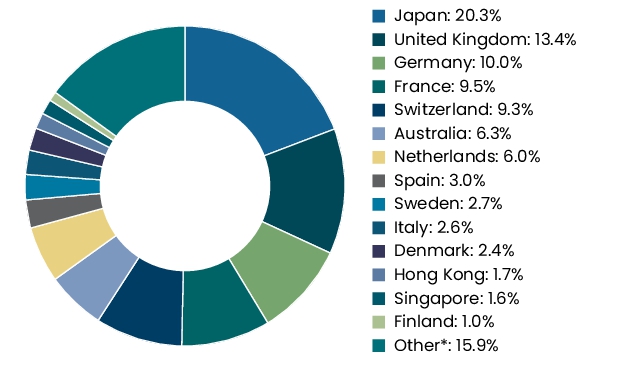
*Includes, as applicable, short-term investments, derivatives and countries and/or categories rounding to less than 1%.
Fund Expenses for the Last Six Months
(Based on a hypothetical $10,000 investment)
| Fund (Class) | Cost of $10,000 Investment1 | Cost of $10,000 investment as a percentage1 |
| International Equity Index Fund (Investor Class/GIIZX) |
$27 | 0.50% |
|
1
|
Reflects applicable expense reimbursements and fee waivers.
|
Key Fund Statistics
The following table outlines key fund statistics that you should pay attention to.
| Fund Net Assets | $1,492,597,014 |
| Total number of portfolio holdings | 577 |
| Portfolio turnover rate for the period | 4% |
Graphical Representation of Holdings
The tables below show the investment makeup of the Fund, representing percentage of the total net assets of the Fund.
INDUSTRY SECTOR ALLOCATION
| Financials | 23.3% |
| Industrials | 18.3% |
| Health Care | 10.1% |
| Consumer Discretionary | 9.3% |
| Information Technology | 7.9% |
| Consumer Staples | 7.1% |
| Materials | 5.2% |
| Communication Services | 4.7% |
| Utilities | 3.5% |
| Energy | 3.3% |
| Real Estate | 1.4% |
| Other* | 11.6% |
| 105.7% |
GEOGRAPHIC ALLOCATION

*Includes, as applicable, short-term investments, derivatives and countries and/or categories rounding to less than 1%.
Fund Expenses for the Last Six Months
(Based on a hypothetical $10,000 investment)
| Fund (Class) | Cost of $10,000 Investment1 | Cost of $10,000 investment as a percentage1 |
| Emerging Markets Equity Fund (Investor Class/GEMZX) |
$70 | 1.31% |
|
1
|
Reflects applicable expense reimbursements and fee waivers.
|
Key Fund Statistics
The following table outlines key fund statistics that you should pay attention to.
| Fund Net Assets | $849,754,316 |
| Total number of portfolio holdings | 409 |
| Portfolio turnover rate for the period | 31% |
Graphical Representation of Holdings
The tables below show the investment makeup of the Fund, representing percentage of the total net assets of the Fund.
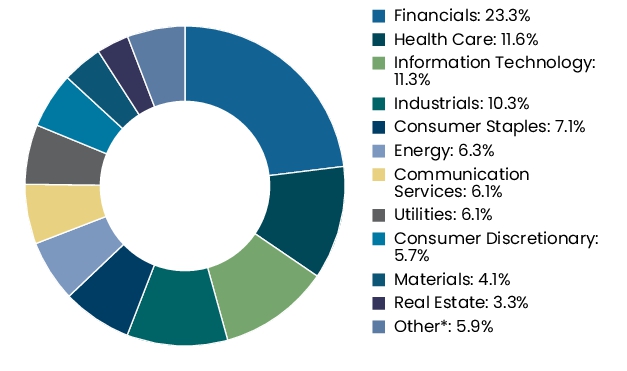
INDUSTRY SECTOR ALLOCATION
| Financials | 25.5% |
| Information Technology | 25.3% |
| Consumer Discretionary | 13.1% |
| Communication Services | 9.0% |
| Consumer Staples | 5.3% |
| Industrials | 5.0% |
| Materials | 2.5% |
| Real Estate | 2.3% |
| Health Care | 2.1% |
| Energy | 1.9% |
| Utilities | 0.6% |
| Other* | 5.2% |
| Warrants | 0.0% |
| 97.8% |
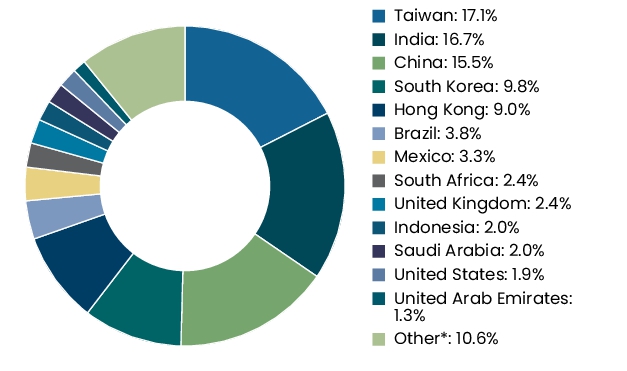
GEOGRAPHIC ALLOCATION

*Includes, as applicable, short-term investments, derivatives and countries and/or categories rounding to less than 1%.
Fund Expenses for the Last Six Months
(Based on a hypothetical $10,000 investment)
| Fund (Class) | Cost of $10,000 Investment1 | Cost of $10,000 investment as a percentage1 |
| Emerging Markets Equity Fund (Institutional Class/GEMYX) |
$57 | 1.06% |
|
1
|
Reflects applicable expense reimbursements and fee waivers.
|
Key Fund Statistics
The following table outlines key fund statistics that you should pay attention to.
| Fund Net Assets | $849,754,316 |
| Total number of portfolio holdings | 409 |
| Portfolio turnover rate for the period | 31% |
Graphical Representation of Holdings
The tables below show the investment makeup of the Fund, representing percentage of the total net assets of the Fund.
INDUSTRY SECTOR ALLOCATION
| Financials | 25.5% |
| Information Technology | 25.3% |
| Consumer Discretionary | 13.1% |
| Communication Services | 9.0% |
| Consumer Staples | 5.3% |
| Industrials | 5.0% |
| Materials | 2.5% |
| Real Estate | 2.3% |
| Health Care | 2.1% |
| Energy | 1.9% |
| Utilities | 0.6% |
| Other* | 5.2% |
| Warrants | 0.0% |
| 97.8% |
GEOGRAPHIC ALLOCATION
*Includes, as applicable, short-term investments, derivatives and countries and/or categories rounding to less than 1%.
Fund Expenses for the Last Six Months
(Based on a hypothetical $10,000 investment)
| Fund (Class) | Cost of $10,000 Investment1 | Cost of $10,000 investment as a percentage1 |
| MyDestination 2055 Fund (Institutional Class/GMGYX) |
$8 | 0.15% |
|
1
|
Reflects applicable expense reimbursements and fee waivers.
|
Key Fund Statistics
The following table outlines key fund statistics that you should pay attention to.
| Fund Net Assets | $963,193,705 |
| Total number of portfolio holdings | 9 |
| Portfolio turnover rate for the period | 2% |
Graphical Representation of Holdings
The tables below show the investment makeup of the Fund, representing percentage of the total net assets of the Fund.
TOP TEN HOLDINGS
| GuideStone Equity Index Fund | 50.0% |
| GuideStone International Equity Index Fund | 24.8% |
| GuideStone Emerging Markets Equity Fund | 6.1% |
| GuideStone Small Cap Equity Fund | 6.0% |
| GuideStone Defensive Market Strategies® Fund | 5.0% |
| GuideStone Medium-Duration Bond Fund | 4.1% |
| GuideStone Global Real Estate Securities Fund | 1.9% |
| GuideStone Money Market Fund, 4.25% | 1.1% |
| GuideStone Global Bond Fund | 1.0% |
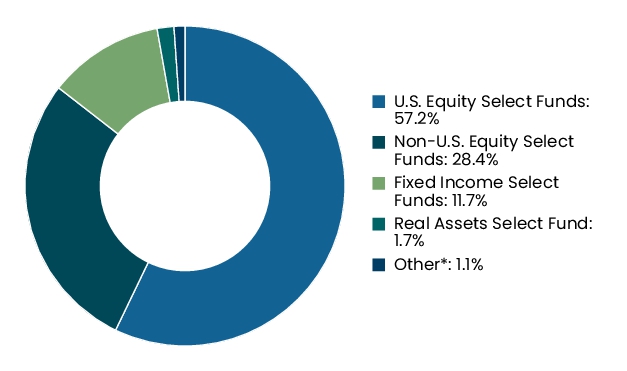
PORTFOLIO SUMMARY
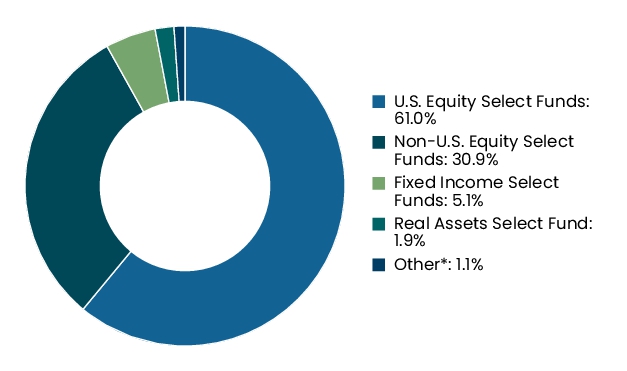
*Includes, if any, short-term investments, derivatives and categories rounding to less than 1%.
TOP TEN HOLDINGS
| GuideStone Equity Index Fund | 50.0% |
| GuideStone International Equity Index Fund | 24.8% |
| GuideStone Emerging Markets Equity Fund | 6.1% |
| GuideStone Small Cap Equity Fund | 6.0% |
| GuideStone Defensive Market Strategies® Fund | 5.0% |
| GuideStone Medium-Duration Bond Fund | 4.1% |
| GuideStone Global Real Estate Securities Fund | 1.9% |
| GuideStone Money Market Fund, 4.25% | 1.1% |
| GuideStone Global Bond Fund | 1.0% |
Fund Expenses for the Last Six Months
(Based on a hypothetical $10,000 investment)
| Fund (Class) | Cost of $10,000 Investment | Cost of $10,000 investment as a percentage |
| Defensive Market Strategies Fund (Investor Class/GDMZX) |
$46 | 0.92% |
Key Fund Statistics
The following table outlines key fund statistics that you should pay attention to.
| Fund Net Assets | $1,396,719,297 |
| Total number of portfolio holdings | 216 |
| Portfolio turnover rate for the period | 37% |
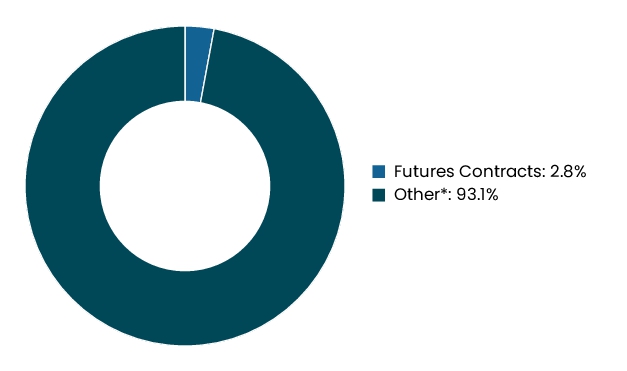
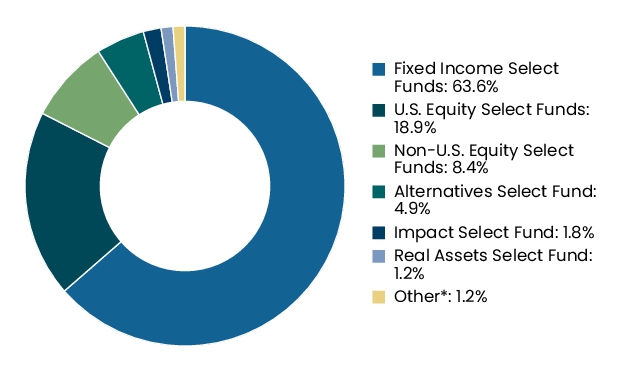
Graphical Representation of Holdings
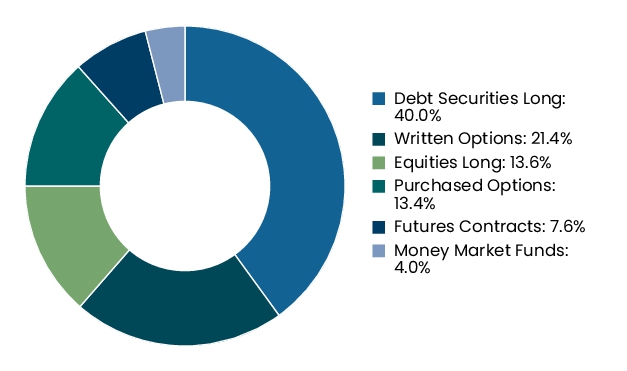
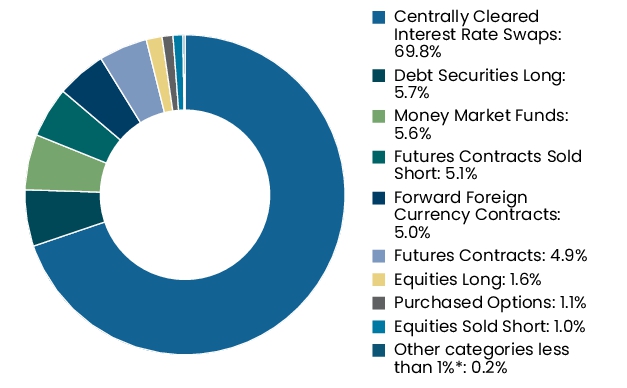
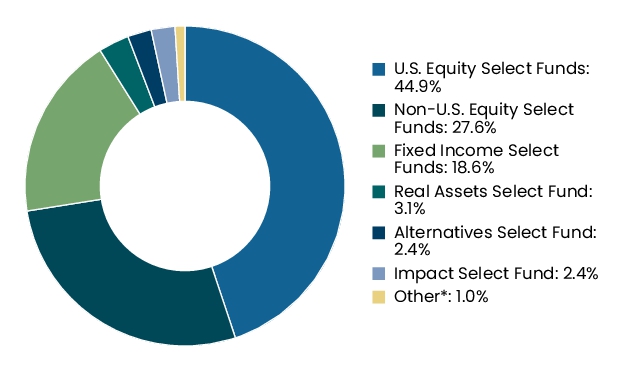
The table below shows the investment makeup of the Fund, representing percentage of the total exposure of the Fund.
ASSET TYPE ALLOCATION

Fund Expenses for the Last Six Months
(Based on a hypothetical $10,000 investment)
| Fund (Class) | Cost of $10,000 Investment1 | Cost of $10,000 investment as a percentage1 |
| MyDestination 2055 Fund (Investor Class/GMGZX) |
$21 | 0.40% |
|
1
|
Reflects applicable expense reimbursements and fee waivers.
|
Key Fund Statistics
The following table outlines key fund statistics that you should pay attention to.
| Fund Net Assets | $963,193,705 |
| Total number of portfolio holdings | 9 |
| Portfolio turnover rate for the period | 2% |
Graphical Representation of Holdings
The tables below show the investment makeup of the Fund, representing percentage of the total net assets of the Fund.
TOP TEN HOLDINGS
| GuideStone Equity Index Fund | 50.0% |
| GuideStone International Equity Index Fund | 24.8% |
| GuideStone Emerging Markets Equity Fund | 6.1% |
| GuideStone Small Cap Equity Fund | 6.0% |
| GuideStone Defensive Market Strategies® Fund | 5.0% |
| GuideStone Medium-Duration Bond Fund | 4.1% |
| GuideStone Global Real Estate Securities Fund | 1.9% |
| GuideStone Money Market Fund, 4.25% | 1.1% |
| GuideStone Global Bond Fund | 1.0% |
PORTFOLIO SUMMARY

*Includes, if any, short-term investments, derivatives and categories rounding to less than 1%.
TOP TEN HOLDINGS
| GuideStone Equity Index Fund | 50.0% |
| GuideStone International Equity Index Fund | 24.8% |
| GuideStone Emerging Markets Equity Fund | 6.1% |
| GuideStone Small Cap Equity Fund | 6.0% |
| GuideStone Defensive Market Strategies® Fund | 5.0% |
| GuideStone Medium-Duration Bond Fund | 4.1% |
| GuideStone Global Real Estate Securities Fund | 1.9% |
| GuideStone Money Market Fund, 4.25% | 1.1% |
| GuideStone Global Bond Fund | 1.0% |
Fund Expenses for the Last Six Months
(Based on a hypothetical $10,000 investment)
| Fund (Class) | Cost of $10,000 Investment | Cost of $10,000 investment as a percentage |
| Defensive Market Strategies Fund (Institutional Class/GDMYX) |
$32 | 0.64% |
Key Fund Statistics
The following table outlines key fund statistics that you should pay attention to.
| Fund Net Assets | $1,396,719,297 |
| Total number of portfolio holdings | 216 |
| Portfolio turnover rate for the period | 37% |
Graphical Representation of Holdings
The table below shows the investment makeup of the Fund, representing percentage of the total exposure of the Fund.
ASSET TYPE ALLOCATION
Fund Expenses for the Last Six Months
(Based on a hypothetical $10,000 investment)
| Fund (Class) | Cost of $10,000 Investment | Cost of $10,000 investment as a percentage |
| Impact Equity Fund (Institutional Class/GMEYX) |
$45 | 0.84% |
Key Fund Statistics
The following table outlines key fund statistics that you should pay attention to.
| Fund Net Assets | $120,403,899 |
| Total number of portfolio holdings | 7 |
| Portfolio turnover rate for the period | 12% |
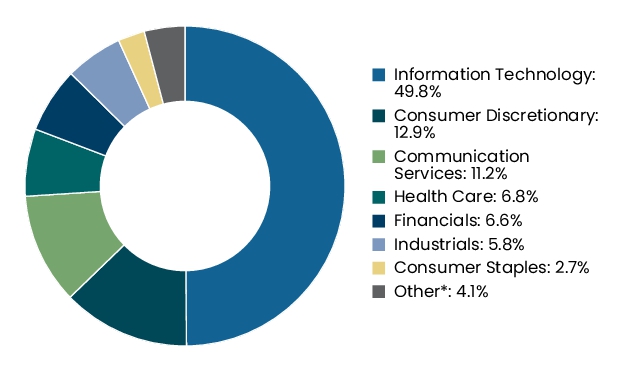
Graphical Representation of Holdings
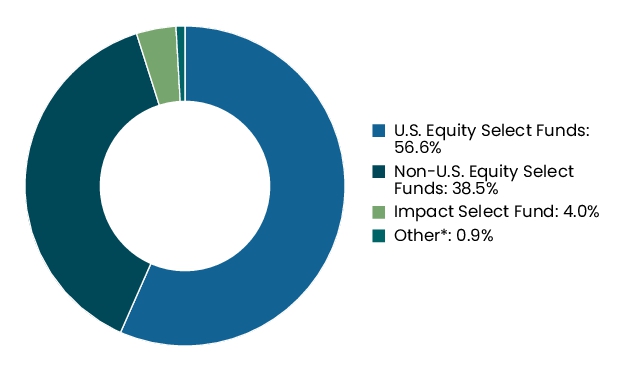
The table below shows the investment makeup of the Fund, representing percentage of the total net assets of the Fund.
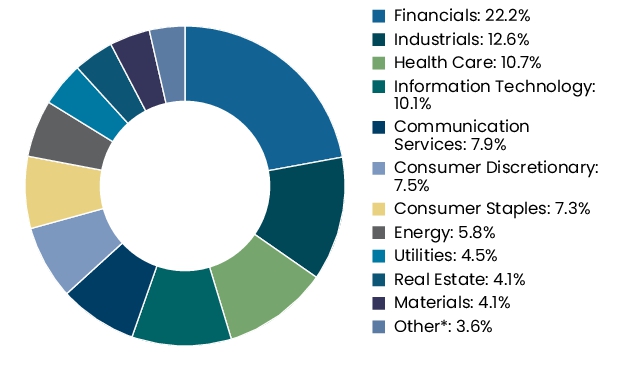
INDUSTRY SECTOR ALLOCATION
*Includes, if any, short-term investments, derivatives and categories rounding to less than 1%.
Fund Expenses for the Last Six Months
(Based on a hypothetical $10,000 investment)
| Fund (Class) | Cost of $10,000 Investment1 | Cost of $10,000 investment as a percentage1 |
| Impact Equity Fund (Investor Class/GMEZX) |
$64 | 1.21% |
|
1
|
Reflects applicable expense reimbursements and fee waivers.
|
Key Fund Statistics
The following table outlines key fund statistics that you should pay attention to.
| Fund Net Assets | $120,403,899 |
| Total number of portfolio holdings | 7 |
| Portfolio turnover rate for the period | 12% |
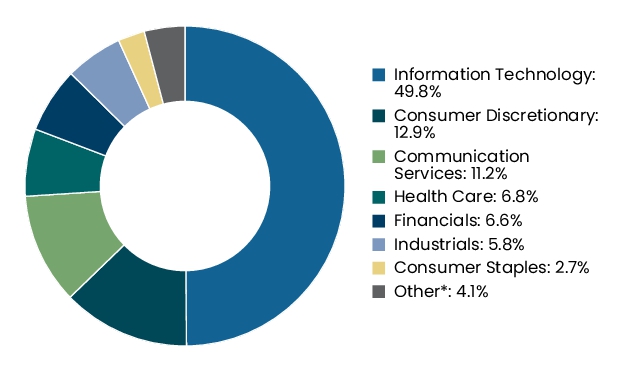
Graphical Representation of Holdings
The table below shows the investment makeup of the Fund, representing percentage of the total net assets of the Fund.
INDUSTRY SECTOR ALLOCATION

*Includes, if any, short-term investments, derivatives and categories rounding to less than 1%.
Fund Expenses for the Last Six Months
(Based on a hypothetical $10,000 investment)
| Fund (Class) | Cost of $10,000 Investment1 | Cost of $10,000 investment as a percentage1 |
| Impact Bond Fund (Investor Class/GMBZX) |
$39 | 0.78% |
|
1
|
Reflects applicable expense reimbursements and fee waivers.
|
Key Fund Statistics
The following table outlines key fund statistics that you should pay attention to.
| Fund Net Assets | $89,587,989 |
| Total number of portfolio holdings | 171 |
| Portfolio turnover rate for the period | 59% |
Graphical Representation of Holdings
The table below shows the investment makeup of the Fund, representing percentage of the total net assets of the Fund.
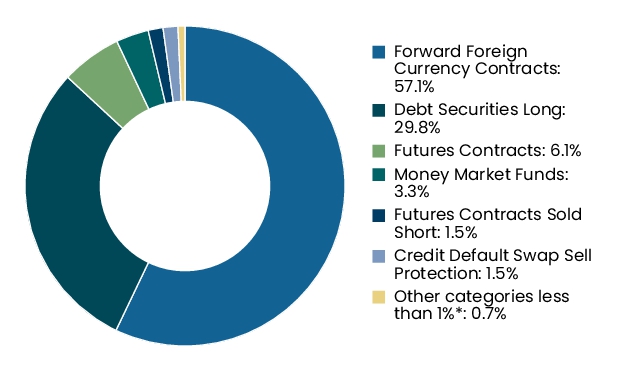
ASSET TYPE ALLOCATION
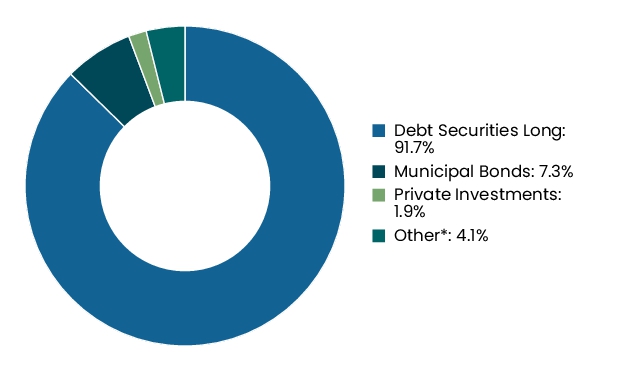
*Includes, if any, short-term investments, derivatives and categories rounding to less than 1%.
Fund Expenses for the Last Six Months
(Based on a hypothetical $10,000 investment)
| Fund (Class) | Cost of $10,000 Investment1 | Cost of $10,000 investment as a percentage1 |
| Impact Bond Fund (Institutional Class/GMBYX) |
$25 | 0.49% |
|
1
|
Reflects applicable expense reimbursements and fee waivers.
|
Key Fund Statistics
The following table outlines key fund statistics that you should pay attention to.
| Fund Net Assets | $89,587,989 |
| Total number of portfolio holdings | 171 |
| Portfolio turnover rate for the period | 59% |
Graphical Representation of Holdings
The table below shows the investment makeup of the Fund, representing percentage of the total net assets of the Fund.
ASSET TYPE ALLOCATION

*Includes, if any, short-term investments, derivatives and categories rounding to less than 1%.
Fund Expenses for the Last Six Months
(Based on a hypothetical $10,000 investment)
| Fund (Class) | Cost of $10,000 Investment1 | Cost of $10,000 investment as a percentage1 |
| Growth Equity Index Fund (Institutional Class/GEIYX) |
$13 | 0.25% |
|
1
|
Reflects applicable expense reimbursements and fee waivers.
|
Key Fund Statistics
The following table outlines key fund statistics that you should pay attention to.
| Fund Net Assets | $323,745,083 |
| Total number of portfolio holdings | 357 |
| Portfolio turnover rate for the period | 15% |
Graphical Representation of Holdings
The table below shows the investment makeup of the Fund, representing percentage of the total net assets of the Fund.
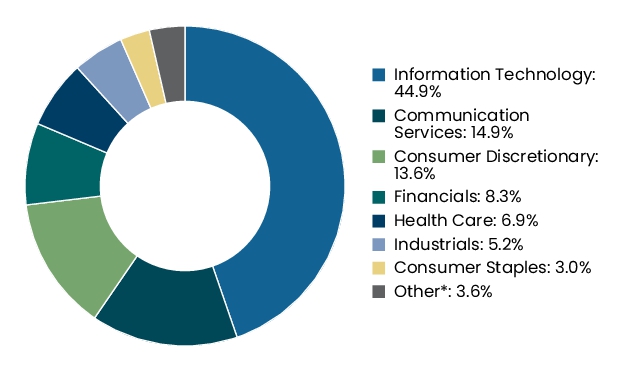
INDUSTRY SECTOR ALLOCATION
*Includes, if any, short-term investments, derivatives and categories rounding to less than 1%.
Fund Expenses for the Last Six Months
(Based on a hypothetical $10,000 investment)
| Fund (Class) | Cost of $10,000 Investment1 | Cost of $10,000 investment as a percentage1 |
| Growth Equity Index Fund (Investor Class/GEIZX) |
$26 | 0.50% |
|
1
|
Reflects applicable expense reimbursements and fee waivers.
|
Key Fund Statistics
The following table outlines key fund statistics that you should pay attention to.
| Fund Net Assets | $323,745,083 |
| Total number of portfolio holdings | 357 |
| Portfolio turnover rate for the period | 15% |
Graphical Representation of Holdings
The table below shows the investment makeup of the Fund, representing percentage of the total net assets of the Fund.
INDUSTRY SECTOR ALLOCATION
*Includes, if any, short-term investments, derivatives and categories rounding to less than 1%.
Fund Expenses for the Last Six Months
(Based on a hypothetical $10,000 investment)
| Fund (Class) | Cost of $10,000 Investment1 | Cost of $10,000 investment as a percentage1 |
| Strategic Alternatives Fund (Institutional Class/GFSYX) |
$67 | 1.34% |
|
1
|
Reflects applicable expense reimbursements and fee waivers.
|
Key Fund Statistics
The following table outlines key fund statistics that you should pay attention to.
| Fund Net Assets | $286,768,663 |
| Total number of portfolio holdings | 649 |
| Portfolio turnover rate for the period | 194% |
Graphical Representation of Holdings
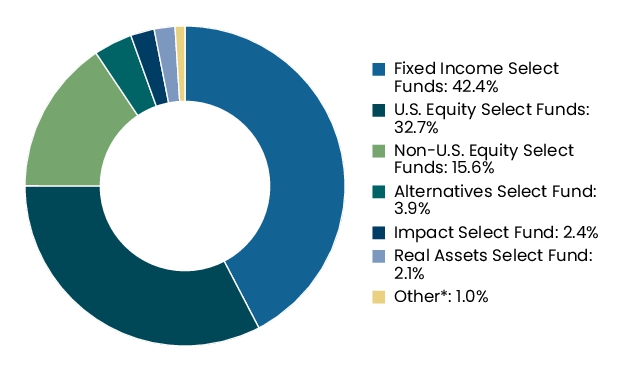
The table below shows the investment makeup of the Fund, representing percentage of the total exposure of the Fund.
ASSET TYPE ALLOCATION

Fund Expenses for the Last Six Months
(Based on a hypothetical $10,000 investment)
| Fund (Class) | Cost of $10,000 Investment1 | Cost of $10,000 investment as a percentage1 |
| Strategic Alternatives Fund (Investor Class/GFSZX) |
$80 | 1.59% |
|
1
|
Reflects applicable expense reimbursements and fee waivers.
|
Key Fund Statistics
The following table outlines key fund statistics that you should pay attention to.
| Fund Net Assets | $286,768,663 |
| Total number of portfolio holdings | 649 |
| Portfolio turnover rate for the period | 194% |
Graphical Representation of Holdings
The table below shows the investment makeup of the Fund, representing percentage of the total exposure of the Fund.
ASSET TYPE ALLOCATION
Fund Expenses for the Last Six Months
(Based on a hypothetical $10,000 investment)
| Fund (Class) | Cost of $10,000 Investment1 | Cost of $10,000 investment as a percentage1 |
| Value Equity Index Fund (Institutional Class/GVIYX) |
$13 | 0.25% |
|
1
|
Reflects applicable expense reimbursements and fee waivers.
|
Key Fund Statistics
The following table outlines key fund statistics that you should pay attention to.
| Fund Net Assets | $207,794,820 |
| Total number of portfolio holdings | 816 |
| Portfolio turnover rate for the period | 17% |
Graphical Representation of Holdings
The table below shows the investment makeup of the Fund, representing percentage of the total net assets of the Fund.
INDUSTRY SECTOR ALLOCATION
*Includes, if any, short-term investments, derivatives and categories rounding to less than 1%.
Fund Expenses for the Last Six Months
(Based on a hypothetical $10,000 investment)
| Fund (Class) | Cost of $10,000 Investment1 | Cost of $10,000 investment as a percentage1 |
| Value Equity Index Fund (Investor Class/GVIZX) |
$25 | 0.50% |
|
1
|
Reflects applicable expense reimbursements and fee waivers.
|
Key Fund Statistics
The following table outlines key fund statistics that you should pay attention to.
| Fund Net Assets | $207,794,820 |
| Total number of portfolio holdings | 816 |
| Portfolio turnover rate for the period | 17% |
Graphical Representation of Holdings
The table below shows the investment makeup of the Fund, representing percentage of the total net assets of the Fund.
INDUSTRY SECTOR ALLOCATION

*Includes, if any, short-term investments, derivatives and categories rounding to less than 1%.
Fund Expenses for the Last Six Months
(Based on a hypothetical $10,000 investment)
| Fund (Class) | Cost of $10,000 Investment | Cost of $10,000 investment as a percentage |
| Global Bond Fund (Investor Class/GGBFX) |
$48 | 0.95% |
Key Fund Statistics
The following table outlines key fund statistics that you should pay attention to.
| Fund Net Assets | $632,741,348 |
| Total number of portfolio holdings | 1,505 |
| Portfolio turnover rate for the period | 35% |
Graphical Representation of Holdings
The table below shows the investment makeup of the Fund, representing percentage of the total exposure of the Fund.
ASSET TYPE ALLOCATION
*Includes, if any, short-term investments, derivatives and categories rounding to less than 1%.
Fund Expenses for the Last Six Months
(Based on a hypothetical $10,000 investment)
| Fund (Class) | Cost of $10,000 Investment | Cost of $10,000 investment as a percentage |
| Global Real Estate Securities Fund (Institutional Class/GREYX) |
$45 | 0.88% |
Key Fund Statistics
The following table outlines key fund statistics that you should pay attention to.
| Fund Net Assets | $306,925,105 |
| Total number of portfolio holdings | 154 |
| Portfolio turnover rate for the period | 72% |
Graphical Representation of Holdings
The tables below show the investment makeup of the Fund, representing percentage of the total net assets of the Fund.
INDUSTRY SECTOR ALLOCATION
| Real Estate | 94.8% |
| Health Care | 1.5% |
| Information Technology | 0.2% |
| Consumer Discretionary | 0.3% |
| Other* | 5.0% |
| 101.8% |
GEOGRAPHIC ALLOCATION

*Includes, as applicable, short-term investments, derivatives and countries and/or categories rounding to less than 1%.
Fund Expenses for the Last Six Months
(Based on a hypothetical $10,000 investment)
| Fund (Class) | Cost of $10,000 Investment | Cost of $10,000 investment as a percentage |
| Global Real Estate Securities Fund (Investor Class/GREZX) |
$61 | 1.20% |
Key Fund Statistics
The following table outlines key fund statistics that you should pay attention to.
| Fund Net Assets | $306,925,105 |
| Total number of portfolio holdings | 154 |
| Portfolio turnover rate for the period | 72% |
Graphical Representation of Holdings
The tables below show the investment makeup of the Fund, representing percentage of the total net assets of the Fund.
INDUSTRY SECTOR ALLOCATION
| Real Estate | 94.8% |
| Health Care | 1.5% |
| Information Technology | 0.2% |
| Consumer Discretionary | 0.3% |
| Other* | 5.0% |
| 101.8% |
GEOGRAPHIC ALLOCATION
*Includes, as applicable, short-term investments, derivatives and countries and/or categories rounding to less than 1%.
Fund Expenses for the Last Six Months
(Based on a hypothetical $10,000 investment)
| Fund (Class) | Cost of $10,000 Investment | Cost of $10,000 investment as a percentage |
| Global Bond Fund (Institutional Class/GGBEX) |
$32 | 0.63% |
Key Fund Statistics
The following table outlines key fund statistics that you should pay attention to.
| Fund Net Assets | $632,741,348 |
| Total number of portfolio holdings | 1,505 |
| Portfolio turnover rate for the period | 35% |
Graphical Representation of Holdings
The table below shows the investment makeup of the Fund, representing percentage of the total exposure of the Fund.
ASSET TYPE ALLOCATION

*Includes, if any, short-term investments, derivatives and categories rounding to less than 1%.
Fund Expenses for the Last Six Months
(Based on a hypothetical $10,000 investment)
| Fund (Class) | Cost of $10,000 Investment1 | Cost of $10,000 investment as a percentage1 |
| MyDestination 2045 Fund (Institutional Class/GMYYX) |
$6 | 0.12% |
|
1
|
Reflects applicable expense reimbursements and fee waivers.
|
Key Fund Statistics
The following table outlines key fund statistics that you should pay attention to.
| Fund Net Assets | $1,826,216,758 |
| Total number of portfolio holdings | 9 |
| Portfolio turnover rate for the period | 3% |
Graphical Representation of Holdings
The tables below show the investment makeup of the Fund, representing percentage of the total net assets of the Fund.
TOP TEN HOLDINGS
| GuideStone Equity Index Fund | 46.4% |
| GuideStone International Equity Index Fund | 22.8% |
| GuideStone Medium-Duration Bond Fund | 9.4% |
| GuideStone Emerging Markets Equity Fund | 5.6% |
| GuideStone Small Cap Equity Fund | 5.5% |
| GuideStone Defensive Market Strategies® Fund | 5.3% |
| GuideStone Global Bond Fund | 2.3% |
| GuideStone Global Real Estate Securities Fund | 1.7% |
| GuideStone Money Market Fund, 4.25% | 1.1% |
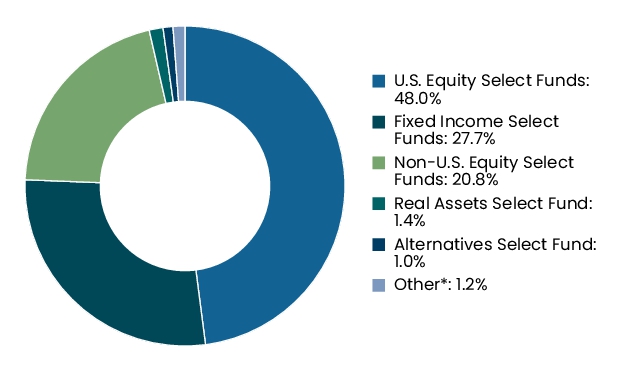
PORTFOLIO SUMMARY
*Includes, if any, short-term investments, derivatives and categories rounding to less than 1%.
TOP TEN HOLDINGS
| GuideStone Equity Index Fund | 46.4% |
| GuideStone International Equity Index Fund | 22.8% |
| GuideStone Medium-Duration Bond Fund | 9.4% |
| GuideStone Emerging Markets Equity Fund | 5.6% |
| GuideStone Small Cap Equity Fund | 5.5% |
| GuideStone Defensive Market Strategies® Fund | 5.3% |
| GuideStone Global Bond Fund | 2.3% |
| GuideStone Global Real Estate Securities Fund | 1.7% |
| GuideStone Money Market Fund, 4.25% | 1.1% |
Fund Expenses for the Last Six Months
(Based on a hypothetical $10,000 investment)
| Fund (Class) | Cost of $10,000 Investment1 | Cost of $10,000 investment as a percentage1 |
| MyDestination 2045 Fund (Investor Class/GMFZX) |
$20 | 0.38% |
|
1
|
Reflects applicable expense reimbursements and fee waivers.
|
Key Fund Statistics
The following table outlines key fund statistics that you should pay attention to.
| Fund Net Assets | $1,826,216,758 |
| Total number of portfolio holdings | 9 |
| Portfolio turnover rate for the period | 3% |
Graphical Representation of Holdings
The tables below show the investment makeup of the Fund, representing percentage of the total net assets of the Fund.
TOP TEN HOLDINGS
| GuideStone Equity Index Fund | 46.4% |
| GuideStone International Equity Index Fund | 22.8% |
| GuideStone Medium-Duration Bond Fund | 9.4% |
| GuideStone Emerging Markets Equity Fund | 5.6% |
| GuideStone Small Cap Equity Fund | 5.5% |
| GuideStone Defensive Market Strategies® Fund | 5.3% |
| GuideStone Global Bond Fund | 2.3% |
| GuideStone Global Real Estate Securities Fund | 1.7% |
| GuideStone Money Market Fund, 4.25% | 1.1% |
PORTFOLIO SUMMARY

*Includes, if any, short-term investments, derivatives and categories rounding to less than 1%.
TOP TEN HOLDINGS
| GuideStone Equity Index Fund | 46.4% |
| GuideStone International Equity Index Fund | 22.8% |
| GuideStone Medium-Duration Bond Fund | 9.4% |
| GuideStone Emerging Markets Equity Fund | 5.6% |
| GuideStone Small Cap Equity Fund | 5.5% |
| GuideStone Defensive Market Strategies® Fund | 5.3% |
| GuideStone Global Bond Fund | 2.3% |
| GuideStone Global Real Estate Securities Fund | 1.7% |
| GuideStone Money Market Fund, 4.25% | 1.1% |
Fund Expenses for the Last Six Months
(Based on a hypothetical $10,000 investment)
| Fund (Class) | Cost of $10,000 Investment1 | Cost of $10,000 investment as a percentage1 |
| MyDestination 2035 Fund (Institutional Class/GMHYX) |
$4 | 0.08% |
|
1
|
Reflects applicable expense reimbursements and fee waivers.
|
Key Fund Statistics
The following table outlines key fund statistics that you should pay attention to.
| Fund Net Assets | $2,157,348,591 |
| Total number of portfolio holdings | 33 |
| Portfolio turnover rate for the period | 6% |
Graphical Representation of Holdings
The tables below show the investment makeup of the Fund, representing percentage of the total net assets of the Fund.
TOP TEN HOLDINGS
| GuideStone Equity Index Fund | 33.5% |
| GuideStone Medium-Duration Bond Fund | 22.3% |
| GuideStone International Equity Index Fund | 16.7% |
| GuideStone Defensive Market Strategies® Fund | 10.6% |
| GuideStone Global Bond Fund | 5.3% |
| GuideStone Emerging Markets Equity Fund | 4.1% |
| GuideStone Small Cap Equity Fund | 3.9% |
| GuideStone Global Real Estate Securities Fund | 1.4% |
| GuideStone Strategic Alternatives Fund | 1.0% |
| GuideStone Money Market Fund, 4.25% | 1.0% |
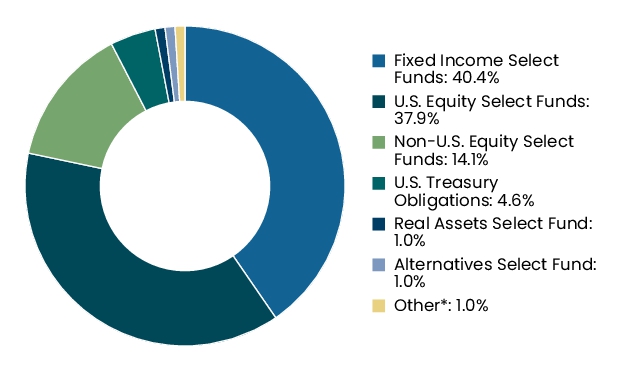
PORTFOLIO SUMMARY
*Includes, if any, short-term investments, derivatives and categories rounding to less than 1%.
TOP TEN HOLDINGS
| GuideStone Equity Index Fund | 33.5% |
| GuideStone Medium-Duration Bond Fund | 22.3% |
| GuideStone International Equity Index Fund | 16.7% |
| GuideStone Defensive Market Strategies® Fund | 10.6% |
| GuideStone Global Bond Fund | 5.3% |
| GuideStone Emerging Markets Equity Fund | 4.1% |
| GuideStone Small Cap Equity Fund | 3.9% |
| GuideStone Global Real Estate Securities Fund | 1.4% |
| GuideStone Strategic Alternatives Fund | 1.0% |
| GuideStone Money Market Fund, 4.25% | 1.0% |
Fund Expenses for the Last Six Months
(Based on a hypothetical $10,000 investment)
| Fund (Class) | Cost of $10,000 Investment1 | Cost of $10,000 investment as a percentage1 |
| MyDestination 2035 Fund (Investor Class/GMHZX) |
$19 | 0.37% |
|
1
|
Reflects applicable expense reimbursements and fee waivers.
|
Key Fund Statistics
The following table outlines key fund statistics that you should pay attention to.
| Fund Net Assets | $2,157,348,591 |
| Total number of portfolio holdings | 33 |
| Portfolio turnover rate for the period | 6% |
Graphical Representation of Holdings
The tables below show the investment makeup of the Fund, representing percentage of the total net assets of the Fund.
TOP TEN HOLDINGS
| GuideStone Equity Index Fund | 33.5% |
| GuideStone Medium-Duration Bond Fund | 22.3% |
| GuideStone International Equity Index Fund | 16.7% |
| GuideStone Defensive Market Strategies® Fund | 10.6% |
| GuideStone Global Bond Fund | 5.3% |
| GuideStone Emerging Markets Equity Fund | 4.1% |
| GuideStone Small Cap Equity Fund | 3.9% |
| GuideStone Global Real Estate Securities Fund | 1.4% |
| GuideStone Strategic Alternatives Fund | 1.0% |
| GuideStone Money Market Fund, 4.25% | 1.0% |
PORTFOLIO SUMMARY

*Includes, if any, short-term investments, derivatives and categories rounding to less than 1%.
TOP TEN HOLDINGS
| GuideStone Equity Index Fund | 33.5% |
| GuideStone Medium-Duration Bond Fund | 22.3% |
| GuideStone International Equity Index Fund | 16.7% |
| GuideStone Defensive Market Strategies® Fund | 10.6% |
| GuideStone Global Bond Fund | 5.3% |
| GuideStone Emerging Markets Equity Fund | 4.1% |
| GuideStone Small Cap Equity Fund | 3.9% |
| GuideStone Global Real Estate Securities Fund | 1.4% |
| GuideStone Strategic Alternatives Fund | 1.0% |
| GuideStone Money Market Fund, 4.25% | 1.0% |
Fund Expenses for the Last Six Months
(Based on a hypothetical $10,000 investment)
| Fund (Class) | Cost of $10,000 Investment1 | Cost of $10,000 investment as a percentage1 |
| MyDestination 2025 Fund (Institutional Class/GMWYX) |
$4 | 0.07% |
|
1
|
Reflects applicable expense reimbursements and fee waivers.
|
Key Fund Statistics
The following table outlines key fund statistics that you should pay attention to.
| Fund Net Assets | $2,008,002,397 |
| Total number of portfolio holdings | 33 |
| Portfolio turnover rate for the period | 9% |
Graphical Representation of Holdings
The tables below show the investment makeup of the Fund, representing percentage of the total net assets of the Fund.
TOP TEN HOLDINGS
| GuideStone Medium-Duration Bond Fund | 30.7% |
| GuideStone Equity Index Fund | 22.4% |
| GuideStone Defensive Market Strategies® Fund | 13.0% |
| GuideStone International Equity Index Fund | 11.4% |
| GuideStone Global Bond Fund | 5.3% |
| GuideStone Low-Duration Bond Fund | 4.4% |
| GuideStone Emerging Markets Equity Fund | 2.7% |
| GuideStone Small Cap Equity Fund | 2.5% |
| GuideStone Global Real Estate Securities Fund | 1.0% |
| GuideStone Strategic Alternatives Fund | 1.0% |
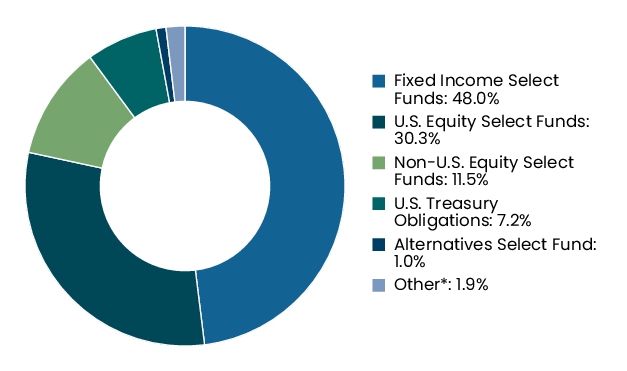
PORTFOLIO SUMMARY

*Includes, if any, short-term investments, derivatives and categories rounding to less than 1%.
TOP TEN HOLDINGS
| GuideStone Medium-Duration Bond Fund | 30.7% |
| GuideStone Equity Index Fund | 22.4% |
| GuideStone Defensive Market Strategies® Fund | 13.0% |
| GuideStone International Equity Index Fund | 11.4% |
| GuideStone Global Bond Fund | 5.3% |
| GuideStone Low-Duration Bond Fund | 4.4% |
| GuideStone Emerging Markets Equity Fund | 2.7% |
| GuideStone Small Cap Equity Fund | 2.5% |
| GuideStone Global Real Estate Securities Fund | 1.0% |
| GuideStone Strategic Alternatives Fund | 1.0% |
Fund Expenses for the Last Six Months
(Based on a hypothetical $10,000 investment)
| Fund (Class) | Cost of $10,000 Investment1 | Cost of $10,000 investment as a percentage1 |
| MyDestination 2025 Fund (Investor Class/GMWZX) |
$19 | 0.37% |
|
1
|
Reflects applicable expense reimbursements and fee waivers.
|
Key Fund Statistics
The following table outlines key fund statistics that you should pay attention to.
| Fund Net Assets | $2,008,002,397 |
| Total number of portfolio holdings | 33 |
| Portfolio turnover rate for the period | 9% |
Graphical Representation of Holdings
The tables below show the investment makeup of the Fund, representing percentage of the total net assets of the Fund.
TOP TEN HOLDINGS
| GuideStone Medium-Duration Bond Fund | 30.7% |
| GuideStone Equity Index Fund | 22.4% |
| GuideStone Defensive Market Strategies® Fund | 13.0% |
| GuideStone International Equity Index Fund | 11.4% |
| GuideStone Global Bond Fund | 5.3% |
| GuideStone Low-Duration Bond Fund | 4.4% |
| GuideStone Emerging Markets Equity Fund | 2.7% |
| GuideStone Small Cap Equity Fund | 2.5% |
| GuideStone Global Real Estate Securities Fund | 1.0% |
| GuideStone Strategic Alternatives Fund | 1.0% |
PORTFOLIO SUMMARY
*Includes, if any, short-term investments, derivatives and categories rounding to less than 1%.
TOP TEN HOLDINGS
| GuideStone Medium-Duration Bond Fund | 30.7% |
| GuideStone Equity Index Fund | 22.4% |
| GuideStone Defensive Market Strategies® Fund | 13.0% |
| GuideStone International Equity Index Fund | 11.4% |
| GuideStone Global Bond Fund | 5.3% |
| GuideStone Low-Duration Bond Fund | 4.4% |
| GuideStone Emerging Markets Equity Fund | 2.7% |
| GuideStone Small Cap Equity Fund | 2.5% |
| GuideStone Global Real Estate Securities Fund | 1.0% |
| GuideStone Strategic Alternatives Fund | 1.0% |
Fund Expenses for the Last Six Months
(Based on a hypothetical $10,000 investment)
| Fund (Class) | Cost of $10,000 Investment1 | Cost of $10,000 investment as a percentage1 |
| MyDestination 2015 Fund (Institutional Class/GMTYX) |
$4 | 0.08% |
|
1
|
Reflects applicable expense reimbursements and fee waivers.
|
Key Fund Statistics
The following table outlines key fund statistics that you should pay attention to.
| Fund Net Assets | $716,306,091 |
| Total number of portfolio holdings | 33 |
| Portfolio turnover rate for the period | 8% |
Graphical Representation of Holdings
The tables below show the investment makeup of the Fund, representing percentage of the total net assets of the Fund.
TOP TEN HOLDINGS
| GuideStone Medium-Duration Bond Fund | 32.6% |
| GuideStone Equity Index Fund | 17.9% |
| GuideStone Defensive Market Strategies® Fund | 10.4% |
| GuideStone Low-Duration Bond Fund | 9.9% |
| GuideStone International Equity Index Fund | 9.3% |
| GuideStone Global Bond Fund | 5.5% |
| GuideStone Emerging Markets Equity Fund | 2.2% |
| GuideStone Small Cap Equity Fund | 2.0% |
| U.S. Treasury Inflationary Index Bonds 3.88%, 4/15/29 | 1.4% |
| GuideStone Money Market Fund, 4.25% | 1.1% |
PORTFOLIO SUMMARY

*Includes, if any, short-term investments, derivatives and categories rounding to less than 1%.
TOP TEN HOLDINGS
| GuideStone Medium-Duration Bond Fund | 32.6% |
| GuideStone Equity Index Fund | 17.9% |
| GuideStone Defensive Market Strategies® Fund | 10.4% |
| GuideStone Low-Duration Bond Fund | 9.9% |
| GuideStone International Equity Index Fund | 9.3% |
| GuideStone Global Bond Fund | 5.5% |
| GuideStone Emerging Markets Equity Fund | 2.2% |
| GuideStone Small Cap Equity Fund | 2.0% |
| U.S. Treasury Inflationary Index Bonds 3.88%, 4/15/29 | 1.4% |
| GuideStone Money Market Fund, 4.25% | 1.1% |
Fund Expenses for the Last Six Months
(Based on a hypothetical $10,000 investment)
| Fund (Class) | Cost of $10,000 Investment1 | Cost of $10,000 investment as a percentage1 |
| MyDestination 2015 Fund (Investor Class/GMTZX) |
$19 | 0.38% |
|
1
|
Reflects applicable expense reimbursements and fee waivers.
|
Key Fund Statistics
The following table outlines key fund statistics that you should pay attention to.
| Fund Net Assets | $716,306,091 |
| Total number of portfolio holdings | 33 |
| Portfolio turnover rate for the period | 8% |
Graphical Representation of Holdings
The tables below show the investment makeup of the Fund, representing percentage of the total net assets of the Fund.
TOP TEN HOLDINGS
| GuideStone Medium-Duration Bond Fund | 32.6% |
| GuideStone Equity Index Fund | 17.9% |
| GuideStone Defensive Market Strategies® Fund | 10.4% |
| GuideStone Low-Duration Bond Fund | 9.9% |
| GuideStone International Equity Index Fund | 9.3% |
| GuideStone Global Bond Fund | 5.5% |
| GuideStone Emerging Markets Equity Fund | 2.2% |
| GuideStone Small Cap Equity Fund | 2.0% |
| U.S. Treasury Inflationary Index Bonds 3.88%, 4/15/29 | 1.4% |
| GuideStone Money Market Fund, 4.25% | 1.1% |
PORTFOLIO SUMMARY
*Includes, if any, short-term investments, derivatives and categories rounding to less than 1%.
TOP TEN HOLDINGS
| GuideStone Medium-Duration Bond Fund | 32.6% |
| GuideStone Equity Index Fund | 17.9% |
| GuideStone Defensive Market Strategies® Fund | 10.4% |
| GuideStone Low-Duration Bond Fund | 9.9% |
| GuideStone International Equity Index Fund | 9.3% |
| GuideStone Global Bond Fund | 5.5% |
| GuideStone Emerging Markets Equity Fund | 2.2% |
| GuideStone Small Cap Equity Fund | 2.0% |
| U.S. Treasury Inflationary Index Bonds 3.88%, 4/15/29 | 1.4% |
| GuideStone Money Market Fund, 4.25% | 1.1% |
Fund Expenses for the Last Six Months
(Based on a hypothetical $10,000 investment)
| Fund (Class) | Cost of $10,000 Investment | Cost of $10,000 investment as a percentage |
| Balanced Allocation Fund (Investor Class/GGIZX) |
$20 | 0.39% |
Key Fund Statistics
The following table outlines key fund statistics that you should pay attention to.
| Fund Net Assets | $1,304,227,409 |
| Total number of portfolio holdings | 16 |
| Portfolio turnover rate for the period | 8% |
Graphical Representation of Holdings
The tables below show the investment makeup of the Fund, representing percentage of the total net assets of the Fund.
TOP TEN HOLDINGS
| GuideStone Medium-Duration Bond Fund | 29.3% |
| GuideStone International Equity Fund | 11.0% |
| GuideStone Defensive Market Strategies® Fund | 10.3% |
| GuideStone Growth Equity Fund | 7.7% |
| GuideStone Global Bond Fund | 7.7% |
| GuideStone Value Equity Fund | 7.7% |
| GuideStone Emerging Markets Equity Fund | 4.6% |
| GuideStone Strategic Alternatives Fund | 3.9% |
| GuideStone Low-Duration Bond Fund | 3.8% |
| GuideStone Growth Equity Index Fund | 2.6% |
PORTFOLIO SUMMARY

*Includes, if any, short-term investments, derivatives and categories rounding to less than 1%.
TOP TEN HOLDINGS
| GuideStone Medium-Duration Bond Fund | 29.3% |
| GuideStone International Equity Fund | 11.0% |
| GuideStone Defensive Market Strategies® Fund | 10.3% |
| GuideStone Growth Equity Fund | 7.7% |
| GuideStone Global Bond Fund | 7.7% |
| GuideStone Value Equity Fund | 7.7% |
| GuideStone Emerging Markets Equity Fund | 4.6% |
| GuideStone Strategic Alternatives Fund | 3.9% |
| GuideStone Low-Duration Bond Fund | 3.8% |
| GuideStone Growth Equity Index Fund | 2.6% |
Fund Expenses for the Last Six Months
(Based on a hypothetical $10,000 investment)
| Fund (Class) | Cost of $10,000 Investment | Cost of $10,000 investment as a percentage |
| Moderately Aggressive Allocation Fund (Institutional Class/GGRYX) |
$7 | 0.14% |
Key Fund Statistics
The following table outlines key fund statistics that you should pay attention to.
| Fund Net Assets | $1,122,400,837 |
| Total number of portfolio holdings | 16 |
| Portfolio turnover rate for the period | 8% |
Graphical Representation of Holdings
The tables below show the investment makeup of the Fund, representing percentage of the total net assets of the Fund.
TOP TEN HOLDINGS
| GuideStone International Equity Fund | 19.4% |
| GuideStone Growth Equity Fund | 13.9% |
| GuideStone Value Equity Fund | 13.8% |
| GuideStone Medium-Duration Bond Fund | 12.3% |
| GuideStone Emerging Markets Equity Fund | 8.2% |
| GuideStone Growth Equity Index Fund | 4.6% |
| GuideStone Defensive Market Strategies® Fund | 4.6% |
| GuideStone Value Equity Index Fund | 4.6% |
| GuideStone Small Cap Equity Fund | 3.4% |
| GuideStone Global Bond Fund | 3.1% |
PORTFOLIO SUMMARY

*Includes, if any, short-term investments, derivatives and categories rounding to less than 1%.
TOP TEN HOLDINGS
| GuideStone International Equity Fund | 19.4% |
| GuideStone Growth Equity Fund | 13.9% |
| GuideStone Value Equity Fund | 13.8% |
| GuideStone Medium-Duration Bond Fund | 12.3% |
| GuideStone Emerging Markets Equity Fund | 8.2% |
| GuideStone Growth Equity Index Fund | 4.6% |
| GuideStone Defensive Market Strategies® Fund | 4.6% |
| GuideStone Value Equity Index Fund | 4.6% |
| GuideStone Small Cap Equity Fund | 3.4% |
| GuideStone Global Bond Fund | 3.1% |
Fund Expenses for the Last Six Months
(Based on a hypothetical $10,000 investment)
| Fund (Class) | Cost of $10,000 Investment | Cost of $10,000 investment as a percentage |
| Moderately Aggressive Allocation Fund (Investor Class/GCOZX) |
$20 | 0.39% |
Key Fund Statistics
The following table outlines key fund statistics that you should pay attention to.
| Fund Net Assets | $1,122,400,837 |
| Total number of portfolio holdings | 16 |
| Portfolio turnover rate for the period | 8% |
Graphical Representation of Holdings
The tables below show the investment makeup of the Fund, representing percentage of the total net assets of the Fund.
TOP TEN HOLDINGS
| GuideStone International Equity Fund | 19.4% |
| GuideStone Growth Equity Fund | 13.9% |
| GuideStone Value Equity Fund | 13.8% |
| GuideStone Medium-Duration Bond Fund | 12.3% |
| GuideStone Emerging Markets Equity Fund | 8.2% |
| GuideStone Growth Equity Index Fund | 4.6% |
| GuideStone Defensive Market Strategies® Fund | 4.6% |
| GuideStone Value Equity Index Fund | 4.6% |
| GuideStone Small Cap Equity Fund | 3.4% |
| GuideStone Global Bond Fund | 3.1% |
PORTFOLIO SUMMARY
*Includes, if any, short-term investments, derivatives and categories rounding to less than 1%.
TOP TEN HOLDINGS
| GuideStone International Equity Fund | 19.4% |
| GuideStone Growth Equity Fund | 13.9% |
| GuideStone Value Equity Fund | 13.8% |
| GuideStone Medium-Duration Bond Fund | 12.3% |
| GuideStone Emerging Markets Equity Fund | 8.2% |
| GuideStone Growth Equity Index Fund | 4.6% |
| GuideStone Defensive Market Strategies® Fund | 4.6% |
| GuideStone Value Equity Index Fund | 4.6% |
| GuideStone Small Cap Equity Fund | 3.4% |
| GuideStone Global Bond Fund | 3.1% |
Fund Expenses for the Last Six Months
(Based on a hypothetical $10,000 investment)
| Fund (Class) | Cost of $10,000 Investment | Cost of $10,000 investment as a percentage |
| Balanced Allocation Fund (Institutional Class/GBAYX) |
$7 | 0.13% |
Key Fund Statistics
The following table outlines key fund statistics that you should pay attention to.
| Fund Net Assets | $1,304,227,409 |
| Total number of portfolio holdings | 16 |
| Portfolio turnover rate for the period | 8% |
Graphical Representation of Holdings
The tables below show the investment makeup of the Fund, representing percentage of the total net assets of the Fund.
TOP TEN HOLDINGS
| GuideStone Medium-Duration Bond Fund | 29.3% |
| GuideStone International Equity Fund | 11.0% |
| GuideStone Defensive Market Strategies® Fund | 10.3% |
| GuideStone Growth Equity Fund | 7.7% |
| GuideStone Global Bond Fund | 7.7% |
| GuideStone Value Equity Fund | 7.7% |
| GuideStone Emerging Markets Equity Fund | 4.6% |
| GuideStone Strategic Alternatives Fund | 3.9% |
| GuideStone Low-Duration Bond Fund | 3.8% |
| GuideStone Growth Equity Index Fund | 2.6% |
PORTFOLIO SUMMARY
*Includes, if any, short-term investments, derivatives and categories rounding to less than 1%.
TOP TEN HOLDINGS
| GuideStone Medium-Duration Bond Fund | 29.3% |
| GuideStone International Equity Fund | 11.0% |
| GuideStone Defensive Market Strategies® Fund | 10.3% |
| GuideStone Growth Equity Fund | 7.7% |
| GuideStone Global Bond Fund | 7.7% |
| GuideStone Value Equity Fund | 7.7% |
| GuideStone Emerging Markets Equity Fund | 4.6% |
| GuideStone Strategic Alternatives Fund | 3.9% |
| GuideStone Low-Duration Bond Fund | 3.8% |
| GuideStone Growth Equity Index Fund | 2.6% |
Fund Expenses for the Last Six Months
(Based on a hypothetical $10,000 investment)
| Fund (Class) | Cost of $10,000 Investment | Cost of $10,000 investment as a percentage |
| Money Market Fund (Investor Class/GMZXX) |
$21 | 0.41% |
Key Fund Statistics
The following table outlines key fund statistics that you should pay attention to.
| Fund Net Assets | $2,123,586,618 |
| Total number of portfolio holdings | 109 |
Graphical Representation of Holdings
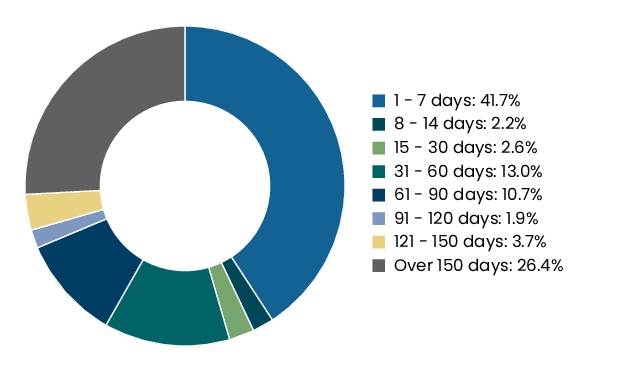
The table below shows the investment makeup of the Fund, representing percentage of the total net assets of the Fund.
MATURITY TABLE
Fund Expenses for the Last Six Months
(Based on a hypothetical $10,000 investment)
| Fund (Class) | Cost of $10,000 Investment | Cost of $10,000 investment as a percentage |
| Money Market Fund (Institutional Class/GMYXX) |
$7 | 0.14% |
Key Fund Statistics
The following table outlines key fund statistics that you should pay attention to.
| Fund Net Assets | $2,123,586,618 |
| Total number of portfolio holdings | 109 |
Graphical Representation of Holdings
The table below shows the investment makeup of the Fund, representing percentage of the total net assets of the Fund.
MATURITY TABLE

Fund Expenses for the Last Six Months
(Based on a hypothetical $10,000 investment)
| Fund (Class) | Cost of $10,000 Investment | Cost of $10,000 investment as a percentage |
| Aggressive Allocation Fund (Investor Class/GGBZX) |
$20 | 0.39% |
Key Fund Statistics
The following table outlines key fund statistics that you should pay attention to.
| Fund Net Assets | $1,149,457,162 |
| Total number of portfolio holdings | 9 |
| Portfolio turnover rate for the period | 7% |
Graphical Representation of Holdings
The tables below show the investment makeup of the Fund, representing percentage of the total net assets of the Fund.
TOP TEN HOLDINGS
| GuideStone International Equity Fund | 27.1% |
| GuideStone Growth Equity Fund | 19.5% |
| GuideStone Value Equity Fund | 19.3% |
| GuideStone Emerging Markets Equity Fund | 11.4% |
| GuideStone Growth Equity Index Fund | 6.5% |
| GuideStone Value Equity Index Fund | 6.4% |
| GuideStone Small Cap Equity Fund | 4.9% |
| GuideStone Impact Equity Fund | 4.0% |
| GuideStone Money Market Fund, 4.25% | 0.9% |
PORTFOLIO SUMMARY

*Includes, if any, short-term investments, derivatives and categories rounding to less than 1%.
TOP TEN HOLDINGS
| GuideStone International Equity Fund | 27.1% |
| GuideStone Growth Equity Fund | 19.5% |
| GuideStone Value Equity Fund | 19.3% |
| GuideStone Emerging Markets Equity Fund | 11.4% |
| GuideStone Growth Equity Index Fund | 6.5% |
| GuideStone Value Equity Index Fund | 6.4% |
| GuideStone Small Cap Equity Fund | 4.9% |
| GuideStone Impact Equity Fund | 4.0% |
| GuideStone Money Market Fund, 4.25% | 0.9% |
Fund Expenses for the Last Six Months
(Based on a hypothetical $10,000 investment)
| Fund (Class) | Cost of $10,000 Investment | Cost of $10,000 investment as a percentage |
| Aggressive Allocation Fund (Institutional Class/GAGYX) |
$7 | 0.14% |
Key Fund Statistics
The following table outlines key fund statistics that you should pay attention to.
| Fund Net Assets | $1,149,457,162 |
| Total number of portfolio holdings | 9 |
| Portfolio turnover rate for the period | 7% |
Graphical Representation of Holdings
The tables below show the investment makeup of the Fund, representing percentage of the total net assets of the Fund.
TOP TEN HOLDINGS
| GuideStone International Equity Fund | 27.1% |
| GuideStone Growth Equity Fund | 19.5% |
| GuideStone Value Equity Fund | 19.3% |
| GuideStone Emerging Markets Equity Fund | 11.4% |
| GuideStone Growth Equity Index Fund | 6.5% |
| GuideStone Value Equity Index Fund | 6.4% |
| GuideStone Small Cap Equity Fund | 4.9% |
| GuideStone Impact Equity Fund | 4.0% |
| GuideStone Money Market Fund, 4.25% | 0.9% |
PORTFOLIO SUMMARY
*Includes, if any, short-term investments, derivatives and categories rounding to less than 1%.
TOP TEN HOLDINGS
| GuideStone International Equity Fund | 27.1% |
| GuideStone Growth Equity Fund | 19.5% |
| GuideStone Value Equity Fund | 19.3% |
| GuideStone Emerging Markets Equity Fund | 11.4% |
| GuideStone Growth Equity Index Fund | 6.5% |
| GuideStone Value Equity Index Fund | 6.4% |
| GuideStone Small Cap Equity Fund | 4.9% |
| GuideStone Impact Equity Fund | 4.0% |
| GuideStone Money Market Fund, 4.25% | 0.9% |
Fund Expenses for the Last Six Months
(Based on a hypothetical $10,000 investment)
| Fund (Class) | Cost of $10,000 Investment | Cost of $10,000 investment as a percentage |
| Small Cap Equity Fund (Institutional Class/GSCYX) |
$45 | 0.92% |
Key Fund Statistics
The following table outlines key fund statistics that you should pay attention to.
| Fund Net Assets | $843,566,934 |
| Total number of portfolio holdings | 720 |
| Portfolio turnover rate for the period | 43% |
Graphical Representation of Holdings
The table below shows the investment makeup of the Fund, representing percentage of the total net assets of the Fund.
INDUSTRY SECTOR ALLOCATION
*Includes, if any, short-term investments, derivatives and categories rounding to less than 1%.
Fund Expenses for the Last Six Months
(Based on a hypothetical $10,000 investment)
| Fund (Class) | Cost of $10,000 Investment | Cost of $10,000 investment as a percentage |
| Small Cap Equity Fund (Investor Class/GSCZX) |
$59 | 1.20% |
Key Fund Statistics
The following table outlines key fund statistics that you should pay attention to.
| Fund Net Assets | $843,566,934 |
| Total number of portfolio holdings | 720 |
| Portfolio turnover rate for the period | 43% |
Graphical Representation of Holdings
The table below shows the investment makeup of the Fund, representing percentage of the total net assets of the Fund.
INDUSTRY SECTOR ALLOCATION

*Includes, if any, short-term investments, derivatives and categories rounding to less than 1%.
Fund Expenses for the Last Six Months
(Based on a hypothetical $10,000 investment)
| Fund (Class) | Cost of $10,000 Investment | Cost of $10,000 investment as a percentage |
| International Equity Fund (Institutional Class/GIEYX) |
$46 | 0.85% |
Key Fund Statistics
The following table outlines key fund statistics that you should pay attention to.
| Fund Net Assets | $1,442,220,040 |
| Total number of portfolio holdings | 452 |
| Portfolio turnover rate for the period | 28% |
Graphical Representation of Holdings
The tables below show the investment makeup of the Fund, representing percentage of the total net assets of the Fund.
INDUSTRY SECTOR ALLOCATION
| Financials | 23.5% |
| Industrials | 18.7% |
| Consumer Discretionary | 11.2% |
| Information Technology | 10.7% |
| Health Care | 7.5% |
| Consumer Staples | 6.1% |
| Communication Services | 4.9% |
| Materials | 4.3% |
| Energy | 2.4% |
| Utilities | 1.9% |
| Real Estate | 1.1% |
| Other* | 10.2% |
| 102.5% |
GEOGRAPHIC ALLOCATION
*Includes, as applicable, short-term investments, derivatives and countries and/or categories rounding to less than 1%.
Fund Expenses for the Last Six Months
(Based on a hypothetical $10,000 investment)
| Fund (Class) | Cost of $10,000 Investment | Cost of $10,000 investment as a percentage |
| International Equity Fund (Investor Class/GIEZX) |
$61 | 1.12% |
Key Fund Statistics
The following table outlines key fund statistics that you should pay attention to.
| Fund Net Assets | $1,442,220,040 |
| Total number of portfolio holdings | 452 |
| Portfolio turnover rate for the period | 28% |
Graphical Representation of Holdings
The tables below show the investment makeup of the Fund, representing percentage of the total net assets of the Fund.
INDUSTRY SECTOR ALLOCATION
| Financials | 23.5% |
| Industrials | 18.7% |
| Consumer Discretionary | 11.2% |
| Information Technology | 10.7% |
| Health Care | 7.5% |
| Consumer Staples | 6.1% |
| Communication Services | 4.9% |
| Materials | 4.3% |
| Energy | 2.4% |
| Utilities | 1.9% |
| Real Estate | 1.1% |
| Other* | 10.2% |
| 102.5% |
GEOGRAPHIC ALLOCATION

*Includes, as applicable, short-term investments, derivatives and countries and/or categories rounding to less than 1%.
Fund Expenses for the Last Six Months
(Based on a hypothetical $10,000 investment)
| Fund (Class) | Cost of $10,000 Investment | Cost of $10,000 investment as a percentage |
| Value Equity Fund (Institutional Class/GVEYX) |
$32 | 0.64% |
Key Fund Statistics
The following table outlines key fund statistics that you should pay attention to.
| Fund Net Assets | $1,010,273,238 |
| Total number of portfolio holdings | 136 |
| Portfolio turnover rate for the period | 29% |
Graphical Representation of Holdings
The table below shows the investment makeup of the Fund, representing percentage of the total net assets of the Fund.
INDUSTRY SECTOR ALLOCATION
*Includes, if any, short-term investments, derivatives and categories rounding to less than 1%.
Fund Expenses for the Last Six Months
(Based on a hypothetical $10,000 investment)
| Fund (Class) | Cost of $10,000 Investment | Cost of $10,000 investment as a percentage |
| Value Equity Fund (Investor Class/GVEZX) |
$46 | 0.90% |
Key Fund Statistics
The following table outlines key fund statistics that you should pay attention to.
| Fund Net Assets | $1,010,273,238 |
| Total number of portfolio holdings | 136 |
| Portfolio turnover rate for the period | 29% |
Graphical Representation of Holdings
The table below shows the investment makeup of the Fund, representing percentage of the total net assets of the Fund.
INDUSTRY SECTOR ALLOCATION

*Includes, if any, short-term investments, derivatives and categories rounding to less than 1%.
Fund Expenses for the Last Six Months
(Based on a hypothetical $10,000 investment)
| Fund (Class) | Cost of $10,000 Investment | Cost of $10,000 investment as a percentage |
| Growth Equity Fund (Investor Class/GGEZX) |
$46 | 0.91% |
Key Fund Statistics
The following table outlines key fund statistics that you should pay attention to.
| Fund Net Assets | $1,721,710,019 |
| Total number of portfolio holdings | 118 |
| Portfolio turnover rate for the period | 23% |
Graphical Representation of Holdings
The table below shows the investment makeup of the Fund, representing percentage of the total net assets of the Fund.
INDUSTRY SECTOR ALLOCATION

*Includes, if any, short-term investments, derivatives and categories rounding to less than 1%.
Fund Expenses for the Last Six Months
(Based on a hypothetical $10,000 investment)
| Fund (Class) | Cost of $10,000 Investment | Cost of $10,000 investment as a percentage |
| Growth Equity Fund (Institutional Class/GGEYX) |
$33 | 0.65% |
Key Fund Statistics
The following table outlines key fund statistics that you should pay attention to.
| Fund Net Assets | $1,721,710,019 |
| Total number of portfolio holdings | 118 |
| Portfolio turnover rate for the period | 23% |
Graphical Representation of Holdings
The table below shows the investment makeup of the Fund, representing percentage of the total net assets of the Fund.
INDUSTRY SECTOR ALLOCATION
*Includes, if any, short-term investments, derivatives and categories rounding to less than 1%.
Fund Expenses for the Last Six Months
(Based on a hypothetical $10,000 investment)
| Fund (Class) | Cost of $10,000 Investment | Cost of $10,000 investment as a percentage |
| Conservative Allocation Fund (Investor Class/GFIZX) |
$22 | 0.43% |
Key Fund Statistics
The following table outlines key fund statistics that you should pay attention to.
| Fund Net Assets | $412,211,796 |
| Total number of portfolio holdings | 16 |
| Portfolio turnover rate for the period | 27% |
Graphical Representation of Holdings
The tables below show the investment makeup of the Fund, representing percentage of the total net assets of the Fund.
TOP TEN HOLDINGS
| GuideStone Medium-Duration Bond Fund | 32.2% |
| GuideStone Low-Duration Bond Fund | 24.5% |
| GuideStone Defensive Market Strategies® Fund | 7.4% |
| GuideStone International Equity Fund | 6.0% |
| GuideStone Strategic Alternatives Fund | 4.9% |
| GuideStone Growth Equity Fund | 4.0% |
| GuideStone Value Equity Fund | 4.0% |
| GuideStone Impact Bond Fund | 4.0% |
| GuideStone Global Bond Fund | 2.9% |
| GuideStone Emerging Markets Equity Fund | 2.4% |
PORTFOLIO SUMMARY
*Includes, if any, short-term investments, derivatives and categories rounding to less than 1%.
TOP TEN HOLDINGS
| GuideStone Medium-Duration Bond Fund | 32.2% |
| GuideStone Low-Duration Bond Fund | 24.5% |
| GuideStone Defensive Market Strategies® Fund | 7.4% |
| GuideStone International Equity Fund | 6.0% |
| GuideStone Strategic Alternatives Fund | 4.9% |
| GuideStone Growth Equity Fund | 4.0% |
| GuideStone Value Equity Fund | 4.0% |
| GuideStone Impact Bond Fund | 4.0% |
| GuideStone Global Bond Fund | 2.9% |
| GuideStone Emerging Markets Equity Fund | 2.4% |
Fund Expenses for the Last Six Months
(Based on a hypothetical $10,000 investment)
| Fund (Class) | Cost of $10,000 Investment | Cost of $10,000 investment as a percentage |
| Conservative Allocation Fund (Institutional Class/GCAYX) |
$9 | 0.18% |
Key Fund Statistics
The following table outlines key fund statistics that you should pay attention to.
| Fund Net Assets | $412,211,796 |
| Total number of portfolio holdings | 16 |
| Portfolio turnover rate for the period | 27% |
Graphical Representation of Holdings
The tables below show the investment makeup of the Fund, representing percentage of the total net assets of the Fund.
TOP TEN HOLDINGS
| GuideStone Medium-Duration Bond Fund | 32.2% |
| GuideStone Low-Duration Bond Fund | 24.5% |
| GuideStone Defensive Market Strategies® Fund | 7.4% |
| GuideStone International Equity Fund | 6.0% |
| GuideStone Strategic Alternatives Fund | 4.9% |
| GuideStone Growth Equity Fund | 4.0% |
| GuideStone Value Equity Fund | 4.0% |
| GuideStone Impact Bond Fund | 4.0% |
| GuideStone Global Bond Fund | 2.9% |
| GuideStone Emerging Markets Equity Fund | 2.4% |
PORTFOLIO SUMMARY

*Includes, if any, short-term investments, derivatives and categories rounding to less than 1%.
TOP TEN HOLDINGS
| GuideStone Medium-Duration Bond Fund | 32.2% |
| GuideStone Low-Duration Bond Fund | 24.5% |
| GuideStone Defensive Market Strategies® Fund | 7.4% |
| GuideStone International Equity Fund | 6.0% |
| GuideStone Strategic Alternatives Fund | 4.9% |
| GuideStone Growth Equity Fund | 4.0% |
| GuideStone Value Equity Fund | 4.0% |
| GuideStone Impact Bond Fund | 4.0% |
| GuideStone Global Bond Fund | 2.9% |
| GuideStone Emerging Markets Equity Fund | 2.4% |
Fund Expenses for the Last Six Months
(Based on a hypothetical $10,000 investment)
| Fund (Class) | Cost of $10,000 Investment | Cost of $10,000 investment as a percentage |
| Low-Duration Bond Fund (Institutional Class/GLDYX) |
$18 | 0.36% |
Key Fund Statistics
The following table outlines key fund statistics that you should pay attention to.
| Fund Net Assets | $845,919,156 |
| Total number of portfolio holdings | 1,195 |
| Portfolio turnover rate for the period | 109% |
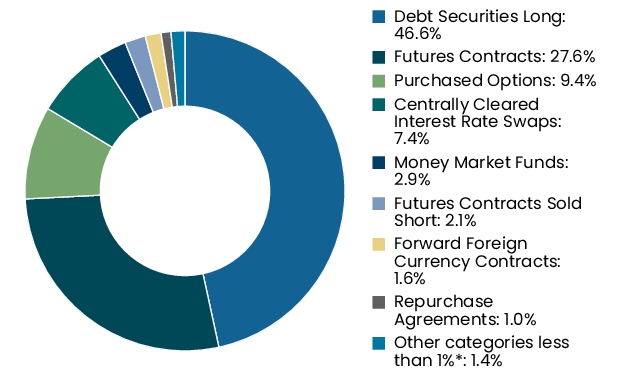
Graphical Representation of Holdings
The table below shows the investment makeup of the Fund, representing percentage of the total exposure of the Fund.
ASSET TYPE ALLOCATION
*Includes, if any, short-term investments, derivatives and categories rounding to less than 1%.
Fund Expenses for the Last Six Months
(Based on a hypothetical $10,000 investment)
| Fund (Class) | Cost of $10,000 Investment | Cost of $10,000 investment as a percentage |
| Low-Duration Bond Fund (Investor Class/GLDZX) |
$33 | 0.65% |
Key Fund Statistics
The following table outlines key fund statistics that you should pay attention to.
| Fund Net Assets | $845,919,156 |
| Total number of portfolio holdings | 1,195 |
| Portfolio turnover rate for the period | 109% |
Graphical Representation of Holdings
The table below shows the investment makeup of the Fund, representing percentage of the total exposure of the Fund.
ASSET TYPE ALLOCATION

*Includes, if any, short-term investments, derivatives and categories rounding to less than 1%.
Fund Expenses for the Last Six Months
(Based on a hypothetical $10,000 investment)
| Fund (Class) | Cost of $10,000 Investment | Cost of $10,000 investment as a percentage |
| Equity Index Fund (Investor Class/GEQZX) |
$19 | 0.38% |
Key Fund Statistics
The following table outlines key fund statistics that you should pay attention to.
| Fund Net Assets | $5,312,706,983 |
| Total number of portfolio holdings | 488 |
| Portfolio turnover rate for the period | 1% |
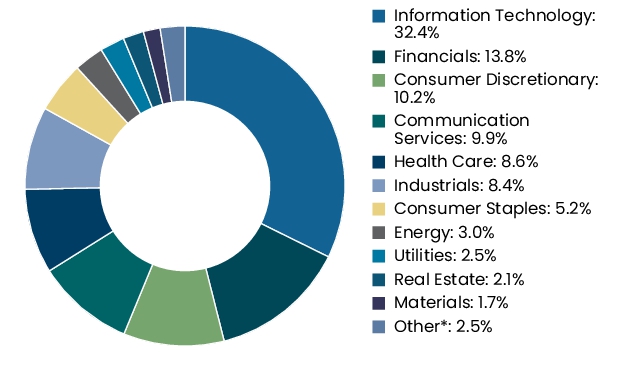
Graphical Representation of Holdings
The table below shows the investment makeup of the Fund, representing percentage of the total net assets of the Fund.
INDUSTRY SECTOR ALLOCATION

*Includes, if any, short-term investments, derivatives and categories rounding to less than 1%.
Fund Expenses for the Last Six Months
(Based on a hypothetical $10,000 investment)
| Fund (Class) | Cost of $10,000 Investment | Cost of $10,000 investment as a percentage |
| Equity Index Fund (Institutional Class/GEQYX) |
$6 | 0.12% |
Key Fund Statistics
The following table outlines key fund statistics that you should pay attention to.
| Fund Net Assets | $5,312,706,983 |
| Total number of portfolio holdings | 488 |
| Portfolio turnover rate for the period | 1% |
Graphical Representation of Holdings
The table below shows the investment makeup of the Fund, representing percentage of the total net assets of the Fund.
INDUSTRY SECTOR ALLOCATION
*Includes, if any, short-term investments, derivatives and categories rounding to less than 1%.
Fund Expenses for the Last Six Months
(Based on a hypothetical $10,000 investment)
| Fund (Class) | Cost of $10,000 Investment | Cost of $10,000 investment as a percentage |
| Medium-Duration Bond Fund (Investor Class/GMDZX) |
$33 | 0.66% |
Key Fund Statistics
The following table outlines key fund statistics that you should pay attention to.
| Fund Net Assets | $3,220,961,065 |
| Total number of portfolio holdings | 2,586 |
| Portfolio turnover rate for the period | 182% |
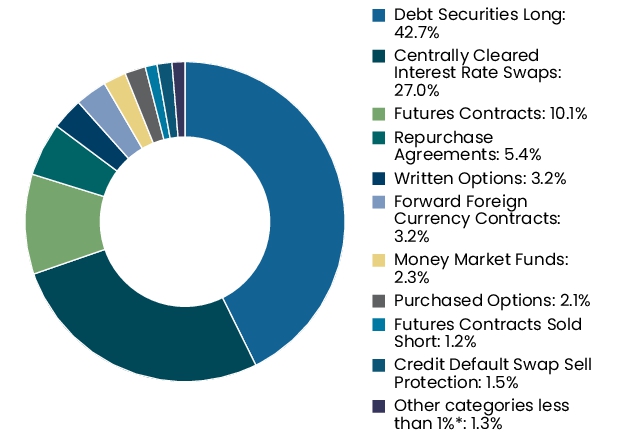
Graphical Representation of Holdings
The table below shows the investment makeup of the Fund, representing percentage of the total exposure of the Fund.
ASSET TYPE ALLOCATION

*Includes, if any, short-term investments, derivatives and categories rounding to less than 1%.
Fund Expenses for the Last Six Months
(Based on a hypothetical $10,000 investment)
| Fund (Class) | Cost of $10,000 Investment | Cost of $10,000 investment as a percentage |
| Medium-Duration Bond Fund (Institutional Class/GMDYX) |
$20 | 0.39% |
Key Fund Statistics
The following table outlines key fund statistics that you should pay attention to.
| Fund Net Assets | $3,220,961,065 |
| Total number of portfolio holdings | 2,586 |
| Portfolio turnover rate for the period | 182% |
Graphical Representation of Holdings
The table below shows the investment makeup of the Fund, representing percentage of the total exposure of the Fund.
ASSET TYPE ALLOCATION
*Includes, if any, short-term investments, derivatives and categories rounding to less than 1%.
| [1] | Reflects applicable expense reimbursements and fee waivers. |
| [2] | Reflects applicable expense reimbursements and fee waivers. |
| [3] | Reflects applicable expense reimbursements and fee waivers. |
| [4] | Reflects applicable expense reimbursements and fee waivers. |
| [5] | Reflects applicable expense reimbursements and fee waivers. |
| [6] | Reflects applicable expense reimbursements and fee waivers. |
| [7] | Reflects applicable expense reimbursements and fee waivers. |
| [8] | Reflects applicable expense reimbursements and fee waivers. |
| [9] | Reflects applicable expense reimbursements and fee waivers. |
| [10] | Reflects applicable expense reimbursements and fee waivers. |
| [11] | Reflects applicable expense reimbursements and fee waivers. |
| [12] | Reflects applicable expense reimbursements and fee waivers. |
| [13] | Reflects applicable expense reimbursements and fee waivers. |
| [14] | Reflects applicable expense reimbursements and fee waivers. |
| [15] | Reflects applicable expense reimbursements and fee waivers. |
| [16] | Reflects applicable expense reimbursements and fee waivers. |
| [17] | Reflects applicable expense reimbursements and fee waivers. |
| [18] | Reflects applicable expense reimbursements and fee waivers. |
| [19] | Reflects applicable expense reimbursements and fee waivers. |
| [20] | Reflects applicable expense reimbursements and fee waivers. |
| [21] | Reflects applicable expense reimbursements and fee waivers. |
| [22] | Reflects applicable expense reimbursements and fee waivers. |