Shareholder Report
Jun. 30, 2025
USD ($)
Holding
Shareholder Report |
6 Months Ended | ||||||||||||||||||||||||||||||
|---|---|---|---|---|---|---|---|---|---|---|---|---|---|---|---|---|---|---|---|---|---|---|---|---|---|---|---|---|---|---|---|
|
Jun. 30, 2025
USD ($)
Holding
| |||||||||||||||||||||||||||||||
| Shareholder Report [Line Items] | |||||||||||||||||||||||||||||||
| Document Type | N-CSRS | ||||||||||||||||||||||||||||||
| Amendment Flag | false | ||||||||||||||||||||||||||||||
| Registrant Name | Natixis ETF Trust | ||||||||||||||||||||||||||||||
| Entity Central Index Key | 0001526787 | ||||||||||||||||||||||||||||||
| Entity Investment Company Type | N-1A | ||||||||||||||||||||||||||||||
| Document Period End Date | Jun. 30, 2025 | ||||||||||||||||||||||||||||||
| C000246657 | |||||||||||||||||||||||||||||||
| Shareholder Report [Line Items] | |||||||||||||||||||||||||||||||
| Fund Name | Natixis Gateway Quality Income ETF | ||||||||||||||||||||||||||||||
| Trading Symbol | GQI | ||||||||||||||||||||||||||||||
| Security Exchange Name | NYSEArca | ||||||||||||||||||||||||||||||
| Annual or Semi-Annual Statement [Text Block] | This semi-annual shareholder report contains important information about Natixis Gateway Quality Income ETF for the period of January 1, 2025 to June 30, 2025. | ||||||||||||||||||||||||||||||
| Shareholder Report Annual or Semi-Annual | Semi-annual Shareholder Report | ||||||||||||||||||||||||||||||
| Additional Information [Text Block] | You can find additional information (including tax information) about the Fund at im.natixis.com/funddocuments. You can also request the information by contacting us at (800) 225-5478 or by contacting your financial intermediary directly. | ||||||||||||||||||||||||||||||
| Additional Information Phone Number | (800) 225-5478 | ||||||||||||||||||||||||||||||
| Additional Information Website | <span style="box-sizing: border-box; color: rgb(0, 0, 0); display: inline; flex-wrap: nowrap; font-size: 12px; font-weight: 400; grid-area: auto; line-height: 18px; margin: 0px; overflow: visible; text-align: left; text-align-last: auto; white-space-collapse: preserve-breaks;">im.natixis.com/funddocuments</span> | ||||||||||||||||||||||||||||||
| Expenses [Text Block] | What were the fund costs for the last six months? (based on a hypothetical $10,000 investment)
|
||||||||||||||||||||||||||||||
| Expenses Paid, Amount | $ 17 | ||||||||||||||||||||||||||||||
| Expense Ratio, Percent | 0.34% | ||||||||||||||||||||||||||||||
| AssetsNet | $ 149,208,562 | ||||||||||||||||||||||||||||||
| Holdings Count | Holding | 85 | ||||||||||||||||||||||||||||||
| Advisory Fees Paid, Amount | $ 95,906 | ||||||||||||||||||||||||||||||
| InvestmentCompanyPortfolioTurnover | 28.00% | ||||||||||||||||||||||||||||||
| Additional Fund Statistics [Text Block] | Key Fund Statistics
|
||||||||||||||||||||||||||||||
| Holdings [Text Block] | Industry Summary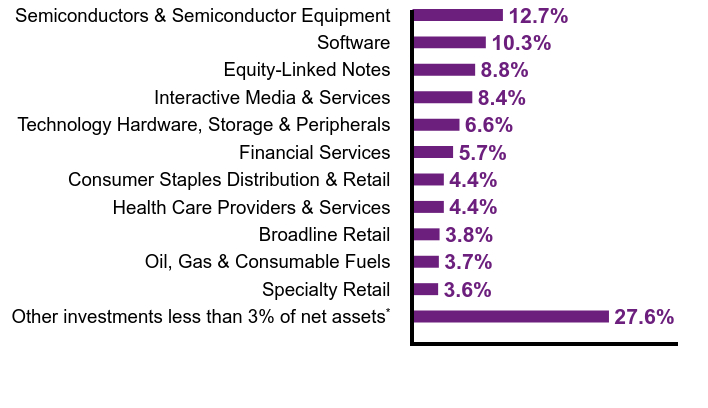
|
||||||||||||||||||||||||||||||
| Largest Holdings [Text Block] | Top Ten Holdings
|
||||||||||||||||||||||||||||||
| Material Fund Change [Text Block] | Material Fund ChangesThere were no material fund changes during the period. |
| X | ||||||||||
- Definition Boolean flag that is true when the XBRL content amends previously-filed or accepted submission. No definition available.
|
| X | ||||||||||
- Definition For the EDGAR submission types of Form 8-K: the date of the report, the date of the earliest event reported; for the EDGAR submission types of Form N-1A: the filing date; for all other submission types: the end of the reporting or transition period. The format of the date is YYYY-MM-DD. No definition available.
|
| X | ||||||||||
- Definition The type of document being provided (such as 10-K, 10-Q, 485BPOS, etc). The document type is limited to the same value as the supporting SEC submission type, or the word 'Other'. No definition available.
|
| X | ||||||||||
- Definition A unique 10-digit SEC-issued value to identify entities that have filed disclosures with the SEC. It is commonly abbreviated as CIK. Reference 1: http://www.xbrl.org/2003/role/presentationRef
|
| X | ||||||||||
- Definition One of: N-1A (Mutual Fund), N-1 (Open-End Separate Account with No Variable Annuities), N-2 (Closed-End Investment Company), N-3 (Separate Account Registered as Open-End Management Investment Company), N-4 (Variable Annuity UIT Separate Account), N-5 (Small Business Investment Company), N-6 (Variable Life UIT Separate Account), S-1 or S-3 (Face Amount Certificate Company), S-6 (UIT, Non-Insurance Product). Reference 1: http://www.xbrl.org/2003/role/presentationRef
|
| X | ||||||||||
- Definition The exact name of the entity filing the report as specified in its charter, which is required by forms filed with the SEC. Reference 1: http://www.xbrl.org/2003/role/presentationRef
|
| X | ||||||||||
- Definition Name of the Exchange on which a security is registered. Reference 1: http://www.xbrl.org/2003/role/presentationRef
|
| X | ||||||||||
- Definition Trading symbol of an instrument as listed on an exchange. No definition available.
|
| X | ||||||||||
- References Reference 1: http://www.xbrl.org/2003/role/presentationRef
|
| X | ||||||||||
- References Reference 1: http://www.xbrl.org/2003/role/presentationRef
|
| X | ||||||||||
- References Reference 1: http://www.xbrl.org/2003/role/presentationRef
|
| X | ||||||||||
- References Reference 1: http://www.xbrl.org/2003/role/presentationRef
|
| X | ||||||||||
- References Reference 1: http://www.xbrl.org/2003/role/presentationRef
|
| X | ||||||||||
- References Reference 1: http://www.xbrl.org/2003/role/presentationRef
|
| X | ||||||||||
- References Reference 1: http://www.xbrl.org/2003/role/presentationRef
|
| X | ||||||||||
- References Reference 1: http://www.xbrl.org/2003/role/presentationRef
|
| X | ||||||||||
- References Reference 1: http://www.xbrl.org/2003/role/presentationRef
|
| X | ||||||||||
- References Reference 1: http://www.xbrl.org/2003/role/presentationRef
|
| X | ||||||||||
- References Reference 1: http://www.xbrl.org/2003/role/presentationRef
|
| X | ||||||||||
- References Reference 1: http://www.xbrl.org/2003/role/presentationRef
|
| X | ||||||||||
- References Reference 1: http://www.xbrl.org/2003/role/presentationRef
|
| X | ||||||||||
- References Reference 1: http://www.xbrl.org/2003/role/presentationRef
|
| X | ||||||||||
- References Reference 1: http://www.xbrl.org/2003/role/presentationRef
|
| X | ||||||||||
- References Reference 1: http://www.xbrl.org/2003/role/presentationRef
|
| X | ||||||||||
- Definition Amount of net assets (liabilities). Reference 1: http://fasb.org/us-gaap/role/ref/legacyRef
|
| X | ||||||||||
- Definition Percentage of lesser of purchase or sale of portfolio securities to average value of portfolio securities owned. Reference 1: http://www.xbrl.org/2009/role/commonPracticeRef
|
| X | ||||||||||
- Details
|