Shareholder Report
Jun. 30, 2025
USD ($)
Holding
What were the Fund costs for the last year ?
(based on a hypothetical $10,000 investment)
| Class name | Costs of a $10,000 investment |
Costs paid as a percentage of a $10,000 investment |
| $46 | 0.46% |
How did the Fund perform last year ?
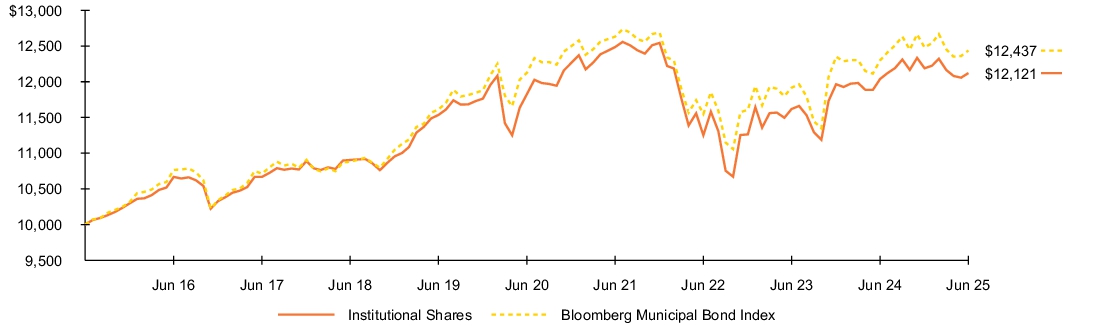
- For the reporting period ended June 30, 2025, the Fund’s Institutional Shares returned 0.68%.
- For the same period, the Fund’s benchmark, the Bloomberg Municipal Bond Index, returned 1.11%.
What contributed to performance?
Income was a key contributor to absolute performance at a time in which the prices of longer-term bonds declined. Holdings in short- to intermediate-term securities provided positive total returns. At the sector level, the largest contributions came from transportation and corporate-backed issues due to their large portfolio weightings, higher yields, and price appreciation for intermediate-term securities in the category. The Fund’s cash position had no material impact on performance.
What detracted from performance?
Longer-maturity, discount bonds and/or securities with longer call features finished with losses due to their higher interest rate sensitivity. In high yield, several holdings in smaller, esoteric loans lost ground. At the sector level, work force housing and charter schools experienced negative absolute returns.
The views expressed reflect the opinions of BlackRock as of the date of this report and are subject to change based on changes in market, economic or other conditions. These views are not intended to be a forecast of future events and are no guarantee of future results.
Fund performance
Cumulative performance: July 1, 2015 through June 30, 2025
Initial investment of $10,000
See “Average annual total returns” for additional information on fund performance.
| Average annual total returns | ||||||
| 1 Year | 5 Years | 10 Years | ||||
| 0.68 | % | 0.49 | % | 1.94 | % | |
| 1.11 | 0.51 | 2.20 |
| Key Fund statistics | |
| $6,048,053,509 | |
| 429 | |
| $25,432,538 | |
| 46% |
What did the Fund invest in?
(as of June 30, 2025)
| Sector allocation | ||
| Sector(a) | Percent of Total Investments(b) |
|
| 27.1 | % | |
| 16.5 | ||
| 15.8 | ||
| 12.2 | ||
| 11.0 | ||
| 5.7 | ||
| 5.3 | ||
| 5.1 | ||
| 1.3 | ||
| Credit quality allocation | ||
| Credit Rating(c) | Percent of Total Investments(b) |
|
| 10.5 | % | |
| 58.0 | ||
| 22.5 | ||
| 3.4 | ||
| 0.6 | ||
| 0.2 | ||
| 4.8 | ||
| For purposes of this report, sector sub-classifications may differ from those utilized by the Fund for compliance purposes. |
| Excludes short-term securities. |
| For purposes of this report, credit quality ratings shown above reflect the highest rating assigned by either S&P Global Ratings or Moody’s Investors Service, Inc. if ratings differ. These rating agencies are independent, nationally recognized statistical rating organizations and are widely used. Investment grade ratings are credit ratings of BBB/Baa or higher. Below investment grade ratings are credit ratings of BB/Ba or lower. Investments designated N/R are not rated by either rating agency. Unrated investments do not necessarily indicate low credit quality. Credit quality ratings are subject to change. |
What were the Fund costs for the last year ?
(based on a hypothetical $10,000 investment)
| Class name | Costs of a $10,000 investment |
Costs paid as a percentage of a $10,000 investment |
| $71 | 0.71% |
How did the Fund perform last year ?
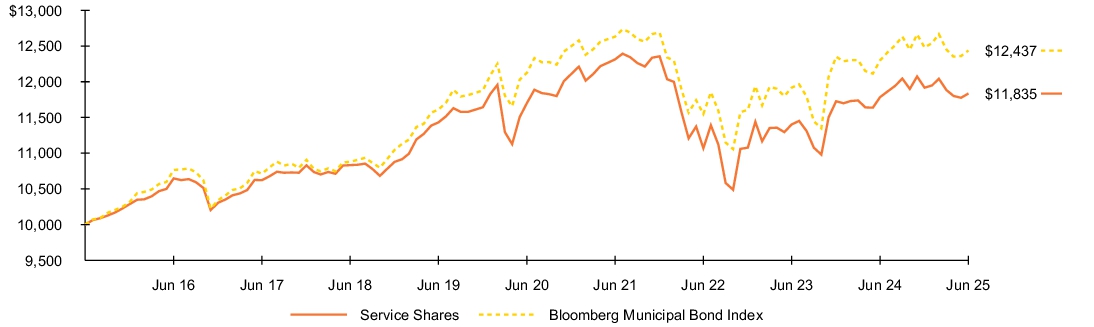
- For the reporting period ended June 30, 2025, the Fund’s Service Shares returned 0.43%.
- For the same period, the Fund’s benchmark, the Bloomberg Municipal Bond Index, returned 1.11%.
What contributed to performance?
Income was a key contributor to absolute performance at a time in which the prices of longer-term bonds declined. Holdings in short- to intermediate-term securities provided positive total returns. At the sector level, the largest contributions came from transportation and corporate-backed issues due to their large portfolio weightings, higher yields, and price appreciation for intermediate-term securities in the category. The Fund’s cash position had no material impact on performance.
What detracted from performance?
Longer-maturity, discount bonds and/or securities with longer call features finished with losses due to their higher interest rate sensitivity. In high yield, several holdings in smaller, esoteric loans lost ground. At the sector level, work force housing and charter schools experienced negative absolute returns.
The views expressed reflect the opinions of BlackRock as of the date of this report and are subject to change based on changes in market, economic or other conditions. These views are not intended to be a forecast of future events and are no guarantee of future results.
Fund performance
Cumulative performance: July 1, 2015 through June 30, 2025
Initial investment of $10,000
See “Average annual total returns” for additional information on fund performance.
| Average annual total returns | ||||||
| 1 Year | 5 Years | 10 Years | ||||
| 0.43 | % | 0.23 | % | 1.70 | % | |
| 1.11 | 0.51 | 2.20 |
| Key Fund statistics | |
| $6,048,053,509 | |
| 429 | |
| $25,432,538 | |
| 46% |
What did the Fund invest in?
(as of June 30, 2025)
| Sector allocation | ||
| Sector(a) | Percent of Total Investments(b) |
|
| 27.1 | % | |
| 16.5 | ||
| 15.8 | ||
| 12.2 | ||
| 11.0 | ||
| 5.7 | ||
| 5.3 | ||
| 5.1 | ||
| 1.3 | ||
| Credit quality allocation | ||
| Credit Rating(c) | Percent of Total Investments(b) |
|
| 10.5 | % | |
| 58.0 | ||
| 22.5 | ||
| 3.4 | ||
| 0.6 | ||
| 0.2 | ||
| 4.8 | ||
| For purposes of this report, sector sub-classifications may differ from those utilized by the Fund for compliance purposes. |
| Excludes short-term securities. |
| For purposes of this report, credit quality ratings shown above reflect the highest rating assigned by either S&P Global Ratings or Moody’s Investors Service, Inc. if ratings differ. These rating agencies are independent, nationally recognized statistical rating organizations and are widely used. Investment grade ratings are credit ratings of BBB/Baa or higher. Below investment grade ratings are credit ratings of BB/Ba or lower. Investments designated N/R are not rated by either rating agency. Unrated investments do not necessarily indicate low credit quality. Credit quality ratings are subject to change. |
What were the Fund costs for the last year ?
(based on a hypothetical $10,000 investment)
| Class name | Costs of a $10,000 investment |
Costs paid as a percentage of a $10,000 investment |
| $71 | 0.71% |
How did the Fund perform last year ?
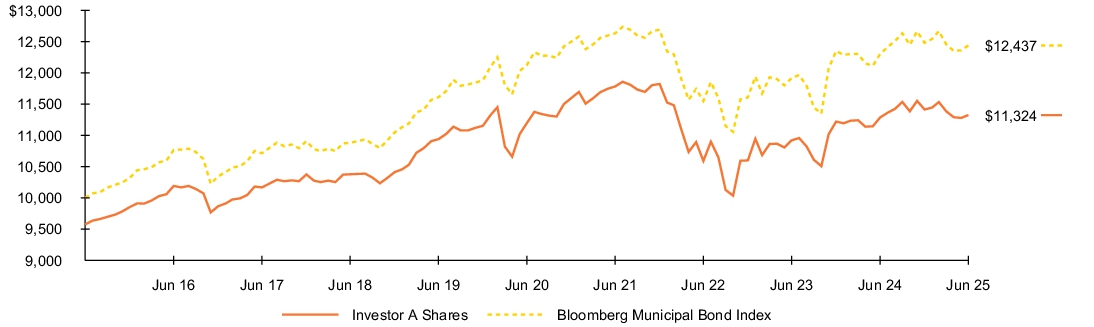
- For the reporting period ended June 30, 2025, the Fund’s Investor A Shares returned 0.33%.
- For the same period, the Fund’s benchmark, the Bloomberg Municipal Bond Index, returned 1.11%.
What contributed to performance?
Income was a key contributor to absolute performance at a time in which the prices of longer-term bonds declined. Holdings in short- to intermediate-term securities provided positive total returns. At the sector level, the largest contributions came from transportation and corporate-backed issues due to their large portfolio weightings, higher yields, and price appreciation for intermediate-term securities in the category. The Fund’s cash position had no material impact on performance.
What detracted from performance?
Longer-maturity, discount bonds and/or securities with longer call features finished with losses due to their higher interest rate sensitivity. In high yield, several holdings in smaller, esoteric loans lost ground. At the sector level, work force housing and charter schools experienced negative absolute returns.
The views expressed reflect the opinions of BlackRock as of the date of this report and are subject to change based on changes in market, economic or other conditions. These views are not intended to be a forecast of future events and are no guarantee of future results.
Fund performance
Cumulative performance: July 1, 2015 through June 30, 2025
Initial investment of $10,000
See “Average annual total returns” for additional information on fund performance.
| Average annual total returns | ||||||
| 1 Year | 5 Years | 10 Years | ||||
| 0.33 | % | 0.23 | % | 1.69 | % | |
| (3.94 | ) | (0.64 | ) | 1.25 | ||
| 1.11 | 0.51 | 2.20 |
| Key Fund statistics | |
| $6,048,053,509 | |
| 429 | |
| $25,432,538 | |
| 46% |
What did the Fund invest in?
(as of June 30, 2025)
| Sector allocation | ||
| Sector(a) | Percent of Total Investments(b) |
|
| 27.1 | % | |
| 16.5 | ||
| 15.8 | ||
| 12.2 | ||
| 11.0 | ||
| 5.7 | ||
| 5.3 | ||
| 5.1 | ||
| 1.3 | ||
| Credit quality allocation | ||
| Credit Rating(c) | Percent of Total Investments(b) |
|
| 10.5 | % | |
| 58.0 | ||
| 22.5 | ||
| 3.4 | ||
| 0.6 | ||
| 0.2 | ||
| 4.8 | ||
| For purposes of this report, sector sub-classifications may differ from those utilized by the Fund for compliance purposes. |
| Excludes short-term securities. |
| For purposes of this report, credit quality ratings shown above reflect the highest rating assigned by either S&P Global Ratings or Moody’s Investors Service, Inc. if ratings differ. These rating agencies are independent, nationally recognized statistical rating organizations and are widely used. Investment grade ratings are credit ratings of BBB/Baa or higher. Below investment grade ratings are credit ratings of BB/Ba or lower. Investments designated N/R are not rated by either rating agency. Unrated investments do not necessarily indicate low credit quality. Credit quality ratings are subject to change. |
What were the Fund costs for the last year ?
(based on a hypothetical $10,000 investment)
| Class name | Costs of a $10,000 investment |
Costs paid as a percentage of a $10,000 investment |
| $146 | 1.46% |
How did the Fund perform last year ?
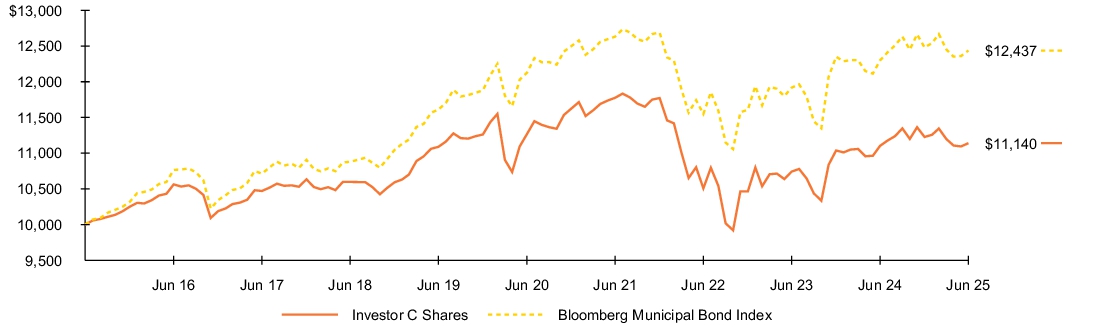
- For the reporting period ended June 30, 2025, the Fund’s Investor C Shares returned (0.42)%.
- For the same period, the Fund’s benchmark, the Bloomberg Municipal Bond Index, returned 1.11%.
What contributed to performance?
Income was a key contributor to absolute performance at a time in which the prices of longer-term bonds declined. Holdings in short- to intermediate-term securities provided positive total returns. At the sector level, the largest contributions came from transportation and corporate-backed issues due to their large portfolio weightings, higher yields, and price appreciation for intermediate-term securities in the category. The Fund’s cash position had no material impact on performance.
What detracted from performance?
Longer-maturity, discount bonds and/or securities with longer call features finished with losses due to their higher interest rate sensitivity. In high yield, several holdings in smaller, esoteric loans lost ground. At the sector level, work force housing and charter schools experienced negative absolute returns.
The views expressed reflect the opinions of BlackRock as of the date of this report and are subject to change based on changes in market, economic or other conditions. These views are not intended to be a forecast of future events and are no guarantee of future results.
Fund performance
Cumulative performance: July 1, 2015 through June 30, 2025
Initial investment of $10,000
See “Average annual total returns” for additional information on fund performance.
| Average annual total returns | ||||||
| 1 Year | 5 Years | 10 Years | ||||
| (0.42 | )% | (0.52 | )% | 1.09 | % | |
| (1.39 | ) | (0.52 | ) | 1.09 | ||
| 1.11 | 0.51 | 2.20 |
| Key Fund statistics | |
| $6,048,053,509 | |
| 429 | |
| $25,432,538 | |
| 46% |
What did the Fund invest in?
(as of June 30, 2025)
| Sector allocation | ||
| Sector(a) | Percent of Total Investments(b) |
|
| 27.1 | % | |
| 16.5 | ||
| 15.8 | ||
| 12.2 | ||
| 11.0 | ||
| 5.7 | ||
| 5.3 | ||
| 5.1 | ||
| 1.3 | ||
| Credit quality allocation | ||
| Credit Rating(c) | Percent of Total Investments(b) |
|
| 10.5 | % | |
| 58.0 | ||
| 22.5 | ||
| 3.4 | ||
| 0.6 | ||
| 0.2 | ||
| 4.8 | ||
| For purposes of this report, sector sub-classifications may differ from those utilized by the Fund for compliance purposes. |
| Excludes short-term securities. |
| For purposes of this report, credit quality ratings shown above reflect the highest rating assigned by either S&P Global Ratings or Moody’s Investors Service, Inc. if ratings differ. These rating agencies are independent, nationally recognized statistical rating organizations and are widely used. Investment grade ratings are credit ratings of BBB/Baa or higher. Below investment grade ratings are credit ratings of BB/Ba or lower. Investments designated N/R are not rated by either rating agency. Unrated investments do not necessarily indicate low credit quality. Credit quality ratings are subject to change. |
What were the Fund costs for the last year ?
(based on a hypothetical $10,000 investment)
| Class name | Costs of a $10,000 investment |
Costs paid as a percentage of a $10,000 investment |
| $41 | 0.41% |
How did the Fund perform last year ?
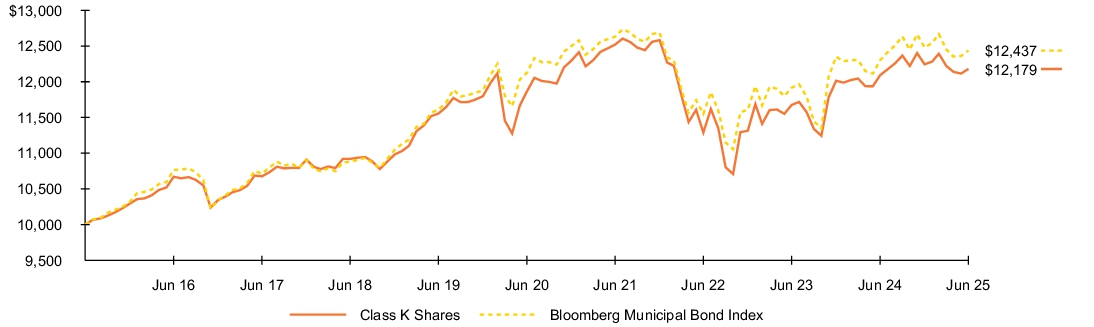
- For the reporting period ended June 30, 2025, the Fund’s Class K Shares returned 0.73%.
- For the same period, the Fund’s benchmark, the Bloomberg Municipal Bond Index, returned 1.11%.
What contributed to performance?
Income was a key contributor to absolute performance at a time in which the prices of longer-term bonds declined. Holdings in short- to intermediate-term securities provided positive total returns. At the sector level, the largest contributions came from transportation and corporate-backed issues due to their large portfolio weightings, higher yields, and price appreciation for intermediate-term securities in the category. The Fund’s cash position had no material impact on performance.
What detracted from performance?
Longer-maturity, discount bonds and/or securities with longer call features finished with losses due to their higher interest rate sensitivity. In high yield, several holdings in smaller, esoteric loans lost ground. At the sector level, work force housing and charter schools experienced negative absolute returns.
The views expressed reflect the opinions of BlackRock as of the date of this report and are subject to change based on changes in market, economic or other conditions. These views are not intended to be a forecast of future events and are no guarantee of future results.
Fund performance
Cumulative performance: July 1, 2015 through June 30, 2025
Initial investment of $10,000
See “Average annual total returns” for additional information on fund performance.
| Average annual total returns | ||||||
| 1 Year | 5 Years | 10 Years | ||||
| 0.73 | % | 0.53 | % | 1.99 | % | |
| 1.11 | 0.51 | 2.20 |
| Key Fund statistics | |
| $6,048,053,509 | |
| 429 | |
| $25,432,538 | |
| 46% |
What did the Fund invest in?
(as of June 30, 2025)
| Sector allocation | ||
| Sector(a) | Percent of Total Investments(b) |
|
| 27.1 | % | |
| 16.5 | ||
| 15.8 | ||
| 12.2 | ||
| 11.0 | ||
| 5.7 | ||
| 5.3 | ||
| 5.1 | ||
| 1.3 | ||
| Credit quality allocation | ||
| Credit Rating(c) | Percent of Total Investments(b) |
|
| 10.5 | % | |
| 58.0 | ||
| 22.5 | ||
| 3.4 | ||
| 0.6 | ||
| 0.2 | ||
| 4.8 | ||
| For purposes of this report, sector sub-classifications may differ from those utilized by the Fund for compliance purposes. |
| Excludes short-term securities. |
| For purposes of this report, credit quality ratings shown above reflect the highest rating assigned by either S&P Global Ratings or Moody’s Investors Service, Inc. if ratings differ. These rating agencies are independent, nationally recognized statistical rating organizations and are widely used. Investment grade ratings are credit ratings of BBB/Baa or higher. Below investment grade ratings are credit ratings of BB/Ba or lower. Investments designated N/R are not rated by either rating agency. Unrated investments do not necessarily indicate low credit quality. Credit quality ratings are subject to change. |
This report describes changes to the Fund that occurred during the reporting period.
What were the Fund costs for the last year ?
(based on a hypothetical $10,000 investment)
| Class name | Costs of a $10,000 investment |
Costs paid as a percentage of a $10,000 investment |
| $37 | 0.36% |
How did the Fund perform last year ?
- For the reporting period ended June 30, 2025, the Fund’s Institutional Shares returned 4.02%.
- For the same period, the Fund’s benchmark, the Bloomberg Municipal Bond Index, returned 1.11% and the Municipal 1-5 Year Bond Index, returned 4.01%.
What contributed to performance?
Income was the largest contributor to the Fund’s absolute return. Positions in lower-quality bonds, which benefited from both higher income and spread compression—particularly for shorter-maturity issues—also contributed. At the sector level, holdings in corporate-backed issues, which includes prepaid gas bonds, were the most notable contributors. The Fund tactically shifted its duration stance during the period, which further helped results. (Duration is a measure of interest rate sensitivity.) The Fund’s cash position had no material impact on performance.
What detracted from performance?
Holdings in bonds with seven to 10-year maturities were the primary detractors from absolute performance.
The views expressed reflect the opinions of BlackRock as of the date of this report and are subject to change based on changes in market, economic or other conditions. These views are not intended to be a forecast of future events and are no guarantee of future results.
Fund performance
Cumulative performance: July 1, 2015 through June 30, 2025
Initial investment of $10,000

See “Average annual total returns” for additional information on fund performance.
| Average annual total returns | ||||||
| 1 Year | 5 Years | 10 Years | ||||
| 4.02 | % | 1.51 | % | 1.33 | % | |
| 1.11 | 0.51 | 2.20 | ||||
| 4.01 | 1.16 | 1.55 | ||||
| 3.88 | 1.33 |
| Key Fund statistics | |
| $463,683,419 | |
| 195 | |
| $1,084,115 | |
| 66% |
What did the Fund invest in?
(as of June 30, 2025)
| Sector allocation | ||
| Sector(a) | Percent of Total Investments(b) |
|
| 25.5 | % | |
| 19.7 | ||
| 16.1 | ||
| 12.7 | ||
| 8.5 | ||
| 7.5 | ||
| 7.5 | ||
| 1.9 | ||
| 0.6 | ||
| Credit quality allocation | ||
| Credit Rating(c) | Percent of Total Investments(b) |
|
| 8.9 | % | |
| 35.1 | ||
| 43.3 | ||
| 8.9 | ||
| 0.6 | ||
| 3.2 | ||
| For purposes of this report, sector sub-classifications may differ from those utilized by the Fund for compliance purposes. |
| Excludes short-term securities. |
| For purposes of this report, credit quality ratings shown above reflect the highest rating assigned by either S&P Global Ratings or Moody’s Investors Service, Inc. if ratings differ. These rating agencies are independent, nationally recognized statistical rating organizations and are widely used. Investment grade ratings are credit ratings of BBB/Baa or higher. Below investment grade ratings are credit ratings of BB/Ba or lower. Investments designated N/R are not rated by either rating agency. Unrated investments do not necessarily indicate low credit quality. Credit quality ratings are subject to change. |
Material Fund changes
This is a summary of certain changes to the Fund since June 30, 2024. For more complete information, you may review the Fund’s next prospectus, which we expect to be available approximately 120 days after June 30, 2025 at blackrock.com/fundreports or upon request by contacting us at (800) 441-7762.
On November 22, 2024, the Fund's Board approved a change in the name of the Fund from BlackRock Short-Term Municipal Fund to BlackRock Short Duration Muni Fund and certain changes to the Fund’s investment policy. These changes became effective on February 1, 2025.
On November 22, 2024, the Fund's Board approved a change in the name of the Fund from BlackRock Short-Term Municipal Fund to BlackRock Short Duration Muni Fund and certain changes to the Fund’s investment policy. These changes became effective on February 1, 2025.
This is a summary of certain changes to the Fund since June 30, 2024. For more complete information, you may review the Fund’s next prospectus, which we expect to be available approximately 120 days after June 30, 2025 at blackrock.com/fundreports or upon request by contacting us at (800) 441-7762.
This report describes changes to the Fund that occurred during the reporting period.
What were the Fund costs for the last year ?
(based on a hypothetical $10,000 investment)
| Class name | Costs of a $10,000 investment |
Costs paid as a percentage of a $10,000 investment |
| $61 | 0.60% |
How did the Fund perform last year ?
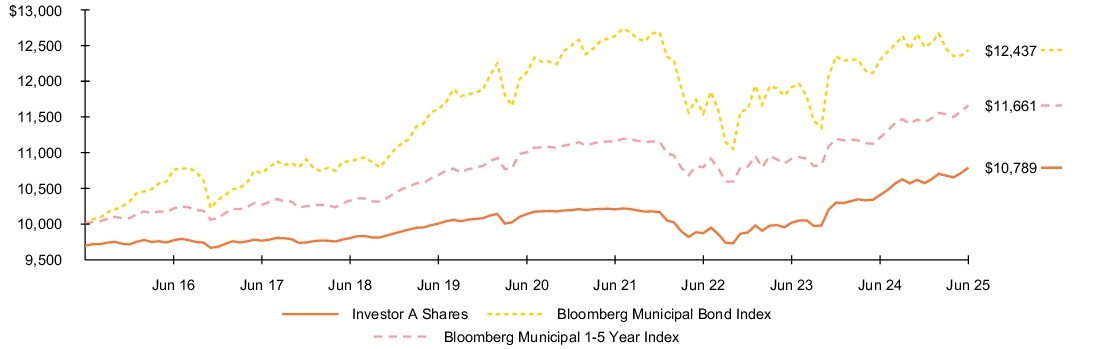
- For the reporting period ended June 30, 2025, the Fund’s Investor A Shares returned 3.66%.
- For the same period, the Fund’s benchmark, the Bloomberg Municipal Bond Index, returned 1.11% and the Municipal 1-5 Year Bond Index, returned 4.01%.
What contributed to performance?
Income was the largest contributor to the Fund’s absolute return. Positions in lower-quality bonds, which benefited from both higher income and spread compression—particularly for shorter-maturity issues—also contributed. At the sector level, holdings in corporate-backed issues, which includes prepaid gas bonds, were the most notable contributors. The Fund tactically shifted its duration stance during the period, which further helped results. (Duration is a measure of interest rate sensitivity.) The Fund’s cash position had no material impact on performance.
What detracted from performance?
Holdings in bonds with seven to 10-year maturities were the primary detractors from absolute performance.
The views expressed reflect the opinions of BlackRock as of the date of this report and are subject to change based on changes in market, economic or other conditions. These views are not intended to be a forecast of future events and are no guarantee of future results.
Fund performance
Cumulative performance: July 1, 2015 through June 30, 2025
Initial investment of $10,000
See “Average annual total returns” for additional information on fund performance.
| Average annual total returns | ||||||
| 1 Year | 5 Years | 10 Years | ||||
| 3.66 | % | 1.25 | % | 1.07 | % | |
| 0.56 | 0.63 | 0.76 | ||||
| 1.11 | 0.51 | 2.20 | ||||
| 4.01 | 1.16 | 1.55 | ||||
| 3.88 | 1.33 |
| Key Fund statistics | |
| $463,683,419 | |
| 195 | |
| $1,084,115 | |
| 66% |
What did the Fund invest in?
(as of June 30, 2025)
| Sector allocation | ||
| Sector(a) | Percent of Total Investments(b) |
|
| 25.5 | % | |
| 19.7 | ||
| 16.1 | ||
| 12.7 | ||
| 8.5 | ||
| 7.5 | ||
| 7.5 | ||
| 1.9 | ||
| 0.6 | ||
| Credit quality allocation | ||
| Credit Rating(c) | Percent of Total Investments(b) |
|
| 8.9 | % | |
| 35.1 | ||
| 43.3 | ||
| 8.9 | ||
| 0.6 | ||
| 3.2 | ||
| For purposes of this report, sector sub-classifications may differ from those utilized by the Fund for compliance purposes. |
| Excludes short-term securities. |
| For purposes of this report, credit quality ratings shown above reflect the highest rating assigned by either S&P Global Ratings or Moody’s Investors Service, Inc. if ratings differ. These rating agencies are independent, nationally recognized statistical rating organizations and are widely used. Investment grade ratings are credit ratings of BBB/Baa or higher. Below investment grade ratings are credit ratings of BB/Ba or lower. Investments designated N/R are not rated by either rating agency. Unrated investments do not necessarily indicate low credit quality. Credit quality ratings are subject to change. |
Material Fund changes
This is a summary of certain changes to the Fund since June 30, 2024. For more complete information, you may review the Fund’s next prospectus, which we expect to be available approximately 120 days after June 30, 2025 at blackrock.com/fundreports or upon request by contacting us at (800) 441-7762.
On November 22, 2024, the Fund's Board approved a change in the name of the Fund from BlackRock Short-Term Municipal Fund to BlackRock Short Duration Muni Fund and certain changes to the Fund’s investment policy. These changes became effective on February 1, 2025.
On November 22, 2024, the Fund's Board approved a change in the name of the Fund from BlackRock Short-Term Municipal Fund to BlackRock Short Duration Muni Fund and certain changes to the Fund’s investment policy. These changes became effective on February 1, 2025.
This is a summary of certain changes to the Fund since June 30, 2024. For more complete information, you may review the Fund’s next prospectus, which we expect to be available approximately 120 days after June 30, 2025 at blackrock.com/fundreports or upon request by contacting us at (800) 441-7762.
This report describes changes to the Fund that occurred during the reporting period.
What were the Fund costs for the last year ?
(based on a hypothetical $10,000 investment)
| Class name | Costs of a $10,000 investment |
Costs paid as a percentage of a $10,000 investment |
| $47 | 0.46% |
How did the Fund perform last year ?
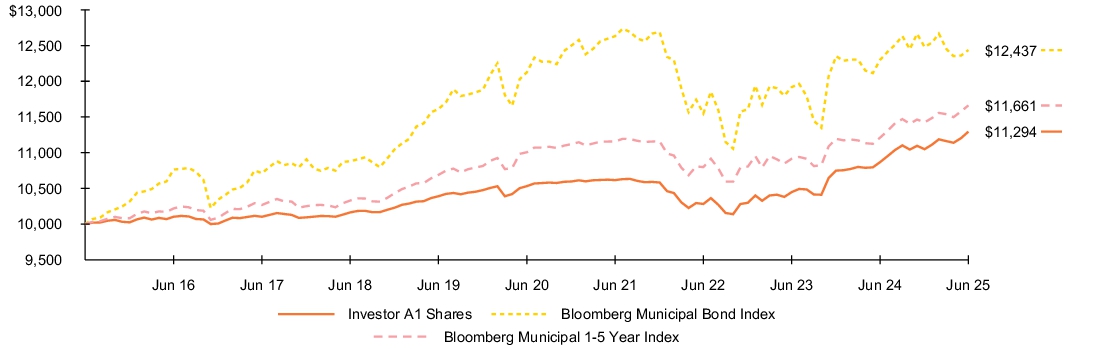
- For the reporting period ended June 30, 2025, the Fund’s Investor A1 Shares returned 3.91%.
- For the same period, the Fund’s benchmark, the Bloomberg Municipal Bond Index, returned 1.11% and the Municipal 1-5 Year Bond Index, returned 4.01%.
What contributed to performance?
Income was the largest contributor to the Fund’s absolute return. Positions in lower-quality bonds, which benefited from both higher income and spread compression—particularly for shorter-maturity issues—also contributed. At the sector level, holdings in corporate-backed issues, which includes prepaid gas bonds, were the most notable contributors. The Fund tactically shifted its duration stance during the period, which further helped results. (Duration is a measure of interest rate sensitivity.) The Fund’s cash position had no material impact on performance.
What detracted from performance?
Holdings in bonds with seven to 10-year maturities were the primary detractors from absolute performance.
The views expressed reflect the opinions of BlackRock as of the date of this report and are subject to change based on changes in market, economic or other conditions. These views are not intended to be a forecast of future events and are no guarantee of future results.
Fund performance
Cumulative performance: July 1, 2015 through June 30, 2025
Initial investment of $10,000
See “Average annual total returns” for additional information on fund performance.
| Average annual total returns | ||||||
| 1 Year | 5 Years | 10 Years | ||||
| 3.91 | % | 1.41 | % | 1.22 | % | |
| 1.11 | 0.51 | 2.20 | ||||
| 4.01 | 1.16 | 1.55 | ||||
| 3.88 | 1.33 |
| Key Fund statistics | |
| $463,683,419 | |
| 195 | |
| $1,084,115 | |
| 66% |
What did the Fund invest in?
(as of June 30, 2025)
| Sector allocation | ||
| Sector(a) | Percent of Total Investments(b) |
|
| 25.5 | % | |
| 19.7 | ||
| 16.1 | ||
| 12.7 | ||
| 8.5 | ||
| 7.5 | ||
| 7.5 | ||
| 1.9 | ||
| 0.6 | ||
| Credit quality allocation | ||
| Credit Rating(c) | Percent of Total Investments(b) |
|
| 8.9 | % | |
| 35.1 | ||
| 43.3 | ||
| 8.9 | ||
| 0.6 | ||
| 3.2 | ||
| For purposes of this report, sector sub-classifications may differ from those utilized by the Fund for compliance purposes. |
| Excludes short-term securities. |
| For purposes of this report, credit quality ratings shown above reflect the highest rating assigned by either S&P Global Ratings or Moody’s Investors Service, Inc. if ratings differ. These rating agencies are independent, nationally recognized statistical rating organizations and are widely used. Investment grade ratings are credit ratings of BBB/Baa or higher. Below investment grade ratings are credit ratings of BB/Ba or lower. Investments designated N/R are not rated by either rating agency. Unrated investments do not necessarily indicate low credit quality. Credit quality ratings are subject to change. |
Material Fund changes
This is a summary of certain changes to the Fund since June 30, 2024. For more complete information, you may review the Fund’s next prospectus, which we expect to be available approximately 120 days after June 30, 2025 at blackrock.com/fundreports or upon request by contacting us at (800) 441-7762.
On November 22, 2024, the Fund's Board approved a change in the name of the Fund from BlackRock Short-Term Municipal Fund to BlackRock Short Duration Muni Fund and certain changes to the Fund’s investment policy. These changes became effective on February 1, 2025.
On November 22, 2024, the Fund's Board approved a change in the name of the Fund from BlackRock Short-Term Municipal Fund to BlackRock Short Duration Muni Fund and certain changes to the Fund’s investment policy. These changes became effective on February 1, 2025.
This is a summary of certain changes to the Fund since June 30, 2024. For more complete information, you may review the Fund’s next prospectus, which we expect to be available approximately 120 days after June 30, 2025 at blackrock.com/fundreports or upon request by contacting us at (800) 441-7762.
This report describes changes to the Fund that occurred during the reporting period.
What were the Fund costs for the last year ?
(based on a hypothetical $10,000 investment)
| Class name | Costs of a $10,000 investment |
Costs paid as a percentage of a $10,000 investment |
| $138 | 1.36% |
How did the Fund perform last year ?
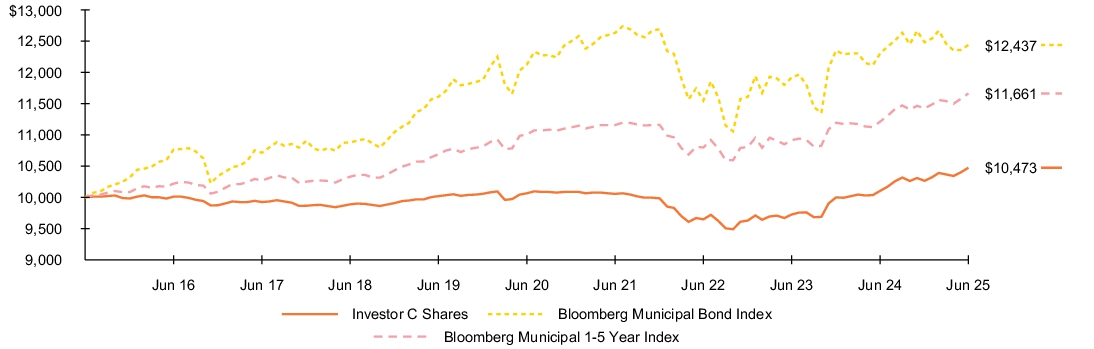
- For the reporting period ended June 30, 2025, the Fund’s Investor C Shares returned 2.90%.
- For the same period, the Fund’s benchmark, the Bloomberg Municipal Bond Index, returned 1.11% and the Municipal 1-5 Year Bond Index, returned 4.01%.
What contributed to performance?
Income was the largest contributor to the Fund’s absolute return. Positions in lower-quality bonds, which benefited from both higher income and spread compression—particularly for shorter-maturity issues—also contributed. At the sector level, holdings in corporate-backed issues, which includes prepaid gas bonds, were the most notable contributors. The Fund tactically shifted its duration stance during the period, which further helped results. (Duration is a measure of interest rate sensitivity.) The Fund’s cash position had no material impact on performance.
What detracted from performance?
Holdings in bonds with seven to 10-year maturities were the primary detractors from absolute performance.
The views expressed reflect the opinions of BlackRock as of the date of this report and are subject to change based on changes in market, economic or other conditions. These views are not intended to be a forecast of future events and are no guarantee of future results.
Fund performance
Cumulative performance: July 1, 2015 through June 30, 2025
Initial investment of $10,000
See “Average annual total returns” for additional information on fund performance.
| Average annual total returns | ||||||
| 1 Year | 5 Years | 10 Years | ||||
| 2.90 | % | 0.48 | % | 0.46 | % | |
| 1.90 | 0.48 | 0.46 | ||||
| 1.11 | 0.51 | 2.20 | ||||
| 4.01 | 1.16 | 1.55 | ||||
| 3.88 | 1.33 |
| Key Fund statistics | |
| $463,683,419 | |
| 195 | |
| $1,084,115 | |
| 66% |
What did the Fund invest in?
(as of June 30, 2025)
| Sector allocation | ||
| Sector(a) | Percent of Total Investments(b) |
|
| 25.5 | % | |
| 19.7 | ||
| 16.1 | ||
| 12.7 | ||
| 8.5 | ||
| 7.5 | ||
| 7.5 | ||
| 1.9 | ||
| 0.6 | ||
| Credit quality allocation | ||
| Credit Rating(c) | Percent of Total Investments(b) |
|
| 8.9 | % | |
| 35.1 | ||
| 43.3 | ||
| 8.9 | ||
| 0.6 | ||
| 3.2 | ||
| For purposes of this report, sector sub-classifications may differ from those utilized by the Fund for compliance purposes. |
| Excludes short-term securities. |
| For purposes of this report, credit quality ratings shown above reflect the highest rating assigned by either S&P Global Ratings or Moody’s Investors Service, Inc. if ratings differ. These rating agencies are independent, nationally recognized statistical rating organizations and are widely used. Investment grade ratings are credit ratings of BBB/Baa or higher. Below investment grade ratings are credit ratings of BB/Ba or lower. Investments designated N/R are not rated by either rating agency. Unrated investments do not necessarily indicate low credit quality. Credit quality ratings are subject to change. |
Material Fund changes
This is a summary of certain changes to the Fund since June 30, 2024. For more complete information, you may review the Fund’s next prospectus, which we expect to be available approximately 120 days after June 30, 2025 at blackrock.com/fundreports or upon request by contacting us at (800) 441-7762.
On November 22, 2024, the Fund's Board approved a change in the name of the Fund from BlackRock Short-Term Municipal Fund to BlackRock Short Duration Muni Fund and certain changes to the Fund’s investment policy. These changes became effective on February 1, 2025.
On November 22, 2024, the Fund's Board approved a change in the name of the Fund from BlackRock Short-Term Municipal Fund to BlackRock Short Duration Muni Fund and certain changes to the Fund’s investment policy. These changes became effective on February 1, 2025.
This is a summary of certain changes to the Fund since June 30, 2024. For more complete information, you may review the Fund’s next prospectus, which we expect to be available approximately 120 days after June 30, 2025 at blackrock.com/fundreports or upon request by contacting us at (800) 441-7762.
This report describes changes to the Fund that occurred during the reporting period.
What were the Fund costs for the last year ?
(based on a hypothetical $10,000 investment)
| Class name | Costs of a $10,000 investment |
Costs paid as a percentage of a $10,000 investment |
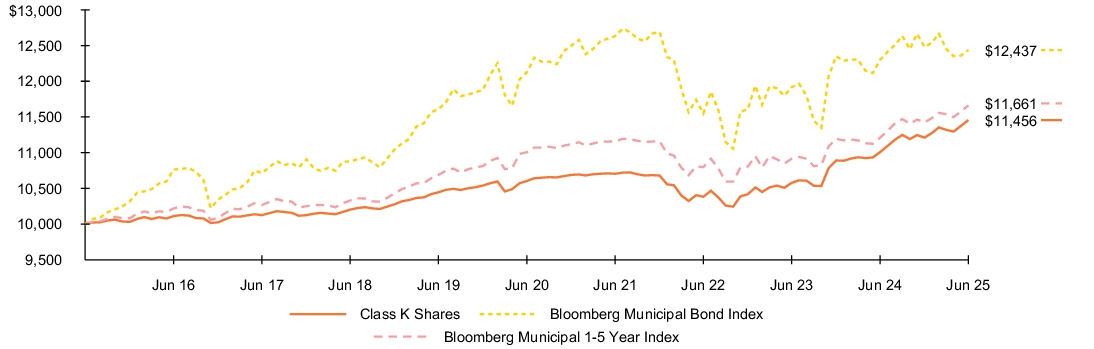
| $32 | 0.31% |
How did the Fund perform last year ?
- For the reporting period ended June 30, 2025, the Fund’s Class K Shares returned 4.07%.
- For the same period, the Fund’s benchmark, the Bloomberg Municipal Bond Index, returned 1.11% and the Municipal 1-5 Year Bond Index, returned 4.01%.
What contributed to performance?
Income was the largest contributor to the Fund’s absolute return. Positions in lower-quality bonds, which benefited from both higher income and spread compression—particularly for shorter-maturity issues—also contributed. At the sector level, holdings in corporate-backed issues, which includes prepaid gas bonds, were the most notable contributors. The Fund tactically shifted its duration stance during the period, which further helped results. (Duration is a measure of interest rate sensitivity.) The Fund’s cash position had no material impact on performance.
What detracted from performance?
Holdings in bonds with seven to 10-year maturities were the primary detractors from absolute performance.
The views expressed reflect the opinions of BlackRock as of the date of this report and are subject to change based on changes in market, economic or other conditions. These views are not intended to be a forecast of future events and are no guarantee of future results.
Fund performance
Cumulative performance: July 1, 2015 through June 30, 2025
Initial investment of $10,000
See “Average annual total returns” for additional information on fund performance.
| Average annual total returns | ||||||
| 1 Year | 5 Years | 10 Years | ||||
| 4.07 | % | 1.56 | % | 1.37 | % | |
| 1.11 | 0.51 | 2.20 | ||||
| 4.01 | 1.16 | 1.55 | ||||
| 3.88 | 1.33 |
| Key Fund statistics | |
| $463,683,419 | |
| 195 | |
| $1,084,115 | |
| 66% |
What did the Fund invest in?
(as of June 30, 2025)
| Sector allocation | ||
| Sector(a) | Percent of Total Investments(b) |
|
| 25.5 | % | |
| 19.7 | ||
| 16.1 | ||
| 12.7 | ||
| 8.5 | ||
| 7.5 | ||
| 7.5 | ||
| 1.9 | ||
| 0.6 | ||
| Credit quality allocation | ||
| Credit Rating(c) | Percent of Total Investments(b) |
|
| 8.9 | % | |
| 35.1 | ||
| 43.3 | ||
| 8.9 | ||
| 0.6 | ||
| 3.2 | ||
| For purposes of this report, sector sub-classifications may differ from those utilized by the Fund for compliance purposes. |
| Excludes short-term securities. |
| For purposes of this report, credit quality ratings shown above reflect the highest rating assigned by either S&P Global Ratings or Moody’s Investors Service, Inc. if ratings differ. These rating agencies are independent, nationally recognized statistical rating organizations and are widely used. Investment grade ratings are credit ratings of BBB/Baa or higher. Below investment grade ratings are credit ratings of BB/Ba or lower. Investments designated N/R are not rated by either rating agency. Unrated investments do not necessarily indicate low credit quality. Credit quality ratings are subject to change. |
Material Fund changes
This is a summary of certain changes to the Fund since June 30, 2024. For more complete information, you may review the Fund’s next prospectus, which we expect to be available approximately 120 days after June 30, 2025 at blackrock.com/fundreports or upon request by contacting us at (800) 441-7762.
On November 22, 2024, the Fund's Board approved a change in the name of the Fund from BlackRock Short-Term Municipal Fund to BlackRock Short Duration Muni Fund and certain changes to the Fund’s investment policy. These changes became effective on February 1, 2025.
On November 22, 2024, the Fund's Board approved a change in the name of the Fund from BlackRock Short-Term Municipal Fund to BlackRock Short Duration Muni Fund and certain changes to the Fund’s investment policy. These changes became effective on February 1, 2025.
This is a summary of certain changes to the Fund since June 30, 2024. For more complete information, you may review the Fund’s next prospectus, which we expect to be available approximately 120 days after June 30, 2025 at blackrock.com/fundreports or upon request by contacting us at (800) 441-7762.