Shareholder Report
Jun. 30, 2025
USD ($)
Holding
Shareholder Report |
12 Months Ended |
|---|---|
|
Jun. 30, 2025
USD ($)
Holding
| |
| Shareholder Report [Line Items] | |
| Document Type | N-CSR |
| Amendment Flag | false |
| Registrant Name | BRIDGEWAY FUNDS INC |
| Entity Central Index Key | 0000916006 |
| Entity Investment Company Type | N-1A |
| Document Period End Date | Jun. 30, 2025 |
| C000012182 | |
| Shareholder Report [Line Items] | |
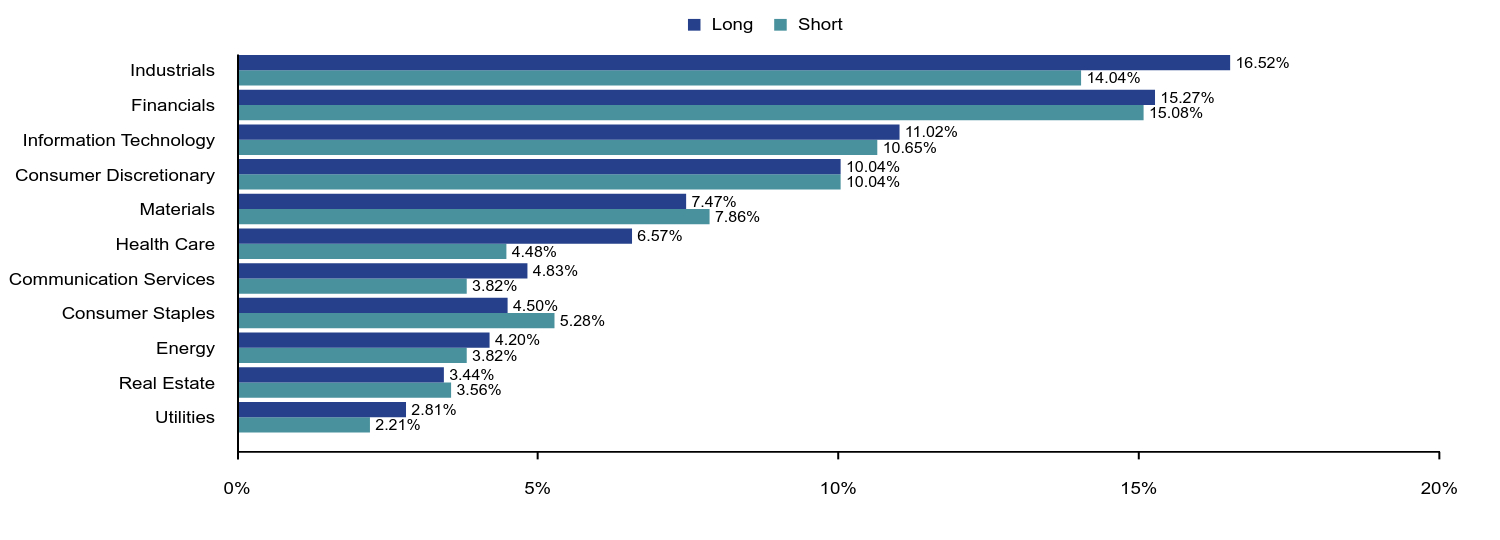
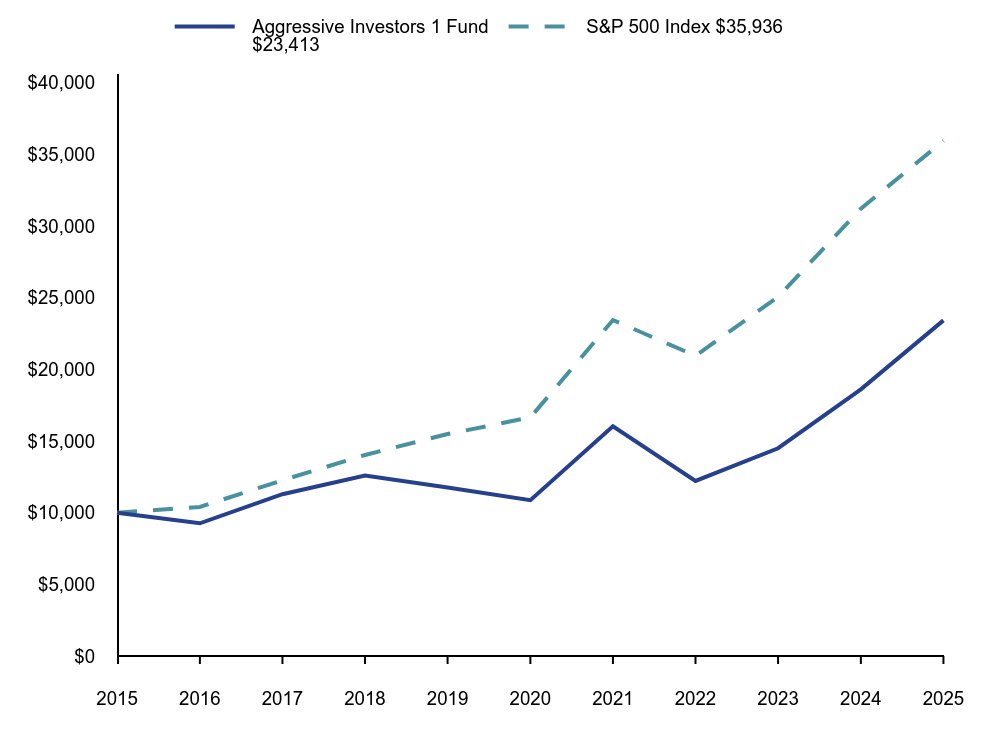
| Fund Name | Aggressive Investors 1 |
| Class Name | Aggressive Investors 1 |
| Trading Symbol | BRAGX |
| Annual or Semi-Annual Statement [Text Block] | This annual shareholder report contains important information about Bridgeway Aggressive Investors 1 Fund for the period of July 1, 2024 to June 30, 2025. |
| Shareholder Report Annual or Semi-Annual | Annual Shareholder Report |
| Additional Information [Text Block] | You can find additional information about the Fund at www.bridgewayfunds.com/resources/fund-documents. You can also request this information by contacting us at 800-661-3550. |
| Additional Information Phone Number | 800-661-3550 |
| Additional Information Website | <span style="box-sizing: border-box; color: rgb(0, 0, 0); display: inline; flex-wrap: nowrap; font-size: 10.6667px; font-weight: 400; grid-area: auto; line-height: 12.8px; margin: 0px; overflow: visible; text-align: left; text-align-last: auto; white-space-collapse: preserve-breaks;">www.bridgewayfunds.com/resources/fund-documents</span> |
| Expenses [Text Block] | |
| Expenses Paid, Amount | $ 97 |
| Expense Ratio, Percent | 0.86% |
| Factors Affecting Performance [Text Block] | |
| Performance Past Does Not Indicate Future [Text] | Performance data represents past performance and does not predict or guarantee future results. |
| Line Graph [Table Text Block] | |
| Average Annual Return [Table Text Block] | |
| No Deduction of Taxes [Text Block] | The table and graph presented above do not reflect the deduction of taxes a shareholder would pay on fund distributions or the redemption of fund shares. |
| AssetsNet | $ 210,787,715 |
| Holdings Count | Holding | 102 |
| Advisory Fees Paid, Amount | $ 1,163,706 |
| InvestmentCompanyPortfolioTurnover | 61.00% |
| Additional Fund Statistics [Text Block] | |
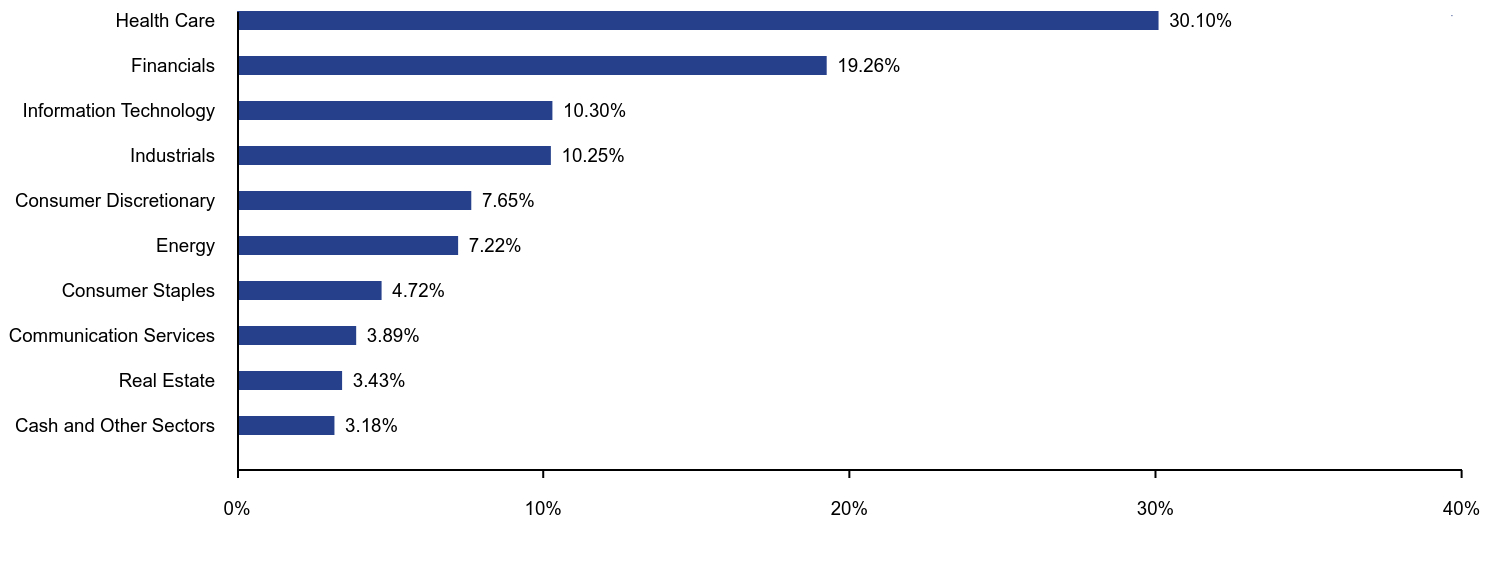
| Holdings [Text Block] | |
| Largest Holdings [Text Block] | |
| Material Fund Change [Text Block] | |
| Updated Prospectus Phone Number | 800-661-3550 |
| Updated Prospectus Email Address | <span style="box-sizing: border-box; color: rgb(0, 0, 0); display: inline; flex-wrap: nowrap; font-size: 10.6667px; font-weight: 400; grid-area: auto; line-height: 12.8px; margin: 0px; overflow: visible; text-align: left; text-align-last: auto; white-space-collapse: preserve-breaks;">funds@bridgeway.com</span> |
| Updated Prospectus Web Address | <span style="box-sizing: border-box; color: rgb(0, 0, 0); display: inline; flex-wrap: nowrap; font-size: 10.6667px; font-weight: 400; grid-area: auto; line-height: 12.8px; margin: 0px; overflow: visible; text-align: left; text-align-last: auto; white-space-collapse: preserve-breaks;">www.bridgewayfunds.com</span> |
| C000012186 | |
| Shareholder Report [Line Items] | |
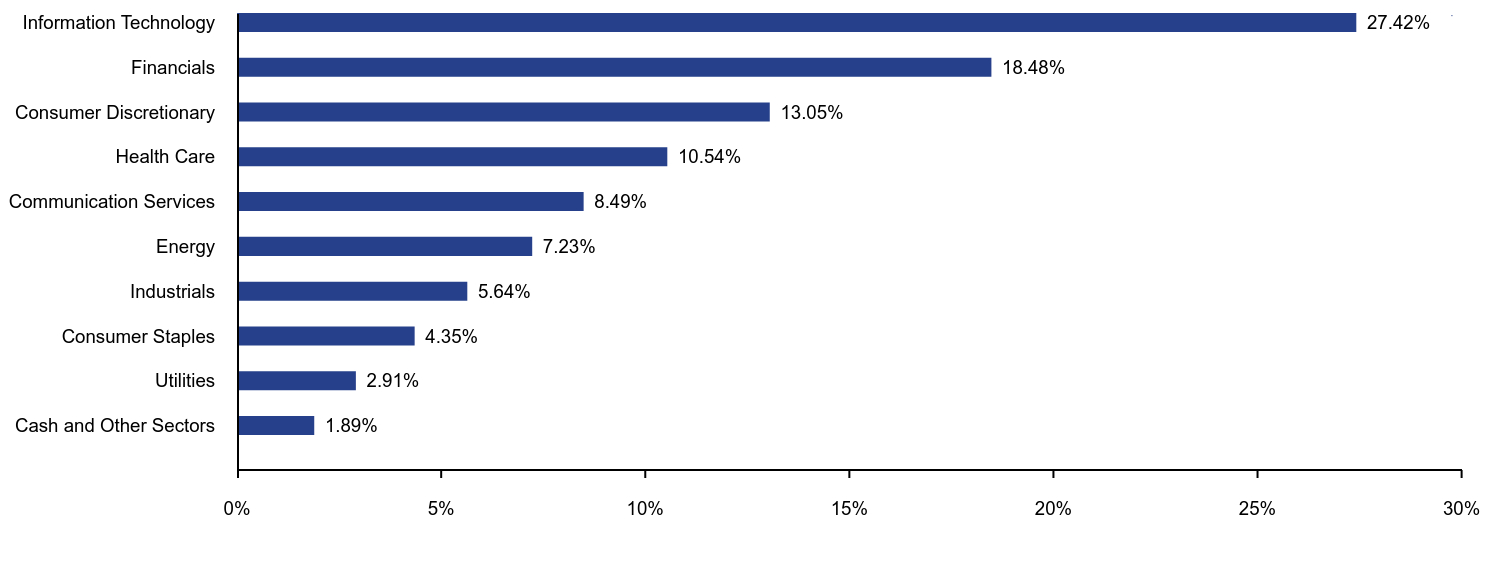
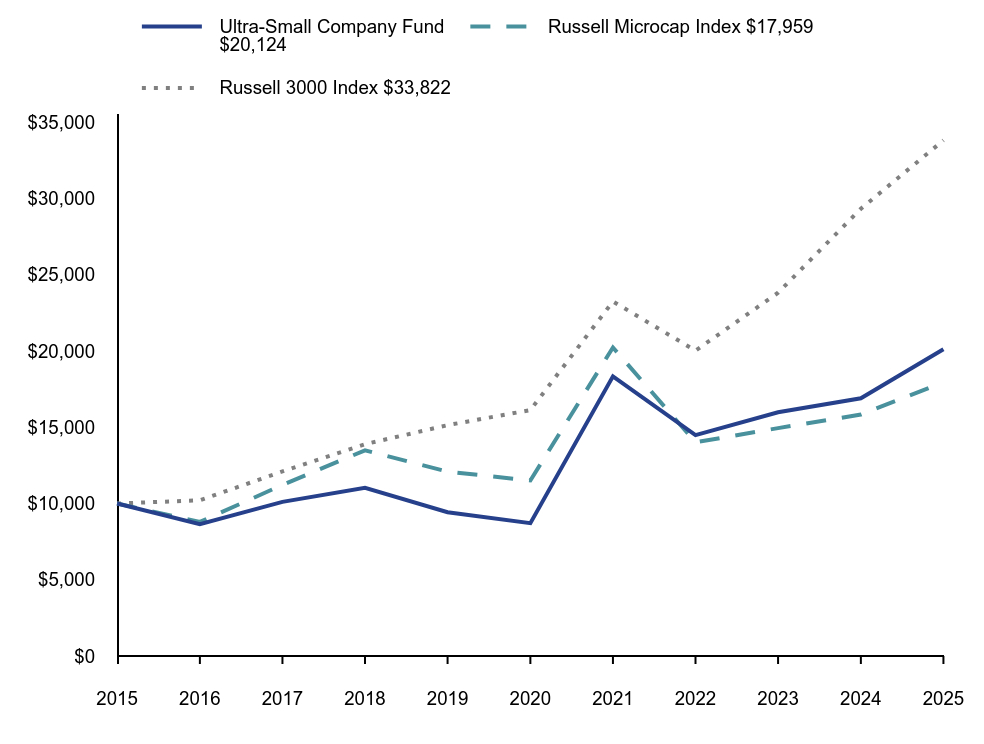
| Fund Name | Ultra-Small Company |
| Class Name | Ultra-Small Company |
| Trading Symbol | BRUSX |
| Annual or Semi-Annual Statement [Text Block] | This annual shareholder report contains important information about Bridgeway Ultra-Small Company Fund for the period of July 1, 2024 to June 30, 2025. |
| Shareholder Report Annual or Semi-Annual | Annual Shareholder Report |
| Additional Information [Text Block] | You can find additional information about the Fund at www.bridgewayfunds.com/resources/fund-documents. You can also request this information by contacting us at 800-661-3550. |
| Additional Information Phone Number | 800-661-3550 |
| Additional Information Website | <span style="box-sizing: border-box; color: rgb(0, 0, 0); display: inline; flex-wrap: nowrap; font-size: 10.6667px; font-weight: 400; grid-area: auto; line-height: 12.8px; margin: 0px; overflow: visible; text-align: left; text-align-last: auto; white-space-collapse: preserve-breaks;">www.bridgewayfunds.com/resources/fund-documents</span> |
| Expenses [Text Block] | |
| Expenses Paid, Amount | $ 133 |
| Expense Ratio, Percent | 1.21% |
| Factors Affecting Performance [Text Block] | |
| Performance Past Does Not Indicate Future [Text] | Performance data represents past performance and does not predict or guarantee future results. |
| Line Graph [Table Text Block] | |
| Average Annual Return [Table Text Block] | |
| No Deduction of Taxes [Text Block] | The table and graph presented above do not reflect the deduction of taxes a shareholder would pay on fund distributions or the redemption of fund shares. |
| AssetsNet | $ 86,550,861 |
| Holdings Count | Holding | 204 |
| Advisory Fees Paid, Amount | $ 762,396 |
| InvestmentCompanyPortfolioTurnover | 65.00% |
| Additional Fund Statistics [Text Block] | |
| Holdings [Text Block] | |
| Largest Holdings [Text Block] | |
| Material Fund Change [Text Block] | |
| Updated Prospectus Phone Number | 800-661-3550 |
| Updated Prospectus Email Address | <span style="box-sizing: border-box; color: rgb(0, 0, 0); display: inline; flex-wrap: nowrap; font-size: 10.6667px; font-weight: 400; grid-area: auto; line-height: 12.8px; margin: 0px; overflow: visible; text-align: left; text-align-last: auto; white-space-collapse: preserve-breaks;">funds@bridgeway.com</span> |
| Updated Prospectus Web Address | <span style="box-sizing: border-box; color: rgb(0, 0, 0); display: inline; flex-wrap: nowrap; font-size: 10.6667px; font-weight: 400; grid-area: auto; line-height: 12.8px; margin: 0px; overflow: visible; text-align: left; text-align-last: auto; white-space-collapse: preserve-breaks;">www.bridgewayfunds.com</span> |
| C000012187 | |
| Shareholder Report [Line Items] | |
| Fund Name | Ultra-Small Company Market |
| Class Name | Ultra-Small Company Market |
| Trading Symbol | BRSIX |
| Annual or Semi-Annual Statement [Text Block] | This annual shareholder report contains important information about Bridgeway Ultra-Small Company Market Fund for the period of July 1, 2024 to June 30, 2025. |
| Shareholder Report Annual or Semi-Annual | Annual Shareholder Report |
| Additional Information [Text Block] | You can find additional information about the Fund at www.bridgewayfunds.com/resources/fund-documents. You can also request this information by contacting us at 800-661-3550. |
| Additional Information Phone Number | 800-661-3550 |
| Additional Information Website | <span style="box-sizing: border-box; color: rgb(0, 0, 0); display: inline; flex-wrap: nowrap; font-size: 10.6667px; font-weight: 400; grid-area: auto; line-height: 12.8px; margin: 0px; overflow: visible; text-align: left; text-align-last: auto; white-space-collapse: preserve-breaks;">www.bridgewayfunds.com/resources/fund-documents</span> |
| Expenses [Text Block] | |
| Expenses Paid, Amount | $ 80 |
| Expense Ratio, Percent | 0.75% |
| Factors Affecting Performance [Text Block] | |
| Performance Past Does Not Indicate Future [Text] | Performance data represents past performance and does not predict or guarantee future results. |
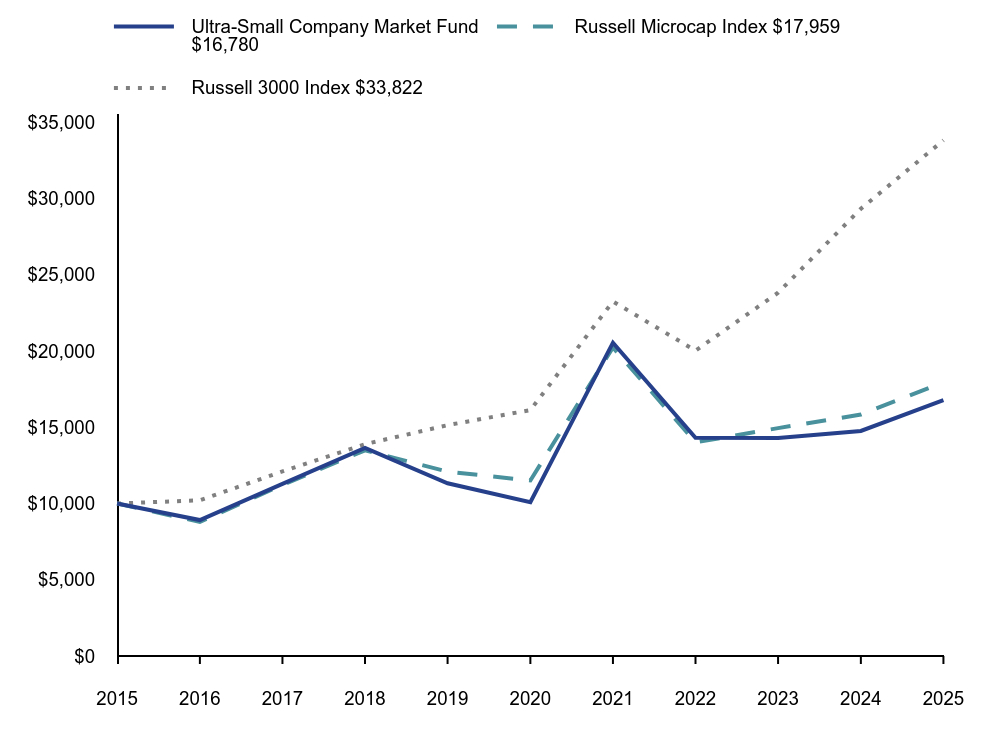
| Line Graph [Table Text Block] | |
| Average Annual Return [Table Text Block] | |
| No Deduction of Taxes [Text Block] | The table and graph presented above do not reflect the deduction of taxes a shareholder would pay on fund distributions or the redemption of fund shares. |
| AssetsNet | $ 106,494,751 |
| Holdings Count | Holding | 511 |
| Advisory Fees Paid, Amount | $ 632,605 |
| InvestmentCompanyPortfolioTurnover | 39.00% |
| Additional Fund Statistics [Text Block] | |
| Holdings [Text Block] | |
| Largest Holdings [Text Block] | |
| Material Fund Change [Text Block] | |
| Updated Prospectus Phone Number | 800-661-3550 |
| Updated Prospectus Email Address | <span style="box-sizing: border-box; color: rgb(0, 0, 0); display: inline; flex-wrap: nowrap; font-size: 10.6667px; font-weight: 400; grid-area: auto; line-height: 12.8px; margin: 0px; overflow: visible; text-align: left; text-align-last: auto; white-space-collapse: preserve-breaks;">funds@bridgeway.com</span> |
| Updated Prospectus Web Address | <span style="box-sizing: border-box; color: rgb(0, 0, 0); display: inline; flex-wrap: nowrap; font-size: 10.6667px; font-weight: 400; grid-area: auto; line-height: 12.8px; margin: 0px; overflow: visible; text-align: left; text-align-last: auto; white-space-collapse: preserve-breaks;">www.bridgewayfunds.com</span> |
| C000012190 | |
| Shareholder Report [Line Items] | |
| Fund Name | Small-Cap Value |
| Class Name | Small-Cap Value |
| Trading Symbol | BRSVX |
| Annual or Semi-Annual Statement [Text Block] | This annual shareholder report contains important information about Bridgeway Small-Cap Value Fund for the period of July 1, 2024 to June 30, 2025. |
| Shareholder Report Annual or Semi-Annual | Annual Shareholder Report |
| Additional Information [Text Block] | You can find additional information about the Fund at www.bridgewayfunds.com/resources/fund-documents. You can also request this information by contacting us at 800-661-3550. |
| Additional Information Phone Number | 800-661-3550 |
| Additional Information Website | <span style="box-sizing: border-box; color: rgb(0, 0, 0); display: inline; flex-wrap: nowrap; font-size: 10.6667px; font-weight: 400; grid-area: auto; line-height: 12.8px; margin: 0px; overflow: visible; text-align: left; text-align-last: auto; white-space-collapse: preserve-breaks;">www.bridgewayfunds.com/resources/fund-documents</span> |
| Expenses [Text Block] | |
| Expenses Paid, Amount | $ 90 |
| Expense Ratio, Percent | 0.90% |
| Factors Affecting Performance [Text Block] | |
| Performance Past Does Not Indicate Future [Text] | Performance data represents past performance and does not predict or guarantee future results. |
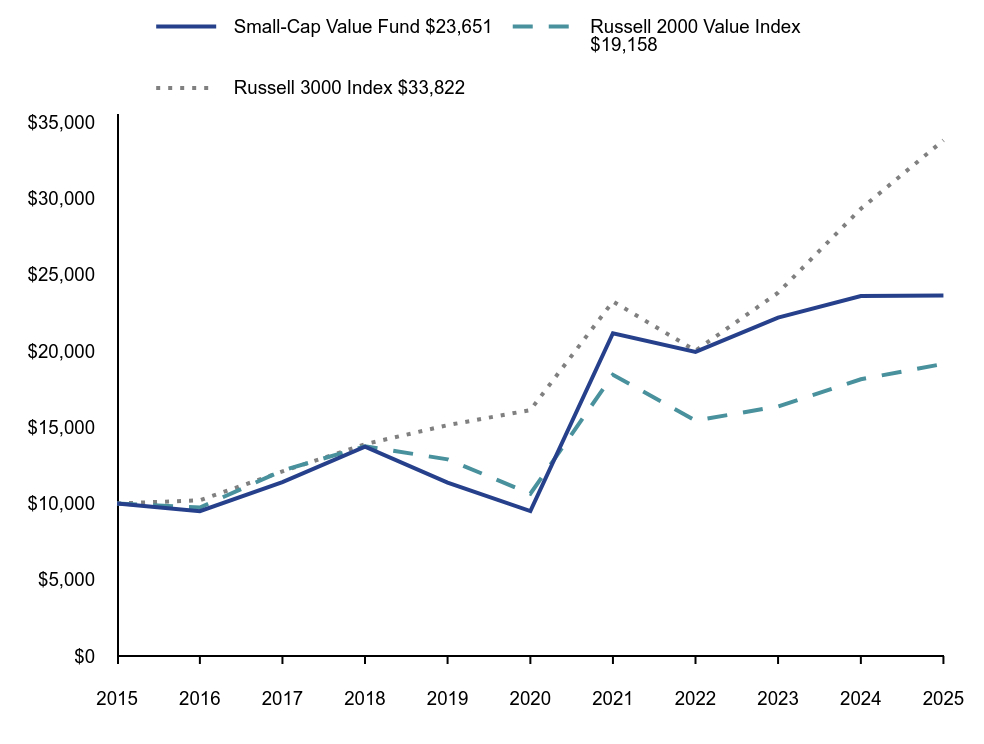
| Line Graph [Table Text Block] | |
| Average Annual Return [Table Text Block] | |
| No Deduction of Taxes [Text Block] | The table and graph presented above do not reflect the deduction of taxes a shareholder would pay on fund distributions or the redemption of fund shares. |
| AssetsNet | $ 352,177,272 |
| Holdings Count | Holding | 140 |
| Advisory Fees Paid, Amount | $ 2,896,114 |
| InvestmentCompanyPortfolioTurnover | 63.00% |
| Additional Fund Statistics [Text Block] | |
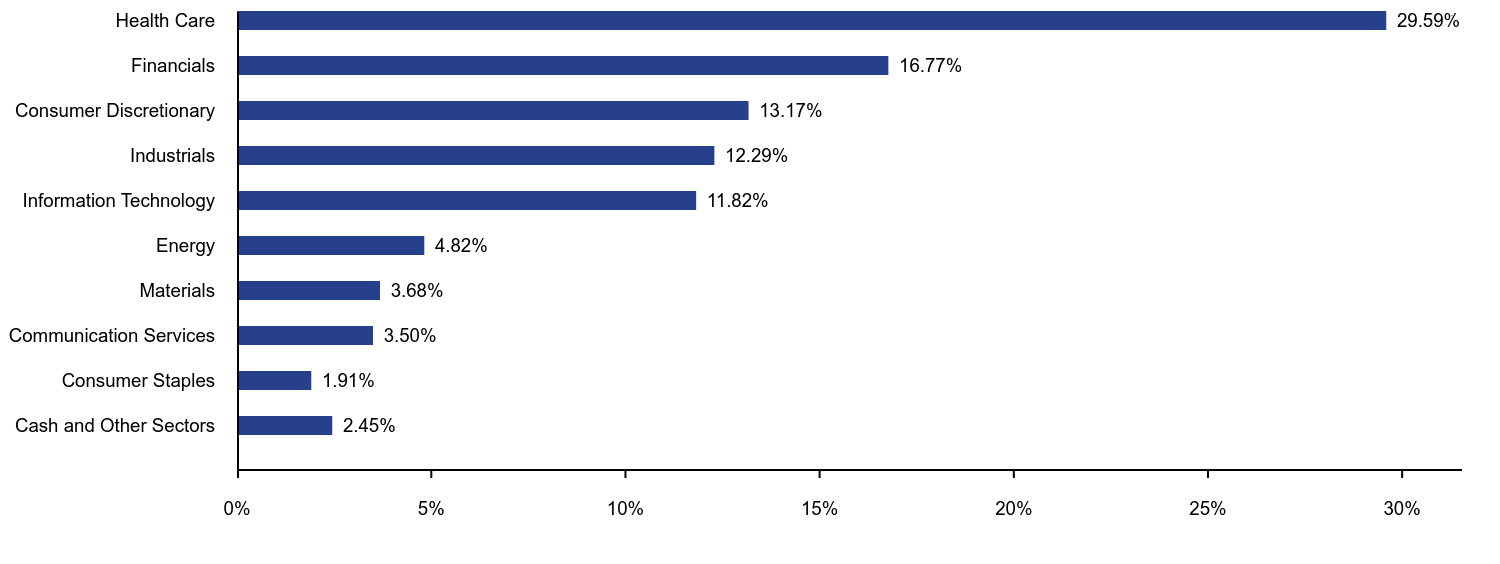
| Holdings [Text Block] | |
| Largest Holdings [Text Block] | |
| Material Fund Change [Text Block] | |
| Updated Prospectus Phone Number | 800-661-3550 |
| Updated Prospectus Email Address | <span style="box-sizing: border-box; color: rgb(0, 0, 0); display: inline; flex-wrap: nowrap; font-size: 10.6667px; font-weight: 400; grid-area: auto; line-height: 12.8px; margin: 0px; overflow: visible; text-align: left; text-align-last: auto; white-space-collapse: preserve-breaks;">funds@bridgeway.com</span> |
| Updated Prospectus Web Address | <span style="box-sizing: border-box; color: rgb(0, 0, 0); display: inline; flex-wrap: nowrap; font-size: 10.6667px; font-weight: 400; grid-area: auto; line-height: 12.8px; margin: 0px; overflow: visible; text-align: left; text-align-last: auto; white-space-collapse: preserve-breaks;">www.bridgewayfunds.com</span> |
| C000103073 | |
| Shareholder Report [Line Items] | |
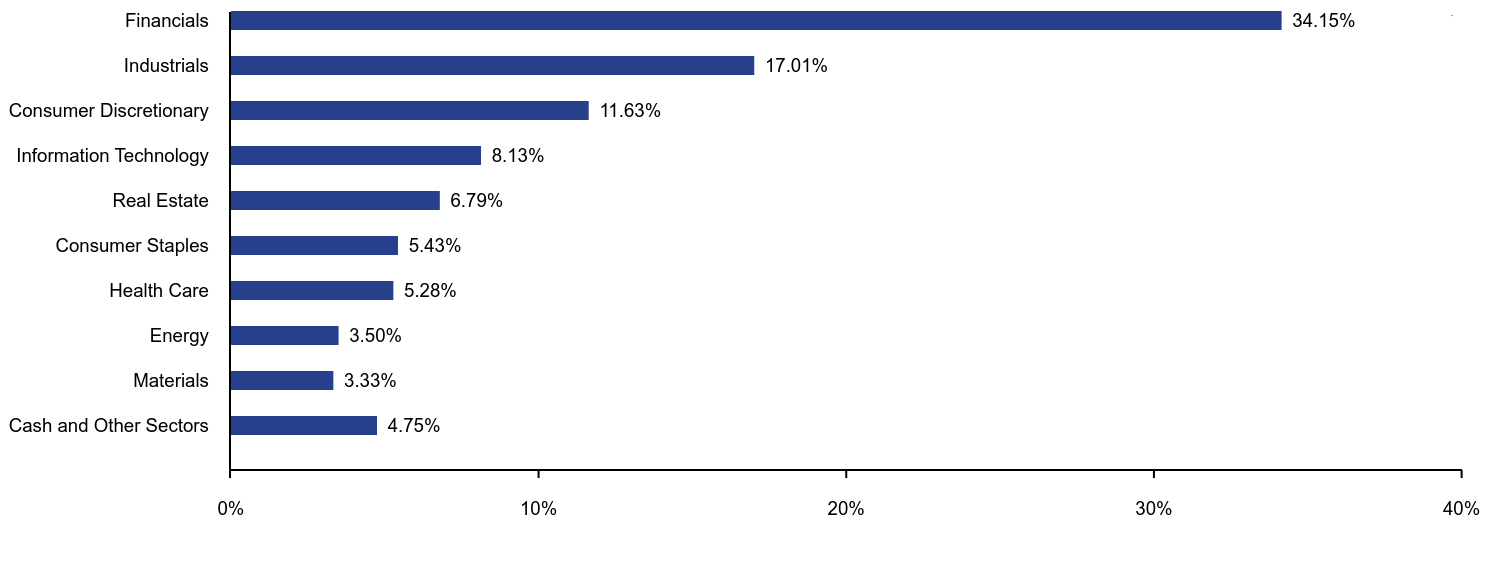
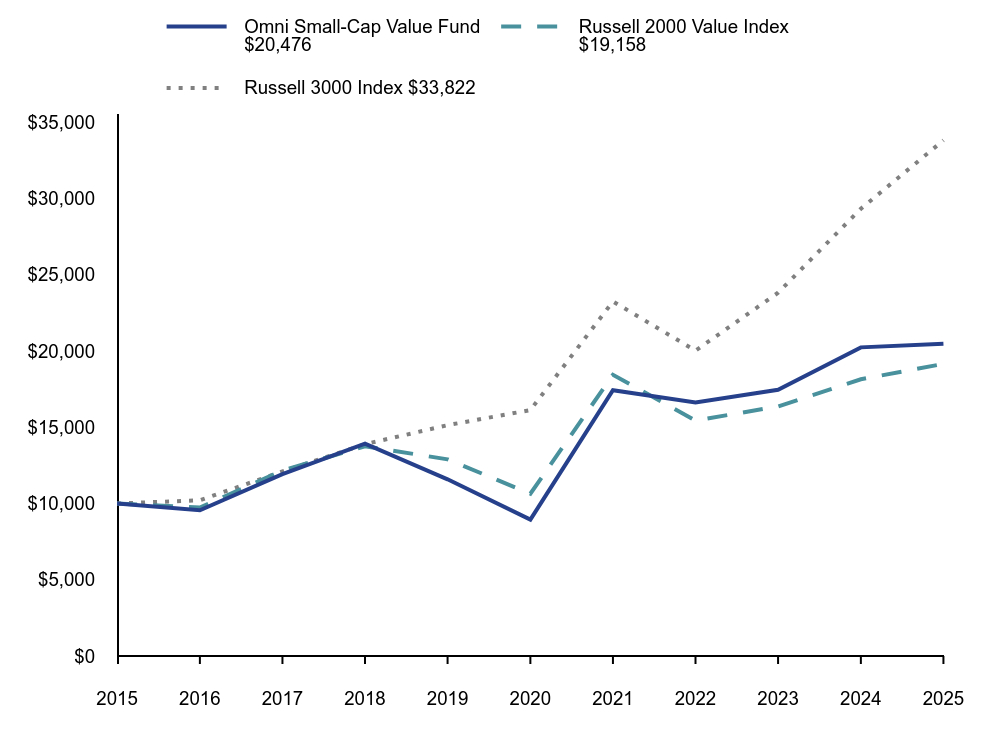
| Fund Name | Omni Small-Cap Value |
| Class Name | Omni Small-Cap Value |
| Trading Symbol | BOSVX |
| Annual or Semi-Annual Statement [Text Block] | This annual shareholder report contains important information about Bridgeway Omni Small-Cap Value Fund for the period of July 1, 2024 to June 30, 2025. |
| Shareholder Report Annual or Semi-Annual | Annual Shareholder Report |
| Additional Information [Text Block] | You can find additional information about the Fund at www.bridgewayfunds.com/resources/fund-documents. You can also request this information by contacting us at 800-661-3550. |
| Additional Information Phone Number | 800-661-3550 |
| Additional Information Website | <span style="box-sizing: border-box; color: rgb(0, 0, 0); display: inline; flex-wrap: nowrap; font-size: 10.6667px; font-weight: 400; grid-area: auto; line-height: 12.8px; margin: 0px; overflow: visible; text-align: left; text-align-last: auto; white-space-collapse: preserve-breaks;">www.bridgewayfunds.com/resources/fund-documents</span> |
| Expenses [Text Block] | |
| Expenses Paid, Amount | $ 47 |
| Expense Ratio, Percent | 0.47% |
| Factors Affecting Performance [Text Block] | |
| Performance Past Does Not Indicate Future [Text] | Performance data represents past performance and does not predict or guarantee future results. |
| Line Graph [Table Text Block] | |
| Average Annual Return [Table Text Block] | |
| No Deduction of Taxes [Text Block] | The table and graph presented above do not reflect the deduction of taxes a shareholder would pay on fund distributions or the redemption of fund shares. |
| AssetsNet | $ 1,073,427,049 |
| Holdings Count | Holding | 602 |
| Advisory Fees Paid, Amount | $ 3,295,629 |
| InvestmentCompanyPortfolioTurnover | 31.00% |
| Additional Fund Statistics [Text Block] | |
| Holdings [Text Block] | |
| Largest Holdings [Text Block] | |
| Material Fund Change [Text Block] | |
| Updated Prospectus Phone Number | 800-661-3550 |
| Updated Prospectus Email Address | <span style="box-sizing: border-box; color: rgb(0, 0, 0); display: inline; flex-wrap: nowrap; font-size: 10.6667px; font-weight: 400; grid-area: auto; line-height: 12.8px; margin: 0px; overflow: visible; text-align: left; text-align-last: auto; white-space-collapse: preserve-breaks;">funds@bridgeway.com</span> |
| Updated Prospectus Web Address | <span style="box-sizing: border-box; color: rgb(0, 0, 0); display: inline; flex-wrap: nowrap; font-size: 10.6667px; font-weight: 400; grid-area: auto; line-height: 12.8px; margin: 0px; overflow: visible; text-align: left; text-align-last: auto; white-space-collapse: preserve-breaks;">www.bridgewayfunds.com</span> |
| C000254224 | |
| Shareholder Report [Line Items] | |
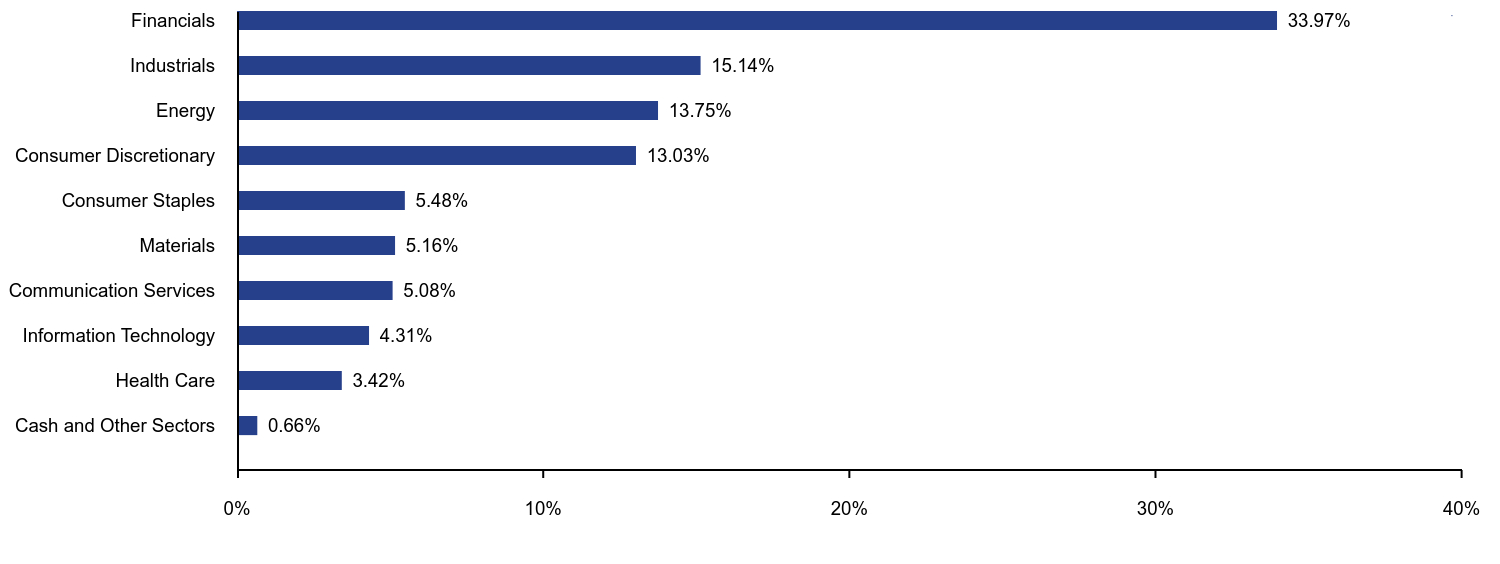
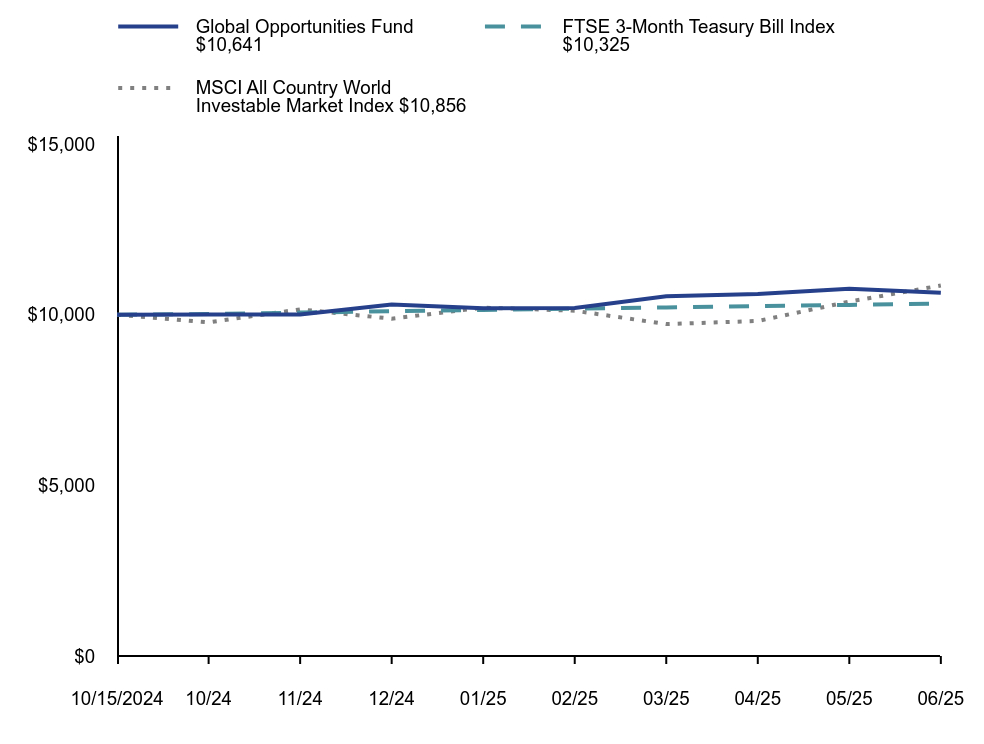
| Fund Name | Global Opportunities Fund |
| Class Name | Global Opportunities |
| Trading Symbol | BRGOX |
| Annual or Semi-Annual Statement [Text Block] | This annual shareholder report contains important information about Bridgeway Global Opportunities Fund for the period of October 15, 2024 to June 30, 2025. |
| Shareholder Report Annual or Semi-Annual | Annual Shareholder Report |
| Additional Information [Text Block] | You can find additional information about the Fund at www.bridgewayfunds.com/resources/fund-documents. You can also request this information by contacting us at 800-661-3550. |
| Additional Information Phone Number | 800-661-3550 |
| Additional Information Website | <span style="box-sizing: border-box; color: rgb(0, 0, 0); display: inline; flex-wrap: nowrap; font-size: 10.6667px; font-weight: 400; grid-area: auto; line-height: 12.8px; margin: 0px; overflow: visible; text-align: left; text-align-last: auto; white-space-collapse: preserve-breaks;">www.bridgewayfunds.com/resources/fund-documents</span> |
| Expenses [Text Block] | |
| Expenses Paid, Amount | $ 109 |
| Expense Ratio, Percent | 1.50% |
| Factors Affecting Performance [Text Block] | |
| Performance Past Does Not Indicate Future [Text] | Performance data represents past performance and does not predict or guarantee future results. |
| Line Graph [Table Text Block] | |
| Average Annual Return [Table Text Block] | |
| AssetsNet | $ 31,580,582 |
| Advisory Fees Paid, Amount | $ 60,386 |
| Additional Fund Statistics [Text Block] | |
| Holdings [Text Block] | |
| Material Fund Change [Text Block] | |
| Updated Prospectus Phone Number | 800-661-3550 |
| Updated Prospectus Email Address | <span style="box-sizing: border-box; color: rgb(0, 0, 0); display: inline; flex-wrap: nowrap; font-size: 10.6667px; font-weight: 400; grid-area: auto; line-height: 12.8px; margin: 0px; overflow: visible; text-align: left; text-align-last: auto; white-space-collapse: preserve-breaks;">funds@bridgeway.com</span> |
| Updated Prospectus Web Address | <span style="box-sizing: border-box; color: rgb(0, 0, 0); display: inline; flex-wrap: nowrap; font-size: 10.6667px; font-weight: 400; grid-area: auto; line-height: 12.8px; margin: 0px; overflow: visible; text-align: left; text-align-last: auto; white-space-collapse: preserve-breaks;">www.bridgewayfunds.com</span> |